The increasing need for red blood cells (RBCs) together with the lack of donors have made the in vitro production of RBCs a major medical challenge.1 We have recently developed a method to produce mature RBCs in vitro, starting from bone marrow, peripheral blood, leukapheresis or cord blood-derived CD34+ cells. This method is based on a 3-step protocol using a serum-free medium supplemented with cytokines.2 Here, we assess the quality of the RBCs produced in vitro using metabolomics, developed recently for RBC or reticulocytes analysis.3,4 We show that native reticulocytes (nRets) and culture-derived reticulocytes (cRets) exhibit very similar metabolomics signatures, 80% of their metabolites being expressed at similar levels. The homology is almost complete (90% of metabolites expressed at similar levels) when they are compared with RBCs produced from nRets and from cRets. Furthermore, the differentially expressed metabolites are not involved in relevant functions of RBCs. Altogether, these results show that RBCs originating from in vitro produced reticulocytes phenocopy native RBCs, and therefore show great promise for their successful use in blood transfusion.
Human cord blood CD34+ cells were differentiated into erythroid progenitors that were then grown on a murine MS-5 stromal cell line which provides a microenvironment allowing terminal erythroid differentiation, including enucleation (Online Supplementary Figure S1).2 At day 15, the majority of the cells produced were reticulocytes as assessed by thiazole orange staining (89%±10%) and by expression of the transferrin receptor (89%±10% CD71+). The mean cell volume (MCV), mean corpuscular hemoglobin concentration (MCHC) and mean cell hemoglobin (MCH) of these cells were within the ranges we have been observing in the laboratory: 128±11.4 fL (130–138 fL), 22±0.2 g/dL (18–25 g/dL) and 29±2.8 pg (23–35 pg), respectively.2,5
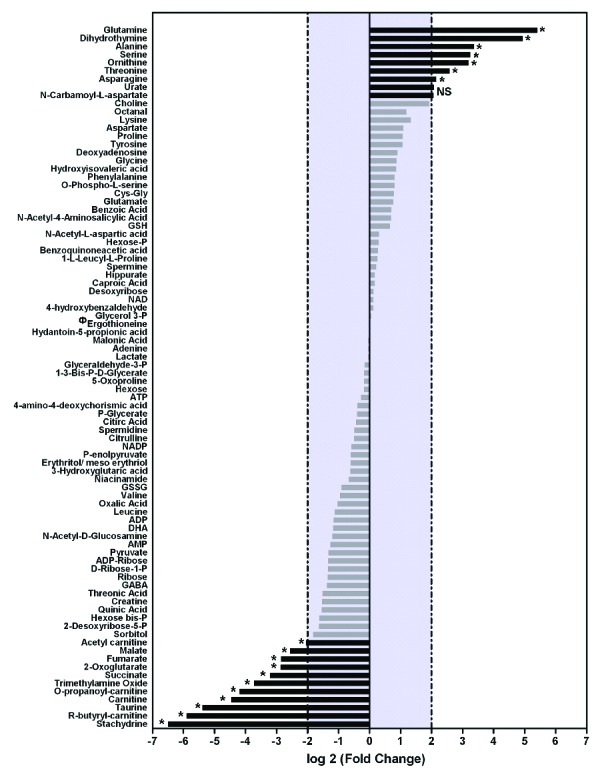
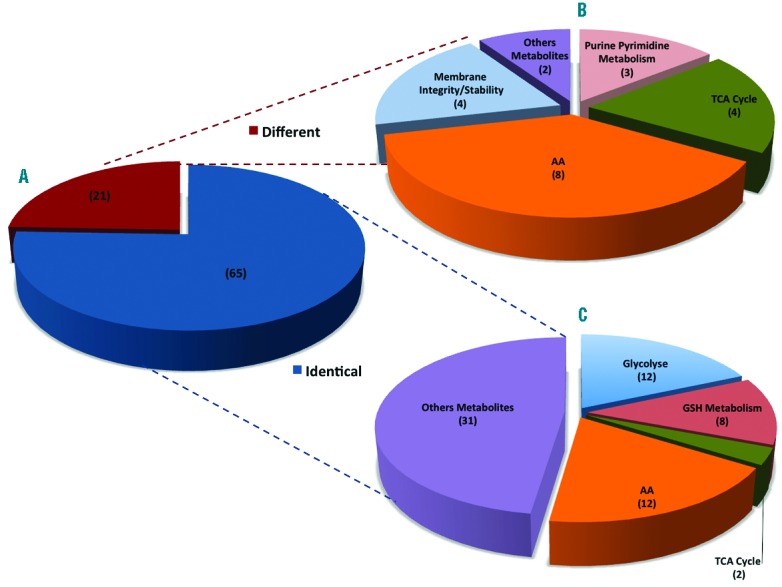
As culture conditions may lead to metabolic stresses that could alter RBC functionality, we first compared the metabolomes of cRets and nRets. nRets were purified from cord blood by supermagnetic microbead selection using a CD71 antibody6 and were more than 96±2% (n=5) pure. Reticulocyte metabolites were analyzed using two liquid chromatographic (LC) systems coupled to high resolution mass spectrometry operated in both negative and positive modes of electrospray ionization.3,7 The wide chemical diversity of metabolites is best assessed by this optimal metabolomic approach that can detect highly polar metabolites such as sugar derivatives or amino acids using hydrophilic interaction LC, as well as fatty acids or acylcarnitines using reverse phase chromatography. Eighty-six metabolites of biological relevance were identified (Online Supplementary Table S1) and analyzed in nRets and cRets. We found that the concentration of metabolites related to glycolysis or glutathione metabolism, two important pathways of RBCs functions, were similar in the two types of reticulocytes (Figures 1 and 2). Twenty-one metabolites displayed at least a 2-fold increase or decrease in concentration in cRets compared to nRets (Figure 1). Among the metabolites with increased concentration in cRets, 6 out of 10 were amino acids (glutamine, alanine, serine, ornithine, threonine and asparagine) (Figure 1). The increased concentration of these amino acids in the cRets is likely to be due to their high concentration in the culture media used and to the presence of their transporters at the surface of reticulocytes.8 Metabolites related to membrane integrity (carnitine, O-propanoyl-carnitine, acetyl-carnitine and R-butyryl-carnitine) were all derived from carnitine and had a decreased concentration in cRets (Figures 1 and 2). RBCs from sickle cell patients9 and from patients with overhydrated stomatocytosis10 also have increased concentrations of carnitine and acetyl-carnitine. These increased concentrations are associated with high membrane turnover and repair mechanisms as carnitine and acetyl-carnitine are used as a reservoir of activated acyl group for the turnover and the repair of RBC membrane.11 Thus, our results may indicate that in vitro differentiated reticulocytes exhibit a lower membrane turnover and repair than circulating reticulocytes, possibly because membrane stress may be lower in static conditions. We also found a decreased concentration of malate, 2-oxoglutarate and succinate, that are part of the Krebs cycle that takes place in mitochondria, that are still present in young reticulocytes.12 These decreased concentrations might be the consequence of a high glucose concentration in the culture media, driving efficient ATP synthesis through glycolysis rather than the Krebs cycle in cRets compared to nRets. Finally, the 2 metabolites that have the most decreased cRets concentration are ergothioneine and stachydrine (proline betaine) that share the same transporter13 and that are not present (ergothioneine) or present at very low levels (stachydrine) in culture medium. Ergothioneine is not synthesized by human cells but by actinobacteriae or filamentous fungi.14 Its presence in nRets from cord blood is the likely consequence of ergothioneine intake by the mother and transfer to nRets where ergothioneine fuels a very efficient anti-oxidative pathway.15
Figure 1.

Metabolic signatures of cRets and nRets are similar. Metabolomes of cRets from blood from 4 independent umbilical cords and nRets from 5 independent umbilical cords were analyzed by LC/MS followed by identification in the metabolite database.5 A diagram of high- and low-expressed metabolites is shown. cRets data are expressed as log2 fold relative to the average expression level in nRets for each metabolite. Metabolites expression was considered significantly different between cRets and nRets when log2R was above +2 or below −2 (black bars) and was considered identical when log2R was between +2 and −2 (gray bars). Statistical significance was assessed with a Mann-Whitney test: ns: not significant; *P≤ 0.05. ФThis value has been arbitrarily set at 0 (−∞ as a log20) for ease of display.
Figure 2.

Clustering of metabolites expressed in cRets and nRets. (A) Shown are metabolites in equal (blue) or different (red) amounts in cRets or nRets. (B) Expanded view of metabolites expressed at different levels in cRets and nRets, and ranked according to characteristics or function. (C) Expanded view of metabolites expressed at similar levels in cRets and nRets, and ranked according to characteristics or function.
nRets and cRets were further differentiated into mature nRBCs and cRBCs2 by extending co-culture for a further eight days. All parameters assessed in cRets established that the maturation process had clearly started at day 23 (Online Supplementary Table S2), as evidenced by the decrease in nucleic acids and mitochondria content, by lower CD71/CD36 (thrombospondin receptor) expression, and, to a lesser extent, by smaller MCV and increased MCH. Lastly, as expected, the membrane rigidity diminished during the cRets maturation (Online Supplementary Figure S2). A similar maturation pattern was demonstrated for nRets exhibiting a decrease in CD71 expression and nucleic acids and mitochondria contents (Online Supplementary Figure S3).
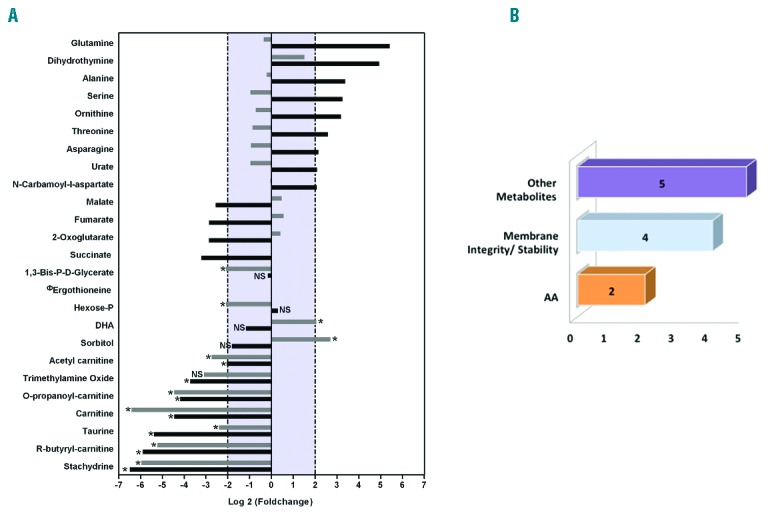
When the metabolomes of nRBCs and cRBCs were compared, most metabolites with increased cRets levels had returned to nRBCs levels in cRBCs (Figure 3). This was due to an increased concentration of the differential metabolites in nRBCs and was consistent with the culture medium origin of the increased concentration of these metabolites in cRets. As for the metabolites with decreased concentrations in cRets, only the carnitine and its metabolite derivatives and stachydrine/ergothioneine had a comparative decrease in concentration in cRBCs (Figure 3). These results strengthen the exogenous contribution of stachydrine/ergothioneine in nRBCs and indicate that in vitro produced cRBCs might have decreased membrane turnover and repair, possibly due to the less stressing conditions of cell culture, compared with blood circulation. An alternative hypothesis to account for the differences in metabolites is that they originate from inter-individual variations, since native reticulocytes and CD34+ cells from which cRets were differentiated were purified from separate cord bloods. However, covariance analysis established that for 7 out of the 11 metabolites, covariance was below the level of significance (25%–30%) (Online Supplementary Table S3), thus arguing against inter-individual differences. The differences of the remaining 4 metabolites may originate from inter-individual variations, or from technical issues. Thus out of 86 metabolites, upon differentiation only 7 seem to vary due to culture conditions, and 4 to sample origin, confirming that cRBCs nearly phenocopy nRBCs.
Figure 3.

Metabolic signatures of red blood cells obtained by maturation of cRets and nRets. (A) Diagram of high- and low-expression metabolites in cRBCs compared to nRBCs. Black bars correspond to log2R for metabolites expressed at different levels in cRets and nRets. Gray bars correspond to log2R for metabolites expressed at different levels in cRBCs and nRBCs. Statistical significance was assessed by Mann-Whitney test: NS: not significant; *P≤ 0.05. ФThis value has been arbitrarily set at 0 (−∞ as a log20) for ease of display. (B) Metabolites differentially expressed in cRBCs and nRBCs were clustered according to function (membrane integrity or stability) or characteristic (amino acids). The number of metabolites per cluster is indicated.
We have previously established the proof of principle for transfusion of in vitro generated reticulocytes and developed procedures to validate these bio-engineered cells. Here, using a metabolomics approach, we provide evidence that reticulocytes, either native or produced in vitro, exhibit similar metabolomic signatures. Almost identical metabolomic signatures were obtained after maturation into cRBCs. This result strengthens the robustness of the protocol we have developed to produce reticulocytes to be used for transfusion, an alternative to classical transfusion products, in the hope to circumvent donor scarcity in such cases as patients with very rare blood groups.
Acknowledgments
We thank Jean-Philippe Rosa for his help in writing and critically editing this manuscript, Alexandre Seye (Prophilomic) for his assistance in data analyses, Pierre Buffet for kindly putting his laboratory premises and the LORCA at our disposal.
Footnotes
The online version of this letter has a Supplementary Appendix.
Information on authorship, contributions, and financial & other disclosures was provided by the authors and is available with the online version of this article at www.haematologica.org.
References
- 1.Douay L, Andreu G. Ex vivo production of human red blood cells from hematopoietic stem cells: what is the future in transfusion? Transfus Med Rev. 2007;21(2):91–100. [DOI] [PubMed] [Google Scholar]
- 2.Giarratana MC, Kobari L, Lapillonne H, et al. Ex vivo generation of fully mature human red blood cells from hematopoietic stem cells. Nat Biotechnol. 2005;23(1):69–74. [DOI] [PubMed] [Google Scholar]
- 3.Darghouth D, Koehl B, Junot C, Romeo PH. Metabolomic analysis of normal and sickle cell erythrocytes. Transfus Clin Biol. 2010;17(3):148–150. [DOI] [PubMed] [Google Scholar]
- 4.Malleret B, Xu F, Mohandas N, et al. Significant biochemical, biophysical and metabolic diversity in circulating human cord blood reticulocytes. PLoS One. 2013;8(10):e76062. [DOI] [PMC free article] [PubMed] [Google Scholar]
- 5.Giarratana MC, Rouard H, Dumont A, et al. Proof of principle for transfusion of in vitro-generated red blood cells. Blood. 2011;118(19):5071–5079. [DOI] [PMC free article] [PubMed] [Google Scholar]
- 6.Brun A, Gaudernack G, Sandberg S. A new method for isolation of reticulocytes: positive selection of human reticulocytes by immunomagnetic separation. Blood. 1990;76(11):2397–2403. [PubMed] [Google Scholar]
- 7.Boudah S, Olivier MF, Aros-Calt S, et al. Annotation of the human serum metabolome by coupling three liquid chromatography methods to high-resolution mass spectrometry. J Chromatogr B Analyt Technol Biomed Life Sci. 2014;966:34–47. [DOI] [PubMed] [Google Scholar]
- 8.Benderoff S, Blostein R, Johnstone RM. Changes in amino acid transport during red cell maturation. Membr Biochem. 1978;1(1–2):89–106. [DOI] [PubMed] [Google Scholar]
- 9.Darghouth D, Koehl B, Madalinski G, et al. Pathophysiology of sickle cell disease is mirrored by the red blood cell metabolome. Blood. 2011;117(6):e57–66. [DOI] [PubMed] [Google Scholar]
- 10.Darghouth D, Koehl B, Heilier JF, et al. Alterations of red blood cell metabolome in overhydrated hereditary stomatocytosis. Haematologica. 2011;96(12):1861–1865. [DOI] [PMC free article] [PubMed] [Google Scholar]
- 11.Arduini A, Mancinelli G, Radatti GL, et al. Role of carnitine and carnitine palmitoyltransferase as integral components of the pathway for membrane phospholipid fatty acid turnover in intact human erythrocytes. J Biol Chem. 1992;267(18):12673–1281. [PubMed] [Google Scholar]
- 12.Ney PA. Normal and disordered reticulocyte maturation. Curr Opin Hematol. 2011;18(3):152–157. [DOI] [PMC free article] [PubMed] [Google Scholar]
- 13.Grundemann D, Harlfinger S, Golz S, et al. Discovery of the ergothioneine transporter. Proc Natl Acad Sci USA. 2005;102(14):5256–5261. [DOI] [PMC free article] [PubMed] [Google Scholar]
- 14.Genghof DS, Vandamme O. Biosynthesis of Ergothioneine and Hercynine by Mycobacteria. J Bacteriol. 1964;87:852–862. [DOI] [PMC free article] [PubMed] [Google Scholar]
- 15.Chaudiere J, Ferrari-Iliou R. Intracellular antioxidants: from chemical to biochemical mechanisms. Food Chem Toxicol. 1999;37(9–10):949–962. [DOI] [PubMed] [Google Scholar]


