

Summary
The weak oligomerization exhibited by many transmembrane receptors has a profound effect on signal transduction. The phenomenon is difficult to structurally characterize due to the large sizes of and transient interactions between monomers. The receptor for advanced glycation end products (RAGE), a signaling molecule central to the induction and perpetuation of inflammatory responses, is a weak constitutive oligomer. The RAGE domain interaction surfaces that mediate homo-dimerization were identified by combining segmental isotopic labeling of extracellular soluble RAGE (sRAGE) and NMR spectroscopy with chemical crosslinking and mass spectrometry. Molecular modeling suggests that two sRAGE monomers orient head-to-head forming an asymmetric dimer with the C-termini directed towards the cell membrane. Ligand-induced association of RAGE homo-dimers on the cell surface increases the molecular dimension of the receptor, recruiting Diaphanous 1 (DIAPH1) and activating signaling pathways.
Keywords: segmental labeling, NMR spectroscopy, mass spectrometry, hybrid method of structure determination, receptor for advanced glycation end products, RAGE, signal transduction, diaphanous 1, pattern recognition, inflammation, diabetes, cancer
Graphical abstract

Introduction
Oligomerization is common among cell surface receptors in resting as well as signal transduction active states and appears to be critical for receptor function(Metzger, 1992). Oligomerization is observed in such diverse families of receptors as immunoreceptors(Ramsland et al., 2011), T-cell receptors (Berry et al., 2011; Choudhuri et al., 2005), B-cell receptors (Schamel and Reth, 2000), growth factors (DiGabriele et al., 1998) and hormone receptors(Angers et al., 2002). Oligomerization is triggered by the intermolecular engagement of extracellular and/or intracellular domains. Expressed separately, extracellular domains are usually only weakly oligomeric and thus present a difficult target to structurally characterize.
A constitutive oligomer, the receptor for advanced glycation end-products (RAGE) is a member of the immunoglobulin (Ig) superfamily of cell surface receptors (Neeper et al., 1992; Schmidt et al., 1992; Xie et al., 2007). RAGE consists of three extracellular immunoglobulin domains, a V-type Ig domain (residues 23-119) and two C-type Ig domains (C1 and C2) (residues 120-233 and residues 234-325, respectively), a trans-membrane helix, and a short cytoplasmic tail (CT). RAGE signaling plays a central role in the inflammatory response, mediating aspects of immunity, acute and chronic inflammatory disorders, complications of diabetes, and certain cancers (Hofmann et al., 1999; Liliensiek et al., 2004; Medapati et al., 2015; Schmidt et al., 2001; Taguchi et al., 2000; van Zoelen et al., 2009). As a pattern recognition receptor(Xie et al., 2008), RAGE binds diverse families of ligands, including advanced glycation end products (AGEs) (Kislinger et al., 1999; Neeper et al., 1992; Xie et al., 2008; Xue et al., 2011), S100/calgranulins (Hofmann et al., 1999; Koch et al., 2010), High Mobility Group Box-1 (HMGB1)(Taguchi et al., 2000) proteins, amyloid-β peptides (Aβ), β-sheet fibrils (Yan et al., 1996), lysophosphatidic acid (Rai et al., 2012b), and phosphatidylserine (He et al., 2011). Ligand binding to extracellular RAGE domains is tightly coupled to the recruitment of Diaphanous 1 (DIAPH1) to the cytoplasmic domain and the generation of reactive oxygen species (ROS)(Bianchi et al., 2011; Hudson et al., 2008; Toure et al., 2012), which contribute to RAGE-dependent pathological processes, such as growth, migration, and secretion of inflammatory cytokines.
Structural studies of extracellular soluble RAGE (sRAGE), which consists of the V, C1 and C2 domains, revealed that the C-terminal C2 domain is structurally independent of the slightly bent, elongated structure of the joined V and C1 domains, which together form an integrated structural unit, the VC1 domain (Dattilo et al., 2007; Koch et al., 2010; Park et al., 2010; Yatime and Andersen, 2013). The oligomeric states of sRAGE, inferred from the crystal structures of isolated VC1(Koch et al., 2010),(Xu et al., 2013) and VC1C2 domains (Yatime and Andersen, 2013), are inconsistent with solution studies of sRAGE oligomers (Sarkany et al., 2011; Sitkiewicz et al., 2013). Studying the isolated domains can misrepresent sRAGE oligomerization because electrostatic forces between neutral sRAGE monomers, pI = 7.8, are vastly different from those between isolated positively-charged VC1 domains, pI = 9.9, and negatively-charged C2 domains, pI = 4.2.
We combined solution NMR spectroscopy of segmentally labeled sRAGE(Camarero et al., 2002; Dawson et al., 1994; Xue et al., 2012) with chemical crosslinking analyzed by mass spectrometry as a means to overcome the shortcomings of studying weakly associating oligomers. By incorporating limited experimental measurements, a reliable structural model was computed and a mechanism for signal transduction was proposed and examined by cellular activity studies of fluorescently labeled RAGE and its intracellular effector DIAPH1.
Results
Segmentally labeled, chemically ligated CL-sRAGE is functional
Segmentally labeling large multidomain proteins simplifies NMR spectra and avoids significant spectral overlap(Camarero et al., 2002; Cowburn et al., 2004; Xu et al., 1999). To facilitate structural studies of RAGE, we prepared chemically ligated sRAGE, CL-sRAGE, consisting of two segmentally labeled constructs, [U-15N, 2H]-VC1-C2 and VC1-[U-15N]-C2, by using intein based expressed protein chemical ligation (EPL)(Camarero et al., 2002) (Figure 1A).
Figure 1. CL-sRAGE, binds to its physiological ligand, Ca2+-S100B.

(A) The scheme of chemical ligation. A nucleophilic cysteine thiol group attacks the adjacent carboxyl group, undergoing an N-S shift and is cleaved by 2-mercaptoethane sulfonic acid (MESNA) on the VC1 domain. The C-terminal thioester group of VC1 is free to ligate with the N-terminal cysteine of the C2 domain, released by thrombin cleavage of the His-tag. The subsequent transthioesterfication and S-N acyl shift create a peptide bond. (B) The ligation site (red) consists of amino acids 233-236 in the linker, indicated by the bar above the sequence, between the VC1 and C2 domains that is not well conserved across various species. (C) The generation of chemically-ligated sRAGE is monitored through a time-course SDS-PAGE experiment. Lanes 1 and 8 are molecular weight markers. Lanes 2-6 are time points collected at 0 h, 1 h, 3 h, 5 h and overnight. Lane 7 shows chromatographically purified CL-sRAGE. (D) Enzyme-Linked Immunosorbent Assay (ELISA) of CL-sRAGE titrated with Ca2+-S100B protein. See also Figure S1.
The EPL reaction requires a C-terminal thioester group on VC1 and an N-terminal cysteine on the C2 domain (Camarero et al., 2002). The VC1 domain was overexpressed with a C-terminal Mxe GyrA intein (Mathys et al., 1999). MESNA, 2-mercapto-ethanesulfonic acid, was used to induce intein cleavage, which generated the desired reactive thioester group at the C-terminus of the VC1 domain. Mutations 233-VPLE to 233-GCSA were introduced into the linker region, 231-237 (Yatime and Andersen, 2013), between the VC1 and the C2 domains (Figure 1B). The V to G mutation reduces steric hindrance during trans-thioesterification and the S-N acyl shift, the PL to CS mutation creates a thrombin recognition sequence (Liu et al., 2008), to facilitate construction of the C2 domain for chemical ligation and the E to A mutation eliminates the negative charge from glutamate, improving the efficiency of the ligation reaction. Thrombin cleavage of C2 exposes N-terminal cysteine 234. Because the linker is not directly involved in sRAGE dimerization, the mutations should not affect sRAGE dynamics and quaternary structure.
The time-course of the EPL reaction was monitored by using SDS-PAGE and Western blots (Figure 1C and Figure S1). A new band at ~43 kDa, corresponding to CL-sRAGE gradually appeared and increased in intensity while the band intensities of both the VC1 and C2 domains at 25 kDa and 15 kDa decreased. The reaction product reached a maximum overnight. Mass spectrometric analysis of CL-sRAGE isolated from polyacrylamide gels (Figure S1), confirmed the authenticity of CL-sRAGE and the presence of the amino acid mutations at the ligation site.
To assess the activity of CL-sRAGE the binding affinity of a physiological ligand, Ca2+-S100B, was evaluated by using an indirect Enzyme-Linked Immunosorbent Assay (ELISA) (Figure 1D). The dissociation constant of the binding reaction was estimated to be 490 ± 43 nM, which is similar to the value of 500-1000 nM determined for Ca2+-S100B dimer binding to human sRAGE in vitro (Leclerc et al., 2009), suggesting that CL-sRAGE maintains a native fold and thus can serve as a model to study the structural biology of RAGE.
sRAGE dimerizes through both the VC1 and C2 domains
Chemical shifts and NMR peak intensities of backbone amide protons and nitrogens are exquisitely sensitive to the changes in chemical environment induced by intra- and inter-domain interactions (Cavanagh et al., 2007). The changes in the chemical shifts and NMR peak intensities can be used to identify the intermolecular interaction surfaces between domains and ambiguous distance constraints to generate a model of an sRAGE homo-dimer (de Vries et al., 2010). However, rapid spin-spin relaxation of amide protons in sRAGE dimers hampers NMR analysis and results in broadened signals (Dattilo et al., 2007; Xie et al., 2007). To extend the relaxation time, 2H was substituted for 1H in the VC1 domain to dramatically improve the spectral resolution of CL-sRAGE. Chemical shifts of 92 % of backbone amide protons and nitrogens of the VC1 and C2 domains were assigned using standard triple resonance NMR spectra (Cavanagh et al., 2007). Selective 15N labeling of alanine, serine, threonine, lysine, leucine, isoleucine, valine and phenyalanine, were used to assign overlapping residues in the NMR spectra. The solution structure of CL-sRAGE was then studied by separately monitoring two isotopic segmentally labeled domains, [U-15N, 2H]-VC1 and [U-15N]-C2, both free and in CL-sRAGE.
The 15N edited heteronuclear single quantum coherence, 15N-HSQC spectra of free and ligated [U- 2H, 15N]-VC1 domains exhibited substantial differences in chemical shifts and signal intensities due to ligation with the C2 domain and/or oligomerization of CL-sRAGE. sRAGE exhibits a monomer-dimer equilibrium with a dissociation constant of ~100 μM (Sarkany et al., 2011) and also forms higher order oligomers(Xie et al., 2007; Zong et al., 2010). CL-sRAGE spectra were collected at less than 100 μM where the dimer is the predominant oligomer. As a result, each peak in the NMR spectra represents the population average of primarily monomers and dimers in solution, but higher MW oligomers could contribute to changes observed in the chemical shifts and especially in the line shape of the NMR peaks.
Peaks from residues at the dimerization interface exhibit concentration dependent changes in both chemical shift and signal intensity (Figure 2A, insets). These residues were mapped onto the VC1 domain (Figure 2B and Figure S2A). Residues K110, Y113, R114 and R116 form a contiguous positively charged patch on the V domain and residues E125, D128, S131 and E132 form a negatively charged patch on the C1 domain (Figure 2B). Another patch is formed by residues L164, E168 and K169 in the C1 domain. Concentration independent chemical shift and intensity changes in residues G69, G66, G70, W72, S74, L164, K169, G170, V171, E182, F186, M193, V194 and G199, are induced by the ligation of VC1 and C2 domains (Figure 2A, Figure S2A).
Figure 2. All three domains are involved in sRAGE homo-dimerization.

(A) Overlay of the 15N-HSQC spectra of free [U- 2D, 15N]-VC1 domain (black) and the [U- 2D, 15N]-VC1 domain in CL-sRAGE (red). Y113 and G69 peaks from free [U- 2D, 15N]-VC1 domain (black) and the [U- 2D, 15N]-VC1 domain in CL-sRAGE at 50 uM (blue) and 80 uM (red) are overlaid in insets. The Y113 peaks exhibit concentration dependent chemical shift changes consistent with the involvement of this residue in CL-sRAGE dimerization whereas those of G69 do not. (B) Intermolecular interaction surfaces within the homo-dimer (red) are mapped onto the VC1 domain solution structure. (C) Overlay of the 15N-HSQC spectra of [U- 15N]-free C2 domain (black) and [U- 15N]-C2 domain in CL-sRAGE (red). S307 and S113 peaks from free [U- 15N]-C2 domain (black) and the [U- 15N]-C2 domain in CL-sRAGE at 40 uM (blue) and 80 uM (red) are overlaid in insets. The S307 peaks exhibit concentration dependent peak intensity changes consistent with the involvement of this residue in CL-sRAGE dimerization whereas those of S113 do not. Contour levels in the inserts spectra were normalized by a side chain peak at 8.5 and 111 ppm in proton and nitrogen dimensions, respectively, which exhibited minimal changes in both chemical shift and peak intensity. (D) Intermolecular interaction surface within the homo-dimer (red) is mapped onto the C2 domain solution structure. In (A) and (C), backbone assignments of the residues that exhibited significant changes in chemical shifts and/or peak intensities in CL-sRAGE are labeled. Assignments in bold correspond to residues that were either mutated or become unlabeled due to the molecular constructs used to create CL-sRAGE. See also Figure S2.
Substantial changes in chemical shifts and broadening of intensities are also observed between the free and chemically ligated [U- 15N]-C2 domain (Figure 2C, Figure S2B). Concentration dependent changes were mapped onto the molecular surface of the C2 domain (Figure 2C, insets and Figure 2D). A polar patch consisting of residues of Q268, T304, S306 and S307 contributes to the dimer structure of sRAGE. Residues that exhibit concentration independent changes in chemical shifts and peak intensities, T258, C259, E260, Y299, and S313, are induced by ligation and are likely unrelated to sRAGE dimerization (Figure 2C, Figure S2B).
Mass spectrometry provides distance constraints within the sRAGE dimer
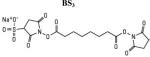
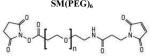
To build a reliable model of an sRAGE dimer, ambiguous constraints provided by NMR have to be supplemented by unambiguous distance constraints(de Vries et al., 2010). The combination of chemical cross-linking and mass spectrometric (MS) analysis provided unambiguous distance constraints for the sRAGE dimer. Three chemical cross-linkers, sulfosuccinimidyl 4-(N-maleimidomethyl)cyclohexane-1-carboxylate, Sulfo-SMCC, bis-sulfosuccinimidyl suberate, BS3, and succinimidyl-[(N-maleimidopropionamido)-hexaethyleneglycol] ester, SM(PEG)6, which span distances of 8.3 Å, 11.4 Å and 32.5 Å, respectively, were used to probe the architecture of sRAGE.
To minimize artifacts, limiting concentrations of cross-linkers were used resulting in a low (less than 5%) yield of cross-linked products. The shortest probe, Sulfo-SMCC, which produces specific amine-to-sulfhydryl conjugates, failed to cross-link sRAGE, thereby placing a lower limit (i.e., 8.3 Å) on the distance constraints. The sRAGE monomer is elongated, highly positively-charged at the V domain and negatively-charged at the C2 domain, and migrates like a 45 kDa protein, which is higher than its MW of 33 kDa. Multiple bands at ~90 kDa, ~125 kDa, and ~200 kDa appear on SDS-PAGE within 30 minutes of initiating a cross-linking reaction with BS3 and SM(PEG)6 at room temperature representing sRAGE dimers, trimers, tetramers and a large oligomer weighing more than 250 kDa (Figure S3). This sequential assembly suggests that in solution sRAGE likely possesses more than one oligomerization surface and may not form the simple symmetric dimer proposed in (Sarkany et al., 2011; Sitkiewicz et al., 2013).
Bands isolated from cross-linked dimeric and trimeric CL-sRAGE were proteolyzed in-gel using two endoproteinases, Trypsin and Glu-C. The purified peptide mixture was analyzed by using a “bottom up” proteomics strategy(Chu et al., 2004). An unloaded gel lane and the CL-sRAGE monomer band were also processed by double proteolysis to control against possible false-positives. A representative example of the precursor ion, corresponding to the conjugate of peptide 58-77 with 117-125 that was produced by treatment with BS3 (Figure 3A) mass spectrometry, is shown (Figure 3B). Overall, four distinctive conjugates were isolated and analyzed by using MS and tandem MS/MS, which placed residue couples K62-K123, K107-K123 and K62-K107 to within 11.4 Å from one another, and K110-C234 within 32.5 Å (Table 1).
Figure 3. MS characterization of cross-linked peptides from CL-sRAGE.

(A) Sequence and composition of cross-linked peptides. Observed fragment ions and their charge states are labeled according to standard nomenclature. BS3-modified fragments are labeled with stars (*). (B) A representative high-energy collision (HCD) spectrum obtained upon activation of the cross-linked product observed at m/z 1084.895 in the digestion mixture. The experimental mass (M) afforded by this triply charged precursor ion matched the theoretical mass of 3251.661 calculated from the putative elemental composition. Black and red colors represent the cross-linked peptides. The observed fragment ions (y and b fragment ions) afforded almost complete coverage, which revealed the presence and position of the BS3 moiety within the cross-linked product. See also Figure S3.
Table 1.
Cross-linker reagents and cross-linked peptides and residues.
| Cross-linker Reagent |
|
|
||
|---|---|---|---|---|
| Spacer Length | 11.4 Å | 32.5Å | ||
| Specificity | Homobifunctional Reactive towards primary amides | Heterobifunctional Thio-ether bond formation between primary amide and cysteine sulfhydryl group | ||
| Cross-linked RAGE sequence | T58-R77 to V117-E125 | N105-E108 to V117-E125 | T58-R77 to V117-E125 | E108-R114 to V229-E237 |
| Cross-linked residues | K62-K123 | K107-K123 | K62-K107 | K110-C234 |
| Intra-/Inter-molecular | Inter-molecular | Inter-molecular | Intra-molecular | Inter-molecular |
| Mtheoretical | 3251.661 | 1613.829 | 2668.319 | 2359.052 |
| Mexperimental | 3251.668 | 1613.834 | 2668.329 | 2359.056 |
| Error | −2 ppm | −3.1 ppm | −3.8 ppm | 1.7 ppm |
sRAGE is a non-symmetric homo-dimer in solution
The observation that both the VC1 and C2 domains contribute to sRAGE dimerization is consistent with previous studies of the sRAGE solution structure (44-46). To generate a structural model of an sRAGE homodimer the HADDOCK program (de Vries et al., 2010; Wassenaar et al., 2012) was used to dock two sRAGE monomers (Yatime and Andersen, 2013) by using both the ambiguous distance constraints derived from the intermolecular interaction surfaces between domains (Figures 2B and 2D), and the unambiguous distance constraints defined by crosslinking (Figure 3, Table 1 and Table S1).
The linker between the C1 and C2 domain (Figure 1B), consisting of five residues (231-237) (Yatime and Andersen, 2013) was assigned to be semi-flexible. NMR and cross-linking derived distance constraints were consistent with one structural family of sRAGE. The best refined cluster has an interface root mean square deviation, RMSD, of 2.7 Å, a cluster size of 200 and intermolecular energy equal to −87.6 ± 1.5 kcal·mole−1 (Table S2). The sRAGE homo-dimer interface consists of a total buried surface area of 1443 ± 64 Å2 and involves regions of both the VC1 and C2 domains (Figure 4). Importantly, because the C1-C2 linker (Figure 1B) is not involved in dimerization, the HADDOCK structure calculated for the CL-sRAGE dimer is should be compatible with that of wild type sRAGE.
Figure 4. Model of the sRAGE homo-dimer.

(A) Two monomers (purple and yellow) orient head to head with each other in the flat ribbon display. The elements of the sRAGE secondary structure involved in dimerization are labeled based on the VC1 (Koch et al., 2010) and C2 (Yatime and Andersen, 2013) secondary structure assignments. A close up of two unambiguous distance constraints is shown in the upper panel. The distances between cross-linked residues, K62-K123 and K107-K123, match the BS3 spacer length. (B) A half-transparent molecular surface and flat ribbon display of the homo-dimer model in is shown in two colors. Electrostatic contacts are observed between residues K110-E125, R114-D128 and K169-Q268, while hydrogen bonds are observed between residues R116-S131, L164-S306 and E168-T304 (upper panel). (C) The electrostatic potential mapped onto the solution structure of the sRAGE homo-dimer reveals a global interaction between the monomers: The electrostatic surface potential of the VC1 domain is positive (blue), and that of the C2 domain is generally negative (red). The localization of opposite charge clusters facilitate charge neutralization and depolarization in the homo-dimer. Higher order sRAGE oligomers can form by utilizing solvent exposed dimerization surfaces (circled regions). See also Figure S4, Tables S1 and S2.
The principal sRAGE homo-dimer intermolecular interactions occur between the G strand of the V domain and the A strand of the C1 domain, as well as between the CD loop of the C1 domain and the FG loop of the C2 domain (Figure 4A). Key interaction surfaces involve electrostatic contacts, K110-E125 and R114-D128 between the V and C1 domains, and electrostatic contact K169-Q268 and potential hydrogen bonds between residues R116-S131, L164-S306 and E168-T304 between the C1 and C2 domains, (Figure 4B). All unambiguous constraints are satisfied within 0.2 Å (Figures 4A and 4B, top panels). The molecular surfaces of the asymmetric sRAGE homo-dimer consist of two parallel J-shaped monomers oriented head-to-head. (Figure 4C). The structure suggests that the oligomers larger than dimers can form by utilizing the same interaction surfaces (Figure 4C).
Electrostatic surface potentials mapped onto a molecular representation of the sRAGE homo-dimer shows electrostatic compensation between the positively charged V domain and the negatively charged C2 domain that minimizes electrostatic repulsion between the two generally positive-charged VC1 domains (Figure 4C). When in contact with the VC1 domain, the C2 domain is directed towards the cell membrane. A distance of approximately 50 Å is observed between the last proline residue on the G strand of the C2 domain of one monomer and the corresponding residue of the cognate monomer within an sRAGE homo-dimer. This orientation defines the molecular dimension of the cytosolic domain of the homo-dimer (Figure 1B). It is likely that the relative distances between the C-termini of sRAGE are important for signal transduction because the C2 domain connects directly to the transmembrane helix and the cytosolic tail.
15N-NMR relaxation rates are very sensitive to monomer-dimer equilibria as they strongly depend on the rotational correlation time of the dimer in solution and can provide independent confirmation of the validity of models of interacting proteins (Fushman, 2012). HydroNMR (Bernado et al., 2002; Blobel et al., 2009; Garcia de la Torre et al., 2000) was used to compute theoretical relaxation data for the monomer and the HADDOCK (de Vries et al., 2010; Wassenaar et al., 2012) model of the dimer. A dimerization constant, Kd, was calculated by fitting theoretical relaxation data to experimental values (Figure S4). This approach gave a well-defined minimum, χ2 = 1.025, corresponding to a Kd of 120 ± 12 μM, in good agreement with previous estimates of the monomer-dimer equilibrium constant (Sarkany et al., 2011). The ability to predict the expected relaxation rates of macromolecules of known structure opens the way to sensitive and structurally informative methods to characterize weakly interacting protein-protein complexes.
S100B binding defines the geometry of oligomeric RAGE
Ca2+-S100B is a physiological ligand of RAGE that initiates RAGE dependent signal transduction (Hofmann et al., 1999; Koch et al., 2010). Changes in the 15N-HSQC NMR spectra of [U- 15N]-S100B with and without CL-sRAGE, and of [U- 2H, 15N]-VC1 in CL-sRAGE with and without Ca2+-S100B, were used to define the interaction surfaces between the VC1 domain and dimeric Ca2+-S100B (Figure S5). Mapping these changes onto the VC1 domain reveals positively charged residues at opposite ends of the interacting surface on the V domain, K43, K44, A101, M102, N103, R104, N105, G106 and K107 (Figure 5A). While mapping the interaction surface residues of S100B, F43, L44, E45, E49, A78, M79, V80, T81, T82, A83, H85, E86, F87, F88, E89 and H90, shows negatively charged residues at opposite ends of a hydrophobic pocket (Figure 5B). These results are consistent with the NMR studies of the Ca2+-S100B binding to isolated VC1 (Koch et al., 2010).
Figure 5. S100B induced homo-dimer clustering and dramatic increase in RAGE dimensions.

(A) V domain residues that comprise the VC1-Ca2+-S100B intermolecular interaction surface (red) mapped onto the VC1 domain. (B) Ca2+-S100B residues that comprise the VC1-Ca2+-S100B intermolecular interaction surface (red) mapped onto the Ca2+-S100B dimer. (C) Model of an Ca2+-S100B dimer bound to two sRAGE homo-dimers showing the proposed transmembrane interaction between RAGE and DIAPH1. The spacing between the ctRAGE-binding FH1 domains of the DIAPH1 dimer (PDB code 1V9D (Shimada et al., 2004)) is comparable to the distance between the C-termini of the two homo-dimers. See also Figure S5 and S6, Tables S1 and S2.
Changes in the peak intensities of VC1 domain residues K39, A41, R48, W61, V63, R98, E125, G125, A152, T154, V165, R169, V171, T195, A197, and V233, and of S100B residues L27, R29, E46, I47, A75, F76 and C84, do not form a contiguous interaction surface, and likely represent indirect changes within CL-sRAGE and S100B upon forming the complex (Figure S5). Only slight changes arise between the 15N-HSQC spectra of [U- 15N]-C2 in CL-sRAGE with and without Ca2+-S100B implying no significant alteration of the C2 domain conformation within CL-sRAGE upon Ca2+-S100B binding.
By using the amine-to-amine cross-linker BS3 to determine if CL-sRAGE oligomerization is induced by Ca2+-S100B, a species slightly smaller than 75 kDa, which is absent in cross-linked CL-sRAGE oligomers, was observed (Figure S6). The size is consistent with a combination of a 45 kDa CL-sRAGE monomer and a 20 kDa Ca2+-S100B dimer. MS and tandem MS/MS analysis revealed that the cross-linked complex involves CL-sRAGE sequence 114-125 and S100B sequence 48-52, providing an unambiguous distance constraint for structure calculations (Figure S6, Table S1).
HADDOCK modeling of the Ca2+-S100B-sRAGE complex based on the unambiguous and ambiguous distance constraints is shown in Figure 5C. Ca2+-S100B dimers bind to two V domains from different sRAGE homo-dimers. The model of the sRAGE homo-dimer (Figure 4) was used in the docking. The best refined cluster has an interface RMSD of 6 Å, a cluster size of 196 and intermolecular energy equal to −133 ± 3 kcal·mole−1 (Table S2). Binding of the Ca2+-S100B dimer co-localizes two sRAGE homo-dimers but does not disrupt the individual sRAGE homo-dimer structure. No additional interactions between the two homo-dimers were identified.
Ca2+-S100B-induced oligomerization of sRAGE homo-dimers results in a distance between the C-termini of C2 domains located on each sRAGE homo-dimer of ~100 Å. This increased molecular dimension of the cytosolic components of oligomerized RAGE compared to free RAGE homo-dimers (~50 Å) is comparable to the spacing between the FH1 domains of the DIAPH1 dimer (Figure 5C). Free DIAPH1 is a dimer that binds to ctRAGE(Rai et al., 2012a) and is required for ligand-induced RAGE signal transduction (Bianchi et al., 2011; Hudson et al., 2008; Toure et al., 2012).
Free DIAPH1 is maintained in a compact state through an intramolecular interaction between the N-terminal diaphanous autoregulatory domain, DAD, and the C-terminal diaphanous inhibitory domain, DID (Figure 6A, left panel). In this configuration the two FH1 domains of the DIAPH1 dimer, which are the binding sites for RAGE (Hudson et al., 2008; Rai et al., 2012a), are spaced ~100 Å from each other(Maiti et al., 2012; Shimada et al., 2004), closely matching the distance between C-termini of RAGE homo-dimers ligated with S100B. Thus the structural model suggests a mechanism for signal transduction in which Ca2+-S100B dimer binding may promote oligomerization of RAGE homo-dimers, facilitating clustering on the cell surface, recruitment of DIAPH1 and subsequent signal transduction.
Figure 6. Full-length DIAPH1 is required for RAGE signaling.

(A) Schematic representation of free full length DIAPH1 (left) and ΔDAD- DIAPH1 (right). The compact conformation of free full length DIAPH1 FH2 domains form a lasso orienting the FH1 domains ~100 Å apart (Maiti et al., 2012; Shimada et al., 2004). The extended conformation of ΔDAD- DIAPH1 allows the FH1 domains to span a smaller distance of ~50 Å. (B) RAGE-YFP and DIAPH1-CFP co-localize on the HEK293 cell surface (upper panels). Adding Ca2+-S100B (lower panels) further increases the co-localization from nMDP=0.055 ±0.003 to nMDP=0.065 ±0.003, p<0.05. (C) ΔDAD- DIAPH1-CFP and RAGE-YFP readily co-localize on HEK293 cells after adding Ca2+-S100B. FRET between CFP and YFP was observed after photobleaching RAGE-YFP in the region shown by the red rectangle. The FRET efficiency between RAGE-YFP and ΔDAD-DIAPH1-CFP was 10 ± 3%, whereas acceptor photobleaching typically results in over a 90% decrease in fluorescence. (D) Full-length DIAPH1 supports RAGE signaling, whereas ΔDAD-DIAPH1 does not. WT SMCs (right panels) and DIAPH1 KO SMCs (left panels) transfected with either empty vector (EV), ΔDAD-DIAPH1-CFP (ΔDAD), or DIAPH1-CFP (DIAPH1) were stimulated with 1 μM of Ca2+-S100B. Cell lysates were separated by SDS-PAGE and immunobloted with antibodies specific for DIAPH1 (upper panels), phospho-AKT (middle panels) or total AKT (bottom panels). (E). Changes in phosphorylation levels of AKT following stimulation by Ca2+-S100B. Double asterisks at the top of the bars represent a statistically significant (p< 0.05) change in AKT phosphorylation due to simulation as compared to EV. Note the apparent lack of RAGE signaling stimulation when SMCs are transfected with either empty vector or ΔDAD- DIAPH1-CFP. NS and S stand for non-stimulated and stimulated cells. The data represent three separate experiments. See also Figure S7.
Ligand induced RAGE oligomerization activates DIAPH1-dependent signal transduction
To test the assumptions of the structural model, fluorescence microscopy and cell signaling experiments were used to probe the in-cell interaction of full length RAGE with its effector DIAPH1. Two plasmids expressing full length RAGE fused with yellow fluorescence protein, YFP, and full length DIAPH1 fused with cyan fluorescent protein, CFP, were individually transfected into HEK293 cells. As expected, RAGE-YFP was localized onto the plasma membrane and DIAPH1-CFP exhibited a cytosolic distribution. Transfecting both plasmids led to into HEK293 cells led to co-localization of the two proteins (Figure 6B, upper panels).
RAGE-DIAPH1 co-localization was quantitatively described by using a normalized mean deviation product, nMDP, which ranges from −1 for negative correlation (exclusion) between the positions of two fluorescently labeled proteins to +1 for positive correlation (co-localization). Under our experimental conditions, the average nMDP value for RAGE-YFP and DIAPH1-CFP was 0.055 ± 0.003. The nMDP increased to 0.065 ± 0.003, p<0.05 upon adding Ca2+-S100B (Figure 6B, lower panels). This small but statistically significant increase is consistent with ligand-induced DIAPH1 binding to RAGE.
The deletion mutant of DIAPH1, ΔDAD- DIAPH1 exists in an extended conformation in which the FH1 domains can be within ~50 Å of each other (Maiti et al., 2012) (Figure 6A, right panel). This distance closely matches the distance between the C-termini in free sRAGE homo-dimers (Figure 4C) and suggests that under physiological conditions, ΔDAD-DIAPH1 may strongly bind to RAGE(Rai et al., 2012a). Indeed, ΔDAD-DIAPH1 readily co-localizes with RAGE as indicated by an nMDP of 0.091 ± 0.001 (Figure S7). This value is 40% greater than the value obtained for RAGE-full-length DIAPH1 co-localization. In the presence of Ca2+-S100B co-localization increases further to nMDP = 0.097 ± 0.003, p < 0.05 (Figure 6C).
The strong co-localization of RAGE-YFP and ΔDAD-DIAPH1-CFP allowed the use of Forster resonance transfer experiments, FRET, to assess the likelihood of a binding interaction (<50 Å) between fluorescently labeled RAGE-YFP and ΔDAD-DIAPH1-CFP. A 8 ± 2% (Figure S7) and 10% ± 3% (Figure 6C) increase in donor, RAGE-YFP, emission due to acceptor, ΔDAD- DIAPH1-CFP, photobleaching were observed without and with the addition of Ca2+-S100B, respectively, suggesting that ΔDAD-DIAPH1 interacts with RAGE in the absence of RAGE ligands and therefore may serve as an effector for RAGE signaling.
Wild type, WT-, and DIAPH1 knock out smooth muscle cells, KO SMCs, were used to assess the effect of ligand-dependent RAGE oligomerization on RAGE signaling. The cells, which constitutively express RAGE, were transfected with an empty vector, full-length DIAPH1-CFP or ΔDAD-DIAPH1-CFP (Figure 6D). Phosphorylation of AKT kinase was used as a probe of Ca2+-S100B dependent RAGE activation(Rai et al., 2012a) (Figure 6D and 6E).
Basal RAGE activation, observed in WT SMCs transfected with empty vector, is in response to endogenous DIAPH1 (Figures 6D and 6E). No activation was observed in the DIAPH1 KO SMCs transfected with empty vector(Hudson et al., 2008; Rai et al., 2012a; Toure et al., 2012) as expected, since DIAPH1 is necessary for Ca2+-S100B dependent RAGE activation (Figures 6D and 6E). Transfecting WT- and KO-SMCs with DIAPH1 led to statistically significant 20% and 5% increases in AKT phosphorylation implying that the presence of full length DIAPH1 is required for RAGE signaling. Transfecting ΔDAD-DIAPH1 into WT-SMCs resulted in a statistically insignificant increase in AKT phosphorylation, and a decrease in KO-SMCs implying that ΔDAD-DIAPH1 does not facilitate ligand-dependent RAGE signaling. Thus, in accordance with the proposed structural mechanism for signal transduction, Ca2+-S100B induced oligomerization of RAGE on the surface of the cell membrane leads to increased DIAPH1 binding, which in turn induces phosphorylation of the intracellular RAGE effector serine/threonine cAMP-dependent protein kinase A, AKT (Rai et al., 2012a).
Discussion
Homo-dimerization is essential for RAGE-mediated signal transduction (Wei et al., 2012; Zong et al., 2010). Due to weak interactions between sRAGE monomers the crystal structures of sRAGE (Yatime and Andersen, 2013) or its isolated domains (Koch et al., 2010; Park et al., 2010) do not clearly reveal the oligomerization surfaces that are important for the RAGE resting state or ligand-dependent RAGE self-association required for signal transduction(Schmidt et al., 2001; Zong et al., 2010). The four existing crystal structures indicate two different dimerization surfaces deduced from crystal packing (Koch et al., 2010; Park et al., 2010; Xu et al., 2013; Yatime and Andersen, 2013) and place highly positively charged V domains in immediate proximity to each other, which is unlikely to occur in solution but could be stabilized by the interaction with negatively charged heparin (Xu et al., 2013), a known inhibitor of RAGE signaling (Rao et al., 2010). The complete structure of full-length RAGE or extracellular sRAGE in solution is difficult to determine by using NMR spectroscopy due to its large size. To resolve the oligomeric solution structure of free sRAGE and in complex with the physiological ligand Ca2+-S100B, we employed a hybrid method combining analysis of segmentally labeled sRAGE with high-resolution NMR and cross-linking with MS detection.
sRAGE was constructed from two independent segmentally labeled units, the VC1 and C2 domains. NMR spectroscopy was used to identify the intra- and inter- molecular interaction surfaces between these domains. These surfaces were converted into ambiguous constraints for protein docking analysis. Unambiguous distance constraints were obtained from cross-linking followed by protease digestion and MS analysis. There was agreement between the ambiguous constraints derived from NMR and unambiguous constraints derived from chemical probing. The combination of isotopic segmental labeling together with NMR analysis and protein chemical cross-linking represents a very effective novel technique for analyzing structures of weakly oligomerizing proteins (Fabris and Yu, 2010; Friedhoff, 2005; Trakselis et al., 2005).
A structural model resolving the interaction surfaces and orientation of each monomer within the sRAGE homo-dimer was described. The model suggests how sRAGE oligomers larger than dimers, which are implicated in ligand independent RAGE signaling in RAGE overexpressing melanoma cells(Meghnani et al., 2014), can form. The negatively charged C2 domain stabilizes the sRAGE homo-dimer structure by interacting with the positively charged VC1 domain, underscoring the importance of the VC1 and C2 domains for homo-dimerization (Reverdatto et al., 2013; Sitkiewicz et al., 2013; Wei et al., 2012; Zong et al., 2010). Indeed, VC1 domain residues K110, R114, R116, E125, D128, and S131, involved in homo-dimerization, match those identified by cross-linking probes as being protected from deuterium exchange (Sitkiewicz et al., 2013). In addition, C2 domain residue S307, which is involved in homodimerization, is one of the residues implicated in binding a peptide aptamer that inhibits ligand induced RAGE signaling (Reverdatto et al., 2013).
A structural model of Ca2+-S100B binding to sRAGE was also developed and a mechanism for Ca2+-S100B dependent RAGE signaling was proposed and tested. The Ca2+-S100B binding and homo-dimerization sites on sRAGE are distinct, permitting a higher order oligomer to assemble (Figures 4 and 5). FRET analysis of unstimulated oligomeric RAGE indicates that the intracellular C-termini are located within 50 Å (Xie et al., 2008), consistent with the model of the homo-dimer (Figure 4). Ca2+-S100B binding induces RAGE oligomerization and increases the distance between the C-termini to 100 Å (Figure 5), closely matching the distance between the FH1 binding domains of the intracellular effector DIAPH1 (Maiti et al., 2012), which is required to establish strong Ca2+-S100B dependent RAGE signaling (Hudson et al., 2008; Toure et al., 2012) (Figure 6).
The mechanism proposed for S100B-induced RAGE signal transduction is consistent with experimental observations showing that RAGE forms constitutive multimers (Wei et al., 2012; Xie et al., 2007; Xie et al., 2008; Zong et al., 2010). These multimers are stabilized by both the weakly dimerizing extracellular domains, as exhibited by sRAGE, and oligomerization of cytosolic RAGE, ctRAGE (Su and Berger, 2012). Ca2+-S100B binding to RAGE shifts the equilibrium distribution towards higher order oligomeric states without causing a major conformational change (Choudhuri et al., 2005; Metzger, 1992). Subsequent binding of DIAPH1 results in signal transduction. Importantly, site specific peptide aptamers have been identified that bind to individual V, C1 and C2 domains of RAGE and inhibit S100B-dependent RAGE signal transduction (Reverdatto et al., 2013). The use of peptide aptamers selected to inhibit RAGE homo-dimerization and/or oligomerization may prove to be a viable therapeutic strategy to control RAGE-mediated potentiation of cell transformations into pathological states.
Experimental Procedures
Chemical Ligation: Expressed Protein Ligation (EPL)
The N-terminal His-tag of the C2 domain was cleaved by thrombin (Novagen) at 37 °C for 2 h before being chemically ligated with the VC1 domain. The two protein domains were mixed in native buffer, 20 mM sodium phosphate, pH 7.2, 500 mM NaCl, containing 50 mM MESNA, 1 mM EDTA and 4-(2-aminoethyl) benzenesμlfonyl fluoride hydrochloride, AEBSF, at room temperature for 16 h. The chemically ligated sRAGE was dialyzed into 20 mM sodium phosphate buffer, pH 6.0, 100 μM Na2SO4 and loaded onto a HiTrapTM SP-FF affinity chromatography column (GE Healthcare) and eluted with a gradient of Na2SO4 from 100 mM to 500 mM. Fractions containing the eluted protein were dialyzed into 20 mM sodium phosphate, pH 7.5, and loaded onto a HiTrapTM Q-FF affinity chromatography column. The protein was eluted with a gradient of Na2SO4 from 0 mM to 150 mM prior to gel filtration chromatography on an analytical SE-75 column (Amersham Biosciences). Purity was estimated to be >80% by Coomassie-stained SDS-PAGE.
Cross-Linking Reaction
Cross-linking was performed by using a homo-bifunctional (amine-to-amine) cross-linker BS3 that forms an 11.4 Å stable conjugate between amino groups, and hetero-bifunctional (amine-to-sulfhydryl) cross-linkers, Sulfo-SMCC with a spacer arm of 8.3 Å and SM(PEG)6, with a spacer arm of 32.5 Å (Table 1).
10 mM Sulfo-SMCC or 100 mM BS3 in 20 mM sodium phosphate, pH 7.2, 50 mM Na2SO4, was added to ~50 μM of purified CL-sRAGE in the same buffer, to final concentrations of 1, 2.5, and 5 mM, which are 20-, 50- and 100-fold molar excess over the protein. The reaction mixture was incubated at room temperature for 30 minutes or on ice for 2 h. After 5, 15, 30, 60, and 120 min, 200 μL aliquots were taken from the reaction mixtures and NH4HCO3 was added to a final concentration of 20 mM to quench the reactions.
SM(PEG)6 was dissolved in dry DMSO at 250 mM and added to the CL-sRAGE solution to a final concentration of 1 mM. The reaction mixture was incubated either at room temperature for 30 minutes, or on ice for 2 h and quenched as above.
Mass Spectrometry
Cross-linked peptides in 1% acetic acid were desalted before MS analysis. Typically, 5-10 μL aliquots were loaded onto a 250 μm silica column packed with 10 μm, 300 Å stationary phase Jupiter C18 resin. Peptides were washed with 200 μL of 1% acetic acid and eluted with 10-30 μL of 70% acetonitrile and 1% acetic acid. Peptides samples (3-6 μL) were loaded into quartz emitters and characterized by electrospray ionization-mass spectrometry, ESI-MS, by using a Thermo Scientific Orbitrap Velos mass spectrometer. The emitter voltage was held at 0.8-1.2 kV and the ion transfer tube temperature was 200 °C. Full scans were acquired between 300-2000 m/z with a mass resolution in excess of 100,000. Putative cross-linked species were fragmented in the collision cell with 20 eV to 50 eV of energy. Tandem mass spectra were acquired in the Orbitarp mass analyzer over a range of 80-2000 m/z with a mass resolution in excess of 100,000. Experimental data were analyzed manually and using the MSX-3D software package(Heymann et al., 2008).
Docking Studies
HADDOCK (de Vries et al., 2010; Wassenaar et al., 2012) was used to dock two sRAGE monomers to form an sRAGE homo-dimer, and to dock sRAGE monomers and Ca2+-S100B to form the sRAGE- Ca2+-S100B complex by using the previously determined structures of RAGE-VC1C2 (Protein Data Bank entry 4LP5 (Yatime and Andersen, 2013)) and Ca2+-S100B (PDB entry 2H61 (Ostendorp et al., 2007)). Positive and negative crosslink lengths were used to define unambiguous intermolecular distance constraints. Chemical shift perturbations observed upon complex formation were used to define ambiguous interaction constraints (AIR) for residues at the interface (Table S1). Active residues were defined as those having either chemical shifts changes larger than 0.25 ppm or peak broadening greater than 80% compared to free protein. Passive residues were defined as all of the residues surrounding the interaction surfaces. A total of 5000 rigid-body docking trials were carried out using the standard HADDOCK protocol. The 100 lowest-energy solutions were used for subsequent semi-flexible simulated annealing and water refinement. The five lowest-energy structures were used to represent the complex (Table S2). Validation of the structures was performed with PROCHECK (Laskowski, 1993).
NMR Spectroscopy
Standard double- and triple-resonance spectra 15N-HSQC, HN(CA)CO, HNCO, HN(CO)CA, HNCA, CBCA(CO)NH, and HNCACB(Cavanagh et al., 2007) were acquired at 298 K using an Avance Bruker spectrometer operating at a 1H frequency of 700 MHz and equipped with a single Z-axis gradient cryoprobe. 15N-HSQC spectra of [U- 15N]-alanine, -serine, -threonine, -valine, -leucine, -lysine, -isoleucine, -phenylalanine and -tryptophan labeled free VC1 domain were acquired to help assign chemical shifts. 15N longitudinal (R1) and transverse (R2) relaxation rates were measured by using two-dimensional 1H-15N correlation pulse sequences(Cavanagh et al., 2007). For the R1 and R2 experiments, 16 and 24 scans, respectively, were collected per t1 point. The 15N R1 and R2 values were obtained using 8 delays, 40, 60, 140, 240, 360, 520, 720, and 1200 ms for the R1 experiments and 16.2, 32.4, 48.6, 64.8, 81, 97.2, 113.4, and 129.6 ms for the R2 experiments. All spectra were processed using TOPSPIN 2.1 (Bruker, Inc), and assignments were made using CARA (Masse and Keller, 2005).
We first attempted to use paramagnetic relaxation enhancement (PRE) of the NMR signal(Tang et al., 2008; Tzeng et al., 2012) to derive unambiguous distance constraints for weakly oligomerizing sRAGE monomers. Unfortunately, the cysteine chemistry required to introduce PRE paramagnetic groups(Kosen, 1989) prevented the formation of disulfides critical for the structural integrity of the RAGE immunoglobulin domains.
Confocal Microscopy and FRET Assays
Images were acquired using a Zeiss LSM 510 META confocal imaging system equipped with a 30-milliwatt argon laser and a X63, 1.4 NA oil immersion objective. CFP was excited by using a 458 nm laser line at 10% power, and YFP with a 514 nm laser line at 1% power. To minimize channel crosstalk, images were recorded in multi-track mode using a 458/514 beam splitter, with 467-499 nm emission window for CFP and a 520-595 nm window for YFP. ImageJ plugin Colocalization Colormap (Jaskolski et al., 2005; Schneider et al., 2012) was used to access the degree of co-localization of hRAGE with DIAPH1 or DIAPH1ΔDAD. Acceptor photobleaching of selected regions for FRET determination was performed with a 514nm laser line at 100% power, reducing YFP emission to below 5% of its initial value. Quantitatively, FRET was measured as an increase in CFP fluorescence intensity (donor de-quenching) after YFP (acceptor) photobleaching. Another ImageJ plugin, AccPbFRET v.3.16 (Roszik et al., 2008), was used to process images from the time/bleach series and quantitatively estimate FRET values.
Supplementary Material
Highlights.
NMR spectroscopy, crosslinking and MS were used to construct a model of RAGE dimers
Dimers and larger oligomers can form by utilizing the same interacting surfaces
Oligomerization and ligand binding increase the molecular dimension of RAGE
The increase in molecular dimension promotes signal transduction
Acknowledgements
This work was supported by NIH grants GM085006 (to A.S.) and 1R24DK103032 (to A.M. S.).
Footnotes
Publisher's Disclaimer: This is a PDF file of an unedited manuscript that has been accepted for publication. As a service to our customers we are providing this early version of the manuscript. The manuscript will undergo copyediting, typesetting, and review of the resulting proof before it is published in its final citable form. Please note that during the production process errors may be discovered which could affect the content, and all legal disclaimers that apply to the journal pertain.
Author contributions
J.X., M.M., M.S., V.R., and S.R. conducted the experiments, D.F., A.M.S., and A.S. designed the experiments and J.X., D.S.B., D.F., A.M.S., and A.S. wrote the paper.
Conflict of Interest
The authors declare no conflict of interest.
References
- Angers S, Salahpour A, Bouvier M. Dimerization: an emerging concept for G protein-coupled receptor ontogeny and function. Annual review of pharmacology and toxicology. 2002;42:409–435. doi: 10.1146/annurev.pharmtox.42.091701.082314. [DOI] [PubMed] [Google Scholar]
- Bernado P, Garcia de la Torre J, Pons M. Interpretation of 15N NMR relaxation data of globular proteins using hydrodynamic calculations with HYDRONMR. J Biomol NMR. 2002;23:139–150. doi: 10.1023/a:1016359412284. [DOI] [PubMed] [Google Scholar]
- Berry R, Chen Z, McCluskey J, Rossjohn J. Insight into the basis of autonomous immunoreceptor activation. Trends in immunology. 2011;32:165–170. doi: 10.1016/j.it.2011.01.007. [DOI] [PubMed] [Google Scholar]
- Bianchi R, Kastrisianaki E, Giambanco I, Donato R. S100B protein stimulates microglia migration via RAGE-dependent up-regulation of chemokine expression and release. The Journal of biological chemistry. 2011;286:7214–7226. doi: 10.1074/jbc.M110.169342. [DOI] [PMC free article] [PubMed] [Google Scholar]
- Blobel J, Bernado P, Xu H, Jin C, Pons M. Weak oligomerization of low-molecular-weight protein tyrosine phosphatase is conserved from mammals to bacteria. The FEBS journal. 2009;276:4346–4357. doi: 10.1111/j.1742-4658.2009.07139.x. [DOI] [PubMed] [Google Scholar]
- Camarero JA, Shekhtman A, Campbell EA, Chlenov M, Gruber TM, Bryant DA, Darst SA, Cowburn D, Muir TW. Autoregulation of a bacterial sigma factor explored by using segmental isotopic labeling and NMR. Proc Natl Acad Sci U S A. 2002;99:8536–8541. doi: 10.1073/pnas.132033899. [DOI] [PMC free article] [PubMed] [Google Scholar]
- Cavanagh J, Fairbrother WJ, Palmer AG, Rance M, Skelton NJ. Protein NMR Spectroscopy: Principles and practice. 2d edn Academic Press; San Diego: 2007. [Google Scholar]
- Choudhuri K, Wiseman D, Brown MH, Gould K, van der Merwe PA. T-cell receptor triggering is critically dependent on the dimensions of its peptide-MHC ligand. Nature. 2005;436:578–582. doi: 10.1038/nature03843. [DOI] [PubMed] [Google Scholar]
- Chu F, Shan SO, Moustakas DT, Alber F, Egea PF, Stroud RM, Walter P, Burlingame AL. Unraveling the interface of signal recognition particle and its receptor by using chemical cross-linking and tandem mass spectrometry. Proc Natl Acad Sci U S A. 2004;101:16454–16459. doi: 10.1073/pnas.0407456101. [DOI] [PMC free article] [PubMed] [Google Scholar]
- Cowburn D, Shekhtman A, Xu R, Ottesen JJ, Muir TW. Segmental isotopic labeling for structural biological applications of NMR. Methods Mol Biol. 2004;278:47–56. doi: 10.1385/1-59259-809-9:047. [DOI] [PubMed] [Google Scholar]
- Dattilo BM, Fritz G, Leclerc E, Kooi CW, Heizmann CW, Chazin WJ. The extracellular region of the receptor for advanced glycation end products is composed of two independent structural units. Biochemistry. 2007;46:6957–6970. doi: 10.1021/bi7003735. [DOI] [PMC free article] [PubMed] [Google Scholar]
- Dawson PE, Muir TW, Clark-Lewis I, Kent SB. Synthesis of proteins by native chemical ligation. Science. 1994;266:776–779. doi: 10.1126/science.7973629. [DOI] [PubMed] [Google Scholar]
- de Vries SJ, van Dijk M, Bonvin AM. The HADDOCK web server for data-driven biomolecular docking. Nat Protoc. 2010;5:883–897. doi: 10.1038/nprot.2010.32. [DOI] [PubMed] [Google Scholar]
- DiGabriele AD, Lax I, Chen DI, Svahn CM, Jaye M, Schlessinger J, Hendrickson WA. Structure of a heparin-linked biologically active dimer of fibroblast growth factor. Nature. 1998;393:812–817. doi: 10.1038/31741. [DOI] [PubMed] [Google Scholar]
- Fabris D, Yu ET. Elucidating the higher-order structure of biopolymers by structural probing and mass spectrometry: MS3D. J Mass Spectrom. 2010;45:841–860. doi: 10.1002/jms.1762. [DOI] [PMC free article] [PubMed] [Google Scholar]
- Friedhoff P. Mapping protein-protein interactions by bioinformatics and cross-linking. Anal Bioanal Chem. 2005;381:78–80. doi: 10.1007/s00216-004-2892-7. [DOI] [PubMed] [Google Scholar]
- Fushman D. Determining protein dynamics from (1)(5)N relaxation data by using DYNAMICS. Methods in molecular biology. 2012;831:485–511. doi: 10.1007/978-1-61779-480-3_24. [DOI] [PMC free article] [PubMed] [Google Scholar]
- Garcia de la Torre J, Huertas ML, Carrasco B. HYDRONMR: prediction of NMR relaxation of globular proteins from atomic-level structures and hydrodynamic calculations. J Magn Reson. 2000;147:138–146. doi: 10.1006/jmre.2000.2170. [DOI] [PubMed] [Google Scholar]
- He M, Kubo H, Morimoto K, Fujino N, Suzuki T, Takahasi T, Yamada M, Yamaya M, Maekawa T, Yamamoto Y, et al. Receptor for advanced glycation end products binds to phosphatidylserine and assists in the clearance of apoptotic cells. EMBO Rep. 2011;12:358–364. doi: 10.1038/embor.2011.28. [DOI] [PMC free article] [PubMed] [Google Scholar]
- Heymann M, Paramelle D, Subra G, Forest E, Martinez J, Geourjon C, Deleage G. MSX-3D: a tool to validate 3D protein models using mass spectrometry. Bioinformatics. 2008;24:2782–2783. doi: 10.1093/bioinformatics/btn510. [DOI] [PubMed] [Google Scholar]
- Hofmann MA, Drury S, Fu C, Qu W, Taguchi A, Lu Y, Avila C, Kambham N, Bierhaus A, Nawroth P, et al. RAGE mediates a novel proinflammatory axis: a central cell surface receptor for S100/calgranulin polypeptides. Cell. 1999;97:889–901. doi: 10.1016/s0092-8674(00)80801-6. [DOI] [PubMed] [Google Scholar]
- Hudson BI, Kalea AZ, Del Mar Arriero M, Harja E, Boulanger E, D'Agati V, Schmidt AM. Interaction of the RAGE cytoplasmic domain with diaphanous-1 is required for ligand-stimulated cellular migration through activation of Rac1 and Cdc42. The Journal of biological chemistry. 2008;283:34457–34468. doi: 10.1074/jbc.M801465200. [DOI] [PMC free article] [PubMed] [Google Scholar]
- Jaskolski F, Mulle C, Manzoni OJ. An automated method to quantify and visualize colocalized fluorescent signals. J Neurosci Methods. 2005;146:42–49. doi: 10.1016/j.jneumeth.2005.01.012. [DOI] [PubMed] [Google Scholar]
- Kislinger T, Fu C, Huber B, Qu W, Taguchi A, Du Yan S, Hofmann M, Yan SF, Pischetsrieder M, Stern D, et al. N(epsilon)-(carboxymethyl)lysine adducts of proteins are ligands for receptor for advanced glycation end products that activate cell signaling pathways and modulate gene expression. J Biol Chem. 1999;274:31740–31749. doi: 10.1074/jbc.274.44.31740. [DOI] [PubMed] [Google Scholar]
- Koch M, Chitayat S, Dattilo BM, Schiefner A, Diez J, Chazin WJ, Fritz G. Structural basis for ligand recognition and activation of RAGE. Structure. 2010;18:1342–1352. doi: 10.1016/j.str.2010.05.017. [DOI] [PMC free article] [PubMed] [Google Scholar]
- Kosen PA. Spin labeling of proteins. Methods in enzymology. 1989;177:86–121. doi: 10.1016/0076-6879(89)77007-5. [DOI] [PubMed] [Google Scholar]
- Laskowski RAM, M.W., Moss DS, Thornton JM. PROCHECK: A program to check the stereo chemical quality of protein structures. Journal of Applied Crystallography. 1993;26:283–291. [Google Scholar]
- Leclerc E, Fritz G, Vetter SW, Heizmann CW. Binding of S100 proteins to RAGE: an update. Biochim Biophys Acta. 2009;1793:993–1007. doi: 10.1016/j.bbamcr.2008.11.016. [DOI] [PubMed] [Google Scholar]
- Liliensiek B, Weigand MA, Bierhaus A, Nicklas W, Kasper M, Hofer S, Plachky J, Grone HJ, Kurschus FC, Schmidt AM, et al. Receptor for advanced glycation end products (RAGE) regulates sepsis but not the adaptive immune response. The Journal of clinical investigation. 2004;113:1641–1650. doi: 10.1172/JCI18704. [DOI] [PMC free article] [PubMed] [Google Scholar]
- Liu D, Xu R, Dutta K, Cowburn D. N-terminal cysteinyl proteins can be prepared using thrombin cleavage. FEBS Lett. 2008;582:1163–1167. doi: 10.1016/j.febslet.2008.02.078. [DOI] [PMC free article] [PubMed] [Google Scholar]
- Maiti S, Michelot A, Gould C, Blanchoin L, Sokolova O, Goode BL. Structure and activity of full-length formin mDia1. Cytoskeleton (Hoboken) 2012;69:393–405. doi: 10.1002/cm.21033. [DOI] [PMC free article] [PubMed] [Google Scholar]
- Masse JE, Keller R. AutoLink: automated sequential resonance assignment of biopolymers from NMR data by relative-hypothesis-prioritization-based simulated logic. J Magn Reson. 2005;174:133–151. doi: 10.1016/j.jmr.2005.01.017. [DOI] [PubMed] [Google Scholar]
- Mathys S, Evans TC, Chute IC, Wu H, Chong S, Benner J, Liu XQ, Xu MQ. Characterization of a self-splicing mini-intein and its conversion into autocatalytic N and C-terminal cleavage elements: facile production of protein building blocks for protein ligation. Gene. 1999;231:1–13. doi: 10.1016/s0378-1119(99)00103-1. [DOI] [PubMed] [Google Scholar]
- Medapati MR, Dahlmann M, Ghavami S, Pathak KA, Lucman L, Klonisch T, Hoang-Vu C, Stein U, Hombach-Klonisch S. RAGE Mediates the Pro-Migratory Response of Extracellular S100A4 in Human Thyroid Cancer Cells. Thyroid. 2015;25:514–527. doi: 10.1089/thy.2014.0257. [DOI] [PubMed] [Google Scholar]
- Meghnani V, Vetter SW, Leclerc E. RAGE overexpression confers a metastatic phenotype to the WM115 human primary melanoma cell line. Biochim Biophys Acta. 2014;1842:1017–1027. doi: 10.1016/j.bbadis.2014.02.013. [DOI] [PubMed] [Google Scholar]
- Metzger H. Transmembrane signaling: the joy of aggregation. Journal of immunology. 1992;149:1477–1487. [PubMed] [Google Scholar]
- Neeper M, Schmidt AM, Brett J, Yan SD, Wang F, Pan YC, Elliston K, Stern D, Shaw A. Cloning and expression of a cell surface receptor for advanced glycosylation end products of proteins. J Biol Chem. 1992;267:14998–15004. [PubMed] [Google Scholar]
- Ostendorp T, Leclerc E, Galichet A, Koch M, Demling N, Weigle B, Heizmann CW, Kroneck PM, Fritz G. Structural and functional insights into RAGE activation by multimeric S100B. Embo J. 2007;26:3868–3878. doi: 10.1038/sj.emboj.7601805. [DOI] [PMC free article] [PubMed] [Google Scholar]
- Park H, Adsit FG, Boyington JC. The 1.5 A crystal structure of human receptor for advanced glycation endproducts (RAGE) ectodomains reveals unique features determining ligand binding. The Journal of biological chemistry. 2010;285:40762–40770. doi: 10.1074/jbc.M110.169276. [DOI] [PMC free article] [PubMed] [Google Scholar]
- Rai V, Maldonado AY, Burz DS, Reverdatto S, Yan SF, Schmidt AM, Shekhtman A. Signal transduction in receptor for advanced glycation end products (RAGE): solution structure of C-terminal rage (ctRAGE) and its binding to mDia1. The Journal of biological chemistry. 2012a;287:5133–5144. doi: 10.1074/jbc.M111.277731. [DOI] [PMC free article] [PubMed] [Google Scholar]
- Rai V, Toure F, Chitayat S, Pei R, Song F, Li Q, Zhang J, Rosario R, Ramasamy R, Chazin WJ, et al. Lysophosphatidic acid targets vascular and oncogenic pathways via RAGE signaling. J Exp Med. 2012b;209:2339–2350. doi: 10.1084/jem.20120873. [DOI] [PMC free article] [PubMed] [Google Scholar]
- Ramsland PA, Farrugia W, Bradford TM, Sardjono CT, Esparon S, Trist HM, Powell MS, Tan PS, Cendron AC, Wines BD, et al. Structural basis for Fc gammaRIIa recognition of human IgG and formation of inflammatory signaling complexes. Journal of immunology. 2011;187:3208–3217. doi: 10.4049/jimmunol.1101467. [DOI] [PMC free article] [PubMed] [Google Scholar]
- Rao NV, Argyle B, Xu X, Reynolds PR, Walenga JM, Prechel M, Prestwich GD, MacArthur RB, Walters BB, Hoidal JR, et al. Low anticoagulant heparin targets multiple sites of inflammation, suppresses heparin-induced thrombocytopenia, and inhibits interaction of RAGE with its ligands. Am J Physiol Cell Physiol. 2010;299:C97–110. doi: 10.1152/ajpcell.00009.2010. [DOI] [PubMed] [Google Scholar]
- Reverdatto S, Rai V, Xue J, Burz DS, Schmidt AM, Shekhtman A. Combinatorial library of improved peptide aptamers, CLIPs to inhibit RAGE signal transduction in mammalian cells. PloS one. 2013;8:e65180. doi: 10.1371/journal.pone.0065180. [DOI] [PMC free article] [PubMed] [Google Scholar]
- Roszik J, Szollosi J, Vereb G. AccPbFRET: an ImageJ plugin for semi-automatic, fully corrected analysis of acceptor photobleaching FRET images. BMC Bioinformatics. 2008;9:346. doi: 10.1186/1471-2105-9-346. [DOI] [PMC free article] [PubMed] [Google Scholar]
- Sarkany Z, Ikonen TP, Ferreira-da-Silva F, Saraiva MJ, Svergun D, Damas AM. Solution structure of the soluble receptor for advanced glycation end products (sRAGE). The Journal of biological chemistry. 2011;286:37525–37534. doi: 10.1074/jbc.M111.223438. [DOI] [PMC free article] [PubMed] [Google Scholar]
- Schamel WW, Reth M. Monomeric and oligomeric complexes of the B cell antigen receptor. Immunity. 2000;13:5–14. doi: 10.1016/s1074-7613(00)00003-0. [DOI] [PubMed] [Google Scholar]
- Schmidt AM, Vianna M, Gerlach M, Brett J, Ryan J, Kao J, Esposito C, Hegarty H, Hurley W, Clauss M, et al. Isolation and characterization of two binding proteins for advanced glycosylation end products from bovine lung which are present on the endothelial cell surface. The Journal of biological chemistry. 1992;267:14987–14997. [PubMed] [Google Scholar]
- Schmidt AM, Yan SD, Yan SF, Stern DM. The multiligand receptor RAGE as a progression factor amplifying immune and inflammatory responses. J Clin Invest. 2001;108:949–955. doi: 10.1172/JCI14002. [DOI] [PMC free article] [PubMed] [Google Scholar]
- Schneider CA, Rasband WS, Eliceiri KW. NIH Image to ImageJ: 25 years of image analysis. Nat Methods. 2012;9:671–675. doi: 10.1038/nmeth.2089. [DOI] [PMC free article] [PubMed] [Google Scholar]
- Shimada A, Nyitrai M, Vetter IR, Kuhlmann D, Bugyi B, Narumiya S, Geeves MA, Wittinghofer A. The core FH2 domain of diaphanous-related formins is an elongated actin binding protein that inhibits polymerization. Mol Cell. 2004;13:511–522. doi: 10.1016/s1097-2765(04)00059-0. [DOI] [PubMed] [Google Scholar]
- Sitkiewicz E, Tarnowski K, Poznanski J, Kulma M, Dadlez M. Oligomerization interface of RAGE receptor revealed by MS-monitored hydrogen deuterium exchange. PloS one. 2013;8:e76353. doi: 10.1371/journal.pone.0076353. [DOI] [PMC free article] [PubMed] [Google Scholar]
- Su PC, Berger BW. Identifying key juxtamembrane interactions in cell membranes using AraC-based transcriptional reporter assay (AraTM). The Journal of biological chemistry. 2012;287:31515–31526. doi: 10.1074/jbc.M112.396895. [DOI] [PMC free article] [PubMed] [Google Scholar]
- Taguchi A, Blood DC, del Toro G, Canet A, Lee DC, Qu W, Tanji N, Lu Y, Lalla E, Fu C, et al. Blockade of RAGE-amphoterin signalling suppresses tumour growth and metastases. Nature. 2000;405:354–360. doi: 10.1038/35012626. [DOI] [PubMed] [Google Scholar]
- Tang C, Ghirlando R, Clore GM. Visualization of transient ultra-weak protein self-association in solution using paramagnetic relaxation enhancement. Journal of the American Chemical Society. 2008;130:4048–4056. doi: 10.1021/ja710493m. [DOI] [PubMed] [Google Scholar]
- Toure F, Fritz G, Li Q, Rai V, Daffu G, Zou YS, Rosario R, Ramasamy R, Alberts AS, Yan SF, et al. Formin mDia1 mediates vascular remodeling via integration of oxidative and signal transduction pathways. Circ Res. 2012;110:1279–1293. doi: 10.1161/CIRCRESAHA.111.262519. [DOI] [PMC free article] [PubMed] [Google Scholar]
- Trakselis MA, Alley SC, Ishmael FT. Identification and mapping of protein-protein interactions by a combination of cross-linking, cleavage, and proteomics. Bioconjug Chem. 2005;16:741–750. doi: 10.1021/bc050043a. [DOI] [PubMed] [Google Scholar]
- Tzeng SR, Pai MT, Kalodimos CG. NMR studies of large protein systems. Methods in molecular biology. 2012;831:133–140. doi: 10.1007/978-1-61779-480-3_8. [DOI] [PMC free article] [PubMed] [Google Scholar]
- van Zoelen MA, Schmidt AM, Florquin S, Meijers JC, de Beer R, de Vos AF, Nawroth PP, Bierhaus A, van der Poll T. Receptor for advanced glycation end products facilitates host defense during Escherichia coli-induced abdominal sepsis in mice. The Journal of infectious diseases. 2009;200:765–773. doi: 10.1086/604730. [DOI] [PubMed] [Google Scholar]
- Wassenaar TA, Dijk M, Loureiro-Ferreira N, Schot G, Vries SJ, Schmitz C, Zwan J, Boelens R, Giachetti A, Ferella L, et al. WeNMR: Structural Biology on the Grid. Journal of Grid Computing. 2012;10:743–767. [Google Scholar]
- Wei W, Lampe L, Park S, Vangara BS, Waldo GS, Cabantous S, Subaran SS, Yang D, Lakatta EG, Lin L. Disulfide bonds within the C2 domain of RAGE play key roles in its dimerization and biogenesis. PloS one. 2012;7:e50736. doi: 10.1371/journal.pone.0050736. [DOI] [PMC free article] [PubMed] [Google Scholar]
- Xie J, Burz DS, He W, Bronstein IB, Lednev I, Shekhtman A. Hexameric calgranulin C (S100A12) binds to the receptor for advanced glycated end products (RAGE) using symmetric hydrophobic target-binding patches. J Biol Chem. 2007;282:4218–4231. doi: 10.1074/jbc.M608888200. [DOI] [PubMed] [Google Scholar]
- Xie J, Reverdatto S, Frolov A, Hoffmann R, Burz DS, Shekhtman A. Structural basis for pattern recognition by the receptor for advanced glycation end products (RAGE). J Biol Chem. 2008;283:27255–27269. doi: 10.1074/jbc.M801622200. [DOI] [PubMed] [Google Scholar]
- Xu D, Young JH, Krahn JM, Song D, Corbett KD, Chazin WJ, Pedersen LC, Esko JD. Stable RAGE-heparan sulfate complexes are essential for signal transduction. ACS chemical biology. 2013;8:1611–1620. doi: 10.1021/cb4001553. [DOI] [PMC free article] [PubMed] [Google Scholar]
- Xu R, Ayers B, Cowburn D, Muir TW. Chemical ligation of folded recombinant proteins: segmental isotopic labeling of domains for NMR studies. Proc Natl Acad Sci U S A. 1999;96:388–393. doi: 10.1073/pnas.96.2.388. [DOI] [PMC free article] [PubMed] [Google Scholar]
- Xue J, Burz DS, Shekhtman A. Segmental labeling to study multidomain proteins. Adv Exp Med Biol. 2012;992:17–33. doi: 10.1007/978-94-007-4954-2_2. [DOI] [PubMed] [Google Scholar]
- Xue J, Rai V, Singer D, Chabierski S, Xie J, Reverdatto S, Burz DS, Schmidt AM, Hoffmann R, Shekhtman A. Advanced glycation end product recognition by the receptor for AGEs. Structure. 2011;19:722–732. doi: 10.1016/j.str.2011.02.013. [DOI] [PMC free article] [PubMed] [Google Scholar]
- Yan SD, Chen X, Fu J, Chen M, Zhu H, Roher A, Slattery T, Zhao L, Nagashima M, Morser J, et al. RAGE and amyloid-beta peptide neurotoxicity in Alzheimer's disease. Nature. 1996;382:685–691. doi: 10.1038/382685a0. [DOI] [PubMed] [Google Scholar]
- Yatime L, Andersen GR. Structural insights into the oligomerization mode of the human receptor for advanced glycation end-products. The FEBS journal. 2013;280:6556–6568. doi: 10.1111/febs.12556. [DOI] [PubMed] [Google Scholar]
- Zong H, Madden A, Ward M, Mooney MH, Elliott CT, Stitt AW. Homodimerization is essential for the receptor for advanced glycation end products (RAGE)-mediated signal transduction. The Journal of biological chemistry. 2010;285:23137–23146. doi: 10.1074/jbc.M110.133827. [DOI] [PMC free article] [PubMed] [Google Scholar]
Associated Data
This section collects any data citations, data availability statements, or supplementary materials included in this article.