The representation of protein 3D structures in the now-ubiquitous ribbon format profoundly aids in simplifying the visualization of protein structures, enabling rapid recognition of similarities and differences between protein domains. While ribbon representations can also be convenient for illustrating the 3D features of regular repeating polysaccharide structures (Pérez et al. 2015; Kuttel et al. 2006), the lack of highly ordered structural motifs in most oligosaccharides (glycans) attenuates the information content of such representations. The widely accepted 2D glycan symbol nomenclature developed in the 2nd edition of the Essentials of Glycobiology textbook (Varki et al. 1999), quickly communicates glycan sequence according to a system of shapes and colors for monosaccharides, and has recently been expanded and renamed the Symbol Nomenclature for Glycans (SNFG) (Varki et al. 2015). However, it does not convey an appreciation for the 3D structure of the glycans. Attempts to incorporate early versions of such symbols into glycan 3D structures have been proposed (Pendrill et al. 2013), but to date the most common representations remain formats in which the atoms of the glycan are simply colored according to the SNFG scheme (Pérez et al. 2015).
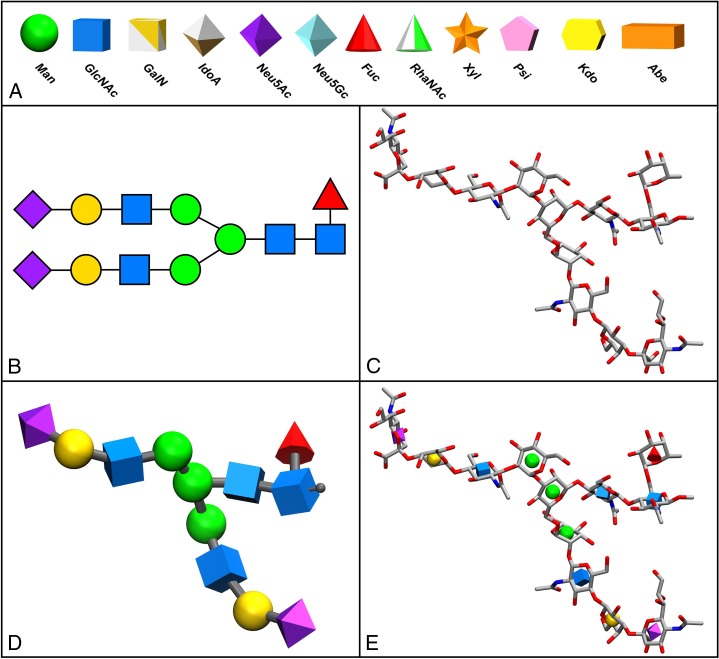
In an effort to popularize and simplify the visualization of 3D glycan structures, we present here a 3D adaptation of the new SNFG nomenclature (Varki et al. 2015), which we term the 3D Symbol Nomenclature for Glycans (3D-SNFG), and have implemented it for use with the visual molecular dynamics (VMD) program (Figure 1; Humphrey et al. 1996). VMD was selected as an initial platform because it is widely used for visualizing molecular structures, as well as data from molecular dynamics simulations. This concept has also been expanded here to create a hybrid atomistic–symbolic representation, in which proportionally reduced 3D-SNFG symbols (3D-SNFG Icons) are placed on the centroids of the monosaccharide rings. By providing simultaneous communication of glycan sequence and atomic interactions, the 3D-SNFG icon mode enables rapid monosaccharide recognition while maintaining structural detail.
Fig. 1.
A) Examples of the 3D-SNFG representations of each shape and color defined in the 2D SNFG. 3D symbols are available for all of the 67 residues in the latest SNFG nomenclature (Varki 2015), (B) 2D-SNFG for an N-linked glycan, (C) traditional atomistic 3D licorice representation of the glycan in B. Structure generated with the GLYCAM-Web Carbohydrate Builder (glycam.org) (Woods-Group 2005–2016), (D) 3D-SNFG representation with 3D symbols sized to be approximately equivalent to the minimal cross-section of a monosaccharide ring (4 Å diameter in the case of a sphere) with the reducing terminus optionally indicated by a grey stub, (E) 3D-SNFG-Icon representation superimposed on C, enabling rapid identification of constituent monosaccharides.
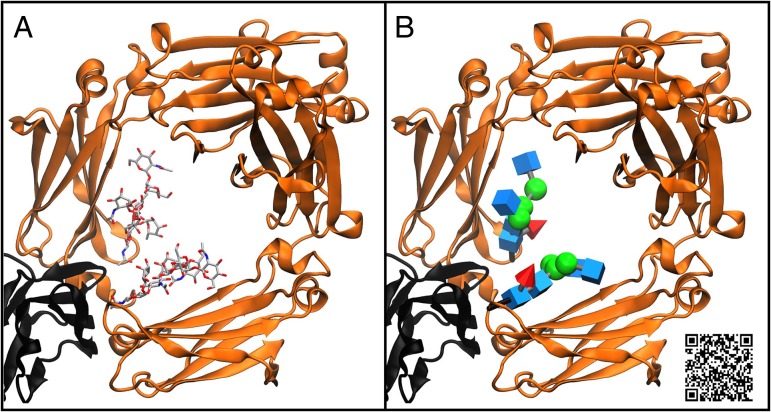
We hope that incorporation of a standard representation scheme familiar to the glycobiology community will help to effectively convey complex structural features pertaining to carbohydrate-containing biomolecules to glycobiologists and nonspecialists, such as those associated with protein glycosylation (Figure 2). The 3D-SNFG representation is uniquely well suited for illustrating the conformations of glycans in animations (scan the QR code in Figure 2 for an example). The VMD script and download instructions are available at GLYCAM-Web (glycam.org/3d-snfg), and can also be accessed online through Appendix 1B of the Essentials of Glycobiology, 3rd edition (http://www.ncbi.nlm.nih.gov/books/NBK310273/).
Fig. 2.
Traditional licorice (A, left) and 3D-SNFG (B, right) representations of the N-glycans in an antibody (orange ribbons) complexed with Fcγ receptor (black ribbons) (Ferrara et al. 2011). N-glycan fucosylation (red cone) diminishes antibody affinity for Fcγ receptor, reducing antibody-dependent cellular toxicity (Shields et al. 2002). Scan the QR code to view a video displaying the various glycan representations described here.
Supplementary data
Supplementary data for this article is available online at http://glycob.oxfordjournals.org/.
Funding
We thank Dr Ajit Varki and the members of the SNFG group for reviewing the proposed 3D-SNFG nomenclature, as well as the National Institutes of Health for support (P41 GM103390 and P41 GM104601). Simulation data used for demonstration of the 3D-SNFG representation were collected through the Blue Waters sustained-petascale computing project supported by NSF Awards OCI-0725070 and ACI-1238993, the state of Illinois, and the “Computational Microscope” NSF PRAC Award ACI-1440026.
Acknowledgements
We thank Dr Ajit Varki and the members of the SNFG group for reviewing the proposed 3D-SNFG nomenclature, as well as the National Institutes of Health for support (P41 GM103390 and P41 GM104601). Simulation data used for demonstration of the 3D-SNFG representation were collected through the Blue Waters sustained-petascale computing project supported by NSF Awards OCI-0725070 and ACI-1238993, the state of Illinois, and the “Computational Microscope” NSF PRAC Award ACI-1440026.
Conflict of interest statement
None declared.
References
- Ferrara C, Grau S, Jager C, Sondermann P, Brunker P, Waldhauer I, Hennig M, Ruf A, Rufer AC, Stihle M et al. . 2011. Unique carbohydrate-carbohydrate interactions are required for high affinity binding between Fc gamma RIII and antibodies lacking core fucose. Proc Nat Acad Sci, USA. 108:12669–12674. [DOI] [PMC free article] [PubMed] [Google Scholar]
- Humphrey W, Dalke A, Schulten K. 1996. VMD – visual molecular dynamics. J. Mol. Graphics. 14:33–38. [DOI] [PubMed] [Google Scholar]
- Kuttel M, Gain J, Burger A, Eborn I. 2006. Techniques for visualization of carbohydrate molecules. J Mol Graph Model. 25:380–388. [DOI] [PubMed] [Google Scholar]
- Pendrill R, Jonsson KHM, Widmalm G. 2013. Glycan synthesis, structure, and dynamics: A selection. Pure Appl Chem. 85:1759–1770. [Google Scholar]
- Pérez S, Tubiana T, Imberty A, Baaden M. 2015. Three-dimensional representations of complex carbohydrates and polysaccharides. SweetUnityMol: a video game based computer graphic software. Glycobiology. 25:483–491. [DOI] [PubMed] [Google Scholar]
- Shields RL, Lai J, Keck R, O'Connell LY, Hong K, Meng YG, Weikert SH, Presta LG. 2002. Lack of fucose on human IgG1 N-linked oligosaccharide improves binding to human Fcgamma RIII and antibody-dependent cellular toxicity. J Biol Chem. 277:26733–26740. [DOI] [PubMed] [Google Scholar]
- Varki A, Cummings R, Esko J, Freeze H, Hart G, Marth J. 1999. Essentials of Glycobiology, 1st Ed Plainview (NY), Cold Spring Harbor Laboratory Press. [PubMed] [Google Scholar]
- Varki A, Cummings RD, Aebi M, Packer NH, Seeberger PH, Esko JD, Stanley P, Hart G, Darvill A, Kinoshita T et al. . 2015. Symbol nomenclature for graphical representations of glycans. Glycobiology. 25:1323–1324. [DOI] [PMC free article] [PubMed] [Google Scholar]
- Woods-Group 2005. –2016. “GLYCAM Web (http://www.glycam.org)”


