Significance
The circadian clock coordinates our physiology. Circadian disruption, as occurs during shift work, increases the risk of chronic diseases. For infectious diseases, circadian regulation of systemic immunity seems to underpin “time-of-day” differences in responses to extracellular pathogens. However, circadian rhythms are cell autonomous, and their interaction with intracellular pathogens, such as viruses, is poorly understood. We demonstrate that time of day of virus infection has a major impact on disease progression, in cellular models as well as in animals, highlighting the key role that cellular clocks play in this phenomenon. Clock disruption leads to increased virus replication and dissemination, indicating that severity of acute infections is influenced by circadian timekeeping.
Keywords: circadian, clock, virus, herpes, influenza
Abstract
Viruses are intracellular pathogens that hijack host cell machinery and resources to replicate. Rather than being constant, host physiology is rhythmic, undergoing circadian (∼24 h) oscillations in many virus-relevant pathways, but whether daily rhythms impact on viral replication is unknown. We find that the time of day of host infection regulates virus progression in live mice and individual cells. Furthermore, we demonstrate that herpes and influenza A virus infections are enhanced when host circadian rhythms are abolished by disrupting the key clock gene transcription factor Bmal1. Intracellular trafficking, biosynthetic processes, protein synthesis, and chromatin assembly all contribute to circadian regulation of virus infection. Moreover, herpesviruses differentially target components of the molecular circadian clockwork. Our work demonstrates that viruses exploit the clockwork for their own gain and that the clock represents a novel target for modulating viral replication that extends beyond any single family of these ubiquitous pathogens.
Diverse behavioral, physiological, and cellular processes exhibit daily (circadian) rhythms, which persist without external timing cues. Cell autonomous biological clocks drive circadian rhythms observed at the whole organism level, enabling adaptation to the 24-h cycle produced by the Earth’s rotation (1). At the molecular level, circadian oscillations are thought to be generated by genetic feedback loops involving the activating transcription factors BMAL1 (ARNTL/Mop3), NPAS, and CLOCK. These drive transcription of repressor proteins CRYPTOCHROME1/2 (CRY1/2) and PERIOD1/2 (PER1/2) that feedback to repress their own transcription, additionally regulated by myriad posttranslational processes (2–4).
Circadian clocks confer competitive advantages to organisms. Their disruption incurs fitness costs, and they influence many aspects of human health and disease including sleep/wake cycles and immune function (5, 6). Indeed, many innate and adaptive immune responses are clock regulated. The immune response undergoes regeneration and repair as the host transitions to the resting phase of the daily cycle, but is primed for pathogen attack at the onset of the active phase (5, 6). Although changes in host responses to bacterial endotoxin or infection at different times of day have been reported (7, 8), the influence of host circadian clocks on progression of viral diseases is unknown. Here, we demonstrate dynamic host–virus interactions over the 24-h day and also show that genetic clock disruption augments virus replication in mice and cells.
Results
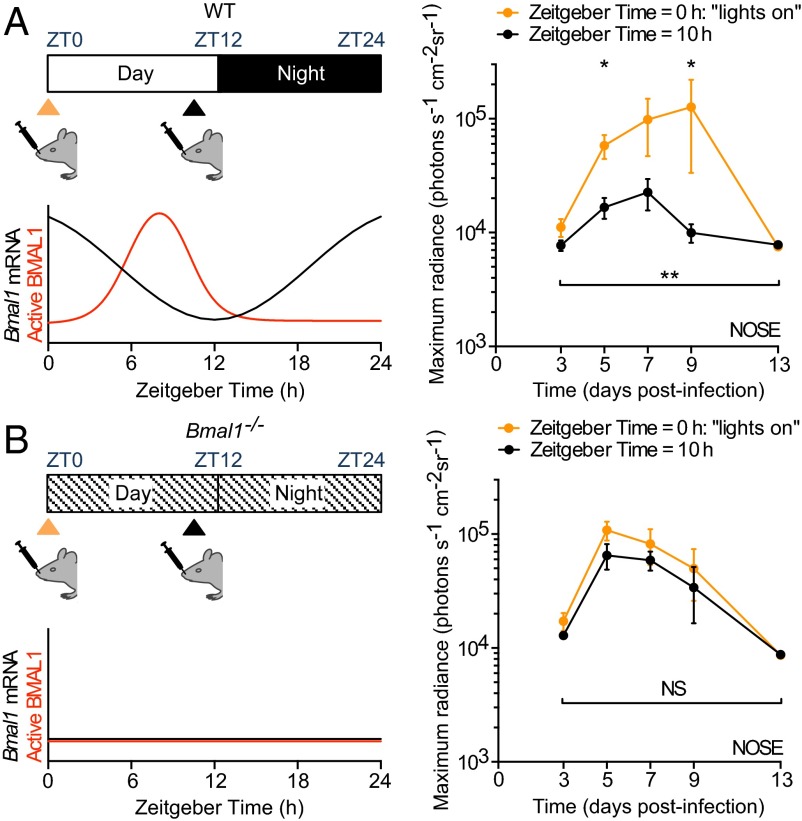
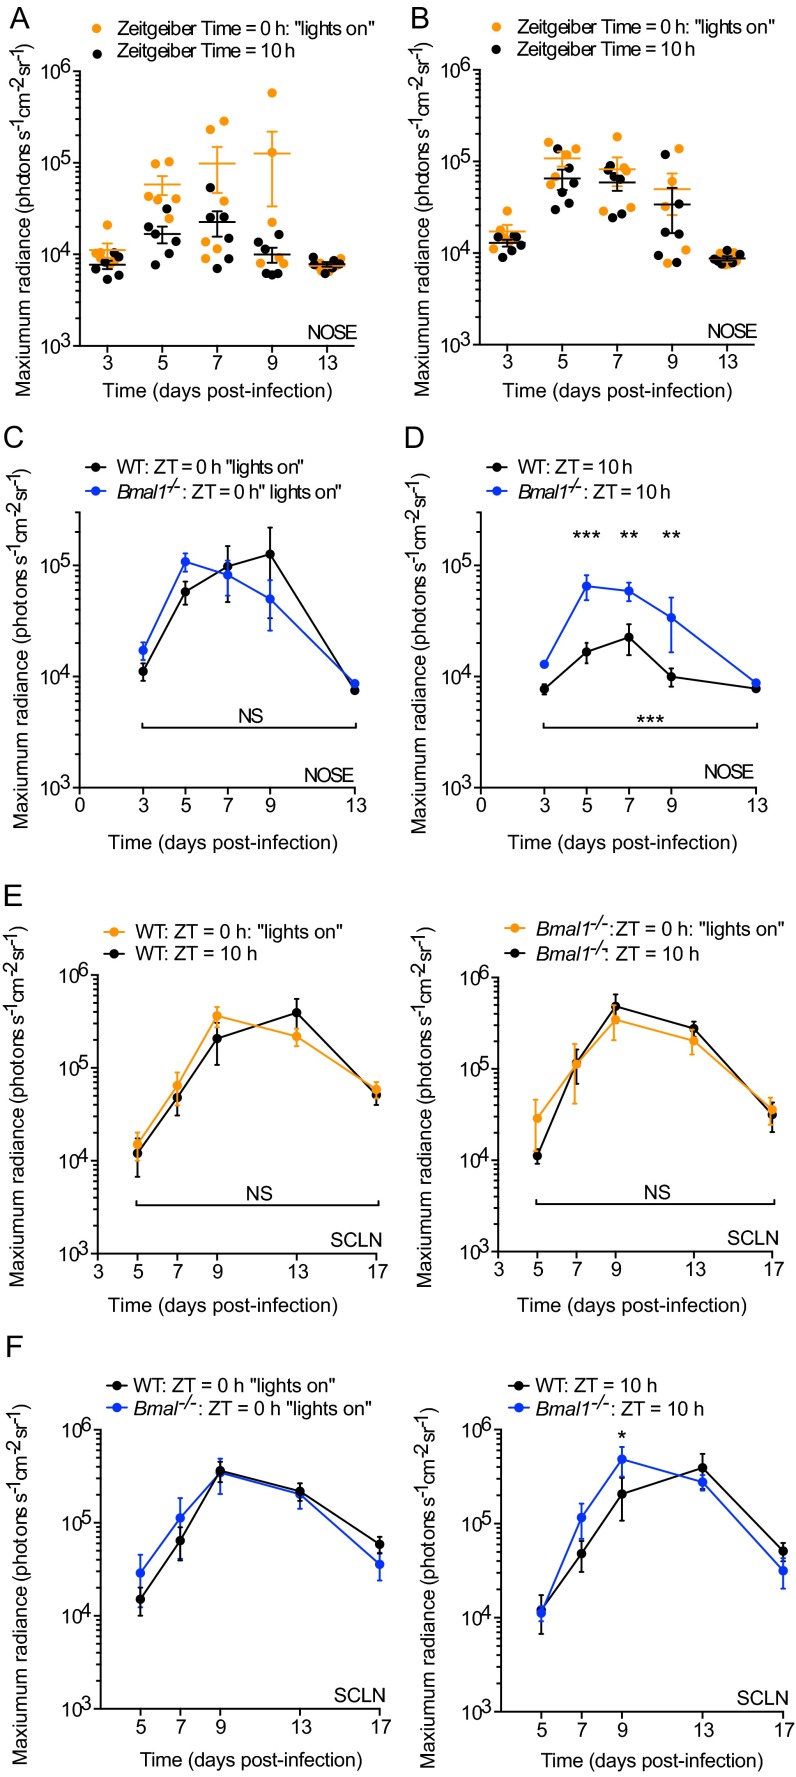
Viruses are obligate intracellular pathogens and require host organisms to proliferate. Over the course of a day, viruses may encounter host environments that are more or less conducive to replication and dissemination (5, 9, 10). We hypothesized that the time of day of infection would influence viral replication. To test this, we infected WT mice intranasally with a recombinant luciferase-expressing virus, Murid Herpesvirus 4 (M3:luc MuHV-4), at two times of day (Fig. 1A and Fig. S1A). As a rodent pathogen, this virus elicits natural host immune responses and implements evasion strategies in laboratory mice (11, 12), which allow it to establish latent (or quiescent) infection after primary infection. WT mice infected intranasally at the onset of resting phase [Zeitgeber Time 0 (ZT0); lights on], exhibited 10-fold higher viral replication than mice infected just before their active phase (ZT10) (Fig. 1A). This time-of-day effect required a functional clock because Bmal1–/– mice, which have no overt circadian rhythms (2), showed no difference when infected at different times (Fig. 1B and Fig. S1B). Furthermore, Bmal1–/– mice exhibited high levels of MuHV-4 infection when inoculated at either time of day (Fig. S1 C–F). Together, these results indicate that the timing of infection in relation the circadian cycle has major effects on herpesvirus pathogenesis.
Fig. 1.
Herpesvirus infection in mice is regulated by the circadian clock. (A) WT female mice were intranasally infected with M3:luciferase Murid Herpesvirus 4 (M3:luc MuHV-4) at Zeitgeber Time 0 (ZT0) (lights on; n = 6) or at ZT10 (n = 6). Schematic illustrates Bmal1 mRNA levels and active (genome-bound) BMAL1 protein over the day and night. Infection was monitored by bioluminescence imaging. Primary infection in the nose is higher in mice inoculated at the onset of the resting phase (ZT0) compared with infection before the active phase (ZT10) [mean ± SEM; two-way ANOVA (ZT of infection × time postinfection): ZT of infection effect, P = 0.0021; post hoc t tests, *P < 0.05]. See also Fig. S1A. (B) Female Bmal1−/− mice were infected with M3:luc MuHV-4 at either ZT0 (n = 5) or ZT10 (n = 6) and infection monitored as for A [mean ± SEM; two-way ANOVA (ZT of infection × time postinfection): ZT of infection effect, P > 0.05; NS = not significant). See also Fig. S1B.
Fig. S1.
M3:luc MuHV-4 infection in WT and Bmal1−/− mice infected at ZT0 vs. ZT10. (A) Individual subject plots from Fig. 1A. WT mice show higher levels of MuHV-4 infection at ZT0 vs. ZT10 (mean ± SEM; n = 6). (B) Individual subject plots from Fig. 1B. No significant difference in MuHV-4 pathogenesis is observed in Bmal1−/− mice infected at ZT0 (n = 5) and ZT10 (n = 6) (mean ± SEM). (C) No significant difference in MuHV-4 intranasal infection is observed between WT and Bmal1−/− mice infected at ZT0 [mean ± SEM; n = 5 (Bmal1−/− group), n = 6 (WT group); maximum radiance two-way ANOVA (genotype × time postinfection): genotype effect, P > 0.05; NS = not significant]. (D) MuHV-4 intranasal infection is significantly greater in Bmal1−/− mice vs. WT mice infected at ZT10 [mean ± SEM; n = 6; maximum radiance two-way ANOVA (genotype × time postinfection): genotype effect, ***P < 0.001; post hoc t test: **P < 0.01 ***P < 0.001]. (E) No significant difference in MuHV-4 infection of the SCLNs is observed between WT mice infected at ZT0 vs. ZT10 or between Bmal1−/− mice infected at ZT0 vs. ZT10 [maximum radiance two-way ANOVA (time of infection × time postinfection): time of infection effect, P > 0.05, NS = not significant]. (F) MuHV-4 SCLN infection in WT and Bmal1−/− mice infected at ZT0 and ZT10. SCLN infection is significantly higher in Bmal1−/− mice vs. WT infected at ZT10 on day 9 after infection (post hoc t test, *P < 0.05).
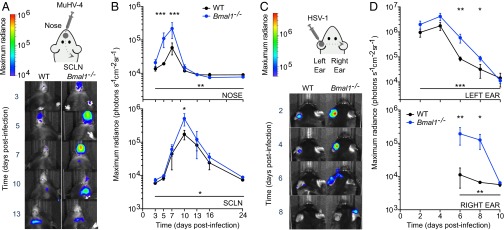
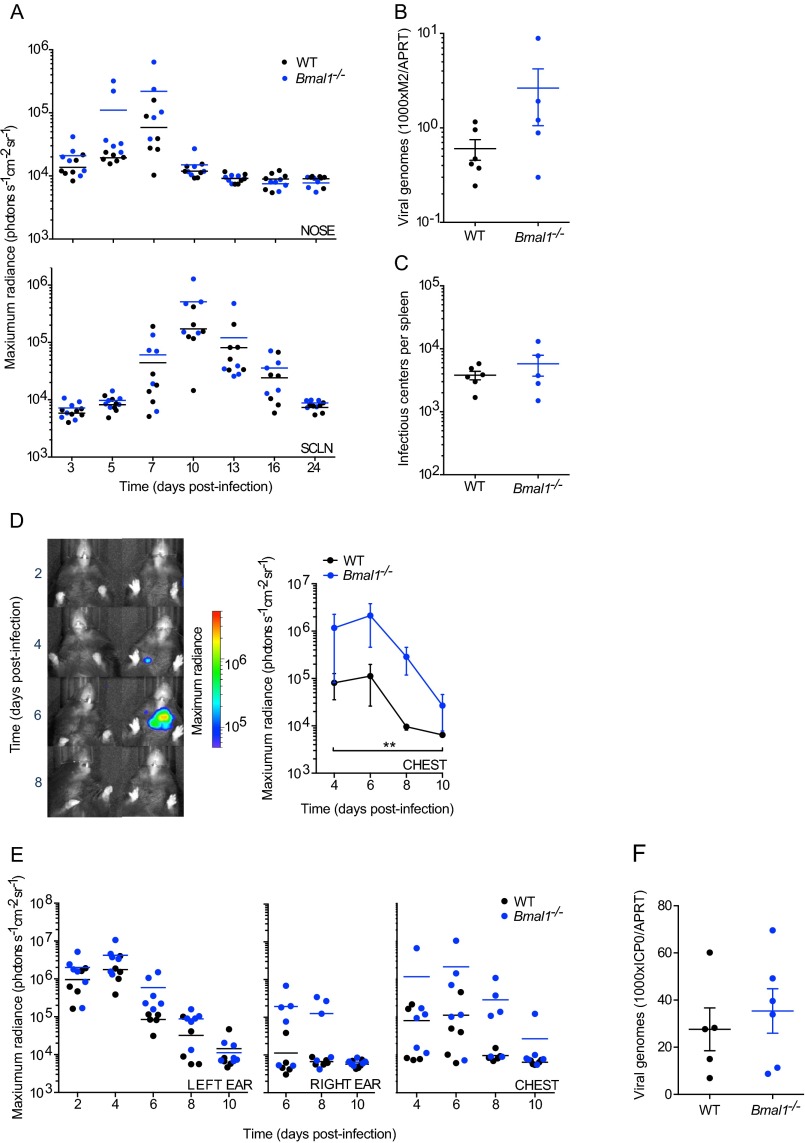
Because infection of Bmal1–/– mice resulted in high levels of virus replication in vivo (Fig. S1 D and F), we hypothesized that its role in clock function was important in regulating virus propagation. We therefore tracked M3:luc MuHV-4 infection longitudinally in WT and Bmal1–/– mice, infecting intranasally at ZT7: the time when BMAL1 is maximally active at genomic sites in peripheral tissues (9). Strikingly, virus replication increased greater than threefold at days 5–7 in Bmal1–/– mice compared with WT mice (Fig. 2 A and B and Fig. S2A). We saw a similar pattern when the acute infection spread to the superficial cervical lymph nodes (SCLNs) (Fig. 2 A and B). By contrast, latent infection was established to a similar extent in WT and Bmal1–/– mice (Fig. S2 B and C).
Fig. 2.
Herpesvirus infection is augmented in arrhythmic Bmal−/− mice. (A) WT (n = 6) and Bmal1−/− (n = 5) female mice were intranasally infected with M3:luc MuHV-4 at ZT7. Extent and spread of infection was monitored by bioluminescence imaging. Representative images are shown with overlaid bioluminescence radiance measurements. (B) M3:luc MuHV-4 progressively disseminates from the nose to the SCLNs and is significantly higher in Bmal1−/− mice [mean ± SEM; nose two-way ANOVA (genotype × time postinfection): genotype effect, P = 0.0031; SCLN two-way ANOVA (genotype × time postinfection): genotype effect, P = 0.0348; post hoc t tests: *P < 0.05, **P < 0.01, ***P < 0.001]. See also Fig. S2A. (C) Male WT (n = 5) and Bmal1−/− (n = 6) mice were infected with CMV:luciferase (CMV:luc) herpes simplex virus 1 (HSV-1) by scarification of the left ear at ZT7. Extent and spread of infection was monitored and images presented as for A. (D) CMV:luc HSV-1 progressively disseminates from the left ear to the head and right ear and is significantly higher in Bmal1−/− mice [mean ± SEM; left ear two-way ANOVA (genotype × time postinfection): genotype effect, P = 0.0004; right ear two-way ANOVA (genotype × time postinfection): genotype effect, P = 0.0054; post hoc t tests: *P < 0.05, **P < 0.01]. See also Fig. S2E.
Fig. S2.
M3:luc MuHV-4 and CMV:luc HSV-1 primary and latent infection in WT and Bmal1−/− mice. (A) Individual subject plots from Fig. 2B. During primary infection, MuHV-4 progressively spreads from the nose to SCLNs [mean ± SEM; n = 5 (Bmal1−/− group), n = 6 (WT group)]. Infection in the nose and SCLNs is significantly higher in Bmal1−/− mice vs. WT [nose maximum radiance two-way ANOVA (genotype × time postinfection): genotype effect, P = 0.0031; SCLN maximum radiance two-way ANOVA (genotype × time postinfection): genotype effect, P = 0.0348]. (B) Twenty-four days after infection, mice were culled. Latent viral genome loads in the spleen were analyzed by qPCR, which compares MuHV-4 M2 gene copy number with cellular APRT gene copy number (1000xM2/APRT) [mean ± SEM; n = 5 (Bmal1−/− group), n = 6 (WT group); two-tailed t-test P > 0.05; F-test, ***P = 0.0001]. See Methods for further details. (C) Reactivation of latent MuHV-4 in the spleen was assessed by the number infectious centers (plaques) on cell monolayers cocultured with ex vivo splenocytes [mean ± SEM; n = 5 (Bmal1−/− group), n = 6 (WT group); two-tailed t-test, P > 0.05; F-test, *P = 0.0228]. Thus, no statistically significant difference between mean values of MuHV-4 latent infection was observed by either infectivity assay. (D) Dissemination of HSV-1 infection from the left ear to the chest is significantly increased in Bmal1−/− mice vs. WT [chest maximum radiance two-way ANOVA (genotype × time postinfection): genotype effect, P = 0.0037]. (E) Individual subject plots from Fig. 2D. During primary infection, HSV-1 progressively spreads from the left ear to the right ear and chest [mean ± SEM; n = 5 (WT group); n = 6 (Bmal1−/− group)]. Infection in the left ear is significantly higher in Bmal1−/− mice vs. WT [maximum radiance two-way ANOVA (genotype × time postinfection): genotype effect P = 0.0004]. HSV-1 spreads to secondary sites more effectively in Bmal1−/− mice vs. WT: n = 4 of 6 Bmal1−/− mice showed substantial infection in the right ear, whereas this is evident in only n = 1 of 5 WT mice. Similarly, n = 5 of 6 Bmal1−/− mice showed dissemination of HSV-1 to the chest, vs. n = 3 of 5 WT mice. Virus infection in the chest is significantly increased in Bmal1−/− mice compared with WT [maximum radiance two-way ANOVA (genotype × time postinfection): genotype effect, P = 0.0037]. (F) Twenty-four days after infection, mice were culled. Viral genome loads in the dorsal root ganglion were analyzed by qPCR, which compares HSV-1 ICP0 gene copy number with cellular APRT gene copy number (1000xICP0/APRT). See Methods for further details. No statistically significant difference in HSV-1 latent genome load was observed (two-tailed t-test, P > 0.05).
To exclude that elevated infection levels were specific to MuHV-4, we infected mice with a different herpesvirus, herpes simplex virus 1 (HSV-1), by scarification of the left ear. We tracked the progression and extent of HSV-1 infection using a recombinant virus encoding luciferase under the control of the cytomegalovirus immediate early gene promoter (CMV:luc HSV-1) (13). Acute HSV-1 infection was significantly enhanced in arrhythmic Bmal1–/– mice (Fig. 2 C and D and Fig. S2 D and E), as with MuHV-4. As infection progressed, Bmal1–/– mice failed to contain HSV-1 spread, which disseminated across the head to the right ear (Fig. 2 C and D). As with MuHV-4, although acute infection was more severe when circadian rhythms were disrupted, latent infection was established to a similar extent in both genotypes. Although apparent trends toward higher numbers of latent viral genomes in Bmal1–/– mice was noted, this did not reach statistical significance (Fig. S2F), suggesting that circadian rhythms principally modulate primary infection in vivo.
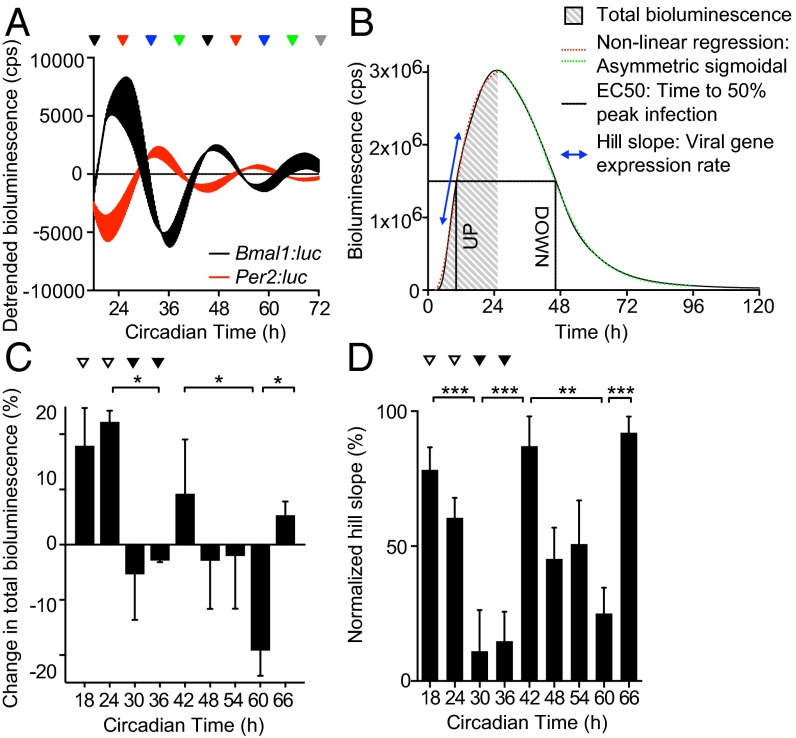
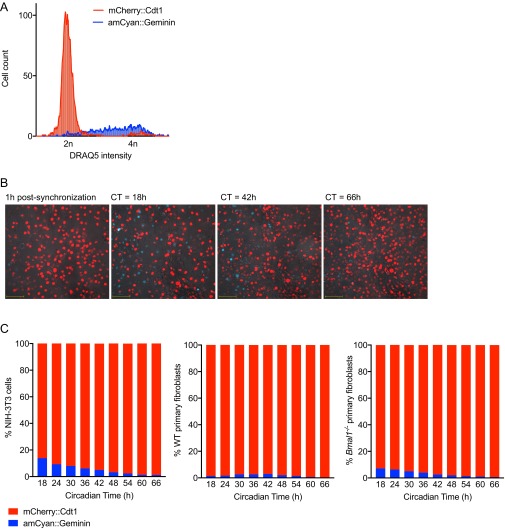
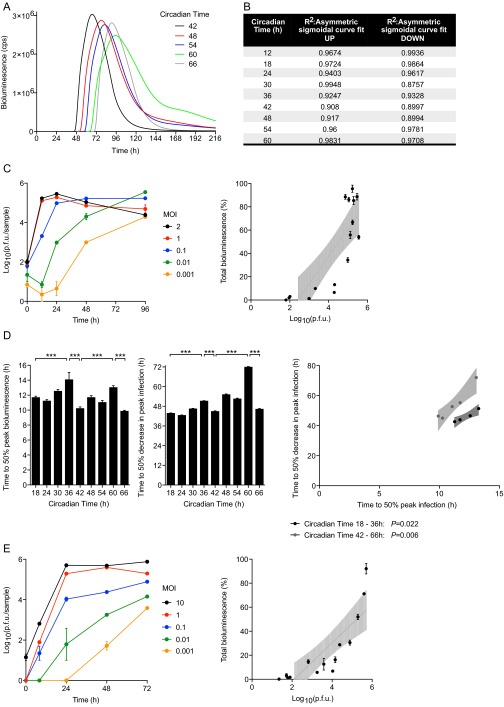
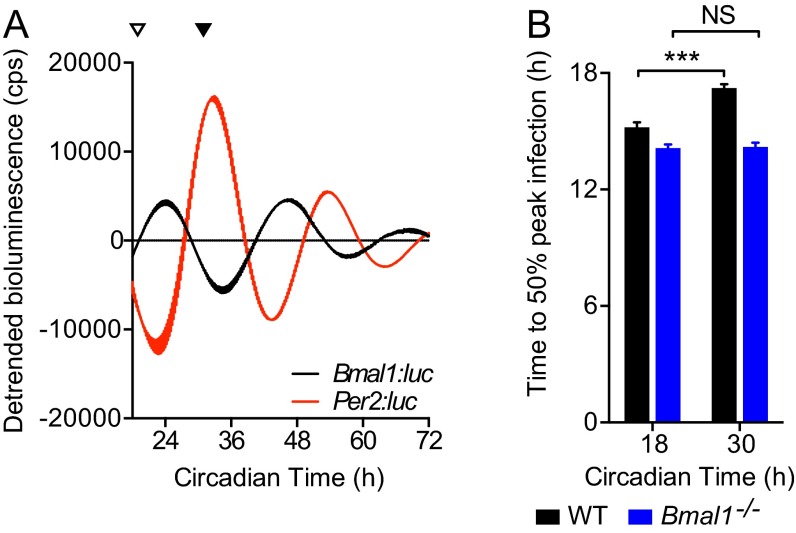
A more vigorous immune response to incoming virus at the onset of the active phase might oppose MuHV-4 infection at ZT10 in vivo. We therefore investigated virus replication at different circadian times in synchronized cell models, which display robust ∼24-h rhythms but are not subject to systemic immune regulation (Fig. 3A). For our in vitro cellular clock model, we used confluent monolayers in which there were limited numbers of dividing cells, and no detectable circadian rhythm in cell cycle activity after synchronization (Fig. S3 and Movie S1). We used high resolution real-time bioluminescence recording to monitor both M3:luc MuHV-4 replication kinetics and the amount of virus replication (measured by total bioluminescence) correlated with infectious particle production (Fig. 3B and Fig. S4 A–C). Strikingly, when cell populations were infected with MuHV4 at different times in vitro, the time-of-day effect on infection observed in mice was recapitulated (Fig. 3 C and D). Total bioluminescence was significantly increased in cells infected during the rising phase of Bmal1 expression (CT18–24, indicated by open arrowheads) compared with cells infected during decline of Bmal1 expression (CT30–36, indicated by solid arrowheads) (Fig. 3C). Moreover, MuHV-4 infection at different times significantly altered the rate of virus replication (Fig. 3D). Indeed, the entire kinetic profile of infection depended on the circadian phase the virus encountered, such that slower initial replication rates were associated with prolonged viral gene expression [Fig. 3D and Fig. S4D; Pearson’s r = 0.999 (first cycle) or r = 0.982 (second cycle), P < 0.01].
Fig. 3.
Circadian rhythms modulate herpesvirus replication in cells. (A) Bioluminescence recordings from control (uninfected) temperature-synchronized Bmal1:luciferase (Bmal1:luc) and Per2:luciferase (Per2:luc) circadian reporter NIH 3T3 cells (mean ± SEM; n = 3). Peak Bmal1:luc bioluminescence is designated Circadian Time 24 (CT24). Colored arrows indicate circadian times (CT) at which parallel cultures of synchronized NIH 3T3 cells were infected with M3:luc MuHV-4. (B) Representative bioluminescence recording and kinetic analysis parameters of M3:luc MuHV-4 replication using asymmetrical sigmoidal nonlinear regression. See Fig. S4 A and B for raw bioluminescence recordings obtained from cells infected at different CTs and R2 regression coefficients. (C) Amount of MuHV-4 replication varies significantly depending on the circadian time of infection (mean ± SEM; n = 3; one-way ANOVA: total bioluminescence, P = 0.0178; multiple comparisons, *P < 0.05). Total bioluminescence calculated by the area under curve method (AUC) and normalized (0% = baseline total bioluminescence between 0 and 1 h after fection, 100% = maximum total bioluminescence value), with variation across different CTs presented as (% total bioluminescence – mean % total bioluminescence across all experimental CTs). See Fig. S4C for correlation analysis of total bioluminescence and infectious particle production (log10 pfu). Open arrowheads highlight CT18/24 (higher infection) and solid arrowheads highlight CT30/36 (lower infection). (D) The rate of viral gene expression varies significantly depending on the circadian time of infection (one-way ANOVA: Hill slope, P < 0.0001; post hoc multiple comparisons: **P < 0.01, ***P < 0.001).
Fig. S3.
Replicative activity of confluent cell monolayers after synchronization. (A) Confluent NIH 3T3 cell monolayers stably transduced with dual FUCCI reporters amCyan::Geminin and mCherry::Cdt1 were trypsinized, stained with DNA dye DRAQ5, and analyzed by flow cytometry. mCherry::Cdt1 is expressed during G1 phase (2n DNA content), whereas amCyan::Geminin is expressed during S/G2 phase (2 < n ≤ 4 DNA content). (B) Representative images of confluent FUCCI reporter NIH 3T3 cell monolayers at different circadian times after synchronization (red indicates mCherry::Cdt1; blue indicates amCyan::Geminin; Movie S1). (C) Confluent FUCCI reporter NIH 3T3, primary WT, and Bmal1−/− fibroblast monolayers were synchronized and imaged between CT0–66 h (Movie S1). Cells expressing either amCyan::Geminin or mCherry::Cdt1 were counted at the stated CTs (n = 5 fields of view for each cell type; >300 cells observed per time point). Across all CTs, G2 phase amCyan::Geminin-positive cells accounted for 5.60 ± 1.4%, 1.70 ± 0.31%, and 3.35 ± 0.79% (mean ± SEM) of 3T3s, WT, and Bmal1−/− monolayers, respectively. Linear regression analysis shows a significant negative correlation between time after synchronization and % G2 phase amCyan::Geminin-positive cells for NIH 3T3 and Bmal1−/− fibroblasts, but not for WT fibroblasts (3T3s: R2 = 0.9223, Pearson r = −0.960, P < 0.001; Bmal1−/−: R2 = 0.965, Pearson r = −0.9780, P < 0.001; WT: R2 = 0.317, Pearson r = −0.563, P = 0.1145). Critically, for all three cell types, we could detect no circadian oscillation in the ratio of G1 to G2 phase cells. Damped sine wave modeling (nonlinear regression) yields best-fit period values >50 h (not within circadian range 18–30 h) and two-way ANOVA (cell cycle phase × circadian time): circadian time effect, P > 0.05. Additionally, comparison of cell cycle phase markers between WT and Bmal1−/− cell types at each circadian time by multiple two-tailed t tests revealed no significant results (FDR, Q = 1%).
Fig. S4.
Kinetics and total amount of MuHV-4 single-cycle replication are a function of the circadian time at which cells are infected. (A) Raw bioluminescence recordings from temperature-synchronized NIH 3T3 cells infected with M3:luc MuHV-4 at 6-h intervals from CT42 to CT66 (mean; n = 3). cps = counts per second. (B) Coefficients of determination (R2) for asymmetric sigmoidal nonlinear regression of data from Fig. 3. (C) Parallel cultures of primary WT fibroblasts were incubated with M3:luc MuHV-4 at different MOIs between 0.001 and 2 pfu per cell. After 2 h, cells were acid-washed to remove the input virus. Real-time bioluminescence was recorded and the amount of infectious MuHV-4 particles produced at 0, 12, 24, 48, and 96 h after infection was determined by plaque assay (mean ± SEM; n = 3). Over this range of MOI, total bioluminescence during exponential growth (AUC) linearly correlates with log10 pfu (linear regression analysis: R2 = 0.677, P < 0.0001; Pearson’s r = 0.823; a 23.56% difference in total bioluminescence, ∼10-fold change pfu). (D) Time to 50% peak infection and 50% decrease in peak infection varies significantly depending on the circadian time of infection (mean ± SEM; n = 3; one-way ANOVA: time to 50% peak infection P = 0.0002; one-way ANOVA: time to 50% decrease in peak infection, P < 0.0001; post hoc multiple comparisons: **P < 0.01 ***P < 0.001). Over each circadian cycle, there is a significant linear correlation between the time to 50% peak infection and the time to 50% decrease in peak infection [Pearson’s r = 0.999 (first cycle) P = 0.022; or r = 0.982 (second cycle) P = 0.006]. Infection is sustained less robustly at circadian times that yield more rapid viral gene expression initially, with the entire kinetic profile of infection depending on the circadian time of infection. (E) Parallel cultures of NIH 3T3 fibroblasts were incubated with CMV:luc HSV-1 at different MOIs between 0.001 and 10 pfu per cell. After 1 h, cells were acid-washed to remove the input virus. Real-time bioluminescence was recorded and the amount of infectious MuHV-4 particles produced at 0, 8, 24, 48, and 72 h after infection was determined by plaque assay (mean ± SEM; n = 3). Over this range of MOIs, total bioluminescence during exponential growth (AUC) linearly correlates with log10 pfu (linear regression analysis: R2 = 0.706, P = 0.0002; Pearson’s r = 0.840; 15.9% difference in total bioluminescence, ∼10-fold change pfu).
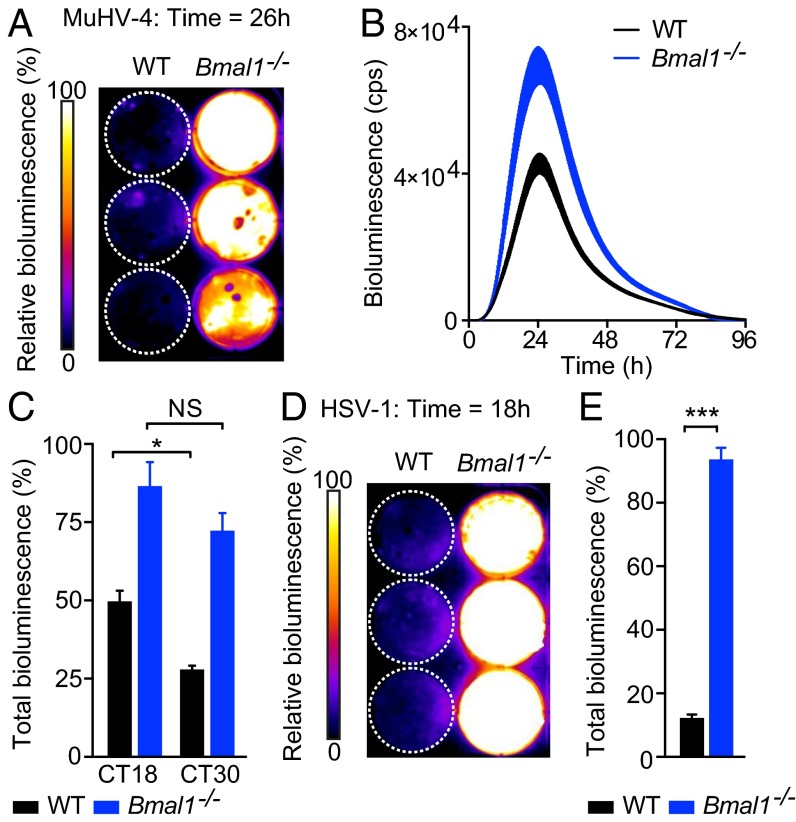
Moreover, in agreement with our in vivo observations, MuHV-4 infection was significantly increased in primary Bmal1–/– fibroblasts compared with WT cells (Fig. 4 A and B and Movie S2). When synchronized WT and Bmal1–/– fibroblasts were infected at different circadian times (Fig. S5A; CT of infection indicated by open and solid arrowheads), the time-of-day effect on MuHV-4 infection in WT cells was abolished in those from Bmal1–/– mice (Fig. 4C and Fig. S5B). Additionally, HSV-1 replication was significantly enhanced in Bmal1–/– cells compared with WT cells (Fig. 4 D and E and Movie S3). Thus, the cellular circadian clock exerts a major effect on herpesvirus infection, indicating that our observations in live mice do not simply result from circadian modulation of immune cell function.
Fig. 4.
Herpesvirus replication is enhanced in Bmal1−/− cells. (A) Pseudocolored bioluminescence image of WT and Bmal1−/− primary cells infected with M3:luc MuHV-4. See also Movie S2. (B) Representative bioluminescence recordings of synchronized WT and Bmal1−/− primary cells infected with M3:luc MuHV-4 (mean ± SEM; n = 3). (C) Synchronized WT and Bmal1−/− primary cells were infected with M3:luc MuHV-4 at either CT18 or CT30. MuHV-4 replication is significantly increased in Bmal1−/− cells compared with WT cells (mean ± SEM; n = 3) [total bioluminescence (AUC) normalized as for Fig. 3C; two-way ANOVA (genotype × CT of infection): genotype effect, P < 0.0001]. Time-of-day effect on viral replication is observed in WT cells, but not Bmal1−/− cells [total bioluminescence two-way ANOVA (genotype × CT of infection): post hoc multiple comparisons: NS = not significant, *P < 0.05). See Fig. S5 for circadian reporter controls and M3:luc MuHV-4 kinetic analysis. (D) Pseudocolored bioluminescence image of WT and Bmal1−/− primary cells infected with CMV:luc HSV-1. See also Movie S3. (E) CMV:luc HSV-1 replication is significantly increased in Bmal1−/− cells compared with WT cells (mean ± SEM; n = 3). Total bioluminescence (AUC) normalized as for Fig. 3C (two-tailed t test: ***P < 0.001). See Fig. S4E for correlation analysis of total bioluminescence and infectious particle production (log10 pfu).
Fig. S5.
Circadian time effect on MuHV-4 kinetics in WT but not Bmal1−/− cells. (A) Dexamethasone-synchronized mPeriod2:luciferase (Per2:luc) and Bmal1: luciferase (Bmal1:luc) circadian reporter fibroblasts (mean ± SEM; n = 3). Circadian controls for synchronization protocol used in Figs. 4C and 6 C and D. In Fig. 4C, dexamethasone-synchronized WT and Bmal1−/− primary cells were infected with M3:luc MuHV-4 at either CT18 (open arrowhead) or CT30 (solid arrowhead). (B) Kinetic analysis of experiment described in Fig. 4C. Kinetic analysis was performed as shown in Fig. 3B (R2 regression coefficients: WT CT18 = 0.9782, WT CT30 = 0.9932, Bmal1−/− CT18 = 0.9668, Bmal1−/− CT30 = 0.9768). Time to 50% peak infection is significantly decreased in Bmal1−/− cells compared with WT cells [two-way ANOVA (genotype × circadian time of infection): genotype effect, P < 0.0001]. Time-of-day effect on viral replication is observed in WT cells, but not Bmal1−/− cells [time to 50% peak infection two-way ANOVA (genotype × circadian time of infection): post hoc multiple comparisons: NS = not significant, ***P < 0.001].
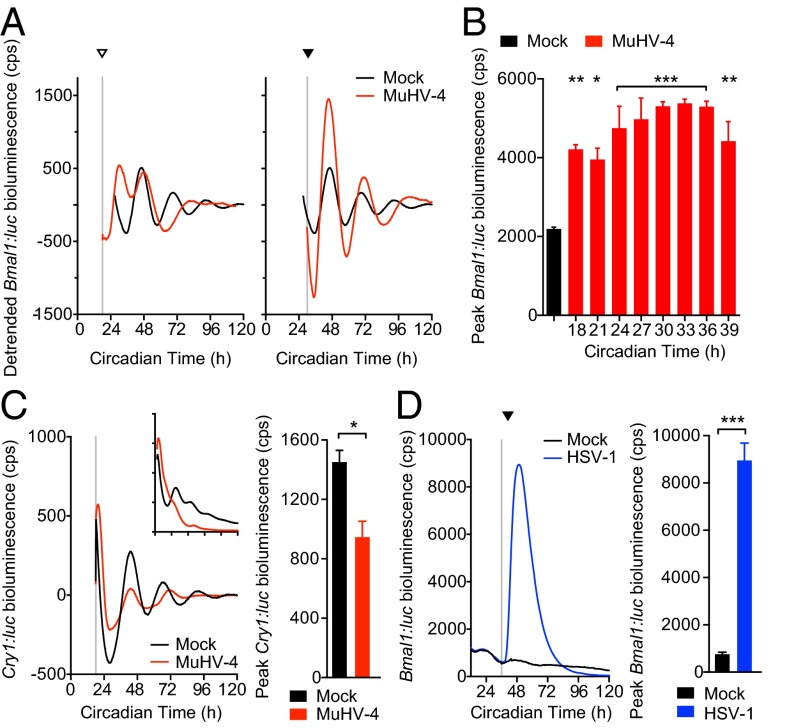
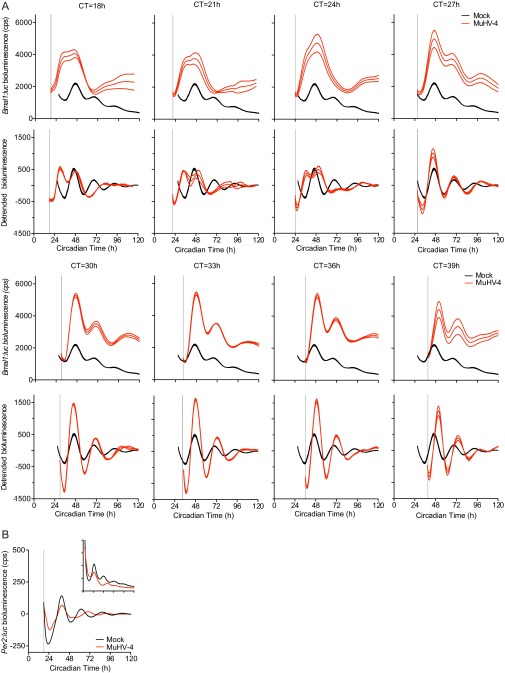
Given that cellular circadian rhythms impact on virus replication, we speculated that herpesviruses may manipulate the molecular clockwork during infection. To assess this, we infected mouse NIH 3T3 cells, expressing luciferase under the control of the Bmal1 promoter (Bmal:luc), with MuHV-4 at different circadian times (Fig. 5A and Fig. S6A). Interestingly, MuHV-4 acutely induced Bmal1 expression from ∼6 h after infection, irrespective of the circadian phase at which the cells were infected (one-way ANOVA: peak Bmal1:luc, P < 0.0001). The subsequent cellular circadian rhythms during viral infection depended on the time at which cells were infected. Virus-mediated Bmal1 induction during the endogenous fall in Bmal1 transcription generated a Bmal1 peak and disrupted circadian reporter expression (infection at CT18-24, indicated by open arrowhead in Fig. 5A and Fig. S5). In contrast, viral induction at other times (infection at CT30–36; indicated by solid arrowhead in Fig. 5A) enhanced the usual rise in Bmal1 transcription, and cellular rhythms remained robust for three cycles afterward (Fig. S6A). These findings strongly suggest that induction of Bmal1 expression by herpesviruses has different consequences for clock function depending on when in the circadian cycle infection occurs.
Fig. 5.
Virus infection differentially affects clock gene expression. (A) Bioluminescence recordings from synchronized Bmal1:luciferase (Bmal1:luc) circadian reporter NIH 3T3 cells either mock infected or infected with MuHV-4 at CT18 (open arrowhead) and CT30 (solid arrowhead). Mean baseline-subtracted (detrended) bioluminescence (n = 3 per group) shown. Infection at CT18 induced an additional peak in Bmal1:luc expression, disrupting the circadian rhythm. Infection at CT30 induced Bmal1:luc that synergizes with circadian Bmal1:luc expression and preserves rhythms. (B) Peak bioluminescence from synchronized Bmal1:luc cells either mock infected or infected with MuHV-4 at 3-h intervals from CT18 to CT39 (mean ± SEM; n = 3). Bmal1:luc expression is significantly increased, irrespective of the circadian time of infection (one-way ANOVA P < 0.0001; post hoc multiple comparisons: *P < 0.05, **P < 0.01, ***P < 0.001). For raw bioluminescence recordings and error boundaries, see Fig. S6A. (C) Baseline-subtracted (detrended) bioluminescence traces from synchronized mCryptochrome1:luciferase (Cry1:luc) circadian reporter NIH 3T3 cells (mean; n = 3). (Inset) Raw bioluminescence traces (mean ± SEM; n = 3). Cry1:luc is significantly decreased during MuHV-4 infection (postinfection peak bioluminescence two-tailed t test, *P = 0.0188). (D) Bioluminescence recording from synchronized Bmal1:luc cells mock infected or infected with HSV-1 at CT36 (solid arrowhead) (mean ± SEM; n = 3). Bmal1:luc expression is significantly increased during HSV-1 infection (postinfection peak bioluminescence two-tailed t test, ***P < 0.001).
Fig. S6.
MuHV-4 infection rapidly induces Bmal1 expression. (A) Raw and detrended (baseline-subtracted) bioluminescence recordings from synchronized Bmal1:luc circadian reporter NIH 3T3 cells either mock infected or infected with MuHV-4 at 3-h intervals from CT = 18 h to CT = 39 h. Gray lines indicate CT of infection. (Top) Raw Bmal1:luc bioluminescence recordings (counts per second) (mean ± SEM boundaries; n = 3). (Bottom) Detrended Bmal1:luc bioluminescence analysis (moving-average subtracted; mean± SEM boundaries; n = 3). Selected data are presented in Fig. 5A (infection at CT = 18 and 30 h), and peak Bmal1:luc bioluminescence data are summarized in Fig 5B. (B) Bioluminescence traces from synchronized Per2:luc circadian reporter NIH 3T3 cells (mean; n = 3) either mock infected or infected with MuHV-4 (gray line indicates CT of infection). (Inset) Raw bioluminescence traces (mean ± SEM).
Analogous to arrhythmic Bmal1–/– in vivo and cellular models, enhanced viral replication was observed in cells infected at circadian times when endogenous circadian rhythms were subsequently disrupted (Figs. 3 D and E and 5 A and B; indicated by open arrowheads). In mouse peripheral tissues that support herpesvirus replication, cellular CT24 corresponds to onset of the rest (light) period (14), where rapid, higher levels of initial replication would maximize the chance of transmission during the subsequent active (dark) phase 12–24 h later. Cellular CT36 corresponds to the onset of the active period, when slower, lower levels of replication would permit efficient transmission in the following active phase 24–36 h later and perhaps reduce detection at a time when the immune system is primed for pathogen attack.
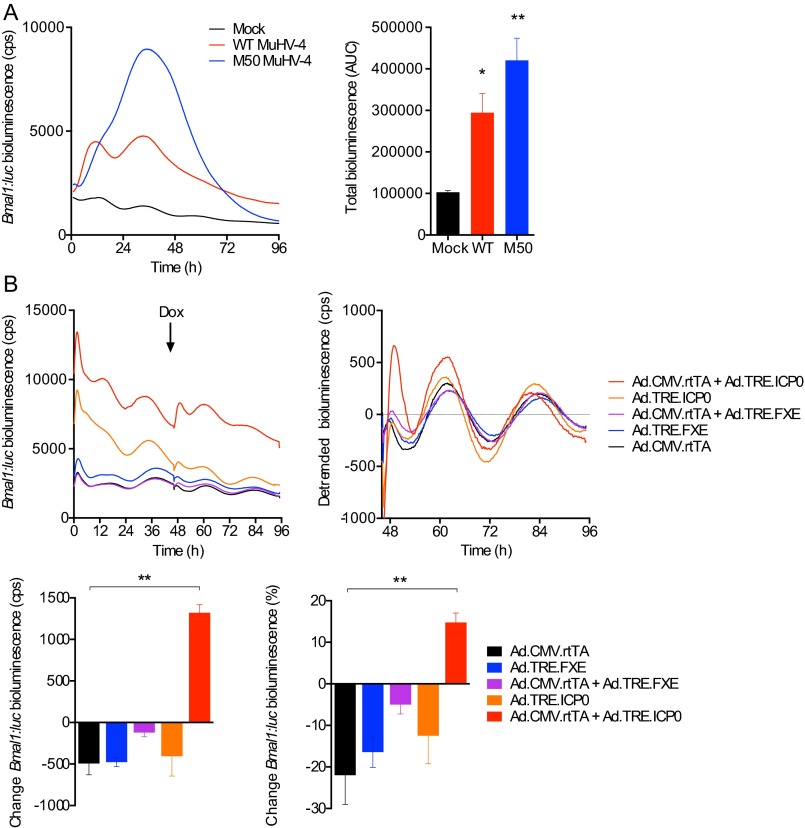
Critically, expression of repressive clock genes, such as mCryptochrome1 (mCry1) and mPeriod2 (mPer2), was not induced during viral infection (Fig. 5C and Fig. S6B), but a significant, rapid reduction was seen when cells were infected at CT18 (Fig. 5C). These findings are consistent with MuHV-4 infection ushering cells from a repressive circadian phase to one where BMAL1 is active, via sustaining Bmal1 expression and relieving CRYPTOCHROME-mediated repression. Furthermore, HSV-1 infection also acutely up-regulated Bmal1 (Fig. 5D), even more so than MuHV-4, suggesting that Bmal1 is specifically targeted by both α- and γ-herpesvirus families. In support of this, Bmal1 expression is induced in cells overexpressing viral transcriptional activators from either herpesviruses (Fig. S7), and interactions between BMAL1/CLOCK and several HSV-1 transcriptional activators in vitro have been reported previously (15, 16).
Fig. S7.
Bmal1 expression is induced in cells overexpressing herpesvirus transcriptional activators. (A) Synchronized NIH 3T3 cells expressing Bmal1:luc transcriptional reporter were either mock-infected or infected with WT MuHV-4 or M50 MHV-68, a recombinant virus that overexpresses ORF50, which encodes the main viral transcriptional transactivator. Bmal1:luc bioluminescence is significantly increased during M50 MuHV-4 infection compared with WT MuHV-4 or mock-infected controls (mean ± SEM; n = 3; one-way ANOVA: P = 0.0049; post hoc multiple comparisons: *P < 0.05, **P < 0.01). (B) An adenoviral Tet-On system was used to investigate whether the HSV-1 viral transactivator ICP0 can initiate Bmal1 transcription. Synchronized NIH 3T3 cells expressing the Bmal1:luc transcriptional reporter were infected with adenoviral constructs expressing rtTA from the HCMV IE promoter (Ad.CMV.rtTA), ICP0 under the control of a TRE promoter (Ad.TRE.ICP0), a nonfunctional RING-finger deletion mutant (FXE) of ICP0 under the control of a TRE promoter (Ad.TRE.FXE), or a combination thereof. Doxycycline (Dox) was added 46 h after infection to enable transcription from the TRE promoter if rtTA is present. ICP0 significantly increases Bmal1:luc (% change 3 h pre-Dox vs. 3 h post-Dox addition) compared with controls (mean ± SEM; n = 3; one-way ANOVA: P = 0.0038; post hoc multiple comparisons: **P < 0.01, ***P < 0.001).
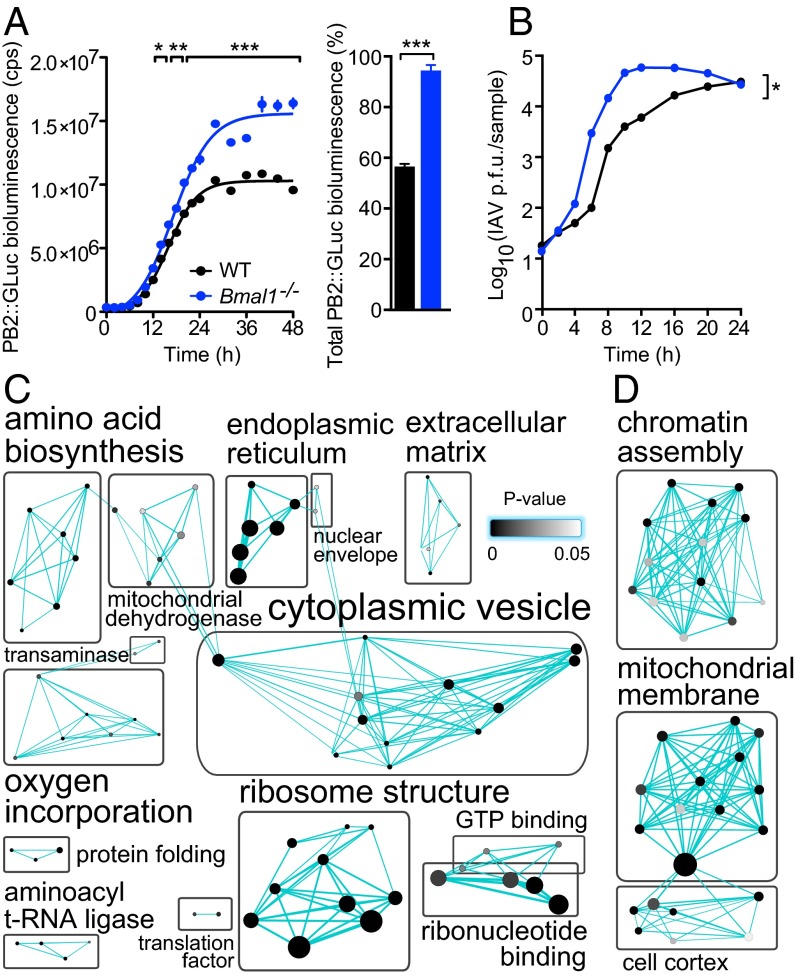
Herpesviruses co-opt cellular transcriptional mechanisms to replicate and target clock transcription factors (Fig. 5). We next asked if the impact of BMAL1 ablation on viral infection extended beyond direct transcriptional regulation, to the global changes in cellular physiology that occur when circadian rhythms are disrupted. To investigate this, we infected WT and Bmal1−/−cells with the orthomyxovirus, influenza A (IAV) (Fig. 6 A and B). IAV replicates within the nucleus but encodes its own RNA-dependent RNA polymerase and therefore does not directly use the host cell’s transcriptional machinery for viral gene expression, in contrast to herpesviruses. Remarkably, loss of BMAL1 also significantly augmented IAV protein expression and replication (PB2::GLUC bioluminescence two-way ANOVA: genotype effect, P = 0.0004; single-cycle growth two-way ANOVA: genotype effect, P = 0.0102). The similar impact of cellular arrhythmicity on two disparate, clinically relevant virus families implies a broader influence of circadian clocks, and specific components such as BMAL1, on viral infection.
Fig. 6.
Global proteomic comparison of WT and Bmal1−/− cells reveals clock-regulated pathways that impact on viral replication. (A) Influenza A viral protein expression was enhanced in Bmal1−/− cells. WT and Bmal1−/− cells were infected with PB2::GLUC (Gaussia luciferase) influenza A virus (IAV) and luciferase activity quantified at stated intervals. Rate of PB2 expression was increased in Bmal1−/− compared with WT cells [mean ± SEM; n = 3; two-way ANOVA (genotype × time postinfection): genotype effect, P = 0.0004; interaction, P < 0.0001; post hoc multiple comparisons: *P < 0.05, **P < 0.01, ***P < 0.001), as was total PB2 expression (sigmoidal nonlinear regression: WT R2 = 0.9902, Bmal−/− R2 = 0.9836; total PB2::GLUC bioluminescence (AUC) two-tailed Student t test: **P < 0.0019]. (B) Single-cycle IAV growth was enhanced in Bmal1−/− cells. IAV-infected cells were harvested and amount of infectious IAV particles determined by plaque assay [two-way ANOVA (genotype × time postinfection): genotype effect, *P = 0.0102]. (C) Synchronized WT and Bmal1−/− primary cells were harvested at CT18 and CT30 and global proteomics performed by LC coupled to MS (n = 3). DAVID functional annotation clustering analysis of proteins that significantly differed at CT18 vs. CT30, and significantly increased in Bmal1−/− cells compared with WT cells at both CT18 and CT30. Protein number represented by node size and cluster P value by node grayscale. Annotations were prescribed by the Markov cluster algorithm. Number of nodes per group represented by label size. See Fig. S8A for heat map analysis and Table S1 for enrichment scores. (D) Proteomics analysis performed as in C. DAVID functional annotation clustering analysis of proteins that significantly differed at CT18 vs. CT30 and significantly decreased in Bmal1−/− cells compared with WT cells at both CT18 and CT30. Proteins are represented as in C. See Fig. S8B for heat map analysis and Table S2 for enrichment scores.
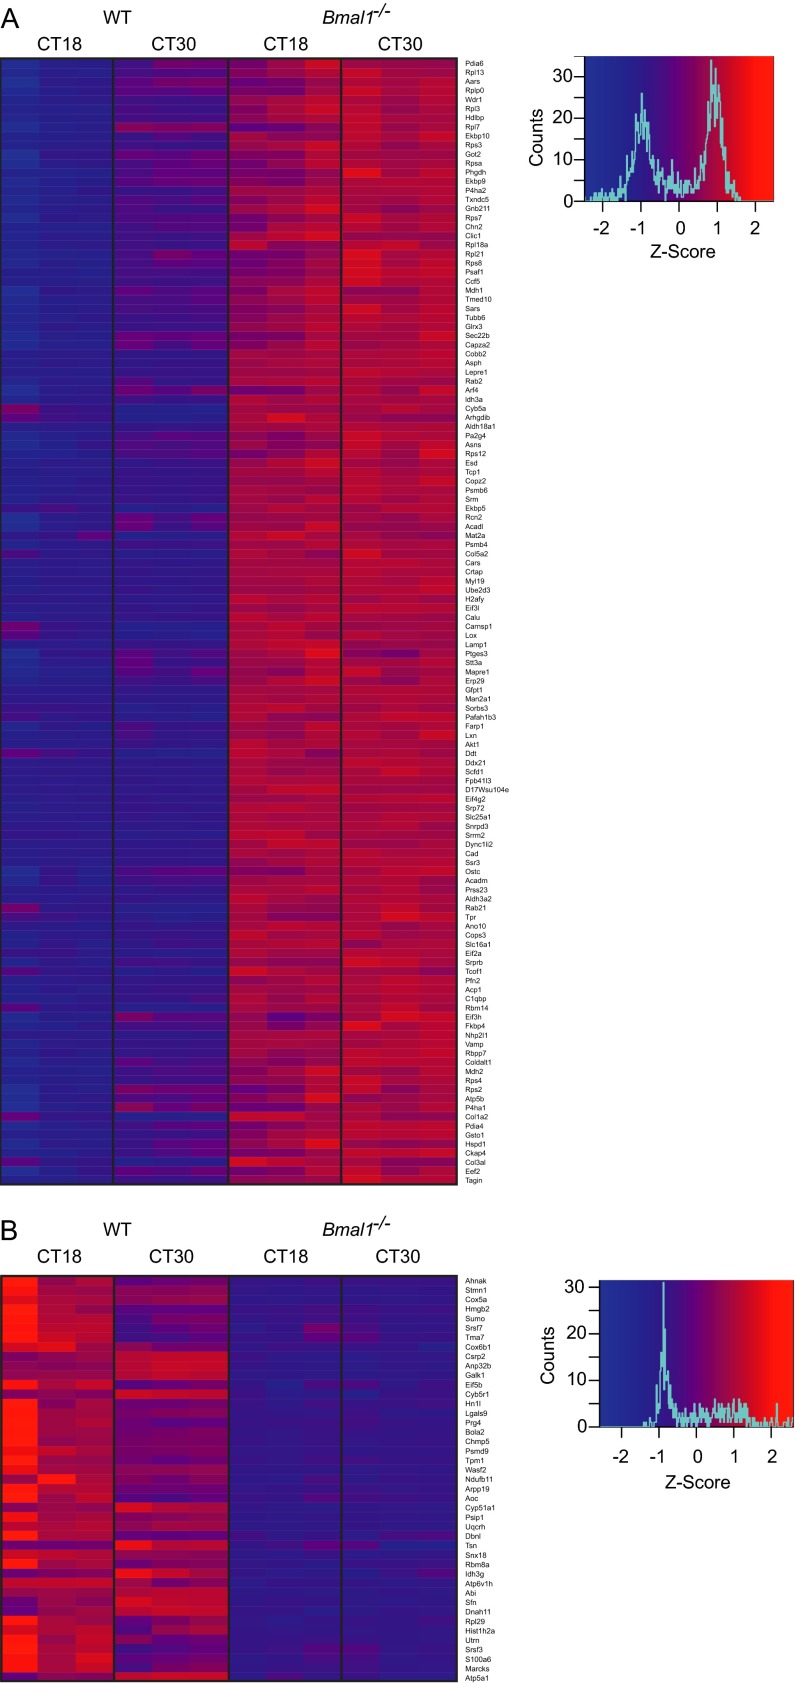
To determine which cellular systems underpin the time-of-day effect on viral replication, we first identified proteins that exhibit changes in abundance between opposite circadian phases (CT18 vs. CT30) in WT cells, when viral replication in WT, but not in Bmal1−/− cells, was significantly different (Fig. 4C). Given that virus infection is augmented in Bmal1−/− cells at both time points (Fig. 4C), we then focused on the subset of proteins within this group whose abundance was either increased or decreased at both of these times in Bmal1−/− cells compared with WT cells (Fig. 6 C and D and Fig. S8). Circadian-regulated proteins expressed at higher levels in Bmal1−/− cells were enriched for those involved in protein biosynthesis (Fig. 6C, Fig. S8A, and Table S1), including amino acid biosynthesis, ribosome structure, translation, and protein folding clusters. Additionally, proteins involved in endoplasmic reticulum function, protein localization, and intracellular vesicle trafficking were significantly enriched. These results indicate that enhanced capability for viral protein biosynthesis, assembly, and egress contribute to clock control of virus replication. Conversely, circadian-regulated proteins expressed at lower levels in Bmal1−/− cells were enriched for those involved in organization of the cortical actin cytoskeleton and chromatin assembly (Fig. 6D, Fig. S8B, and Table S2), suggesting that virus particle uncoating, genome trafficking, and histone association contribute to clock control of virus replication. Thus, clock-mediated effects on viral infection in cells can be ascribed to discrete functional categories of protein effectors targeting specific aspects of the virus replication cycle.
Fig. S8.
Proteins that show significantly different expression levels at between WT and Bmal1−/− cells. (A) Proteins whose abundance significantly changes at CT18 vs. CT30 and is significantly increased in Bmal1−/− cells compared with WT cells at both CT18 and CT30. See Fig. 6C and Table S1 for DAVID functional annotation clustering analysis. (B) Proteins whose abundance significantly changes at CT18 vs. CT30 and is significantly decreased in Bmal1−/− cells compared with WT cells at both CT18h and CT30. See Fig. 6D and Table S2 for DAVID functional annotation clustering analysis.
Table S1.
Enrichment cluster scores and P values of DAVID enrichment analysis
| Gene ontology term | Gene IDs | Fold enrichment | P |
| Enrichment Score: 7.333 | |||
| Endoplasmic reticulum part | RAB2B, FKBP9, ERP29, PDIA6, PDIA4, CALU, STT3A, P4HA2, P4HA1, TXNDC5, SEC22B, ASPH, FKBP10, SSR3, RCN2 | 7.88 | 5.13E-09 |
| Endoplasmic reticulum lumen | FKBP9, P4HA2, P4HA1, TXNDC5, ERP29, PDIA6, PDIA4, FKBP10, RCN2, CALU | 16.86 | 6.22E-09 |
| Endoplasmic reticulum | RAB2A, RAB2B, FKBP9, CKAP4, ERP29, PDIA6, PDIA4, SRPRB, ALDH3A2, CALU, SCFD1, STT3A, LEPRE1, P4HA2, P4HA1, TXNDC5, SEC22B, ASPH, FKBP10, RAB21, RCN2, SSR3 | 3.19 | 3.15E-06 |
| Enrichment Score: 7.235 | |||
| Translation | RPSA, CARS, RPL13, SARS, GM8730, AARS, EIF2A, EEF2, RPS2, RPS4X, RPS8, RPS7, RPS3, GM10653, EIF4G2, RPL7, GM6576, RPL18A, EIF3H, RPLP0, RPL21, RPS12, RPL3, EIF3L, TPR | 8.91 | 6.66E-15 |
| Structural constituent of ribosome | RPSA, RPL13, GM8730, RPS2, RPS4X, RPS8, RPS3, RPS7, GM10653, GM6576, RPL18A, RPL7, RPL21, RPLP0, RPS12, RPL3 | 11.62 | 1.78E-10 |
| Ribonucleoprotein complex | RPSA, RPL13, NHP2L1, SNRPD3, GM8730, EEF2, SRPRB, RPS2, RPS4X, RPS8, RPS7, RPS3, GM10653, PA2G4, RPL7, GM6576, RPL18A, RPLP0, SRRM2, RPL21, RPS12, RPL3, SRP72 | 5.52 | 7.52E-10 |
| Ribosome | RPSA, RPL13, GM8730, RPS2, RPS4X, RPS8, RPS3, RPS7, GM10653, GM6576, RPL18A, RPL7, RPL21, RPLP0, RPS12, RPL3 | 8.85 | 4.97E-09 |
| Structural molecule activity | RPSA, RPL13, GM8730, COL3A1, RPS2, RPS4X, COL5A2, RPS8, RPS7, RPS3, GM10653, COPB2, RPL7, GM6576, RPL18A, RPL21, RPLP0, RPS12, COL1A2, RPL3, TUBB6 | 5.29 | 1.30E-08 |
| Small ribosomal subunit | GM10653, RPSA, GM6576, RPS4X, RPS2, RPS3 | 20.93 | 8.47E-05 |
| Non–membrane-bounded organelle | DYNC1LI2, RPL13, NHP2L1, CAPZA2, TCOF1, RPS2, RPS3, MYL9, GM10653, AKT1, PFN2, SORBS3, RPL7, GM6576, RPLP0, RPL3, EIF3L, H2AFY, TUBB6, DDX21, RPSA, TCP1, GM8730, RPS4X, RPS8, FARP1, RPS7, PA2G4, RPL18A, RPL21, RPS12, SRP72, WDR1, MAPRE1 | 2.02 | 8.96E-05 |
| Ribosomal subunit | GM10653, RPSA, RPL7, GM6576, RPS4X, RPS2, RPS3 | 11.04 | 1.97E-04 |
| Enrichment Score: 5.729 | |||
| Endoplasmic reticulum lumen | FKBP9, P4HA2, P4HA1, TXNDC5, ERP29, PDIA6, PDIA4, FKBP10, RCN2, CALU | 16.86 | 6.22E-09 |
| Intracellular organelle lumen | FKBP9, NHP2L1, TCOF1, PDIA6, PDIA4, CALU, GOT2, P4HA2, P4HA1, SRRM2, EIF3L, DDX21, ACADM, ERP29, ACADL, RBBP7, PA2G4, C1QBP, TXNDC5, SRP72, HSPD1, RBM14, FKBP10, MDH2, RCN2 | 2.68 | 1.01E-05 |
| Enrichment Score: 3.707 | |||
| Glutamine family amino acid metabolic process | GOT2, ALDH18A1, GFPT1, PHGDH, ASNS, CAD | 17.24 | 2.29E-05 |
| Amine biosynthetic process | GOT2, ALDH18A1, MAT2A, SRM, PHGDH, ASNS, PSAT1 | 11.85 | 2.55E-05 |
| Cellular amino acid biosynthetic process | GOT2, ALDH18A1, MAT2A, PHGDH, ASNS, PSAT1 | 16.84 | 2.56E-05 |
| Carboxylic acid biosynthetic process | GOT2, PTGES3, ALDH18A1, MAT2A, PHGDH, ASNS, GSTO1, PSAT1 | 7.01 | 1.38E-04 |
| Nitrogen compound biosynthetic process | GOT2, ALDH18A1, MAT2A, SRM, ATP5B, PHGDH, ASNS, CAD, PSAT1 | 3.68 | 2.96E-03 |
| Aspartate family amino acid metabolic process | GOT2, PHGDH, ASNS | 16.84 | 1.33E-02 |
| Enrichment Score: 3.484 | |||
| Pigment granule | RAB2A, LAMP1, ERP29, TMED10, SEC22B, PDIA6, PDIA4, CALU | 11.43 | 5.73E-06 |
| Melanosome | RAB2A, LAMP1, ERP29, TMED10, SEC22B, PDIA6, PDIA4, CALU | 11.43 | 5.73E-06 |
| Cytoplasmic membrane-bounded vesicle | RAB2A, COPZ2, CAPZA2, ERP29, ESD, PDIA6, PDIA4, CALU, COPB2, LAMP1, TMED10, SEC22B, VAMP2, HSPD1, RAB21 | 4.40 | 6.37E-06 |
| Cytoplasmic vesicle | RAB2A, COPZ2, CAPZA2, ERP29, ESD, PDIA6, PDIA4, CALU, COPB2, LAMP1, TMED10, SEC22B, VAMP3, VAMP2, HSPD1, RAB21 | 3.82 | 1.48E-05 |
| Endomembrane system | COPZ2, RAB2B, CAPZA2, CLIC1, MAN2A1, COPB2, STT3A, TMED10, SEC22B, VAMP2, ASPH, TPR, RAB21, SSR3 | 3.18 | 3.97E-04 |
| Cytoplasmic vesicle membrane | COPZ2, COPB2, CAPZA2, TMED10, VAMP2, RAB21 | 8.37 | 7.12E-04 |
| Golgi apparatus part | COPZ2, COPB2, RAB2B, MAN2A1, TMED10, SEC22B, VAMP2, RAB21 | 4.28 | 2.54E-03 |
| Golgi apparatus | COPZ2, RAB2A, COPB2, RAB2B, MAN2A1, SCFD1, ARF4, TMED10, SEC22B, VAMP2, MAPRE1, RAB21 | 2.14 | 2.30E-02 |
| Enrichment Score: 3.081 | |||
| Protein folding | FKBP9, CCT5, TCP1, FKBP5, FKBP4, AARS, HSPD1, FKBP10 | 7.78 | 7.14E-05 |
| Peptidyl-prolyl cis-trans isomerase activity | FKBP9, FKBP5, FKBP4, FKBP10 | 14.33 | 2.61E-03 |
| Enrichment Score: 2.076 | |||
| Endomembrane system | COPZ2, RAB2B, CAPZA2, CLIC1, MAN2A1, COPB2, STT3A, TMED10, SEC22B, VAMP2, ASPH, TPR, RAB21, SSR3 | 3.18 | 3.97E-04 |
| Nuclear envelope-ER network | RAB2B, STT3A, SEC22B, ASPH, SSR3 | 3.79 | 4.18E-02 |
| Enrichment Score: 1.969 | |||
| Procollagen-proline dioxygenase activity | LEPRE1, P4HA2, P4HA1 | 53.73 | 1.27E-03 |
| Peptidyl-proline dioxygenase activity | LEPRE1, P4HA2, P4HA1 | 53.73 | 1.27E-03 |
| Oxidoreductase activity (paired donors) | LEPRE1, P4HA2, P4HA1, ASPH | 16.71 | 1.67E-03 |
| l-ascorbic acid binding | LEPRE1, P4HA2, P4HA1 | 18.80 | 1.07E-02 |
| Vitamin binding | GOT2, LEPRE1, P4HA2, P4HA1, PSAT1 | 5.18 | 1.55E-02 |
| Carboxylic acid binding | LEPRE1, P4HA2, P4HA1, CAD | 5.90 | 2.97E-02 |
| Enrichment Score: 1.946 | |||
| tRNA aminoacylation for protein translation | CARS, SARS, AARS, TPR | 10.74 | 5.93E-03 |
| tRNA aminoacylation | CARS, SARS, AARS, TPR | 10.74 | 5.93E-03 |
| Amino acid activation | CARS, SARS, AARS, TPR | 10.74 | 5.93E-03 |
| Ligase activity (aminoacyl-tRNA) | CARS, SARS, AARS, TPR | 10.45 | 6.41E-03 |
| Enrichment Score: 1.903 | |||
| Endomembrane system | COPZ2, RAB2B, CAPZA2, CLIC1, MAN2A1, COPB2, STT3A, TMED10, SEC22B, VAMP2, ASPH, TPR, RAB21, SSR3 | 3.18 | 3.97E-04 |
| Golgi apparatus part | COPZ2, COPB2, RAB2B, MAN2A1, TMED10, SEC22B, VAMP2, RAB21 | 4.28 | 2.54E-03 |
| Golgi membrane | COPZ2, COPB2, RAB2B, MAN2A1, SEC22B, RAB21 | 5.32 | 5.23E-03 |
| Protein transport | RAB2A, COPZ2, RAB2B, ERP29, COPB2, SCFD1, ARF4, TMED10, SEC22B, SRP72, TPR, RAB21, SSR3 | 2.47 | 5.91E-03 |
| Protein localization | RAB2A, COPZ2, RAB2B, ERP29, COPB2, SCFD1, ARF4, TMED10, SEC22B, SRP72, TPR, GNB2L1, RAB21, SSR3 | 2.30 | 7.19E-03 |
| Vesicle-mediated transport | COPZ2, RAB2A, COPB2, RAB2B, SCFD1, ARF4, TMED10, SEC22B, VAMP3, VAMP2 | 2.65 | 1.26E-02 |
| Golgi apparatus | COPZ2, RAB2A, COPB2, RAB2B, MAN2A1, SCFD1, ARF4, TMED10, SEC22B, VAMP2, MAPRE1, RAB21 | 2.14 | 2.30E-02 |
| Intracellular protein transport | COPZ2, RAB2A, COPB2, TMED10, SRP72, TPR, SSR3 | 3.13 | 2.37E-02 |
| Enrichment Score: 1.597 | |||
| Cofactor binding | GOT2, ACADM, PHGDH, ACADL, PSAT1, IDH3A, MDH1 | 3.88 | 9.02E-03 |
| Coenzyme binding | ACADM, PHGDH, ACADL, IDH3A, MDH1 | 3.92 | 3.80E-02 |
| NAD or NADH binding | PHGDH, IDH3A, MDH1 | 8.55 | 4.72E-02 |
| Enrichment Score: 1.596 | |||
| Nucleotide binding | DYNC1LI2, ALDH18A1, ATP5B, FKBP4, ASNS, CAD, AKT1, UBE2D3, TUBB6, DDX21, TPR, RAB21, RAB2A, RAB2B, CARS, TCP1, ACADM, MAT2A, SARS, AARS, EEF2, SRPRB, ACADL, IDH3A, CCT5, ARF4, PHGDH, HSPD1, RBM14, MDH1 | 1.72 | 2.56E-03 |
| Purine nucleotide binding | DYNC1LI2, ALDH18A1, ATP5B, FKBP4, ASNS, CAD, AKT1, UBE2D3, TUBB6, DDX21, TPR, RAB21, RAB2A, RAB2B, CARS, TCP1, ACADM, MAT2A, SARS, AARS, EEF2, SRPRB, ACADL, CCT5, ARF4, HSPD1 | 1.74 | 5.06E-03 |
| Ribonucleotide binding | RAB2A, RAB2B, TCP1, CARS, DYNC1LI2, ALDH18A1, MAT2A, SARS, ATP5B, FKBP4, AARS, ASNS, CAD, EEF2, SRPRB, AKT1, UBE2D3, CCT5, ARF4, TUBB6, DDX21, HSPD1, TPR, RAB21 | 1.68 | 1.20E-02 |
| Enrichment Score: 1.591 | |||
| Organelle membrane | COPZ2, RAB2B, ALDH18A1, ATP5B, CAPZA2, ALDH3A2, GOT2, COPB2, MAN2A1, STT3A, TMED10, SEC22B, SLC25A1, VAMP2, HSPD1, ASPH, RAB21, MDH2, SSR3 | 2.85 | 8.52E-05 |
| Mitochondrial matrix | GOT2, ACADM, C1QBP, HSPD1, ACADL, MDH2 | 4.47 | 1.07E-02 |
| Mitochondrial part | GOT2, ACADM, ALDH18A1, C1QBP, ATP5B, SLC25A1, HSPD1, ACADL, ALDH3A2, MDH2 | 2.32 | 2.71E-02 |
| Mitochondrial inner membrane | GOT2, ALDH18A1, ATP5B, SLC25A1, HSPD1, ALDH3A2, MDH2 | 2.87 | 3.40E-02 |
| Enrichment Score: 1.458 | |||
| Collagen | COL3A1, COL1A2, LOX, COL5A2 | 25.56 | 4.64E-04 |
| Collagen fibril organization | P4HA1, COL3A1, LOX, COL5A2 | 23.53 | 6.01E-04 |
| SMAD binding | COL3A1, COL1A2, COL5A2 | 18.80 | 1.07E-02 |
| Extracellular matrix structural constituent | COL3A1, COL1A2, COL5A2 | 12.54 | 2.33E-02 |
| Enrichment Score: 1.404 | |||
| Energy derivation by oxidation | PTGES3, AKT1, IDH3A, MDH2, MDH1 | 6.30 | 7.95E-03 |
| Tricarboxylic acid cycle | IDH3A, MDH2, MDH1 | 16.11 | 1.45E-02 |
| Acetyl-CoA catabolic process | IDH3A, MDH2, MDH1 | 15.44 | 1.57E-02 |
| Aerobic respiration | IDH3A, MDH2, MDH1 | 13.73 | 1.96E-02 |
| Coenzyme catabolic process | IDH3A, MDH2, MDH1 | 12.78 | 2.25E-02 |
| Acetyl-CoA metabolic process | IDH3A, MDH2, MDH1 | 11.95 | 2.55E-02 |
| Cofactor catabolic process | IDH3A, MDH2, MDH1 | 11.58 | 2.70E-02 |
| Enrichment Score: 1.363 | |||
| Energy derivation | PTGES3, AKT1, IDH3A, MDH2, MDH1 | 6.30 | 7.95E-03 |
| Hexose metabolic process | PTGES3, AKT1, MAN2A1, MDH2, MDH1 | 3.65 | 4.70E-02 |
| Enrichment Score: 1.332 | |||
| Vesicle-mediated transport | COPZ2, RAB2A, COPB2, RAB2B, SCFD1, ARF4, TMED10, SEC22B, VAMP3, VAMP2 | 2.65 | 1.26E-02 |
| Exocytosis | SCFD1, TMED10, VAMP3, VAMP2 | 4.49 | 5.85E-02 |
| Enrichment Score: 1.109 | |||
| GTP binding | RAB2A, RAB2B, FKBP4, ARF4, TUBB6, EEF2, SRPRB, RAB21 | 2.83 | 2.21E-02 |
| Guanyl nucleotide binding | RAB2A, RAB2B, FKBP4, ARF4, TUBB6, EEF2, SRPRB, RAB21 | 2.76 | 2.49E-02 |
| Guanyl ribonucleotide binding | RAB2A, RAB2B, FKBP4, ARF4, TUBB6, EEF2, SRPRB, RAB21 | 2.76 | 2.49E-02 |
| Enrichment Score: 0.089 | |||
| Regulation of translation | AKT1, EIF4G2, PA2G4, EIF2A | 4.94 | 4.64E-02 |
DAVID functional annotation clustering analysis for candidate proteins whose abundance significantly changes at CT18 vs. CT30 and is significantly increased in Bmal1−/− cells compared with WT cells at both CT18 and CT30. Gene ontology terms with P < 0.05 shown. See Fig. 6C for diagrammatic presentation of results.
Table S2.
Enrichment cluster scores and P values of DAVID enrichment analysis
| Gene ontology term | Gene IDs | Fold enrichment | P |
| Enrichment Score: 2.235 | |||
| Hydrogen ion transmembrane transporter activity | UQCRH, COX6B1, ATP6V1H, ATP5A1, COX5A | 22.51 | 6.10E-05 |
| Generation of precursor metabolites and energy | NDUFB11, IDH3G, UQCRH, ATP6V1H, ATP5A1 | 7.44 | 3.92E-03 |
| Mitochondrial inner membrane | NDUFB11, UQCRH, COX6B1, ATP5A1, COX5A | 6.81 | 5.19E-03 |
| Oxidative phosphorylation | UQCRH, ATP6V1H, ATP5A1 | 20.80 | 8.60E-03 |
| Mitochondrial membrane | NDUFB11, UQCRH, COX6B1, ATP5A1, COX5A | 5.48 | 1.10E-02 |
| Mitochondrial envelope | NDUFB11, UQCRH, COX6B1, ATP5A1, COX5A | 5.16 | 1.36E-02 |
| Organelle membrane | NDUFB11, UQCRH, COX6B1, ATP6V1H, ATP5A1, COX5A | 2.99 | 4.15E-02 |
| Enrichment Score: 2.219 | |||
| Nucleosome | HIST1H2AB, HIST1H2AA, HIST1H2AF, HIST1H2AD, HIST1H2AH, HIST3H2A | 26.02 | 4.28E-04 |
| Protein-DNA complex | HIST1H2AB, HIST1H2AA, HIST1H2AF, HIST1H2AD, HIST1H2AH, HIST3H2A | 21.51 | 7.49E-04 |
| Nucleosome assembly | HIST1H2AB, HIST1H2AA, HIST1H2AF, HIST1H2AD, HIST1H2AH, HIST3H2A | 21.27 | 7.90E-04 |
| Chromatin assembly | HIST1H2AB, HIST1H2AA, HIST1H2AF, HIST1H2AD, HIST1H2AH, HIST3H2A | 20.71 | 8.55E-04 |
| DNA packaging | HIST1H2AB, HIST1H2AA, HIST1H2AF, HIST1H2AD, HIST1H2AH, HIST3H2A | 15.38 | 2.02E-03 |
| Cellular macromolecular complex subunit organization | HIST1H2AB, HIST1H2AA, HIST1H2AF, HIST1H2AD, HIST1H2AH, HIST3H2A, STMN1 | 7.92 | 3.13E-03 |
| Chromosome | HIST1H2AB, HMGB2, HIST1H2AA, HIST1H2AF, HIST1H2AD, HIST1H2AH, HIST3H2A | 5.34 | 1.21E-02 |
| Enrichment Score: 2.012 | |||
| Lamellipodium | DBNL, WASF2, ABI2, ABI1 | 25.61 | 4.49E-04 |
| Cell leading edge | DBNL, WASF2, ABI2, ABI1 | 14.41 | 2.38E-03 |
| Cytoskeleton | DBNL, UTRN, WASF2, ABI2, ABI1, MARCKS, STMN1, TPM1 | 2.88 | 1.49E-02 |
| Cell projection | DBNL, UTRN, WASF2, ABI2, ABI1 | 3.51 | 4.70E-02 |
| Enrichment Score: 1.834 | |||
| Non–membrane-bounded organelle | HIST1H2AB, DBNL, HMGB2, HIST1H2AA, HIST1H2AF, HIST1H2AD, WASF2, UTRN, ABI2, GM5218, ABI1, TPM1, RPL29, HIST1H2AH, GM10709, MARCKS, HIST3H2A, STMN1 | 2.94 | 2.30E-04 |
| Cytoskeletal protein binding | DBNL, UTRN, WASF2, MARCKS, STMN1, TPM1 | 5.35 | 4.30E-03 |
| Actin binding | DBNL, UTRN, WASF2, MARCKS, TPM1 | 6.41 | 6.67E-03 |
| Cytoskeleton | DBNL, UTRN, WASF2, ABI2, ABI1, MARCKS, STMN1, TPM1 | 2.88 | 1.49E-02 |
| Cell cortex | DBNL, UTRN, MARCKS | 9.60 | 3.65E-02 |
| Enrichment Score: 1.494 | |||
| Oxidative phosphorylation | UQCRH, ATP6V1H, ATP5A1 | 20.80 | 8.60E-03 |
| Phosphorylation | GALK1, UQCRH, ABI2, ATP6V1H, ABI1, ATP5A1 | 3.24 | 3.17E-02 |
| Enrichment Score: 0.536 | |||
| Oxidation reduction | CYB5R1, NDUFB11, IDH3G, UQCRH, AOC2, AOC3 | 3.47 | 2.47E-02 |
DAVID functional annotation clustering analysis for proteins whose abundance significantly changes at CT18 vs. CT30 and is significantly decreased in Bmal1−/− cells compared with WT cells at both CT18 and CT30. Gene ontology terms with P < 0.05 shown. See Fig. 6D for diagrammatic presentation of results.
Discussion
Our results show that altering only the time when hosts are infected significantly affects the extent of virus infection and dissemination in vivo, reflecting the profound change in physiology that naturally occurs over a day. Host circadian rhythms underpin this phenomenon, because behaviorally arrhythmic mice show no such time-dependent differences. Indeed, the degree to which these intracellular pathogens replicate is a function of circadian time in isolated cells, without systemic circadian cues or host defenses.
For pathogens such as Plasmodia, which cause malaria, synchronizing their replication cycle with host circadian rhythms contributes to their success (17). Likewise, we speculate that coevolution of viruses with their host clocks enables them to capitalize on the predictability of daily rhythms driven by cell autonomous molecular clocks. Comparable to our findings with herpesviruses, rhythmic gene expression can persist during hepatitis C virus and influenza A virus infection, albeit with altered circadian phase and amplitude (18, 19). Whether such changes to host circadian rhythms enhance virus propagation between cells or transmission between hosts are open questions.
A key feature of cellular clocks is their ability to synchronize to external stimuli: initial time-of-day effects would be amplified if dysregulated timekeeping cues perpetuate from infected to neighboring uninfected cells. Our results strongly suggest that herpesvirus and IAV replication increases in arrhythmic cells, as demonstrated by virus-induced disruption at certain circadian times or via loss of BMAL1. However, does this help or hinder persistence at the level of the host or population? HSV-1 disseminates more extensively in Bmal1−/− mice, for example, but augmented primary productive replication may generate more robust adaptive immune responses.
How do viruses engage with the molecular clockwork and modulate timekeeping? At the simplest level, the circadian activity of host metabolic and trafficking pathways places constraints on replication. In turn, many viruses reprogram cellular metabolism, which can feedback directly to the core clock mechanism. A more intriguing possibility is that viruses actively gauge the cellular circadian phase via interaction with core clock components and exploit subsequent circadian variation in replication kinetics. The HSV-1 viral transactivator infected cell polypeptide 0 (ICP0) is thought to associate directly with BMAL1, whereas viral transcription is driven by a complex containing CLOCK (15, 16, 20). However, why not associate with CLOCK directly and why use BMAL/CLOCK at all? The abundance of CLOCK does not oscillate, and its circadian function is bestowed via interaction with BMAL1. We propose that herpesviruses recruit BMAL/CLOCK to lock viral transcription to cellular circadian time.
We found that ICP0 induces Bmal1 expression outside the context of infection, implying that Bmal1 is specifically targeted, rather than a cell-intrinsic innate immune response to infection. However, this presents an apparent paradox, given that replication is enhanced in the absence of BMAL1. Why induce a protein that appears to exert an antiviral effect? Shifting cells from a repressive circadian phase via concomitant acute induction of Bmal1 and mCry1 repression likely stimulates replication. One straightforward explanation is that chronic arrhythmicity in Bmal1−/− cells generates a cellular environment less equipped to deal with viral challenge or that baseline levels of BMAL1 contribute to cell intrinsic antiviral immune responses (e.g., via IFN signaling). Examining viral pathogenicity in alternate “clock knockout” genetic models and in hosts subject to chronic circadian desynchrony will help disentangle such possibilities. This apparent paradox additionally highlights the complex nature of circadian investigations, in that clock proteins may be co-opted during virus replication in ways unrelated to their timekeeping function (non-circadian effects). Therefore, the global impact of circadian rhythmicity must be considered, rather than the effect of individual clock components.
Our work does imply that constitutively low levels of BMAL1 lead to increased herpes and influenza A viral infection. Remarkably, as well as its daily oscillation, Bmal1 expression undergoes seasonal variation in human blood samples, with lowest levels during the winter months (21). We speculate that this may contribute to viral dissemination at the population level because many viruses, including influenza, cause infection more commonly in the winter (22). Given that global Bmal1 expression is substantially lower in mouse models of circadian desynchronization (23), our work also suggests that shift workers might be more susceptible to viral disease and therefore prime candidates for vaccination against viruses such as influenza. Indeed, timing of influenza vaccine administration in the morning vs. afternoon has recently been shown to be a determinant in the systemic immunization response in people aged >65 y (24). Beyond this, acute manipulation of the molecular circadian clockwork may provide a strategy for the development of novel antiviral therapies.
Methods
Viruses.
WT MuHV-4, M50 MuHV-4 (25), M3:luciferase (M3:luc) MuHV-4 (12), WT HSV-1, and CMV:luciferase (CMV:luc) HSV-1 (13) stocks were grown in BHK21 cells and virus titer determined by plaque assay. PB2::Gaussia luciferase (PB2::GLUC) influenza A virus (A/Puerto Rico/8/34 H1N1 IAV) was a kind gift from Nicholas Heaton and Peter Palese, Icahn School of Medicine at Mount Sinai, New York (26). SI Methods provides further details.
Mice.
Animal experimentation was licensed by the Home Office under the Animals (Scientific Procedures) Act 1986, with University of Cambridge Local Ethical Review. Animals had ad libitum access to chow and water and were maintained on 12-h light:12-h dark cycles, with lights on and lights off designated ZT0 and ZT12, respectively. At stated ZTs, age-matched C57BL/6J WT (Bmal1+/+) and Bmal1−/− mice were intranasally infected with 1 × 10⁴ plaque-forming units (pfu) M3:luc MuHV-4 or 5 × 10⁶ pfu CMV:luc HSV-1 by left ear scarification. Bioluminescence imaging was performed with an IVIS Lumina and analyzed using Living Image software (Caliper Life Sciences). See SI Methods for further details.
Cell Culture and Bioluminescence Assays.
Primary fibroblasts were generated as described previously (27). Circadian transcriptional rhythms were monitored using confluent NIH 3T3 fibroblasts (ATCC) transfected with mPeriod2:luciferase, mCryptochrome1:luciferase, or Bmal1:luciferase reporters and temporally synchronized by temperature cycles (32 °C:37 °C; 12 h:12 h) or 100 nM dexamethasone treatment (28). For comparison between in vivo and in vitro experiments, peak Bmal1:luc bioluminescence was operationally designated as CT = 0/24 h. M3:luc MuHV-4 and CMV:luc HSV-1 infections were performed at high multiplicity of infection (MOI = 1–3 pfu/cell). Bioluminescence was monitored using a LumiCycle-32 system (Actimetrics) or Alligator Bioluminescence Incubator System (Cairn Research). PB2::GLUC IAV (MOI = 2 pfu/cell) replication was assessed by sampling medium at intervals postinfection and determining Gaussia luciferase activity using a BioLux Kit (NEB E3300L). See SI Methods for further details.
Proteomics.
Synchronized, confluent primary WT and Bmal1−/− cells were harvested at either CT = 18 h or CT = 30 h. Lysates were digested and labeled with tandem mass tags (TMTs) according to the manufacturer’s instructions (Thermo). Peptide mixtures were separated on a 50-cm, 75-μm-ID Pepmap column over a 3-h gradient at 40 °C and eluted directly into the mass spectrometer (Thermo Q Exactive Orbitrap). Xcalibur software was used to control the data acquisition. MaxQuant v1.5.2.8 was used to process the raw data acquired with a reporter ion quantification method (29). The Uniprot KB database of mouse sequences was used for peptide identification [false discovery rate (FDR) = 0.1%]. Two-tailed t tests were performed in Perseus (FDR cutoff = 0.05; within-groups variance S0 factor = 0.1) to identify proteins significantly different between CT18 and CT30 in WT cells, but not Bmal1−/− cells. This group was then tested via two-tailed t test for significant differences between WT and Bmal1−/− cells at both CT18 and CT30 (FDR cutoff = 0.05), presented graphically in R using the HeatMap package and subject to Database for Annotation, Visualization and Integrated Discovery (DAVID) functional annotation clustering analysis. Outputs were graphically presented using Cytoscape EnrichmentMap and annotated using Clustermaker Markov Cluster Algorithm and WordCloud (30, 31). See SI Methods for further details.
Statistical Analysis.
Unless otherwise stated, statistical analysis was performed using Prism (GraphPad Software). Bioluminescence data were analyzed using LumiCycle Data Analysis software (Actimetrics). See SI Methods for further details.
SI Methods
Mice.
Sample size was determined using the resource equation: E (degrees of freedom in ANOVA) = (total number of experimental animals) – (number of experimental groups), with sample size adhering to the condition 10 < E < 20. For comparison of MuHV-4 and HSV-1 infection in WT vs. Bmal1−/− mice at ZT7 (Fig. 2), the investigator did not know the genotype of the animals when conducting infections, bioluminescence imaging, and quantification. For bioluminescence imaging, mice were injected intraperitoneally with endotoxin-free luciferin (Promega E6552) using 2 mg total per mouse. Following anesthesia with isofluorane, they were scanned with an IVIS Lumina (Caliper Life Sciences), 15 min after luciferin administration. Signal intensity was quantified using Living Image software (Caliper Life Sciences), obtaining maximum radiance for designated regions of interest (photons per second per square centimeter per Steradian: photons⋅s−1⋅cm−2⋅sr−1), relative to a negative control region. At 24 d after infection, mice were culled, and tissue was removed for analysis of latent infection.
Analysis of Virus Latency.
For analysis of MuHV-4 latent infection in mice, viral genome loads were measured by real-time PCR using DNA extracted from spleen tissue as previously described (15). MuHV-4 M2 gene was amplified using a Rotor Gene 3000 (Corbett Research), and PCR products were quantified by hybridization with a Taqman probe. Genome copy number was determined by comparison with a standard curve of cloned M2 plasmid templates. Cellular DNA was quantified in parallel by amplifying part of the adenosine phosphoribosyl transferase gene (APRT) and the ratio of MuHV-4 genome copies to APRT determined. Reactivation of latent MuHV-4 was measured by infectious center assay: spleens were disrupted into single-cell suspensions and serial dilutions were cocultured with cell monolayers. After 6 d, cells were fixed and stained for plaque counting, as above. For analysis of HSV-1 latent infection in mice, viral genome loads were measured by real-time PCR using DNA extracted from dorsal root ganglion tissue. HSV-1 ICP0 gene were amplified using a Rotor Gene 3000, and PCR products were quantified by hybridization with a Taqman probe. Genome copy number was determined by comparison with a standard curve of cloned ICP0 plasmid templates. Cellular DNA was quantified in parallel by amplifying part of the APRT gene and the ratio of HSV-1 genome copies to APRT determined.
Cell Culture and Bioluminescence Assays.
All cells were propagated in DMEM containing 4.5 g/L glucose (Sigma D6546), supplemented with 10% (vol/vol) FetalClone III serum (Thermo Scientific HyClone), 1× Glutamax (Life Technologies), 100 U penicillin/mL, and 100 µg/mL streptomycin (Penicillin–Streptomycin Solution; Sigma P0781). Transfections were conducted using GeneJuice transfection reagent (Millipore). After synchronization, cells were transferred to “Air Medium,” containing DMEM (Sigma D5030) supplemented with 5 g/L glucose, 20 mM Hepes, 100 U penicillin/mL, 100 µg/mL streptomycin, 0.035% NaHCO3, FetalClone III serum, 1× Glutamax, 2× B-27 Supplement (Life Technologies 17504-044), and 0.3 mM Luciferin (Biosynth L8220). All experiments were initiated >24 h after cells were transferred to constant conditions, so that they would not be subject to any effects of the synchronization treatment. Bioluminescence was monitored using a LumiCycle-32 system (Actimetrics), and recordings were analyzed using LumiCycle Data Analysis software (Actimetrics).
Cell Cycle Analysis of Confluent Cell Monolayers.
NIH 3T3, primary WT, and Bmal1−/− fibroblasts were sequentially transduced with lentiviral fluorescent ubiquitin-based cell cycle indicators (FUCCI) mCherry::Cdt1 and amCyan::Geminin reporters (32). Dual reporter-positive cells were selected by FACS (Influx Cell Sorter; BD Biosciences) and seeded onto 35-mm dishes for subsequent analysis. To confirm that expression of mCherry::Cdt1 and amCyan::Geminin correspond to G1 (2n DNA content) and S/G2 (2 < n ≤ 4 DNA content) cell cycle phases, respectively, cells were stained with DNA dye DRAQ5 (abcam) and analyzed by flow cytometry (LSR-Fortessa; BD Biosciences). To examine dynamics of replicative activity under experimental confluent conditions, synchronized FUCCI reporter monolayers were observed by time-lapse live cell imaging over 3 d (Nikon Eclipse Ti-E inverted epifluorescent microscope). At stated circadian times, numbers of mCherry::Cdt1- and amCyan::Geminin-positive cells were counted, and their ratio was determined.
Viruses.
To generate MuHV-4 and HSV-1 stocks, infected BHK21 cells were harvested following the development of cytopathic effect. Virus titer was determined by plaque assay as follows. For MuHV-4, BHK21 or NIH 3T3 cell monolayers were incubated (2 h at 37 °C) with 10-fold dilutions of virus then overlaid with 0.6% carboxymethylcellulose to limit progeny virus spread to adjacent cells only. After 4 d, cells were fixed in 10% (wt/vol) formaldehyde and stained with 0.1% toluidine blue for plaque counting. For HSV-1, BHK21 cells were incubated (45 min at 37 °C) in suspension with 10-fold dilutions of virus before supplementation with 1% carboxymethylcellulose. After 1–2 d, cells were fixed in 10% formaldehyde and stained with 0.1% toluidine blue for plaque counting. WT and PB2::GLUC IAV stocks were amplified in 10-d-old embryonated chicken eggs and titrated by plaque assay. For IAV titration, Madin Darby canine kidney (MDCK) cell monolayers were incubated (1 h at 37 °C) with virus in serum-free medium and then overlaid with 1.2% Avicel (IMCD)/DMEM plus 1 µg/mL TPCK-trypsin (Worthington Biochemical), 0.14% BSA (Sigma), and 1× Glutamax (Life Technologies). After 2 d, cells were fixed in 10% formaldehyde and stained with 0.1% toluidine blue for plaque counting. Additionally, single-cycle growth curves were performed as follows: parallel cell cultures were infected with WT IAV (MOI = 5 pfu/cell; 37 °C) and after 1 h any remaining input virus was removed by acid washing (40 mM citric acid, pH 3, 135 mM NaCl, 10 mM KCl). At stated times after infection, cultures were harvested and stored at −80 °C. The amount of infectious virus produced within the time stated was determined by plaque assay as above.
Correlation of Viral Bioluminescence and Infectious Particle Production.
To correlate M3:luciferase MuHV-4 (M3:luc MuHV-4) and CMV:luciferase HSV-1 (CMV:luc HSV-1) bioluminescence with production of infectious particles, parallel confluent fibroblast monolayers were incubated with luciferase viruses at a range of multiplicities of infection (MOI; 2–0.001 pfu/cell for M3:luc MuHV-4; 10–0.001 pfu/cell for CMV:luc HSV-1). Input virus was then removed by acid washing (40 mM citric acid, pH 3, 135 mM NaCl, 10 mM KCl). Bioluminescence was monitored in real time using a Lumicycle-32 (Actimetrics). At stated times after infection, parallel cultures were harvested and stored at −80 °C. The amount of infectious virus produced was determined by plaque assay. The total bioluminescence acquired during stated times after infection was determined by the area under curve (AUC) method. Correlation analysis was performed using linear regression (total bioluminescence vs. log10 pfu produced by equivalent cultures over the same time frame during exponential growth).
ICP0 in Vitro Expression Assay.
ICP0 adenoviral vectors were a kind gift from Anna Salvetti and Marie-Claude Geoffroy (INSERM U649, Nantes, France). This Tet-On system comprises Ad.CMV.rtTA (expressing rtTA from the HCMV immediate early promoter), Ad.TRE.ICP0 [expressing ICP0 from a tetracycline-responsive (TRE) promoter], and Ad.TRE.FXE [expressing a nonfunctional RING-finger deletion mutant (FXE) of ICP0 from a TRE promoter] as previously described (33). NIH 3T3 cells expressing the Bmal1:luc reporter construct were infected with the adenovirus vectors alone or in combination (Ad.CMV.rtTA: MOI = 10 pfu/cell; Ad.TRE.ICP0 or Ad.TRE.FXE: MOI = 4 pfu/cell). After 46 h of bioluminescence recording, doxycycline (Dox) was added (1 µg/mL) and bioluminescence recording resumed.
Proteomics: Lysis and Alkylation.
Primary fibroblasts from WT (Bmal1+/+) and Bmal1−/− mice were grown to confluence in 6-well plates (n = 3 per time point) and synchronized with 100 nM dexamethasone for 20 min, and their medium was exchanged and then incubated under constant conditions (37 °C in darkness). Cells were then harvested by briefly washing with ice-cold PBS and incubating with lysis buffer (250 mM Hepes, 1% SDS, 1% Nonidet P-40, and 10 mM DTPA) for 20 min. The first time point was designated Circadian Time (CT)18 and the other CT30 based on the assessment of cells expressing the Bmal1:luc or the Per2:luc reporter that were synchronized in parallel (Figs. 3C and 4C). After scraping the cell monolayers into 1.5-mL tubes, lysates were precleared by centrifugation at 16,100 × g in a bench top microfuge for 10 min at 4 °C. Protein concentration was determined using the BCA Protein Assay Kit (Thermo Pierce) and 100 μg per condition transferred into a new tube. The final volume was adjusted to 100 μL with lysis buffer. The samples were then reduced with 5 μL 200 mM TCEP and incubated at 55 °C for 1 h. Five microliters of 375 mM iodoacetamide was added to alkylate proteins and incubated for 30 min, protected from light, at room temperature. The alkylation reaction was quenched by adding 600 μL ice-cold acetone and protein precipitated by incubating at −20 °C overnight. On the following day, the samples were centrifuged at 16,100 × g in a bench top microfuge for 15 min at 4 °C. Acetone was removed, and the pellets were air-dried for 5 min at room temperature.
Proteomics: Digestion and TMT Labeling.
Acetone-precipitated pellets were resuspended in 100 μL 100 mM TEAB aided by sonication on ice for 10 cycles (30 s on; 30 s off; medium power) in a Bioruptor sonicator. Trypsin (2.5 μg Promega Trypsin Gold) per 100 μg protein sample, and incubated for 1 h at 37 °C. After the initial incubation, a further 2.5 μg trypsin was added, and the digestion was allowed to proceed overnight at 37 °C. TMT labeling was performed according to the manufacturer’s instructions (Thermo). Briefly, the TMT labeling reagents were resuspended by adding 82 μL anhydrous acetonitrile (ACN) to each vial. Then, 41 μL TMT reagent was added to the digested proteins and incubated for 1 h at room temperature with occasional vortexing. Eight microliters of 5% hydroxylamine was then added to the samples and incubated for 15 min at room temperature to quench the reaction. TMT-labeled samples were combined after elution at equimolar ratios (as below) and dried by vacuum centrifugation.
WT: CT18 vs. CT30
| TMT label | Time point |
| 126 | WT CT30 Rep A |
| 127 | WT CT30 Rep B |
| 128 | WT CT30 Rep C |
| 129 | WT CT18 Rep A |
| 130 | WT CT18 Rep B |
| 131 | WT CT18 Rep C |
Bmal1−/−: CT18 vs. CT30
| TMT label | Time point |
| 126 | Bmal1−/− CT18 Rep A |
| 127 | Bmal1−/− CT18 Rep B |
| 128 | Bmal1−/− CT18 Rep C |
| 129 | Bmal1−/− CT30 Rep A |
| 130 | Bmal1−/− CT30 Rep B |
| 131 | Bmal1−/− CT30 Rep C |
Proteomics: Cleanup and LC-MS/MS Analysis.
Peptides dried by vacuum centrifugation were cleaned up in preparation for LC-MS/MS analysis using C18 Stage Tips with a centrifuge-based protocol. Peptides were then aliquoted and taken to dryness by vacuum centrifugation and may be stored at −80°C until required for LC-MS/MS analysis. Labeled peptide samples were resuspended in 50 μL 0.1% TFA, sonicated for 15 min, and injected (5 μL per injection). Peptide mixtures were separated on a 50-cm, 75-μm-ID Pepmap column over a 3-h gradient at 40 °C and eluted directly into the mass spectrometer (Thermo Q Exactive Orbitrap). Xcalibur software was used to control the data acquisition. The instrument was run in data dependent acquisition mode with the top 10 most abundant peptides selected for tandem MS (MS/MS) by higher energy collisional dissociation (HCD) fragmentation techniques. MS spectra were acquired at a resolution of 70,000 and an ion target of 3 × 10⁶. HCD scans were performed with 35% normalized collision energy (NCE) at 35,000 resolution (at m/z 200), and the ion target was set to 2 × 10⁵ to avoid coalescence.
Proteomics: Data Analysis.
MaxQuant v1.5.2.8 was used to process the raw data acquired with a reporter ion quantification method. The Uniprot KB database of mouse sequences was used for peptide identification. Peptides identified with CI values >95% were used for protein identification and quantification. Database searching parameters included precursor ion mass tolerance of 5 ppm and fragment mass tolerance of 0.02 Da, digestion by trypsin, TMT 6-plex modification of peptide N termini and lysine residues, with dynamic modifications at oxidation (M), deamination (N,Q), in addition to the static modifications at Methylthio (C). A peptide estimated false discovery rate (FDR) of 0.1 was used to generate tables with protein and peptide identifications and quantifications. Feature matching was enabled between runs for peptide identification. Reporter ion intensity (corrected and uncorrected) was imported into Perseus v1.5.2.6 for statistical analysis. Summary statistics were calculated on log2 transformed reporter ion intensities. Data quality obtained from the TMT-based quantitative proteomics analysis was checked by S-curve analysis and polygon and volcano plots. Corrected intensities were normalized by subtracting the mean value for each reporter ion column from each intensity within that column. Histograms revealed normal distributions centered on zero, confirming that this transformation was successful. To compare values more easily, data for each protein was normalized by the z-score method across all time-points and genotypes. These values were then used for subsequent analysis. Two-tailed t tests were performed in Perseus using an FDR cutoff of 0.05, and a within-groups variance S0 factor of 0.1. FDR was calculated by permutation-based method using n = 250 permutations per test. Proteins showing significant difference between CT18 and CT30 in WT cells, but not Bmal1−/− cells, were subsequently tested via two-tailed t test for significant differences between WT and Bmal1−/− cells at both CT18 and CT30 (FDR cutoff, 0.05) and presented graphically in R using the HeatMap package (Fig. S8). Proteins meeting both significance criteria were then subjected to DAVID Functional Annotation Clustering analysis (Tables S1 and S2). Outputs were graphically presented using Cytoscape EnrichmentMap application and annotated using Clustermaker Markov Cluster Algorithm and WordCloud.
Statistical Analysis.
For animal experiments, two-way ANOVA was performed on log10-transformed values. Normality and equality of variance were confirmed by the Kolmogorov–Smirnov test and Levene’s median test, respectively. Multiple two-tailed t tests with an FDR cutoff of 0.05 were also performed (*P < 0.05, **P < 0.01, ***P < 0.001). For cellular assays with multiple groups, ANOVA was performed with Holm-Sidak correction for multiple comparisons (*P < 0.05, **P < 0.01, ***P < 0.001). Equality of variance was confirmed via the Brown–Forsythe test. For cellular assays with two groups, two-tailed t tests with Welch’s correction were performed. F-tests were used to compare variances and variances were not significantly different unless stated. For luciferase herpesvirus cellular assays, raw bioluminescence values were background-subtracted (bioluminescence – bioluminescence at t = 0 h after infection) and total bioluminescence was calculated using the AUC method. For each experiment, total bioluminescence values were normalized (0% = bioluminescence at t = 0–1 h; 100% = maximum total bioluminescence value). For analysis of virus replication kinetic parameters (Hill slope, time to 50% peak infection, and time to 50% decrease from peak infection), raw bioluminescence values were subject to asymmetric sigmoidal nonlinear regression as illustrated in Fig. 3B, with goodness of fit reported by the coefficient of determination, R2. Pearson’s analysis was performed to test for correlations, with the correlation coefficient (r) and two-tailed P values reported. PB2::GLUC IAV cellular assays and raw bioluminescence values were background-subtracted (PB2::LUC-infected bioluminescence – mock-infected bioluminescence). Values were subject to sigmoidal dose–response (variable slope) nonlinear regression to determine plateau bioluminescence, with goodness of fit reported by R2. Total IAV PB2::GLuc bioluminescence was calculated using the AUC method.
Supplementary Material
Acknowledgments
We thank L. Ansel-Bollepalli and I. Robinson for animal assistance; A. Snijders, H. Flynn (Francis Crick Institute Proteomics Core), and S. Ray for assistance with proteomics data analysis; N. Heaton, P. Palese (Icahn School of Medicine at Mount Sinai), and A. Miyawaki (RIKEN Brain Science Institute, Japan) for Fucci2 lentiviral vectors; and H. Coleman and M. Jain for helpful discussions. A.B.R. acknowledges funding from the Wellcome Trust (Grants 083643/Z/07/Z, 100333/Z/12/Z, and 100574/Z/12/Z), the European Research Council (Grant 281348, MetaCLOCK), the European Molecular Biology Organization Young Investigators Programme, the Lister Institute of Preventative Medicine, and the Medical Research Council (MRC_MC_UU_12012/5). A.D.N. acknowledges Marie Curie Actions (FP7/2007-2013; Research Executive Agency Grant Agreement 627630).
Footnotes
The authors declare no conflict of interest.
This article is a PNAS Direct Submission.
This article contains supporting information online at www.pnas.org/lookup/suppl/doi:10.1073/pnas.1601895113/-/DCSupplemental.
References
- 1.Takahashi JS, Hong HK, Ko CH, McDearmon EL. The genetics of mammalian circadian order and disorder: Implications for physiology and disease. Nat Rev Genet. 2008;9(10):764–775. doi: 10.1038/nrg2430. [DOI] [PMC free article] [PubMed] [Google Scholar]
- 2.Bunger MK, et al. Mop3 is an essential component of the master circadian pacemaker in mammals. Cell. 2000;103(7):1009–1017. doi: 10.1016/s0092-8674(00)00205-1. [DOI] [PMC free article] [PubMed] [Google Scholar]
- 3.van der Horst GT, et al. Mammalian Cry1 and Cry2 are essential for maintenance of circadian rhythms. Nature. 1999;398(6728):627–630. doi: 10.1038/19323. [DOI] [PubMed] [Google Scholar]
- 4.O’Neill JS, Maywood ES, Hastings MH. Cellular mechanisms of circadian pacemaking: Beyond transcriptional loops. Handbook Exp Pharmacol. 2013;(217):67–103. doi: 10.1007/978-3-642-25950-0_4. [DOI] [PubMed] [Google Scholar]
- 5.Scheiermann C, Kunisaki Y, Frenette PS. Circadian control of the immune system. Nat Rev Immunol. 2013;13(3):190–198. doi: 10.1038/nri3386. [DOI] [PMC free article] [PubMed] [Google Scholar]
- 6.Curtis AM, Bellet MM, Sassone-Corsi P, O’Neill LA. Circadian clock proteins and immunity. Immunity. 2014;40(2):178–186. doi: 10.1016/j.immuni.2014.02.002. [DOI] [PubMed] [Google Scholar]
- 7.Gibbs JE, et al. The nuclear receptor REV-ERBα mediates circadian regulation of innate immunity through selective regulation of inflammatory cytokines. Proc Natl Acad Sci USA. 2012;109(2):582–587. doi: 10.1073/pnas.1106750109. [DOI] [PMC free article] [PubMed] [Google Scholar]
- 8.Nguyen KD, et al. Circadian gene Bmal1 regulates diurnal oscillations of Ly6C(hi) inflammatory monocytes. Science. 2013;341(6153):1483–1488. doi: 10.1126/science.1240636. [DOI] [PMC free article] [PubMed] [Google Scholar]
- 9.Koike N, et al. Transcriptional architecture and chromatin landscape of the core circadian clock in mammals. Science. 2012;338(6105):349–354. doi: 10.1126/science.1226339. [DOI] [PMC free article] [PubMed] [Google Scholar]
- 10.Bass J, Takahashi JS. Circadian integration of metabolism and energetics. Science. 2010;330(6009):1349–1354. doi: 10.1126/science.1195027. [DOI] [PMC free article] [PubMed] [Google Scholar]
- 11.Stevenson PG, Efstathiou S. Immune mechanisms in murine gammaherpesvirus-68 infection. Viral Immunol. 2005;18(3):445–456. doi: 10.1089/vim.2005.18.445. [DOI] [PubMed] [Google Scholar]
- 12.Milho R, et al. In vivo imaging of murid herpesvirus-4 infection. J Gen Virol. 2009;90(Pt 1):21–32. doi: 10.1099/vir.0.006569-0. [DOI] [PMC free article] [PubMed] [Google Scholar]
- 13.Shivkumar M, et al. Herpes simplex virus 1 targets the murine olfactory neuroepithelium for host entry. J Virol. 2013;87(19):10477–10488. doi: 10.1128/JVI.01748-13. [DOI] [PMC free article] [PubMed] [Google Scholar]
- 14.Zhang R, Lahens NF, Ballance HI, Hughes ME, Hogenesch JB. A circadian gene expression atlas in mammals: Implications for biology and medicine. Proc Natl Acad Sci USA. 2014;111(45):16219–16224. doi: 10.1073/pnas.1408886111. [DOI] [PMC free article] [PubMed] [Google Scholar]
- 15.Kawaguchi Y, et al. Herpes simplex virus 1 alpha regulatory protein ICP0 functionally interacts with cellular transcription factor BMAL1. Proc Natl Acad Sci USA. 2001;98(4):1877–1882. doi: 10.1073/pnas.041592598. [DOI] [PMC free article] [PubMed] [Google Scholar]
- 16.Kalamvoki M, Roizman B. The histone acetyltransferase CLOCK is an essential component of the herpes simplex virus 1 transcriptome that includes TFIID, ICP4, ICP27, and ICP22. J Virol. 2011;85(18):9472–9477. doi: 10.1128/JVI.00876-11. [DOI] [PMC free article] [PubMed] [Google Scholar]
- 17.O'Donnell AJ, Schneider P, McWatters HG, Reece SE. Fitness costs of disrupting circadian rhythms in malaria parasites. Proc Biol Sci. 2011;278(1717):2429–2436. doi: 10.1098/rspb.2010.2457. [DOI] [PMC free article] [PubMed] [Google Scholar]
- 18.Benegiamo G, et al. Mutual antagonism between circadian protein period 2 and hepatitis C virus replication in hepatocytes. PLoS One. 2013;8(4):e60527. doi: 10.1371/journal.pone.0060527. [DOI] [PMC free article] [PubMed] [Google Scholar]
- 19.Sundar IK, et al. Influenza A virus-dependent remodeling of pulmonary clock function in a mouse model of COPD. Sci Rep. 2015;4:9927. doi: 10.1038/srep09927. [DOI] [PMC free article] [PubMed] [Google Scholar]
- 20.Kalamvoki M, Roizman B. Circadian CLOCK histone acetyl transferase localizes at ND10 nuclear bodies and enables herpes simplex virus gene expression. Proc Natl Acad Sci USA. 2010;107(41):17721–17726. doi: 10.1073/pnas.1012991107. [DOI] [PMC free article] [PubMed] [Google Scholar]
- 21.Dowell SF. Seasonal variation in host susceptibility and cycles of certain infectious diseases. Emerg Infect Dis. 2001;7(3):369–374. doi: 10.3201/eid0703.010301. [DOI] [PMC free article] [PubMed] [Google Scholar]
- 22.Dopico XC, et al. Widespread seasonal gene expression reveals annual differences in human immunity and physiology. Nat Commun. 2015;6:7000. doi: 10.1038/ncomms8000. [DOI] [PMC free article] [PubMed] [Google Scholar]
- 23.Filipski E, et al. Effects of light and food schedules on liver and tumor molecular clocks in mice. J Natl Cancer Inst. 2005;97(7):507–517. doi: 10.1093/jnci/dji083. [DOI] [PubMed] [Google Scholar]
- 24.Long JE, et al. Morning vaccination enhances antibody response over afternoon vaccination: A cluster-randomised trial. Vaccine. 2016;34(24):2679–2685. doi: 10.1016/j.vaccine.2016.04.032. [DOI] [PMC free article] [PubMed] [Google Scholar]
- 25.May JS, Coleman HM, Smillie B, Efstathiou S, Stevenson PG. Forced lytic replication impairs host colonization by a latency-deficient mutant of murine gammaherpesvirus-68. J Gen Virol. 2004;85(Pt 1):137–146. doi: 10.1099/vir.0.19599-0. [DOI] [PubMed] [Google Scholar]
- 26.Heaton NS, et al. In vivo bioluminescent imaging of influenza a virus infection and characterization of novel cross-protective monoclonal antibodies. J Virol. 2013;87(15):8272–8281. doi: 10.1128/JVI.00969-13. [DOI] [PMC free article] [PubMed] [Google Scholar]
- 27.Seluanov A, Vaidya A, Gorbunova V. Establishing primary adult fibroblast cultures from rodents. J Vis Exp. 2010;(44):e2033. doi: 10.3791/2033. [DOI] [PMC free article] [PubMed] [Google Scholar]
- 28.Nagoshi E, et al. Circadian gene expression in individual fibroblasts: Cell-autonomous and self-sustained oscillators pass time to daughter cells. Cell. 2004;119(5):693–705. doi: 10.1016/j.cell.2004.11.015. [DOI] [PubMed] [Google Scholar]
- 29.Tusher VG, Tibshirani R, Chu G. Significance analysis of microarrays applied to the ionizing radiation response. Proc Natl Acad Sci USA. 2001;98(9):5116–5121. doi: 10.1073/pnas.091062498. [DOI] [PMC free article] [PubMed] [Google Scholar]
- 30.Merico D, Isserlin R, Stueker O, Emili A, Bader GD. Enrichment map: A network-based method for gene-set enrichment visualization and interpretation. PLoS One. 2010;5(11):e13984. doi: 10.1371/journal.pone.0013984. [DOI] [PMC free article] [PubMed] [Google Scholar]
- 31.Lopes CT, et al. Cytoscape Web: An interactive web-based network browser. Bioinformatics. 2010;26(18):2347–2348. doi: 10.1093/bioinformatics/btq430. [DOI] [PMC free article] [PubMed] [Google Scholar]
- 32.Sakaue-Sawano A, et al. Visualizing spatiotemporal dynamics of multicellular cell-cycle progression. Cell. 2008;132(3):487–498. doi: 10.1016/j.cell.2007.12.033. [DOI] [PubMed] [Google Scholar]
- 33.Coleman HM, et al. Histone modifications associated with herpes simplex virus type 1 genomes during quiescence and following ICP0-mediated de-repression. J Gen Virol. 2008;89(Pt 1):68–77. doi: 10.1099/vir.0.83272-0. [DOI] [PMC free article] [PubMed] [Google Scholar]
Associated Data
This section collects any data citations, data availability statements, or supplementary materials included in this article.


