

Abstract
Adenosine receptor family especially A1 type is expressed in breast cancer cells in which P53 and caspase genes are wild-type. The aim of this study was to investigate the correlation between A1 receptor and either cell apoptosis or proliferation and also to recognize the relationship between this receptor and P53 and the expression of caspases 3, 8 and 9 in MCF-7 cell line. MCF-7 cells were treated intermittently with A1 receptor agonist N6-Cyclopentyladenosine (CPA) and A1 receptor antagonist 1,3-dipropyl-8-cyclopentylxanthine (DPCPX) in different times to measure the expression of p53, caspase 3, 8 and 9 besides apoptosis and survival rate. Our findings indicated that DPCPX significantly induced apoptosis in MCF-7 cells while the cell viability was reduced specially 72 h after the treatment and the expression of p53 gene and caspase expressions was dramatically up-regulated. On the other hand, CPA increased the cell viability and reduced apoptosis in MCF-7 cells. Our results indicated a significant down-regulation in the MCF-7 mRNA expression of p53 and caspases 3, 8 and 9. Furthermore, DPCPX induced p53 and caspase 3, 8 and 9 expressions that consequently promotes the cell apoptosis in MCF-7 cells. Therefore, DPCPX can be considered as an anti-cancer drug.
Keywords: Caspase, Adenosine A1, Apoptosis, Genes, p53, MCF-7 cells
INTRODUCTION
Breast cancer is the most common cancer among women especially in developed countries. This type of cancer have about one in eight lifetime risk and one-third of the patients will die as a result of this disease (1,2). Many studies have shown that MCF-7 is one of the breast cancer cell lines in 70% of patients in which p53 gene is wild-type (3). Cancerous cells escape from natural proliferation control systems via different mechanisms which substantially conduce to genomic changes. Therefore, these changes can lead to abnormal cell proliferation, unusual cell movements and invasion and even cancerous cell drug resistance (4,5).
One of the genomic changes in the most breast cancer cell lines is A1 receptor overexpression. A1 receptor is one of the purinergic P1 receptors (A1, A2a, A2b, and A3) which generally have a critical role in the control of inflammation, immune reactions, programmed cell death pathways, cell division and differentiation. Expression, concentration and even function of A1 receptor are different in different tissues and cells which depend on the cell background (6,7,8,9).
Cell programmed death or apoptosis is associated with fragmentation of DNA, conjointly, it is characterized morphologically by cytoplasmic condensation, pyknosis of nucleus, cell rounding and formation of apoptotic bodies. Apoptosis is critical for some different biological events such as senescence and clearance of excess or harmful cells. This type of death is also essential for normal development and homeostasis. Two main apoptotic pathways are respectively described as extrinsic or death receptor-mediated apoptosis and intrinsic or mitochondrial-mediated apoptosis (10,11,12). Also apoptosis is an energy-dependent process that involves the activation of cysteine proteases called “caspases”. Caspases link the initiating stimuli to final state of cell programmed death. Each of intrinsic or extrinsic pathways has their own special caspases. Many common drugs used for cancer therapy lead to apoptosis through caspases and p53-dependent pathway (13,14). Overexpression of caspases has shown to be sufficient to induce apoptosis in mammalian cells (15).
P53 is a tumor suppressor gene in human genome that mainly controls the cell proliferation and mitosis. This gene has several biological functions including DNA repair, cell cycle control, differentiation and apoptosis (16). Also p53 has significant role in every external and internal apoptotic pathways which activate specific caspases. Inhibition of p53 gene expression in many cases can cause uncontrolled cell division. P53 is mutated in 50% of human cancers but this sum is only 20-30% in the breast cancer (17,18,19).
Adenosine A1 receptor is overexpressed in breast cancer cells although the signaling pathway of this receptor is not clear (20). Some researchers have shown that A1 receptor expression is associated with cell viability, mitosis rate and decreased apoptosis. This expression is critical to induce proliferation in positive and negative estrogen receptor cell lines of breast cancer (20,21).
Many studies have demonstrated that prostatic cancer cells have also a high concentration of adenosine receptors. Likewise activation of A3 receptor with IB-MECA (an agonist for this receptor) leads to p53 overexpression, cell cycle arrest and caspase 3 activation in these cells (22). Moreover, the activation of A1 receptor reduces the cell damage and apoptotic rate following an oxidative stress in the brain, kidney, and heart. Conversely antagonist of this receptor increases cell and tissue damage in these conditions (23,24). A1 receptor can also inhibit caspase 3 activation and inhibit apoptosis in brain hypoglycemia (24).
With regard to importance of increasing the incidence of breast cancer in developing countries, we aimed to investigate the effect of A1 receptor agonist (N6-Cyclopentyladenosine (CPA)) and antagonist (8-Cyclopentyl-1, 3-dipropylxanthine (DPCPX)) on cell viability, expression of p53 and special caspases in apoptotic pathways.
MATERIAL AND METHODS
Cell culture, drug and treatment
MCF-7 cell line was obtained from the Animal Cell Culture Division of Pasteur Institute (Tehran, Iran). Cells were maintained in Dulbecco's Modified Eagle Medium (DMEM/F12, Bioidea, Iran) with 10% fetal bovine serum (Gibco, Germany), 100 U/mL penicillin (Bioidea, Iran), 100 μg/mL streptomycin (Bioidea, Iran) and kept at 37°C in a humidified atmosphere with 5% CO2. For experiments after trypsinization (trypsin-ethylenediaminetetraacetic acid (EDTA), Bioidea, Iran), cells were seeded in culture flasks. CPA and DPCPX were purchased from Sigma (C8031, C101, USA) and dissolved in dimethyl sulfoxide (DMSO, Sigma, USA) to the appropriate concentrations according to half maximal inhibitory concentration (IC50) assay. After the cells were > 80% confluent and growing exponentially in T75 culture flask (SPL, South Korea), 106 MCF-7 cells were counted and plated in T75 culture flask and then kept in culture medium for 24 h which were then incubated with certain concentrations of CPA and DPCPX, based on IC50 concentration and in the certain times (24, 48, 72 h) the tests were performed.
IC50 assay
The IC50 values for the CPA and DPCPX in MCF-7 cells were acquired after 24 h of treatment. Briefly, 104 cells (MCF-7) were counted and placed into each well of a 12-well plate and afterwards were treated with various drug concentrations (0, 10, 50, 100, 200, and 400 μM for CPA and 0.01, 0.05, 0.1, 1, 10, and 100 μM for DPCPX) for 24 h, and then 3(4,5-dimethylthiazol-2-yl)2,5- diphenyl-tetrazoliumbromide (MTT, Sigma, USA) survival assay was carried out for evaluating the cell viability with different drug concentrations in each groups. A graph of cell viability versus drug concentration was used to calculate IC50 values for MCF-7cell line.
MTT assay
104 cells per well plated into 24-well plates. After 24 h the medium was removed and the drugs that dissolved in medium in certain concentrations were added. In certain time intervals (24, 48 and 72 h) the cell viability was measured using MTT in DMEM/F-12 medium for 3 h. After lysis with DMSO, 100 µl aliquot of the soluble fraction was transferred into 96-well plates, and the optical density (OD) was measured by a plate reader. The percent of cells stained by MTT were determined by comparison of the OD of each sample with the OD of the control group.
Flowcytometry assay
The percentage of apoptotic cells was measured by flowcytometry following the annexinV (FL1-H) and PI (FL2-H) labeling. A minimum of 4 × 10⁵ cells/mL were analyzed for each sample. Cells which were treated with CPA and DPCPX (180 μM and 87 nM) in 24, 48 and 72 h were washed in phosphate buffer saline and resuspended in binding buffer (1 × 5 μL). AnnexinV-FITC was added to 195 μL cell suspensions and then analysis was carried out according to the manufacturer's protocol (BMS500F1/100CE annexin V-FITC, eBioscience, USA). Finally the apoptotic cells were counted by FACScan flowcytometry (Becton Dickinson, Heidelberg, Germany). These experiments were carried out in triplicate and were independently repeated at least 3 times.
Real-time polymerase chain reaction
Total RNA from cells were extracted at the indicated times, using the RNeasy Mini Kit following manufacturer's instructions (Qiagen, Hilden, Germany). After treatment with DNase I, total RNA (100 ng) was reverse-transcribed to cDNA by using the RevertAid™First Strand cDNA Synthesis Kit (Fermentas, USA) according to the manufacturer's instructions. The Maxima SYBR Green/RoxqPCRMaster Mix kit (Fermentas, USA) was used for real-time PCR. Primer sequences are shown in Table 1. Real-time PCR reactions were performed with StepOnePlus (Applied Biosystem, USA). The program of real-time PCR lasted 10 min at 95°C followed by 40 cycles of denaturation step at 95°C for 15 s followed by annealing and extension for 1 min at 60°C. The data were analyzed by Comparative CT (ΔΔCT) method. The relative gene expression levels were calculated by determining a ratio between the amount of every gene expression and that of endogenous control. Melting curve analysis (60°C to 95°C increment of 0.3°C) was used to determine the melting temperature of specific amplification products and primer dimmers. These experiments were carried out in triplicate and were independently repeated at least 3 times.
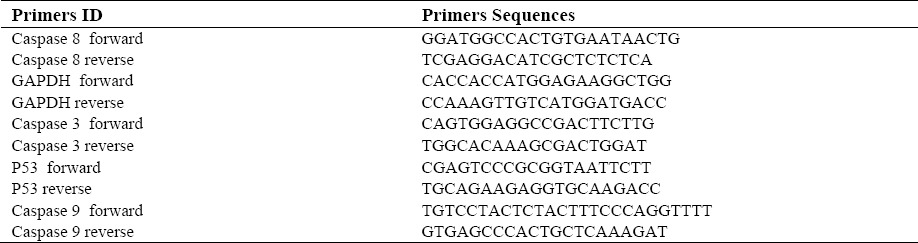
Table 1.
Primers used in real-time PCR.
Statistical analysis
All the quantitative data have been presented as the mean ± standard deviation. One-way analysis of variance (ANOVA) with Tukey post-hoc test was performed to determine statistical significance among different groups using SPSS software version 20. Significance was accepted at a level of P < 0.05.
RESULTS
IC50 assay
In this assay after the treatment of MCF-7 cells with MTT solution, the dark blue formazan crystals were seen in viable cells indicating their metabolic activity. The reduction in the number of cells was directly dependent on the drug doses as shown by the IC50s. The IC50 values for the CPA and DPCPX established (Fig. 1) and the results showed that the essential concentrations of CPA and DPCPX to achieve to IC50 in MCF-7 cells at 24 h are 180 and 0.87 µM, respectively (Fig. 1).
Fig. 1.
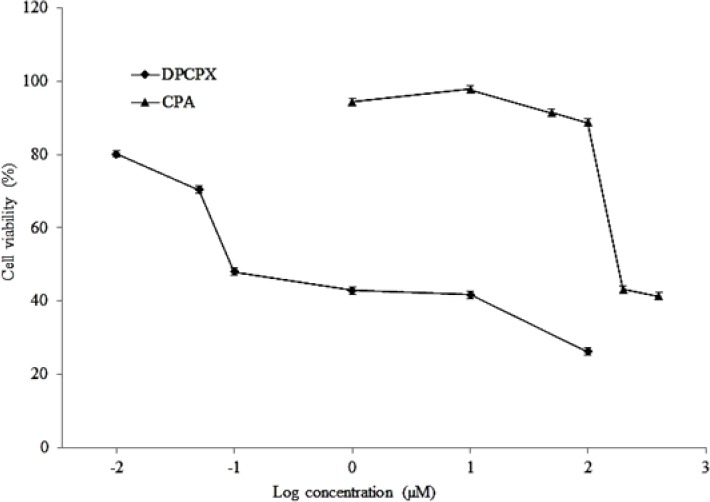
IC50 assay of DPCPX and CPA in MCF7 cancer cell lines. Cells incubated with/without the drug in different concentrations and the relative amount of viable cells estimated by measuring the absorbance of MTT solution. Graphs of viability versus drug concentration were used to calculate IC50 values.
MTT cell proliferation assay
The effect of CPA and DPCPX on cell proliferations was studied using MTT proliferation assay in MCF7 cell line. In this assay, CPA and DPCPX concentrations were used according to their IC50 values. Untreated cells were used as the control group. In order to determine the changes in the number of cells in the wells during the experiment, cell proliferation was measured 24, 48 and 72 h after the treatment period (Fig. 2). DPCPX treatment on MCF7 cells showed lower optical density at IC50 concentration than control especially at 72 h. Albeit, CPA treatment groups showed that optical density was increased gradually. This optical density is in proportion to the number of viable cells (Fig. 2).
Fig. 2.
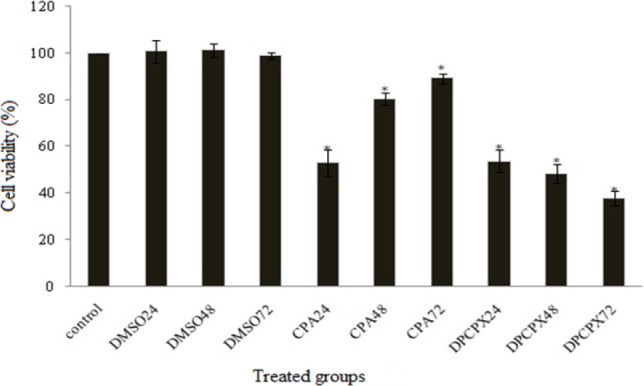
MTT assay at IC50 concentrations of CAP and DPCPX at 24, 48 and 72 h after treatment. Asterisk shows significant difference compared to control group (P > 0.05).
Flowcytometry
The flowcytometry assay was used to determine the apoptotic potential of CPA and DPCPX. The percentage of apoptotic cells was measured following AnnexinV (FL1-H) and PI (FL2-H) labeling (Fig. 3). Our results revealed that the 87 nM concentration of DPCPX based on IC50 concentration at indicated times (24, 48 and 72 h) could significantly induce apoptosis in MCF-7 cells progressively (P < 0.05) (Fig. 4). DPCPX treatment arrested MCf-7 cell proliferation and induced apoptosis (≥ 65% of inhibition) at 72 h, whereas the effect of CPA on programmed cell death in all different times was negative (P > 0.05) (Fig. 3) and apoptotic cell rate decreased in comparison with control group especially at 72 h (P < 0.05). DMSO that was used in the control sample (drug vehicle) had a smaller amount of apoptosis in MCF-7 cells than control at different times (P < 0.05) (Fig. 4).
Fig. 3.

Relative levels of apoptotic cells in MCF-7 cancer cell lines treated with DPCPX and CPA for 24, 48 and 72 h.
Fig. 4.
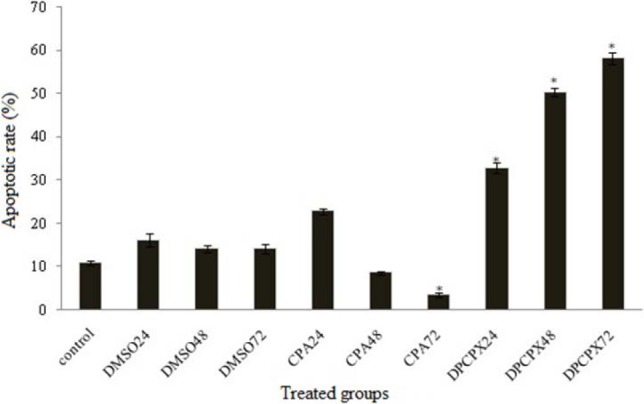
Relative levels of apoptotic cells in MCF-7 cancer cell lines treated with 87 nM DPCPX and 180 μM CPA for different times. Untreated cells used as control groups. *P < 0.05 compared to controls.
Results of real-time PCR
To examine the effect of CPA and DPCPX (based on their IC50 values) at different times on expression of p53 and caspases 3, 8, 9 genes in MCF-7 cells, we used real-time quantitative PCR.
The expression of p53 gene and caspase 3, 8, 9 was dramatically up-regulated by DPCPX treatment within different times especially at 72 h after treatment (Fig. 4, P < 0.05). CPA significantly down-regulated the expression of these genes in indicated times (P > 0.05) especially at 72 h (Fig. 5).
Fig. 5.

Effects of CPA and DPCPX on the levels of caspase 3, caspase 8, caspase 9, and p53 expression in MCF-7 cells in 24, 48 and 72 h after treatment. Asterisk shows significant difference versus control group (P > 0.05).
DISCUSSION
Many studies have hither to done for usage of new chemotherapeutic drugs against different receptors (9). Also in cancer therapy an ideal therapeutic approach would be inducing apoptosis specifically to the tumor cells, as well as at the sites of metastasis without affecting the healthy cells (25,26). To achieve this goal, usage of specific properties of each cancerous cell type is essential. One of these properties in MCF-7 cell is overexpression of adenosine A1 receptor.
Adenosine A1 receptor is a member of adenosine receptors super family. Regarding to different roles of adenosine A1 receptor in some diseases, it has been suggested that this receptor may act as a potent regulator of normal and tumor cell growth by exerting pro and anti-apoptotic effects (20,21,23,24). Earlier studies suggested that inducing of apoptosis in cancerous cells by adenosine A1 receptor antagonists would require p53 gene expression (25,26).
In the present study, we hypothesized that adenosine A1 receptor induces the apoptosis in many different cancerous cells. In a way that silencing adenosine A1 receptor with siRNA, could induce apoptosis in MDA-MB-468, MDA-MB-435, BT-474, ZR75-1, T47D and MCF-7 human breast tumor cell lines (20). Therefore, we also focused on A1 receptor and its agonist and antagonist drugs.
Our results in flowcytometry assay revealed that the use of adenosine A1 receptor antagonist (DPCPX) induced apoptosis in MCF-7 cells while agonist of this receptor (CPA) decreased apoptosis by ascending time manner. MTT assay showed that DPCPX at 87 nM exerted significant cytotoxicity to MCF-7 cells by time-dependent manner, whilst CPA at 180 µM increased the cell viability rate. Since MCF-7 cell naturally overexpresses adenosine A1 receptor, the promotion of viability of cancerous cells and inhibition of cell apoptosis are probable. It is reported that adenosine decreased cell viability and increased apoptosis rate in LU-65 lung cancer cells through adenosine A3 receptor (18). IB-MECA adenosine A3 agonist induced apoptosis in OVCAR3 ovarian cancer cell line (27). These findings are contrary to our findings about the role of adenosine A1 receptor in MCF-7 cells.
Since p53 and caspases 3, 8, and 9 control two main apoptosis pathways, we evaluated mRNA expression of these genes by real-time PCR. Quantitative real-time PCR results showed that DPCPX up-regulated mRNA level of p53, caspase 3, 8, and 9. Li et al. reported that by overexpression p53 in erytroleukemia cell line, G1 cell cycle was arrested and subsequently apoptosis was occurred (15). In addition, apoptosis in some cancer cells do not require new caspase expressions, but in most cases, apoptosis by drugs occur by induction of caspases expression. Caspase expression promotes apoptosis and also sensitizes cancerous cells to the immune system (15). Similar to these findings, our results revealed that DPCPX treatment in MCF-7 cells in addition to induced apoptosis can increase p53 and caspase expression. The role of adenosine A1 receptors in p53 and caspases 3, 8, and 9 expressions have not yet been well documented, but some reports show that activation or inhibition of this receptor decreases apoptotic cell death in some cells and increases apoptotic rate in some others. For example agonists of adenosine A1 receptor, N6-cyclohexyladenosine (CHA) and N6-(R)-phenylisopropyladenosine (R-PIA) decreased cell viability in human colon adenocarcinoma cells (CACO2), human hepatocyte carcinoma cells (HepG2), human renal adenocarcinoma cells (ACHN), Hep2, human Caucasian larynx carcinoma cell line but in the L929, mouse connective tissue fibroblast cell line did not have any apoptotic effects (28). However, in this report, gene expression test about these effects has not been conducted, but in astrosytoma RCR-1 cell line extracellular adenosine induced apoptosis via adenosine A1 receptor activation by inducing the expression of caspases 9, 8, and 3 and finally apoptosis by unknown pathway (29). An earlier study showed that adenosine up-regulates p53 expression via A3 adenosine receptor and induces apoptosis by activation of caspase 9 and caspase 3 in LU-65 lung cancer cell line (30). Finally, although the induction of apoptosis by the mechanisms underlying adenosine A1 receptor vary according to cancer cell types; targeted therapy is one of the main challenges in cancer therapy and adenosine A1 receptors have the specificity for their antagonists such as DPCPX. It is anticipated that adenosine receptor A1 antagonist, could significantly reduce the usage of anti-cancer drugs and enhance the efficacy with lower toxicity.
CONCLUSION
We have shown that A1 receptor antagonist induces apoptosis in MCF-7 cells in the concentration range of 180 nM. Furthermore, quantitative real-time PCR analysis revealed that mRNA levels of some genes involved in the apoptosis were altered by this receptor antagonist. Overall, our data suggest that A1 receptor antagonist may induce apoptosis in MCF-7 cells via p53 and caspases pathways. Although this in vitro study showed the induction of apoptosis by A1 receptor antagonist; it warrants further investigation to determine in vivo exposure consequences of this receptor application.
ACKNOWLEDGEMENTS
We would like to appreciate Central Laboratory Staffs of Isfahan Medical University for their collaborations.
REFERENCES
- 1.World Health Organization (W.H.O.) Fact sheet N 297 February 2015. Available at: http://www.who.int/mediacentre/factsheets/fs297/en,oct 9,2015 .
- 2.American Cancer Society. Overview: Breast cancer 2015. Available at: http://www.cancer.org/en,oct 12,2015 .
- 3.Holliday DL, Speirs V. Choosing the right cell line for breast cancer research. Breast Cancer Res. 2011;13:215. doi: 10.1186/bcr2889. [DOI] [PMC free article] [PubMed] [Google Scholar]
- 4.Tripodo G, Mandracchia D, Collina S, Rui M, Rossi D. New perspectives in cancer therapy: the biotin-antitumor molecule conjugates. Med Chem. 2014;8:1–4. [Google Scholar]
- 5.Rosenberg SA. Finding suitable targets is the major obstacle to cancer gene therapy. Cancer Gene Ther. 2014;21:45–47. doi: 10.1038/cgt.2014.3. [DOI] [PMC free article] [PubMed] [Google Scholar]
- 6.Williams M, Jarvis MF. Purinergic and pyrimidinergic receptors as potential drug targets. BiochemPharmacol. 2000;59:1173–1185. doi: 10.1016/s0006-2952(99)00341-x. [DOI] [PubMed] [Google Scholar]
- 7.Burnstock G. Pathophysiology and therapeutic potential of purinergic signaling. Pharmacol Rev. 2006;58:58–86. doi: 10.1124/pr.58.1.5. [DOI] [PubMed] [Google Scholar]
- 8.Burnstock G. Purine and pyrimidine receptors. Cell Mol Life Sci. 2007;64:1471–1483. doi: 10.1007/s00018-007-6497-0. [DOI] [PMC free article] [PubMed] [Google Scholar]
- 9.Merighi S, Mirandola P, Varani K, Gessi S, Leung E, Baraldi PG, et al. A glance at adenosine receptors: novel target for antitumor therapy. Pharmacol Ther. 2003;100:31–48. doi: 10.1016/s0163-7258(03)00084-6. [DOI] [PubMed] [Google Scholar]
- 10.Rastogi RP, Richa, Sinha RP. Apoptosis: molecular mechanisms and pathogenicity. 2009;8:155–181. [Google Scholar]
- 11.Fridman JS, Lowe SW. Control of apoptosis by p53. Oncogene. 2003;22:9030–9040. doi: 10.1038/sj.onc.1207116. [DOI] [PubMed] [Google Scholar]
- 12.Jain M, Kasetty S, Khan S, Desai A. An insight to apoptosis. J Res Prac Dent. 2014 ID 372284. [Google Scholar]
- 13.Jin Z, Wallace L, Harper SQ, Yang J. PP2A: B56ϵ, a substrate of caspase-3, regulates p53-dependent and p53-independent apoptosis during development. J Biol Chem. 2010;285:34493–34502. doi: 10.1074/jbc.M110.169581. [DOI] [PMC free article] [PubMed] [Google Scholar]
- 14.Su Z, Yang Z, Xu Y, Chen Y, Yu Q. Apoptosis, autophagy, necroptosis, and cancer metastasis. Mol Cancer. 2015;14:48. doi: 10.1186/s12943-015-0321-5. [DOI] [PMC free article] [PubMed] [Google Scholar]
- 15.Li J, Yuan J. Caspases in apoptosis and beyond. Oncogene. 2008;27:6194–6206. doi: 10.1038/onc.2008.297. [DOI] [PubMed] [Google Scholar]
- 16.Hermeking H. MicroRNAs in the p53 network: micromanagement of tumour suppression. Nat Rev Cancer. 2012;12:613–626. doi: 10.1038/nrc3318. [DOI] [PubMed] [Google Scholar]
- 17.Zhang A, Xu M, Mo YY. Role of the lncRNA–p53 regulatory network in cancer. J Mol Cell Biol. 2014;6:181–191. doi: 10.1093/jmcb/mju013. [DOI] [PMC free article] [PubMed] [Google Scholar]
- 18.Miyake N, Chikumi H, Takata M, Nakamoto M, Igishi T, Shimizu E. Rapamycin induces p53-independent apoptosis through the mitochondrial pathway in non-small cell lung cancer cells. Oncol Rep. 2012;28:848–854. doi: 10.3892/or.2012.1855. [DOI] [PubMed] [Google Scholar]
- 19.Suzuki K, Matsubara H. Recent advances in p53 research and cancer treatment. J Biomed Biotechnol. 2011 doi: 10.1155/2011/978312. ID 978312. [DOI] [PMC free article] [PubMed] [Google Scholar]
- 20.Mirza A, Basso A, Black S, Malkowski M, Kwee L, Patcher JA, et al. RNA interference targeting of A1 receptor-overexpressing breast carcinoma cells leads to diminished rates of cell proliferation and induction of apoptosis. Cancer Biol Ther. 2005;4:1355–1360. doi: 10.4161/cbt.4.12.2196. [DOI] [PubMed] [Google Scholar]
- 21.Lin Zh, Yin P, Reierstad S, O’Halloran M, Coon V JS, Pearson EK, et al. Adenosine A1 receptor, a target and regulator of ERá action, mediates the proliferative effects of estradiol in breast cancer. Oncogene. 2010;8:1114–1122. doi: 10.1038/onc.2009.409. [DOI] [PMC free article] [PubMed] [Google Scholar]
- 22.Aghaei M, Panjehpour M, Karami-Tehrani F, Salami S. Molecular mechanisms of A3 adenosine receptor-induced G1 cell cycle arrest and apoptosis in androgen-dependent and independent prostate cancer cell lines: involvement of intrinsic pathway. J Cancer Res Clin Oncol. 2011;137:1511–1523. doi: 10.1007/s00432-011-1031-z. [DOI] [PMC free article] [PubMed] [Google Scholar]
- 23.Lee HT, Gallos G, Nasr SH, Emala CW. A1 adenosine receptor activation inhibits inflammation, necrosis, and apoptosis after renal ischemia-reperfusion injury in mice. J Am Soc Nephrol. 2004;15:102–111. doi: 10.1097/01.asn.0000102474.68613.ae. [DOI] [PubMed] [Google Scholar]
- 24.Turner CP, Blackburn MR, Rivkees SA. A1 adenosine receptors mediate hypoglycemia-induced neuronal injury. J Mol Endocrinol. 2004;32:129–144. doi: 10.1677/jme.0.0320129. [DOI] [PubMed] [Google Scholar]
- 25.Selim ME, Hendi AA. Gold nanoparticles induce apoptosis in MCF7 human breast cancer cells. Asian Pac J Cancer Prev. 2012;13:1617–1620. doi: 10.7314/apjcp.2012.13.4.1617. [DOI] [PubMed] [Google Scholar]
- 26.Gerber DE. Targeted therapies: a new generation of cancer treatments. Am Fam Physician. 2008;77:311–319. [PubMed] [Google Scholar]
- 27.Aghaei M, Shirali S. A3 adenosine receptor agonist (IB-MECA) induced apoptosis in OVCAR3 ovary cancer cell line. Res Pharm Sci. 2012;7:S97. [Google Scholar]
- 28.Hosseinzadeh H, Jafari MR, Shamsara J. Selective inhibitory effect of adenosine A1 receptor agonists on the proliferation of human tumor cell lines. Iran Biomed J. 2008;12:203–208. [PubMed] [Google Scholar]
- 29.Sai K, Yang D, Yamamoto H, Fujikawa H, Yamamoto S, Nagata T, et al. A1 adenosine receptor signal and AMPK involving caspase-9/-3 activation are responsible for adenosine-induced RCR-1 astrocytoma cell death. Neurotoxicology. 2006;27:458–467. doi: 10.1016/j.neuro.2005.12.008. [DOI] [PubMed] [Google Scholar]
- 30.Otsuki T, Kanno T, Fujita Y, Tabata C, Fukuoka K, Nakano T, et al. A3 adenosine receptor-mediated p53-dependent apoptosis in Lu-65 human lung cancer cells. Cell Physiol Biochem. 2012;30:210–220. doi: 10.1159/000339058. [DOI] [PubMed] [Google Scholar]