

Abstract
Purpose
Circulating melanoma cells (CMCs) constitute a potentially important representation of time-resolved tumor biology in patients. To date, genomic characterization of CMCs has been limited due to the lack of a robust methodology capable of identifying them in a format suitable for downstream characterization. Here, we have developed a methodology to detect intact CMCs that enables phenotypic, morphometric and genomic analysis at the single cell level.
Experimental design
Blood samples from 40 metastatic melanoma patients and 10 normal blood donors (NBD) were prospectively collected. A panel of 7 chondroitin sulfate proteoglycan 4 (CSPG4)-specific monoclonal antibodies (mAb) was used to immunocytochemically label CMCs. Detection was performed by automated digital fluorescence microscopy and multi-parametric computational analysis. Individual CMCs were captured by micromanipulation for whole genome amplification (WGA) and copy number variation (CNV) analysis.
Results
Based on CSPG4 expression and nuclear size, 1 to 250 CMCs were detected in 22 (55%) of 40 metastatic melanoma patients (0.5 to 371.5 CMCs/ml). Morphometric analysis revealed that CMCs have a broad spectrum of morphologies and sizes but exhibit a relatively homogeneous nuclear size that was on average 1.5-fold larger than that of surrounding PBMCs. CNV analysis of single CMCs identified deletions of CDKN2A and PTEN, and amplification(s) of TERT, BRAF, KRAS and MDM2. Furthermore, novel chromosomal amplifications in chr12, 17 and 19 were also found.
Conclusions
Our findings show that CSPG4 expressing CMCs can be found in the majority of advanced melanoma patients. High content analysis of this population may contribute to develop effective therapeutic strategies.
Keywords: CSPG4, nuclear morphometry, circulating melanoma cells, DNA copy number variation, metastatic melanoma
Introduction
Recently, molecular-targeted therapies have provided promising results in treating metastatic melanoma (1,2). Unfortunately, a significant number of patients experience a short response and recur within a few months after therapy (3–5). The genetic heterogeneity of cancer cells within a patient can potentially contribute to treatment resistance and the high rate of recurrence, and represents a major challenge for personalized cancer therapy. In melanoma, genomic heterogeneity has been observed among tumors in a single patient (6–8), but also at separated locations within individual tumors (9). This inter- and intra-tumoral heterogeneity, which has been demonstrated also in other solid tumors (10,11), reflects the evolutionary complexity that tumor cells display under specific microenviromental and therapeutic pressures during the course of the disease (5,7,11). A better understanding of the genomic landscape of tumors at the single cell level is hence required to successfully redesign and monitor future targeted therapeutic strategies.
In this context, circulating tumor cells (CTCs) released from either a primary or metastatic tumor can be considered a valuable non-invasive tool to characterize tumor changes over time. Under the assumption that the CTC population represents the distributed tumor burden of a patient, its genomic characterization over time could potentially provide a complementary sample to detect important genetic markers. The low concentration of CTCs (12) combined with the low sensitivity of the available methodology to detect and isolate CMCs (13,14) and with the lack of a common marker for reliably identifying circulating melanoma cells (CMCs) (15) has significantly impeded the research necessary to evaluate clinical utility of CMCs in this disease. A variety of molecular (16) and cellular approaches (14,17–20) have been developed over the last 20 years to address this challenge.
In general, results provided by these technologies have highlighted the significant value that CMCs may have as a prognostic biomarker in patients with melanoma (14,21). Learning from previous experiences, we developed a CMC assay based on the non-selective High Definition Single Cell Assay (HDSCA) methodology. The HDSCA was originally designed to identify and characterize CTC in patients with epithelial cancers. At variance from other currently used methodologies which rely on protein-based enrichment strategies to selectively capture CTCs from peripheral blood, the HDSCA uses multi-parametric computational analysis to detect candidate cells amongst PBMCs. This strategy does not alter cell integrity, producing imagery of sufficient quality for diagnostic pathology interpretation. Furthermore it allows for detailed high content analysis including molecular, morphometric and genomic characterization of CTCs at the single cell level (22).
Based on previous data, we have selected chondroitin sulfate proteoglycan 4 (CSPG4) as a biomarker to identify melanoma cells. This tumor antigen is highly expressed on the surface of melanoma cells in at least 85% of melanoma tumors (23), and has a limited distribution in normal tissues. CSPG4 has been successfully used to identify metastatic melanoma cells in sentinel lymph nodes by RT-PCR and immunohistochemistry, and was shown to be more sensitive and specific than MART-1, S-100 and HMB-45, three commonly used melanoma markers (24). Additionally, immunomagnetic enrichment of CMCs utilizing single or combinations of mAb recognizing different CSPG4 epitopes has been performed by several groups (17,25,26). All together, these studies in conjunction with the high association constant of most, if not all available CSPG4-specific mAb, provide compelling evidence for this tumor antigen to be a useful biomarker for CMC detection.
The goal of this study was to test this possibility utilizing PBMCs from patients with advanced melanoma and to characterize the morphological properties and genomic heterogeneity of CMCs.
Materials and Methods
Melanoma cell lines and spiking experiments
The melanoma cell lines WM278, 1617 and 1789 were purchased from the Wistar Institute Collection at the Coriell Institute for Medical Research, Camden, NJ. They were maintained in melanoma growth medium (Tu2%), consisting of four parts of MCDB153 (Sigma-Aldrich, Saint Louis, MO) and one part of L-15 (Invitrogen, Carlsbad, CA), supplemented with 1.68 mmol/L calcium chloride, 5 μg/ml bovine insulin and 2% fetal bovine serum (Invitrogen). The culture medium was changed every 2 days. To determine expression of markers, melanoma cells were spiked into PBMCs at 1:100 and plated as a monolayer onto custom made cell-adhesion glass slides. To evaluate sensitivity while mimicking patient samples, 0, 10, 50, 100 and 500 melanoma cell lines were spiked into three million PBMCs each. The experiment was repeated three times using each cell line to validate reproducibility.
CSPG4 and HMB-45 monoclonal antibodies
The CSPG4-specific mAb 149.53, 763.74, TP61.52, VF1-TP41.2, VF4-TP108, VF4-TP109.2, and VT80.12 were developed and characterized as described (23,24,27). mAb were purified from ascitic fluid by sequential precipitation with ammonium sulphate and caprylic acid (24). The purity and activity of mAb preparations were assessed by SDS-PAGE analysis, and by testing with CSPG4-bearing melanoma cells in a binding assay. HMB-45-specific mAb clone gp-100 was purchased from Dako, Carpinteria, CA.
Immunofluorescence
The optimal CSPG4 staining was performed as follows: After the slides (containing melanoma cell lines spiked into PBMCs or patient blood samples) were thawed and fixed with 2% neutral buffered formalin solution (VWR, San Dimas, CA, USA), non-specific binding sites were blocked with 10% goat serum (Millipore, Billerica, MA, USA). Slides were subsequently incubated with CSPG4-specific mAbs (5 μg/ml total concentration) and Alexa Fluor® 647 pre-conjugated anti-CD45 antibody (MCA87A647, AbD serotec, Raleigh, NC, USA) for 40 min at 37 °C. Slides were then incubated with Alexa Fluor® 555 goat anti-mouse IgG1 antibody (A21127, invitrogen) for 20 min at 37°C. Cells were counterstained with Hoechst 33258 and mounted with an aqueous mounting media. The CSPG4/HMB-45 staining protocol includes minor modifications. After cells were incubated with Alexa Fluor® 555 goat anti-mouse IgG1 antibody (A21121, invitrogen), they were permeabilized using cold methanol for 5 min at RT. Then, cells were incubated with HMB-45-specific mAb (1 μg/ml) for 40 min at 37 °C and subsequently with Alexa Fluor® 488 goat anti-mouse IgG1 antibody.
Imaging and technical analysis
After CSPG4 staining, all nucleated cells in the specimen were imaged as previously reported (28). Identified candidate cells were evaluated by direct visualization to eliminate possible false positives such as dye aggregates and classified as CMCs based on CSPG4 expression and morphometric parameters. Other cells related to CMCs but lacking essential features were also tracked and classified. The concentration of CMCs per ml is calculated by counting the total number of nucleated cells on the glass slide used and comparing it to the PBMC count in the patient's blood specimen. For this reason, fractional values of CMCs ml-1 are possible.
Blood sample collection
Peripheral blood (8 ml) was collected from 40 metastatic melanoma patients and 10 NBD into anti-coagulated Cell-Free DNA BCT® tubes (Streck, Omaha, NE, USA). Samples from non-local sites (Comprehensive Cancer Centers of Nevada, Las Vegas, NV) were shipped overnight in temperature stabilized containers and processed within 24 hours of the blood draw. Samples from local sites (Pacific Oncology and Hematology, Encinitas, CA) were held at RT for 24 h to mimic samples coming from non-local sites. NBD specimens were collected at The Scripps Research Institute's Normal Blood Donor Service. The analysis of the samples was conducted with no previous knowledge of patient's disease status.
Blood sample processing
Whole blood specimens were prepared as previously described (28). Briefly, blood samples were subjected to erythrocyte lysis in isotonic NH4Cl (ammonium chloride) solution. Nucleated cells were re-suspended in PBS (4 × 10⁶ cells/ml) and a volume of 750 μl was plated as a monolayer on custom made cell-adhesion glass slides (Marienfeld, Lauda-Königshofen, Germany) up to 16 slides. Slides were incubated at 37°C for 40 min and then stored at -80 °C for future evaluation. For CMC detection in melanoma patients, four slides holding approximately twelve million cells were used as a test.
Patient population
All patients were prospectively enrolled according to IRB approved protocols. Clinical data were retrospectively collected and are shown in table 1. All patients had metastatic disease, as determined by radiological and clinical criteria at the time of blood draw. Thirty patients had stage IV and ten patients had stage IIIC. BRAF mutational status was assessed in 25 patients and 11 had the V600E mutation. Twenty-one patients with stage IV and one with stage IIIC had died by the time of CMC analysis, 3 were in complete remission, 15 were alive with disease and one was lost to follow-up. Although melanoma has a poor prognosis with a median survival of 6 to 9 months (29), the follow-up period for this study ranged from 0.08 to 22 months. Patients received different therapies including chemotherapy (cisplatin, carboplatin), immunotherapy (anti-CTLA4 mAb) and targeted therapy (BRAF-MEK inhibitors).
Table 1. Patient demographics and histopathologic characteristics.
| Characteristics | n (%) | Average CMCs/ml (range) |
|---|---|---|
| Patients | 40 | 14.9 (0.5-371.5) |
| Age (years) | ||
| Median/range | 55.5/45-91 | |
| Gender | ||
| Female | 14 (35.0) | 25.7 (0.0-371.5) |
| Male | 25 (62.5) | 8.3 (0.0-139.4) |
| unknown | 1 (2.5) | |
| Race | ||
| Asian | 1 (2.5) | 12.7 |
| White | 35 (87.5) | 16.3 (0.0-371.5) |
| Unknown | 4 (10.0) | 0.4 (0.0-1.1) |
| BRAF status | ||
| Positive | 11 (27.5) | 45.9 (0.0-371.5) |
| WT | 13 (32.5) | 1.1 (0.0-4.8) |
| ND | 16 (40.0) | 4.9 (0.0-53.7) |
| Number of CMC | ||
| 0 | 18 (45.0) | |
| ≥1 | 22 (55.0) | 27.0 (0.5-371.5) |
| Type of primary melanoma | ||
| cutaneous | 30 (75.0) | 18.7 (0.0-371.5) |
| Rectal | 1 (2.5) | 0 |
| Unknown Primary | 5 (12.5) | 0.4 (0.0-1.1) |
| Unknown | 4 (10.0) | 0.7 (0.0-2.1) |
| Primary tumor histology | ||
| Superficial spreading | 6 (15.0) | 1.3 (0.0-3.6) |
| Nodular | 14 (3.5) | 15.3 (0.0-139.4) |
| Lentigo | 1 (2.5) | 0 |
| Spindle cell | 3 (7.5) | 0 |
| Unknown | 16 (40.0) | 23.3 (0.0-371.5) |
| Site of metastasis | ||
| Skin | 9 (22.5) | 6.6 (0.0-53.7) |
| subcutaneous | 8 (20.0) | 0.7 (0.0-3.3) |
| lung | 13 (32.5) | 11.3 (0.0-139.4) |
| liver | 7 (17.5) | 2.5 (0.0-4.7) |
| Bone | 7 (17.5) | 0.5 (0.0-3.3) |
| Brain | 12 (30.0) | 15.8 (0.0-139.4) |
| Adrenal | 4 (10.0) | 0.6 (0.0-2.4) |
| Stage | ||
| IIIC | 10 (25.0) | 1.0 (0.0-3.1) |
| IV | 30 (75.0) | 18.5 (0.0-371.5) |
| Survival status | ||
| Deceased | 22 (55.0) | 26.8 (0.0-371.5) |
| Alive | 18 (45.0) | 1.2 (0.0-3.6) |
| with disease | 15 (83.3) | 0.8 (0.0-3.6) |
| complete remission | 3 (16.7) | 2.3 (0.8-3.1) |
CMC extraction and copy number variation analysis
CMCs were relocated on the glass slide and reimaged at 40× for detailed cytomorphometric analysis as previously described (28). CMC were then captured by micromanipulation and whole genome amplification (WGA) and CNV analysis were performed as previously described (22).
Statistical analysis
Relative CSPG4 intensity measured in cell lines was compared by one-way ANOVA with a Mann Whitney correction test using GraphPad Prism version 5.04 (GraphPad Software, San Diego, CA, USA). A receiver operating characteristic (ROC) curve was generated using clinical outcome for distinguishing high risk from low risk patients. These are reported in the results as the CMC/ml value with the highest sensitivity and specificity with 95% confidence intervals (CIs), and was calculated using GraphPad Prism 5.04.
Results
CSPG4 protein expression by WM1617, WM278 and WM1789 melanoma cell lines
The WM1617, WM278 and WM1789 melanoma cell lines which represent the radial growth phase, the vertical growth phase and metastasis of melanoma progression, respectively, were used to optimize the HDSCA methodology. To determine CSPG4 expression, melanoma cell lines were spiked into PBMCs at 1:100 and plated as a monolayer onto custom made cell-adhesion glass slides. CSPG4 protein expression was detected on the three melanoma cell utilizing the mAbs 149.53, 763.74, TP61.5, VF1-TP41.2, VF4-TP108, VF4-TP109.2, and VT80.12, that recognize distinct and spatially distant CSPG4 epitopes (Figure 1. Relative CSPG4 signal expression using mAb VT80.12 and TP61.5 was on average between 1.6 and 7 times higher than that obtained using mAb VF4-TP108 and 149.53. The staining yielded by the combination of all 7 CSPG4-specific mAbs had a higher intensity than that obtained with each individual mAb at the same concentration (Figure 1). PBMCs from a normal blood donor (NBD) were used to normalize signal intensities. Based on immunofluorescent parameters, an intact CMC was defined as: CSPG4 positive, CD45 negative, with an intact, non-apoptotic nucleus detected by Hoechst 33258 imaging. Positivity for CSPG4 was defined as the fluorescent signal being at least 2-fold higher than the background signal of surrounding PBMCs, which was determined by measuring the CSPG4 signal in 1.7×10⁶ PBMCs. Negativity of CD45 was defined as having signal below visual detection under the condition that >99% of all surrounding PBMCs were detectable, as described for the HDSCA methodology.
Figure 1. CSPG4 expression on melanoma cells.

(a) Representative merged color images of WM1617, WM278 and WM1789 cells stained with CSPG4-specific mAbs are shown in column 1, 2 and 3 (from left to right), respectively. CT (no CSPG4 mAbs) are shown in line 1, the combination of the 7 CSPG4-specific mAbs is shown in line 2 and individual CSPG4-specific mAb are shown from line 3 to 9 (red: CSPG4, green: CD45, blue: Hoechst). (b) Relative CSPG4 intensity normalized against the background signal (dashed line) on PBMCs in WM1678, WM278 and WM1789 melanoma cell lines across staining conditions.
CMC assay linearity and reproducibility by enumeration of melanoma cells spiked in PBMCs
To evaluate CMC assay linearity and reproducibility using the CSPG4 antibody cocktail while mimicking patient samples, serial dilutions of melanoma cell lines (0, 10, 50, 100 and 500) were spiked into approximately 3 × 10⁶ PBMCs from a NBD. As displayed in supplementary figure S1, the number of WM1617, WM278 and WM1789 cells detected is plotted against expected cells. A percentage of detection of 97.0, 98.3 and 97.3 with a linear detection coefficient of 0.99, 0.99 and 0.97 was obtained in WM1617, WM278 and WM1789 cells, respectively.
CMC assay specificity by comparing normal blood donor and melanoma patient samples
To assess the specificity of the assay using the combination of all 7 CSPG4-specific mAbs, 10 blood samples from normal donors and 40 from melanoma patients were evaluated. In addition to the immunofluorescent criteria described above, a morphometric analysis of candidate cells was performed to determine quantitative differences that may functionally contribute to improve the criteria for a cell to be defined as a CMC in patient samples. Relative nuclear size (RNS) was found to be a crucial informative parameter (Figure 2). Approximately, 70% of candidate cells (517) detected in melanoma patients had a RNS smaller than 2.5 with an average of 1.5 (quadrant a), and had a relative CSPG4 intensity range of 2 to 289-fold brighter (top left cells) than surrounding PBMCs (mean 47.2± 55.1). The remaining 30% (224 cells) had a RNS up to 13-fold larger than the surrounding PBMCs with an average close to 5 (quadrant b, grey dots), and a relative CSPG4 intensity range of 2 to 8-fold brighter than PBMCs (top right cell). The results obtained from NBD samples (quadrant b, blue dots) showed that 100% of candidate cells had a RNS of at least 2.5-fold larger than surrounding PBMCs, with a relative CSPG4 signal lower than 8 (bottom right cell). Based on this evaluation, and assuming that normal blood cells may exist among candidate cells in melanoma patient samples, we defined an exclusion criterion for those cells near the lower limit of CSPG4 intensity. Thus, cells from melanoma patients that were CD45 negative, had a relative CSPG4 intensity below 8, an intact nucleus and a RNS of 2.5 or larger (Figure 2, top right cell) were excluded.
Figure 2. CMC definition.
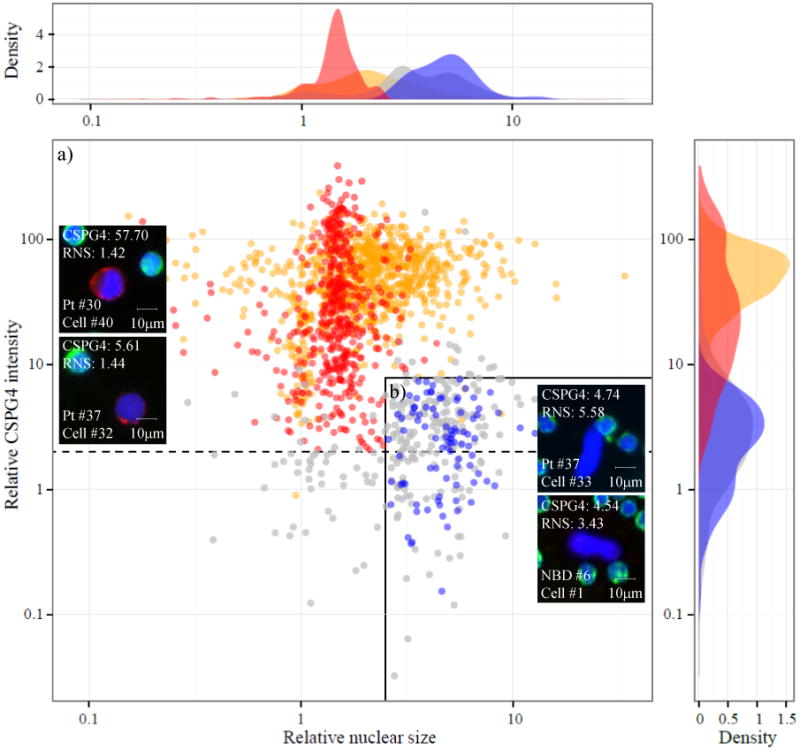
Scatter plot of candidate 1740 cells from 10 NBDs (blue; 105 cells), 40 melanoma patients (red; 741 cells) and 3 melanoma cell lines (orange; 894 cells) classified by relative CSPG4 protein expression and RNS. This parameter is calculated as the ratio of nuclear size of a candidate cell (in pixels) and the mean nuclear size of surrounding PBMCs. Excluded candidate cells from melanoma patients are represented in grey. This group includes cells with a relative CSPG4 signal <2, cells with a relative CSPG4 signal between 2-8 and a RNS larger than 2.5 and cells excluded by clinical pathologist. Dashed line indicates the cutoff value of 2 for relative CSPG4 intensity. Solid line delimits cells with a relative CSPG4 signal below 8 and RNS higher than 2.5. Both measurements are normalized against the values obtained in surrounding PBMCs. Representative merged color images of two CMCs (left), one ‘excluded candidate’ cell (top right) and one NBD cell. RNS: relative nuclear size; NBD: normal blood donor.
A comparison of the immunocytochemical features between melanoma cell lines (quadrant a, orange dots) and CMCs from melanoma patients revealed significant differences, including a relative CSPG4 intensity mean 12 times greater in cell lines than in CMCs. Moreover, these cell lines displayed a wider RNS range (up to 10 times larger than PBMCs), with an average of 2.4.
Frequency of CMC in metastatic melanoma patients
Between 1 and 250 CMCs in 22 of 40 (55%) metastatic melanoma patients were detected (table 2). The number of CMCs ranged between 0.5 and 371.5/ml (mean 14.9 CMCs/ml), and no CMCs were detected in NBDs (figure 3a). Nineteen (47.5%) of the positive patients had ≥ 1 CMCs/ml and 2 (5%) ≥ 100 CMC/ml. The CSPG4 signal intensity within the CMC population varied within and across patients (Figure 3b). Four patients had only CSPG4 bright (from 8 to 389-fold brighter than the surrounding PBMCs) CMCs, 9 only CSPG4 dim (from 2 to 8-fold brighter than the surrounding PBMCs) CMCs, and 9 both CSPG4 bright and CSPG4 dim CMCs. Figure 3c shows the cytomorphology and immunophenotype of 4 representative CMCs from two melanoma patients (#30 and #37). In order to evaluate the morphometric heterogeneity of CMCs, we analyzed the cells found in the two patients (#30 and #37) with more than 100 CMC/ml (Figure 3d and 3e). CMC shapes varied within and between these two patients. For example, most of the cells from patient 30 were highly pleomorphic in shape and presented polygonal nuclei. Cell roundness mean was 1.01 ± 0.01 on average for patient PBMCs, and 1.11 ±0.12 and 1.05 ± 0.02 for CMCs in patient 30 and 37, respectively, indicating that nuclei from both the PBMCs and the HD-CMS were essentially round with the CMCs tending very slightly toward oblong. Diameter plots indicate that CMCs in melanoma patient 30 and 37 were significantly larger than their corresponding PBMCs (Diameter: 12.6 ± 2.3 vs. 8.9 ± 0.5μm, P<0.0001 and 11.8 ± 1.2 vs. 8.9 ± 0.6μm, P<0.0001, respectively). In most patients, only single cells were detected, except for 7 patients (#5, 13, 17, 18, 30, 35 and 37) containing two-cell to six-cell clusters.
Table 2. CMC levels and clinical data in patients with ≥1 CMC.
D: deceased; CR: complete remission; AD: alive with disease; ND: not determine.
| Pt # | Total CMCs | CMCs/ml | Survival (days) | LDH | IULN | Pt status | Stage |
|---|---|---|---|---|---|---|---|
| 30 | 250 | 371.5 | 8 | 5016 | 180 | D | IV |
| 37 | 156 | 139.4 | 21 | 1414 | 180 | D | IV |
| 5 | 15 | 53.7 | 24 | ND | ND | D | IV |
| 10 | 10 | 12.7 | 19 | 826 | 225 | D | IV |
| 6 | 2 | 4.8 | 132 | ND | ND | D | IV |
| 40 | 3 | 3.6 | 499 | 306 | 246 | AD | IV |
| 19 | 7 | 3.5 | 235 | ND | ND | D | IV |
| 3 | 2 | 3.3 | 136 | 231 | 250 | D | IV |
| 17 | 3 | 3.1 | 401 | 214 | 225 | AD | IV |
| 35 | 5 | 3.1 | 525 | 155 | 246 | CR | IV |
| 15 | 4 | 2.4 | 393 | ND | ND | AD | IIIC |
| 33 | 3 | 2.4 | 528 | 462 | 250 | AD | IV |
| 2 | 2 | 2.2 | 745 | 236 | 250 | D | IIIC |
| 4 | 1 | 2.1 | 100 | ND | ND | D | IV |
| 31 | 1 | 1.8 | 362 | 162 | 246 | D | IV |
| 21 | 2 | 1.5 | 323 | ND | ND | AD | IIIC |
| 20 | 3 | 1.4 | 274 | ND | ND | AD | IV |
| 18 | 1 | 1.2 | 401 | 201 | 225 | D | IV |
| 11 | 2 | 1.1 | 431 | 131 | 255 | AD | IIIC |
| 38 | 1 | 0.8 | 508 | 165 | 246 | CR | IV |
| 24 | 1 | 0.6 | 124 | ND | ND | D | IV |
| 14 | 1 | 0.5 | 804 | ND | ND | D | IIIC |
Figure 3. Frequency of CMCs in metastatic melanoma patients.
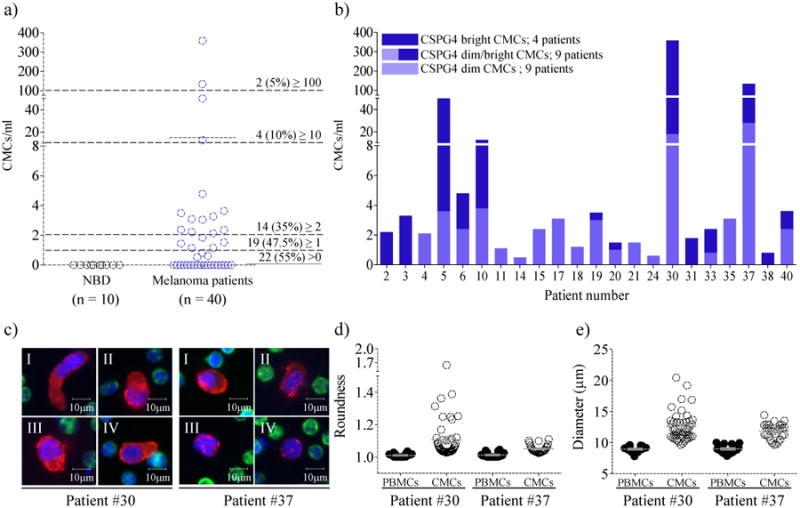
(a) Frequency of CMCs in metastatic melanoma patients (n = 40) and NBDs (n = 10). The mean values are shown as a solid black line (P < 0.05 Wilcoxon t test). (b) CMC/ml per patient with bright CSPG4 (8-289) CMCs (dark purple) and dim CSPG4 (below 8) CMCs (light purple). (c) Representative merged color images of 8 CMCs from melanoma patient #30 and #37 (red: CSPG4; green: CD45; blue: Hoechst). (d) Roundness (perimeter squared)/(4*pi*area). (e) Diameter (μm). The mean values are shown as a grey line. Error bars represent the standard deviation.
HMB-45 characterization of CMCs
Figure 4a shows the distribution of 124 CMCs found in 40 melanoma patients that were either CSPG4+/HMB-45- (left) or CSPG4+/ HMB-45+ (right). Sixty-one (49%) of 124 cells were CSPG4+/HMB-45-, while the remaining 68 cells (51%) were CSPG4+/ HMB-45+. To evaluate HMB-45 signal heterogeneity of CMCs within and across patients, we analyzed CMCs found in the two melanoma patients (#30 and #37) with the highest number of cells available for assay. In patient #30, 58 cells were reviewed. In general, CMCs from this patient had a high relative CSPG4 intensity (mean 62.9). Thirty-three (57%) of the CMCs were positive for both CSPG4 and HMB-45 (relative HMB-45 intensity mean was 20.7). In patient #37, 37 cells were evaluated. In this case, 24 CMCs (68%) were positive for both CSPG4 (relative CSPG4 intensity mean 16.3) and HMB-45 (relative HMB-45 intensity mean 34.6) markers. Despite the low sensitivity of the HMB-45 marker observed in our assay, its high specificity supported the inclusion of those CMCs with low CSPG4 expression, especially in patient #37 in whom 26% of CMCs had a relative CSPG4 intensity signal close to the lower limit cutoff (Figure 4b).
Figure 4. Heterogeneous HMB-45 expression by CMCs.

(a) Scatter plot of CMCs detected in 40 melanoma patients classified by relative CSPG4 and HMB-45 signal intensity. Both measurements are normalized against surrounding PBMCs. Vertical and horizontal dashed lines indicate the cutoff value for signal intensity. (b) Gallery of 4 CMCs detected in two melanoma patients (patient #30 and #37) using the CMC assay in combination with HMB-45 staining (red: CSPG4, white: HMB-45, green: CD45, blue: Hoechst).
DNA copy number variation in CMCs
DNA CNV analyses were assessed in single CMCs, WBCs and ‘excluded candidate cells’ isolated from melanoma patient #30 (40 cells) and #37 (23 cells) (Figure 5). Chromosomal alterations were found in 100% of the CMCs analyzed. A unique clonal population (38 CMCs) in patient #30 and two clonal populations (18 CMCs) in patient #37 were observed. Chromosomal gains and deletions of chr5, 7, 9, 10, 12, 17, and 19 were detected in both patients. Candidate genes encoding components of commonly altered pathways in melanoma were located at these amplified/deleted areas. The amplification of MLL3 (mixed-lineage leukemia) in chromosome 7, an important histone regulator gene, and the loss of CDKN2A (cyclin-dependent kinase inhibitor 2A), a tumor suppressor gene that regulates the pRB and p53 pathways (30,31), were found to be present in both patients, along with an increase of a segment on chromosome 5p containing TERT (telomerase reverse transcriptase) locus, which encodes the catalytic protein subunit of the telomerase (31). The loss of PTEN, responsible for the negative regulation of the PI3K/AKT pathway (32) was found only in patient #30. In patient #37, two CMC populations (clone A and B) were identified (Figure 5b). MDM2 (Mouse double minute 2 homolog), an important negative regulator of the p53 tumor suppressor (33), was amplified in all CMCs from both clones and have more than 20 copies each. Amplification of BRAF (34), which regulates the MAPK signaling pathway, was identified in all CMCs from clone A. KRAS (Kirsten rat sarcoma viral oncogene homolog), involved primarily in regulating cell division, was only amplified in clone B. No chromosomal alterations were detected in the WBCs or ‘excluded candidate cells’ (Supplementary Figure S2).
Figure 5. DNA copy number variations in single CMCs isolated from two melanoma patients.

(a) and (b), heatmaps representing chromosomic gains (red) and deletions (blue) in single CMCs from patient #30 (a) and patient #37 (b); The hierarchical clustering was performed in R using the heatmap.2 function in the gplots package. Ward's method with Manhattan distance metric was used for the clustering. Using median centered CNV profiles, cutoff ratios versus the median of 0.675 and 1.7 were used to define deletions and amplifications, respectively. These cutoffs were used both to color the heatmap and to do the frequency analysis (c and d); c and d, representative single PBMCs (top) and CMCs (bottom) DNA CNV profiles. Solid and dashed lines in d (bottom) and f represents clone A and B, respectively. Adjusted log10 ratio of read depth of sequencing data are plotted for individual bins (y axis) across genomic regions (x axis); e and f, candidate genes located in the amplified and deleted genomic regions. PMBCs (δ), ‘excluded candidate’ cells (¥) (see supplementary figure S2) and cells displayed in detail in c and d (□). Novel chromosomal amplifications (*) (see supplementary table S1).
CMC levels and clinical outcome of melanoma patients
The number of patients in this study (n = 40) was not powered for survival analysis nor was the sampling of blood controlled for a specific line of therapy. Nevertheless, there was an association between the number of CMC per ml of blood and the short survival observed in some patients (table 2). A receiver operating characteristic (ROC) curve was constructed using the clinical outcome from melanoma patients (n = 39). A cutoff value of 8.7 CMC/ml was determined from this cohort data. The mean overall survival time for patients with ≥ 8.7 CMC/ml which was 315.9 days was significantly longer than that for those with ≥ 8.7 CMC/ml, which was 18 days.
Discussion
Given the implementation of emerging targeted therapies for metastatic melanoma in the clinic, a complete evaluation of the overall genomic tumor heterogeneity in individual patients using captured CMCs could provide better therapeutic directions than that from a single biopsy (35–37). Technical progress in the field of CTC has led to the development of several methodologies that have enabled cellular detection and characterization of CTCs. Although several groups including ours have provided convincing lines of evidence of the biological and clinical significance of CTCs with respect to epithelial cancers (22,38), similar approaches for melanoma seem to be inadequate due to the low recovery rate observed. For example, Rao et al. and, more recently Khoja et al. evaluated the CellSearch® system using CD146 coated immunomagnetic beads for CMC isolation in 44 and 101 advanced melanoma patients, respectively. Using a threshold of ≥2 CMCs per 7.5 ml of blood, they reported positive results in about 25% of the patients analyzed (13,14). Whether the low frequency of CMCs in comparison to CTCs (28) is due to the biology of melanoma and/ or to the low sensitivity of the currently available methods and biomarkers is unknown. We have demonstrated that the HDSCA using a CSPG4 antibody cocktail has successfully identified CMCs in 55% of patients with advanced melanoma using a threshold of ≥1 CMCs per test (0.2-2ml of blood).
Due to the highly heterogeneous expression of candidate protein markers in clinical diagnosis of primary and metastatic melanomas (39), several distinct markers such as Tyrosinase, MAGE-3, MART-1, CD146 have been proposed for CMC detection (40–42). In this study, we elected to target CSPG4. The use of seven mAbs against different and spatially distant epitopes of this proteoglycan identified CSPG4 expression in all melanoma cell lines and yielded detection of >97% of those cells independently of their expression level (Figure 1). The robust dynamic range of the CSPG4 assay was also demonstrated in the high-count melanoma cases #30 and #37 where we detected cells with very low CSPG4 expression and showed by HMB-45 characterization and CNV profiling that they belonged to the cancer lineage. To extend the discrimination of the CMC population, we have included nuclear size, commonly used as part of the morphometric characterization of CTCs, as a crucial criterion for CMC identification. This parameter was used to detect and differentiate a class of very large non-melanoma cells with low CSPG4 signal from bona fide CMCs cells expressing similarly low CSPG4 levels. Further CNV analysis, confirmed the non-malignant origin of these very large nucleated cells with low CSPG4 signal (Supplementary Figure 2). They were subsequently identified by standard clinical pathology methods as enlarged hematopoietic cells, a conclusion also reached by the developers of the ISET (isolation by size of epithelial tumor cells) platform (19).
As recently reported, the HDSCA allows for the interrogation of single CTCs at the genomic level and has demonstrated the usefulness of CTCs to monitor therapeutic responses over time by tracking phenotypic and genomic alterations of tumor cells in response to therapy in prostate cancer (22). Although a substantial number of studies on the genomic characterization of CTCs for personalized treatment monitoring have been described in the literature, only few studies have addressed the genomic characterization of CMCs in melanoma patients. Moreover, given the encouraging results with targeted BRAF inhibitors, most of the efforts have been directed to study acquired resistance to these drugs by characterizing BRAF mutational status. The results provided by these studies showed a heterogeneous BRAF status between CMCs and matched tumor tissues as well as within the CMC population in individual patients, suggesting that the complex genomic diversity of melanoma is also illustrated in the CMC population. Here, we report limited heterogeneity of CMCs in terms of chromosomal CNVs when we performed hierarchical cluster analysis as previously reported by Ulmer et al. (17) and Klein et al. (43). However, we did not perform mutational analysis and it is possible that CMCs carry private mutations. One of the most important results associated with the addition of genomic profiling in the current study is the identification of novel altered chromosomal regions in CMCs in addition to markers of clinical significance known in melanoma. A complete deletion of CDKN2A together with the amplification of MDM2 in patient #37 suggest that the p53 pathway is inactivated (44) in this CMC population. Consistent with this, mutation analysis of cutaneous melanoma sequencing data showed that MDM2 amplification (4%) and CDKN2A deletion or mutation (42%) occur in around 55% of melanoma cases. Recent studies have supported the ability to restore the apoptotic function of p53 as a parallel therapeutic strategy alongside BRAFV600E inhibition in the treatment of melanoma (45,46). Moreover, PTEN deletion in all CMCs from patient #30 and BRAF amplification in the CMCs populating clone A in patient #37 have been described as two distinct mechanisms of drug resistance after BRAF inhibitor therapy (3,34) and could, in part, explain why those patients progressed. Importantly, we report 8 novel chromosomal amplifications in chr12, 17 and 19 including cancer genes such as AKT2, PIK3C2 and BRIP1 that could potentially be the target for future research (Supplementary Table S1).
The sensitivity of any methods for detecting cancer cells in a fluid biopsy ultimately depends on the concentration of cells in the circulation at the time of blood draw and the volume that can be measured. We note that our detection rate of observing at least one cell in 22/40 samples (55%) is greater than that reported by other cytomorphologic platforms. In terms of sensitivity, and based on the purity of the identified CMCs and that high content approach of the HDSCA can reliably exclude false positive cells, the detection of 1 CMC was sufficient to score a sample positive, yet was obtained using only a fraction of a single blood draw (0.2-2 ml) and could be extended to larger volumes. We believe that the CSPG4 antibody cocktail is a significant factor in the sensitivity of our assay compared to capture methods using a single antibody and could be a reason why other platforms have not achieved similar detection rates (23).
The HDSCA methodology we report here is rapid, quantitative, can simultaneously analyze multiple parameters such as expression of specific antigens and morphometric parameters, as well as enabling genomic analysis at the single cell level. The HDSCA results demonstrate that CMCs display a highly heterogeneous expression of CSPG4 and exhibit a wide range of cellular morphologies and sizes, but they have a relatively homogeneous nuclear size and are made up of genomically clonal populations with commonly known altered genes in melanoma. Our results support CMCs as a valuable sample with which to examine the genetic profile of the overall tumor burden and may therefore be useful for the development and monitoring of new molecular tailored therapeutic approaches.
Supplementary Material
Statement of Translational Relevance.
Recent progress in the genomic characterization of tumor tissues has allowed the development of molecular targeted therapies that have improved outcomes in metastatic melanoma patients. This molecular information obtained at the time of initial diagnosis, however, is not yet applicable to monitor treatment response or to determine tumor relapse as time and treatment progress, and as critical changes occur among tumor cells. In this regard, CMCs harbor valuable information about overall tumor burden and represent promising biomarkers for assessment of tumor progression, therapy response and drug resistance. Screening for targetable genomic alterations at the single cell level could help to identify subpopulations of patients who will benefit from molecularly targeted therapies and allow their monitoring in real time.
Acknowledgments
We wish to thank all the patients that participated in the study and the clinical research staff at Comprehensive Cancer Centers of Nevada, San Diego Pacific Oncology and Scripps Clinic. This is manuscript #26056 from The Scripps Research Institute. The content is solely the responsibility of the authors and does not necessarily represent the official views of the National Cancer Institute or the National Institutes of Health.
Financial Support: This work was supported by the Carol Vassiliadis Fellowship and by Award Number U54CA143906 from the National Cancer Institute. Soldano Ferrone was supported in part by PHS grants RO1CA138188, and P50CA121973 awarded by the National Cancer Institute. The content is solely the responsibility of the authors and does not necessarily represent the official views of the National Cancer Institute or the National Institutes of Health.
Abbreviations
- PBMCs
peripheral blood mononuclear cells
- CSPG4
chondroitin sulfate proteoglycan 4
- CTC
circulating tumor cell
- CMC
circulating melanoma cell
- NBD
normal blood donor
- RNS
relative nuclear size
- mAb
monoclonal antibody
- CNV
copy number variation
- MART-1
melanoma antigen recognized by T-cells 1
- HMB-45
human melanoma black 45
Footnotes
Conflicts of interest: The HDSCA technology described here has been licensed to Epic Sciences. ML, AK, KB, and PK have ownership in Epic Sciences.
References
- 1.Chapman PB, Hauschild A, Robert C, Haanen JB, Ascierto P, Larkin J, et al. Improved survival with vemurafenib in melanoma with BRAF V600E mutation. N Engl J Med. 2011;364:2507–16. doi: 10.1056/NEJMoa1103782. [DOI] [PMC free article] [PubMed] [Google Scholar]
- 2.Sosman JA, Kim KB, Schuchter L, Gonzalez R, Pavlick AC, Weber JS, et al. Survival in BRAF V600-mutant advanced melanoma treated with vemurafenib. N Engl J Med. 2012;366:707–14. doi: 10.1056/NEJMoa1112302. [DOI] [PMC free article] [PubMed] [Google Scholar]
- 3.Nazarian R, Shi H, Wang Q, Kong X, Koya RC, Lee H, et al. Melanomas acquire resistance to B-RAF(V600E) inhibition by RTK or N-RAS upregulation. Nature. 2010;468(7326):973–7. doi: 10.1038/nature09626. [DOI] [PMC free article] [PubMed] [Google Scholar]
- 4.Lito P, Rosen N, Solit DB. Tumor adaptation and resistance to RAF inhibitors. Nat Med. 19:1401–9. doi: 10.1038/nm.3392. [DOI] [PubMed] [Google Scholar]
- 5.Shi H, Hugo W, Kong X, Hong A, Koya RC, Moriceau G, et al. Acquired resistance and clonal evolution in melanoma during BRAF inhibitor therapy. Cancer Discov. 2014;4:80–93. doi: 10.1158/2159-8290.CD-13-0642. [DOI] [PMC free article] [PubMed] [Google Scholar]
- 6.Harbst K, Lauss M, Cirenajwis H, Winter C, Howlin J, Törngren T, et al. Molecular and genetic diversity in the metastatic process of melanoma. J Pathol. 2014;233:39–50. doi: 10.1002/path.4318. [DOI] [PMC free article] [PubMed] [Google Scholar]
- 7.Terheyden P, Houben R, Pajouh P, Thorns C, Zillikens D, Becker JC. Response to imatinib mesylate depends on the presence of the V559A-mutated KIT oncogene. J Invest Dermatol. 2009;130:314–6. doi: 10.1038/jid.2009.197. [DOI] [PubMed] [Google Scholar]
- 8.Takata M, Morita R, Takehara K. Clonal heterogeneity in sporadic melanomas as revealed by loss-of-heterozygosity analysis. Int J Cancer. 2000;85:492–7. [PubMed] [Google Scholar]
- 9.Anaka M, Hudson C, Lo PH, Do H, Caballero OL, Davis ID, et al. Intratumoral genetic heterogeneity in metastatic melanoma is accompanied by variation in malignant behaviors. BMC Med Genomics. 2013;6:40. doi: 10.1186/1755-8794-6-40. [DOI] [PMC free article] [PubMed] [Google Scholar]
- 10.Yachida S, Jones S, Bozic I, Antal T, Leary R, Fu B, et al. Distant metastasis occurs late during the genetic evolution of pancreatic cancer. Nature. 2010;467:1114–7. doi: 10.1038/nature09515. [DOI] [PMC free article] [PubMed] [Google Scholar]
- 11.Gerlinger M, Rowan AJ, Horswell S, Larkin J, Endesfelder D, Gronroos E, et al. Intratumor heterogeneity and branched evolution revealed by multiregion sequencing. N Engl J Med. 2012;366:883–92. doi: 10.1056/NEJMoa1113205. [DOI] [PMC free article] [PubMed] [Google Scholar]
- 12.Pantel K, Otte M. Occult micrometastasis: enrichment, identification and characterization of single disseminated tumour cells. Semin Cancer Biol. 2001;11:327–37. doi: 10.1006/scbi.2001.0388. [DOI] [PubMed] [Google Scholar]
- 13.Rao C, Bui T, Connelly M, Doyle G, Karydis I, Middleton MR, et al. Circulating melanoma cells and survival in metastatic melanoma. Int J Oncol. 2011;38:755–60. doi: 10.3892/ijo.2011.896. [DOI] [PubMed] [Google Scholar]
- 14.Khoja L, Lorigan P, Zhou C, Lancashire M, Booth J, Cummings J, et al. Biomarker utility of circulating tumor cells in metastatic cutaneous melanoma. J Invest Dermatol. 2013;133:1582–90. doi: 10.1038/jid.2012.468. [DOI] [PubMed] [Google Scholar]
- 15.Krivacic RT, Ladanyi A, Curry DN, Hsieh HB, Kuhn P, Bergsrud DE, et al. A rare-cell detector for cancer. Proc Natl Acad Sci U S A. 2004;101:10501–4. doi: 10.1073/pnas.0404036101. [DOI] [PMC free article] [PubMed] [Google Scholar]
- 16.Smith B, Selby P, Southgate J, Pittman K, Bradley C, Blair GE. Detection of melanoma cells in peripheral blood by means of reverse transcriptase and polymerase chain reaction. The Lancet. 1991;338:1227–9. doi: 10.1016/0140-6736(91)92100-g. [DOI] [PubMed] [Google Scholar]
- 17.Ulmer A, Schmidt-Kittler O, Fischer J, Ellwanger U, Rassner G, Riethmüller G, et al. Immunomagnetic enrichment, genomic characterization, and prognostic impact of circulating melanoma cells. Clin Cancer Res Off J Am Assoc Cancer Res. 2004;10:531–7. doi: 10.1158/1078-0432.ccr-0424-03. [DOI] [PubMed] [Google Scholar]
- 18.Liu Z, Fusi A, Klopocki E, Schmittel A, Tinhofer I, Nonnenmacher A, et al. Negative enrichment by immunomagnetic nanobeads for unbiased characterization of circulating tumor cells from peripheral blood of cancer patients. J Transl Med. 2011;9:70. doi: 10.1186/1479-5876-9-70. [DOI] [PMC free article] [PubMed] [Google Scholar]
- 19.De Giorgi V, Pinzani P, Salvianti F, Panelos J, Paglierani M, Janowska A, et al. Application of a filtration- and isolation-by-size technique for the detection of circulating tumor cells in cutaneous melanoma. J Invest Dermatol. 2010;130:2440–7. doi: 10.1038/jid.2010.141. [DOI] [PubMed] [Google Scholar]
- 20.Benez A, Schiebel U, Fierlbeck G. Morphologically intact melanoma cells may be detected in peripheral blood of melanoma patients. Recent Results Cancer Res Fortschritte Krebsforsch Prog Dans Rech Sur Cancer. 2001;158:113–7. doi: 10.1007/978-3-642-59537-0_11. [DOI] [PubMed] [Google Scholar]
- 21.Cristofanilli M, Budd GT, Ellis MJ, Stopeck A, Matera J, Miller MC, et al. Circulating tumor cells, disease progression, and survival in metastatic breast cancer. N Engl J Med. 2004;351:781–91. doi: 10.1056/NEJMoa040766. [DOI] [PubMed] [Google Scholar]
- 22.Dago AE, Stepansky A, Carlsson A, Luttgen MS, Kendall J, Baslan T, et al. Rapid phenotypic and genomic change in response to therapeutic pressure in prostate cancer inferred by high content analysis of single circulating tumor cells. PLoS ONE. 2014 doi: 10.1371/journal.pone.0101777. in press. [DOI] [PMC free article] [PubMed] [Google Scholar]
- 23.Campoli MR, Chang CC, Kageshita T, Wang X, McCarthy JB, Ferrone S. Human high molecular weight-melanoma-associated antigen (HMW-MAA): a melanoma cell surface chondroitin sulfate proteoglycan (MSCP) with biological and clinical significance. Crit Rev Immunol. 2004;24:267–96. doi: 10.1615/critrevimmunol.v24.i4.40. [DOI] [PubMed] [Google Scholar]
- 24.Goto Y, Ferrone S, Arigami T, Kitago M, Tanemura A, Sunami E, et al. Human high molecular weight-melanoma-associated antigen: utility for detection of metastatic melanoma in sentinel lymph nodes. Clin Cancer Res Off J Am Assoc Cancer Res. 2008;14:3401–7. doi: 10.1158/1078-0432.CCR-07-1842. [DOI] [PMC free article] [PubMed] [Google Scholar]
- 25.Kitago M, Koyanagi K, Nakamura T, Goto Y, Faries M, O'Day SJ, et al. mRNA expression and BRAF mutation in circulating melanoma cells isolated from peripheral blood with high molecular weight melanoma-associated antigen-specific monoclonal antibody beads. Clin Chem. 2009;55:757–64. doi: 10.1373/clinchem.2008.116467. [DOI] [PMC free article] [PubMed] [Google Scholar]
- 26.Sakaizawa K, Goto Y, Kiniwa Y, Uchiyama A, Harada K, Shimada S, et al. Mutation analysis of BRAF and KIT in circulating melanoma cells at the single cell level. Br J Cancer. 2012;106:939–46. doi: 10.1038/bjc.2012.12. [DOI] [PMC free article] [PubMed] [Google Scholar]
- 27.Giacomini P, Natali P, Ferrone S. Analysis of the interaction between a human high molecular weight melanoma-associated antigen and the monoclonal antibodies to three distinct antigenic determinants. J Immunol Baltim Md. 1985;135:696–702. 1950. [PubMed] [Google Scholar]
- 28.Marrinucci D, Bethel K, Kolatkar A, Luttgen MS, Malchiodi M, Baehring F, et al. Fluid biopsy in patients with metastatic prostate, pancreatic and breast cancers. Phys Biol. 2012;9:016003. doi: 10.1088/1478-3975/9/1/016003. [DOI] [PMC free article] [PubMed] [Google Scholar]
- 29.Balch CM, Soong SJ, Gershenwald JE, Thompson JF, Reintgen DS, Cascinelli N, et al. Prognostic factors analysis of 17,600 melanoma patients: validation of the american joint committee on cancer melanoma staging system. J Clin Oncol. 2001;19:3622–34. doi: 10.1200/JCO.2001.19.16.3622. [DOI] [PubMed] [Google Scholar]
- 30.Flores JF, Walker GJ, Glendening JM, Haluska FG, Castresana JS, Rubio MP, et al. Loss of the p16INK4a and p15INK4b genes, as well as neighboring 9p21 markers, in sporadic melanoma. Cancer Res. 1996;56:5023–32. [PubMed] [Google Scholar]
- 31.Hodis E, Watson IR, Kryukov GV, Arold ST, Imielinski M, Theurillat JP, et al. A landscape of driver mutations in melanoma. Cell. 2012;150:251–63. doi: 10.1016/j.cell.2012.06.024. [DOI] [PMC free article] [PubMed] [Google Scholar]
- 32.Paraiso KHT, Xiang Y, Rebecca VW, Abel EV, Chen YA, Munko AC, et al. PTEN loss confers BRAF inhibitor resistance to melanoma cells through the suppression of BIM expression. Cancer Res. 2011;71:2750–60. doi: 10.1158/0008-5472.CAN-10-2954. [DOI] [PMC free article] [PubMed] [Google Scholar]
- 33.Muthusamy V, Hobbs C, Nogueira C, Cordon-Cardo C, McKee PH, Chin L, et al. Amplification of CDK4 and MDM2 in malignant melanoma. Genes Chromosomes Cancer. 2006;45:447–54. doi: 10.1002/gcc.20310. [DOI] [PubMed] [Google Scholar]
- 34.Shi H, Moriceau G, Kong X, Lee MK, Lee H, Koya RC, et al. Melanoma whole-exome sequencing identifies (V600E)B-RAF amplification-mediated acquired B-RAF inhibitor resistance. Nat Commun. 2012;3:724. doi: 10.1038/ncomms1727. [DOI] [PMC free article] [PubMed] [Google Scholar]
- 35.Joshi P, Zborowski M, Triozzi PL. Circulating melanoma cells: scoping the target. Front Oncol. 2013;3:189. doi: 10.3389/fonc.2013.00189. [DOI] [PMC free article] [PubMed] [Google Scholar]
- 36.Fusi A, Collette S, Busse A, Suciu S, Rietz A, Santinami M, et al. Circulating melanoma cells and distant metastasis-free survival in stage III melanoma patients with or without adjuvant interferon treatment (EORTC 18991 side study) Eur J Cancer Oxf Engl. 2009;45:3189–97. doi: 10.1016/j.ejca.2009.09.004. 1990. [DOI] [PubMed] [Google Scholar]
- 37.Klinac D, Gray ES, Millward M, Ziman M. Advances in personalized targeted treatment of metastatic melanoma and non-invasive tumor monitoring. Front Oncol. 2013;3:54. doi: 10.3389/fonc.2013.00054. [DOI] [PMC free article] [PubMed] [Google Scholar]
- 38.Carlsson A, Nair VS, Luttgen MS, Visith K, Horng G, Vasanawala M, et al. Circulating tumor microemboli diagnostics for patients with non-small cell lung cancer. J Thorac Oncol. 2014;9:1111–9. doi: 10.1097/JTO.0000000000000235. [DOI] [PMC free article] [PubMed] [Google Scholar]
- 39.Balch CM, Gershenwald JE, Soong S, Thompson JF, Atkins MB, Byrd DR, et al. 2009 AJCC melanoma staging and classification. J Clin Oncol. 2009;27:6199–206. doi: 10.1200/JCO.2009.23.4799. [DOI] [PMC free article] [PubMed] [Google Scholar]
- 40.Hoon DS, Bostick P, Kuo C, Okamoto T, Wang HJ, Elashoff R, et al. Molecular markers in blood as surrogate prognostic indicators of melanoma recurrence. Cancer Res. 2000;60(8):2253–7. [PubMed] [Google Scholar]
- 41.Reynolds SR, Albrecht J, Shapiro RL, Roses DF, Harris MN, Conrad A, et al. Changes in the presence of multiple markers of circulating melanoma cells correlate with clinical outcome in patients with melanoma. Clin Cancer Res Off J Am Assoc Cancer Res. 2003;9:1497–502. [PubMed] [Google Scholar]
- 42.Reid AL, Millward M, Pearce R, Lee M, Frank MH, Ireland A, et al. Markers of circulating tumour cells in the peripheral blood of patients with melanoma correlate with disease recurrence and progression. Br J Dermatol. 2013;168:85–92. doi: 10.1111/bjd.12057. [DOI] [PMC free article] [PubMed] [Google Scholar]
- 43.Klein CA, Blankenstein TJF, Schmidt-Kittler O, Petronio M, Polzer B, Stoecklein NH, et al. Genetic heterogeneity of single disseminated tumour cells in minimal residual cancer. Lancet. 2002;360:683–9. doi: 10.1016/S0140-6736(02)09838-0. [DOI] [PubMed] [Google Scholar]
- 44.Zhang Y, Xiong Y, Yarbrough WG. ARF promotes MDM2 degradation and stabilizes p53: ARF-INK4a locus deletion impairs both the Rb and p53 tumor suppression pathways. Cell. 1998;92:725–34. doi: 10.1016/s0092-8674(00)81401-4. [DOI] [PubMed] [Google Scholar]
- 45.Lu M, Breyssens H, Salter V, Zhong S, Hu Y, Baer C, et al. Restoring p53 function in human melanoma cells by inhibiting MDM2 and cyclin B1/CDK1-phosphorylated nuclear iASPP. Cancer Cell. 2013;23:618–33. doi: 10.1016/j.ccr.2013.03.013. [DOI] [PubMed] [Google Scholar]
- 46.Lu M, Miller P, Lu X. Restoring the tumour suppressive function of p53 as a parallel strategy in melanoma therapy. FEBS Lett. 2014;558:2616–21. doi: 10.1016/j.febslet.2014.05.008. [DOI] [PubMed] [Google Scholar]
Associated Data
This section collects any data citations, data availability statements, or supplementary materials included in this article.