

Abstract
The release of neuronal messengers outside synapses has broad biological implications, particularly with regard to communication between axons and glia. We identify a mechanism for nonsynaptic, nonvesicular release of adenosine triphosphate (ATP) from axons through volume-activated anion channels (VAACs) activated by microscopic axon swelling during action potential firing. We used a combination of single-photon imaging of ATP release, together with imaging for intrinsic optical signals, intracellular calcium ions (Ca2+), time-lapse video, and confocal microscopy, to investigate action potential–induced nonsynaptic release of this neurotransmitter. ATP release from cultured embryonic dorsal root ganglion axons persisted when bafilomycin or botulinum toxin was used to block vesicular release, whereas pharmacological inhibition of VAACs or prevention of action potential–induced axon swelling inhibited ATP release and disrupted activity-dependent signaling between axons and astrocytes. This nonvesicular, nonsynaptic communication could mediate various activity-dependent interactions between axons and nervous system cells in normal conditions, development, and disease.
INTRODUCTION
Although the fundamental mechanism of neuronal communication is through vesicular release of neurotransmitter at synapses, most cells in the brain are not synaptically coupled to neurons, yet they can respond to impulse activity in neural circuits. For example, nonneuronal cells, including myelinating (1–3) and nonmyelinating glia (3, 4), vascular cells (4, 5), and immune cells involved in chronic pain (6, 7), respond to impulse activity in axons, but neurons do not form synapses on astrocytes, oligodendrocytes, Schwann cells, endothelial cells, or immune cells.
Adenosine triphosphate (ATP) is a major cell-cell signaling molecule in activity-dependent interactions between neurons and between neurons and nonneuronal cells (4). Several studies have shown that ATP is released from neurons firing action potentials not only at synapses but also along axons in the central and peripheral nervous systems (CNS and PNS, respectively) (1, 2, 8–10). The mechanism for nonsynaptic ATP release from axons is unknown. Calcium imaging analyses of isolated nerve segments have revealed that removal of extracellular calcium can inhibit activity-dependent axon-glia communication (11), suggesting release of ATP by synaptic vesicles, but synapses are rare or absent in isolated nerve segments.
ATP can be released from various nonexcitable cells through nonvesicular mechanisms; these include release through gap junction hemichannels and ion channels with sufficiently large-diameter pores (12), such as those associated with the purinergic P2X7 receptor (13), and through the cystic fibrosis transmembrane conductance regulator (CFTR) (14). There is no evidence, however, that these ATP release pathways are activated in axons by action potential firing.
Fluid shear force or minute displacement of the cell membrane by mechanical stimulation can trigger ATP release from electrically inexcitable cells, including vascular cells, pulmonary cells, urinary bladder cells (15), and astrocytes (16, 17), in part through chloride channels in the cell membrane that are activated by membrane stretch [volume-activated anion channels (VAACs)]. Some of these channels are permeable to ATP4− and MgATP2−, which can be released together with water to restore normal cell volume after cell swelling under hypo-osmotic conditions (16). There is no official recommendation regarding classification of chloride channels (18). VAACs include the maxi-anion channel and volume-regulated ion channel (VRAC) [also known as volume-sensitive organic osmolyte-anion channel (VSOAC), volume-regulated channel (VRC), and volume expansion– sensing channel (VSOR)]. The molecular identity of VAACs has not yet been determined, and they may represent various different chloride channels that are activated by cell swelling and expressed to a variable extent in different cells (18). Some proteins encoded by the nine-member ClC gene family of voltage-gated Cl− channels and Cl−-H+ exchangers and VDACs (voltage-dependent anion channels) have been functionally linked to VRAC, but other proteins, including bestrophins and anoctamins, also may be involved (19).
Some VAACs can be identified by pharmacological inhibitors. The maxi-anion channel, which can be identified by sensitivity to gadolinium (Gd3+), 4,4′-diisothiocyanostilbene-2,2′-disulfonic acid (DIDS), and 5-nitro-2-(3-phenylpropylamino)-benzoate (NPPB), and insensitivity to phloretin (16), has a large single-channel conductance of 300 to 400 pS and a 1.3-nm-radius pore that allows efflux of small intercellular organic anions, including glutamate (0.35-nm radius) and ATP (0.6-nm radius) (20). Maxi-anion channels are a prominent pathway for ATP release from astrocytes (21) and other cells (16) in response to swelling under hypotonic conditions or ischemia. The VDAC1 gene has been proposed to be the maxi-anion channel (22), but this has been disputed (22, 23).
Mechanical stimulation of neurons (24) has been used experimentally to elicit ATP release, supporting the hypothesis that stretch-regulated channels might provide a pathway for nonvesicular release of ATP from axons. However, whether VRCs are present in axons and can become activated in response to electrical impulses is unknown.
Identification of the molecular mechanism mediating ATP release from nerve is complicated by the many kinds of cells in nerve tissue, including fibroblasts, endothelial cells, and glia, which could contribute to ATP release. To circumvent this problem, we used a specialized cell culture system of mouse dorsal root ganglion (DRG) neurons to investigate ATP release from axons (Fig. 1A). These multicompartment cell culture chambers isolate neuronal cell bodies and axons into separate fluid-tight compartments, and they provide the means to excite action potentials in axons through platinum electrodes in the culture dish (25). We chose DRG neurons for this analysis because they have no dendrites and do not form synapses (autapses) with other DRG neurons in vivo or in monoculture (26). When DRG neurons are cocultured in such chambers with Schwann cells (1), astrocytes (4), or oligodendrocytes (2, 3), axonal action potentials stimulate calcium responses in these glial cells, in part through the activity-dependent release of ATP from axons, which activates purinergic receptors on glial cells. This activity-dependent axon-glia signaling elicits changes in glial gene expression, allowing impulse activity to regulate such functions as cell proliferation, differentiation, and myelination. Such use-dependent signals are believed to be important in regulating neuronal and glial development (27), but the mechanism of ATP release is unknown.
Fig. 1.
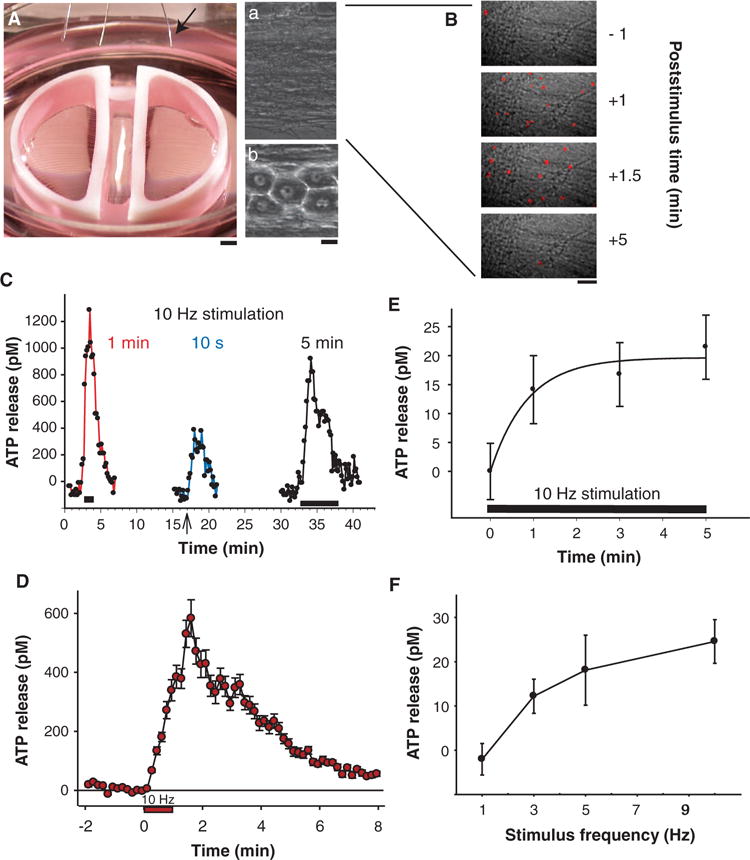
Release of ATP from axons firing action potentials. (A) Mouse DRG neuron cell bodies (b) and axons (a) were separated in multicompartment cell cultures allowing electrical stimulation of axons, growing under a high-resistance partition between compartments, through platinum electrodes in the lid of the culture dish (arrow). (B) Release of ATP from neurons was detected by single-photon imaging after addition of luciferin and luciferase to the medium and by analysis of ATP concentration in samples of culture medium assayed by luminometry. Release of ATP was detected as single photons (red spots) generated by the ATP-dependent chemiluminescence reaction. Each image in the time series displays the number of photons accumulated during 1 s, superimposed on a bright-field image of the axons. After calibration against standard solutions, photon counts provide a quantitative measure of ATP concentration. (C) ATP release could be induced repeatedly from the same axons. Onset and duration of the 10-Hz stimulus is shown by black bars (1 and 5 min) and arrow (10 s). (D) ATP concentration recovered to values that were not significantly different from prestimulus levels 7 min after termination of the 60-s, 10-Hz stimulus (red circles) (P > 0.05, n = 11). (E) Prolonged stimulation was not required for ATP release; near-maximal concentrations were reached within 1 min of 10-Hz stimulation (n = 48, measured by luminometry). (F) Low-frequency stimulation was effective in releasing ATP, and the release was proportional to stimulus frequency between 1 and 10 Hz (n = 61). [ATP concentration in bulk medium measured by luminometry [(E) and (F)] was ~40 times lower than that in close proximity to the cell measured by single-photon imaging microscopy [(B) to (D)].] Scale bars, 1 mm (A), 10 μm [(A, b) and (B)].
In early studies of electrical excitation in nerve fibers, several changes in physical properties of axons were observed that closely track the voltage fluctuation during action potential firing. This includes rapid heating and cooling of the axon (28, 29), small mechanical displacement of the axon membrane (30–34), and changes in light transmission through axons (35–37). The rapid changes in light transmission and membrane displacement are apparently caused by transmembrane flux of ions (notably Ca2+) and water accompanying the action potential, which has been proposed to cause small volume changes (38). In response to trains of action potentials, axons can swell from the accumulating transmembrane flux of ions and redistribution of water molecules across the cell membrane (34, 37–39). If action potential firing elicits cell volume changes in axons sufficient to activate VAACs, this could provide a mechanism for activity-dependent release of ATP from neurons that is nonsynaptic and nonvesicular. Indeed, nonvesicular activity-dependent release of ATP could have broader functions in cell-cell signaling in the nervous system than synaptic communication, which is a unique specialization for rapid (millisecond) serial communication in neural circuits. Here, our objectives were to determine whether impulse activity in axons is associated with axon swelling and displacement and, if so, whether this is sufficient to activate VAACs to release ATP and thereby mediate activity-dependent communication between axons and glia.
RESULTS
Electrically induced release of ATP from intact nerves has been demonstrated in several studies (8–10). We confirmed this release and determined that 1 to 5 min of stimulation at 10 Hz caused an increase of 9.3 ± 0.42 pM in ATP concentration in saline solution bathing rat optic nerves (n = 2), an 86 pM increase after stimulation of dorsal spinal roots (n = 1), and a 53.7 ± 16.4 pM increase after stimulating sciatic nerves (n = 4).
Kinetics and stimulus frequency response for action potential–induced ATP release
For insight into the ATP release mechanism, we investigated the kinetics and stimulus frequency response of electrically induced ATP release from DRG neurons in the multicompartment cell culture chambers (Fig. 1A). We used two complementary methods to measure the extracellular ATP concentration: luminometry and single-photon imaging microscopy (40). Luminometry is rapid and relatively inexpensive, thus permitting greater numbers of experimental replicates, but measured concentrations are lower because the released ATP is diluted into the bulk volume of the medium (~0.25 ml), whereas single-photon imaging microscopy analyzes the ATP concentration within the narrow focal plane adjacent to the axons. Single-photon imaging allows much greater sampling rates (10-s intervals), whereas only a limited number of samples can be withdrawn from the culture at much slower intervals for ATP analysis by luminometry. Electrical stimulation of axons at 10 Hz caused an ~500 to 1000 pM increase in ATP concentration in the surrounding saline as measured by single-photon imaging microscopy (Fig. 1, B to D). ATP concentration recovered to resting values within 5 to 7 min, depending on the duration of stimulation (Fig. 1, C and D). ATP release could be elicited repeatedly from the same axons by trains of action potentials separated by 15-min recovery intervals (Fig. 1C).
ATP release from DRG neurons did not require prolonged stimulation. Ten seconds of stimulation at 10 Hz was sufficient to induce a substantial increase in extracellular ATP (Fig. 1C). When ATP was measured by luminometry from samples of culture medium, near-maximal concentrations were reached after 1 min (Fig. 1E).
ATP release increased in proportion to stimulus frequencies between 1 and 10 Hz (Fig. 1F). In vivo, DRG neurons can fire tonically at 10 Hz for at least 1 hour, and in short bursts at frequencies of 30 Hz or more (41). Thus, the 3- to 10-Hz frequencies at which we were able to measure ATP release were well within the normal physiological range of firing for DRG neurons.
The latency of the response to stimulation could be measured by single-photon imaging microscopy, which showed that the increase in ATP concentration was delayed by tens of seconds from stimulus onset. When short trains of 10-Hz stimulation were applied (10 s), ATP release was often delayed until tens of seconds after the stimulus was stopped (Fig. 1C, blue trace). The latency to the first significant increase in ATP concentration in the saline in response to trains of action potentials at 10 Hz occurred after 30 ± 10 s of stimulation (Fig. 1D) (n = 11). The peak response occurred 49 ± 57 s after termination of the 60-s stimulus (Fig. 1D) (P < 0.001 versus prestimulation, n = 11). This delay in response is similar to that found for calcium responses in astrocytes (4), Schwann cells (1), and oligodendrocytes (2), to 10 Hz electrical stimulation of DRG axons in coculture, and to calcium responses of glia to optic nerve stimulation (42, 43).
The concentration of ATP recovered from its peak to values that were not significantly different from those measured before stimulation 7 min after terminating a 60-s, 10-Hz stimulus (Fig. 1D). The decrease in ATP concentration after terminating the stimulus likely represents multiple processes, including hydrolysis of extracellular ATP by ectoenzymes, reuptake, dilution of ATP into the bulk medium after release, and inactivation of the ATP release mechanism. Here, we investigated the rising phase of the ATP response to determine the mechanisms of electrically induced ATP release from DRG axons.
Nonvesicular release of ATP from axons firing action potentials
The release of ATP in response to electrical stimulation required sodium-dependent action potentials. No significant change in ATP concentration was apparent within 5 min of 10-Hz stimulation for 60 s in the presence of the sodium channel blocker tetrodotoxin (TTX) (1 μM) (P = 0.47, paired t test; n = 22). In a separate multiple-comparisons test of ATP concentration after stimulation under different experimental conditions, ATP concentration after stimulation in TTX (100 nM) was significantly lower than that after stimulation in the absence of TTX (Fig. 2A).
Fig. 2.
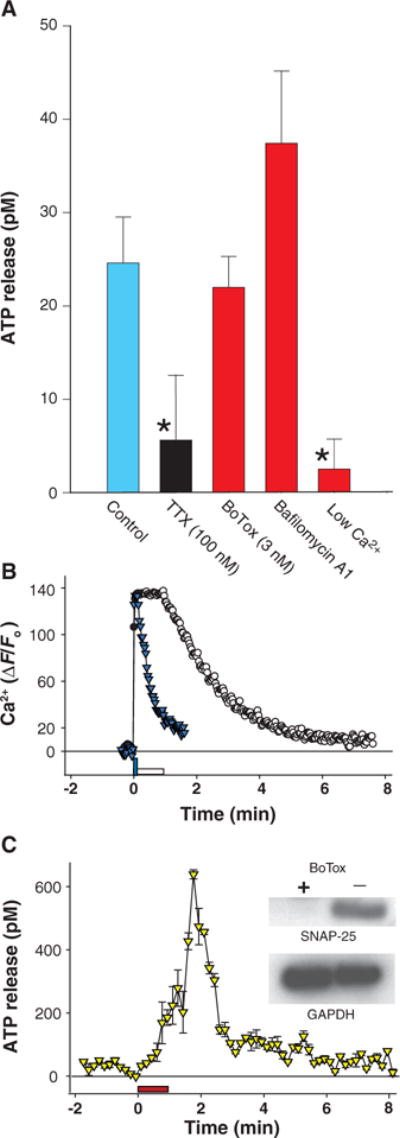
Nonvesicular release of ATP from axons firing action potentials. (A) The increase in ATP concentration in medium was measured by luminometry after 5-min stimulation at 10 Hz in the presence of pharmacological inhibitors (P < 0.001, ANOVA). ATP release after stimulation (blue bar) (n = 16) was inhibited by electrical stimulation in the presence of the sodium channel blocker TTX (black bar) (n = 11) or by lowering extracellular calcium concentration to 0.5 mM (n = 10), but ATP release was not inhibited by 3 nM botulinum toxin (BoTox) (n = 10) or by 2 μM bafilomycin A1 [a specific inhibitor of the vacuolar-type H+- dependent adenosine triphosphatase (H+- ATPase)required for synaptic vesicle function] (n = 10). This suggests a calcium-dependent mechanism of ATP release requiring activation of sodium-dependent action potentials, but not release of synaptic vesicles. *P < 0.05. (B) Changes in intracellular Ca2+concentration were rapid relative to the delayed rise in ATP concentration after 10-Hz stimulation for 10 s (blue triangles) or 60 s (open circles). (C) Single-photon imaging shows that ATP release was not blocked by botulinum toxin (3 nM), which prevents synaptic vesicle fusion (yellow triangles) (n = 3, single-photon imaging). Immunoblot (inset) confirmed enzymatic degradation of SNAP-25 after incubation in 3 nM botulinum toxin. Glyceraldehyde-3-phosphate dehydrogenase (GAPDH) is a loading control.
The delay in ATP release from stimulus onset was not caused by a slow calcium response in axons; calcium imaging showed a near-instantaneous increase in intracellular calcium concentration in axons in response to electrical stimulation (Fig. 2B). Lowering the concentration of extracellular calcium from 2 to 0.5 mM inhibited electrically induced ATP release (Fig. 2A). Although calcium dependency of neurotransmitter release is often taken as evidence for vesicular release, removal of extracellular calcium could have numerous effects beyond inhibiting synaptic vesicle fusion. We therefore undertook more specific tests of vesicular release. ATP can be released together with neurotransmitter from synaptic vesicles; however, ATP release was not blocked by bafilomycin A1, which disrupts the filling of synaptic vesicles with neurotransmitter (44) (Fig. 2A). Botulinum toxin, which prevents the fusion of synaptic vesicles with the presynaptic membrane (45), failed to inhibit the electrically induced ATP release from axons measured by luminometry (Fig. 2A) or single-photon imaging (Fig. 2C). Botulinum toxin A was added 24 hours before experiments, and immunoblot confirmed enzymatic degradation of the vesicular release protein SNAP-25 (25-kD synaptosome-associated protein) (Fig. 2C, inset). Four hours of botulinum treatment is sufficient to block neurosecretion from DRG neurons in culture for 15 days (45). Therefore, ATP release in response to electrical stimulation of DRG axons can proceed by a pathway independent of SNARE-dependent vesicular release.
Volume-regulated anion channels in nonsynaptic ATP release
Reverse transcription polymerase chain reaction (RT-PCR) analysis revealed messenger RNA (mRNA) encoding five components of the VAAC family members in DRG neurons: ClC3, ClC4, ClC5, ClC7, and VDAC (Fig. 3A). mRNA encoding all of these channels, except ClC7, was also detected by RT-PCR of DRG neurons plucked individually from cultures to exclude the possibility that mRNA might derive from cells contaminating the neuronal cultures (Fig. 3B). Positive immunocytochemical staining for ClC3, ClC4, ClC5, and VDAC was seen in DRG axons and soma (Fig. 3C).
Fig. 3.
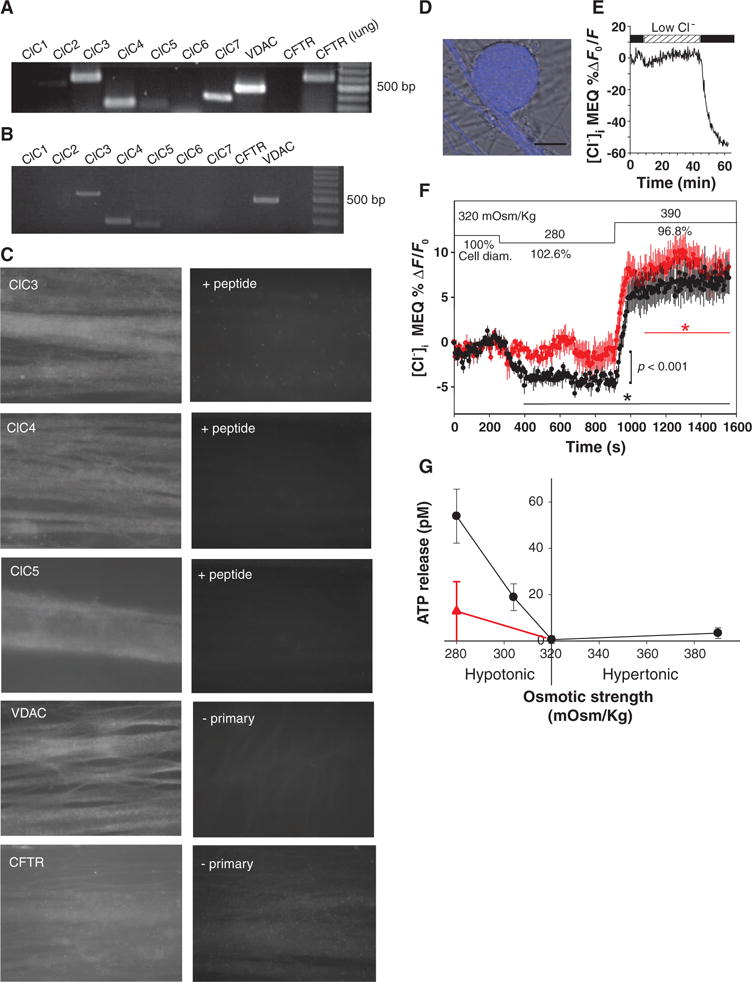
VAACs in DRG neurons. (A) RT-PCR analysis detected mRNA for several chloride channels but not CFTR. mRNA from lung is a positive control. (B) RT-PCR from neurons collected individually from cell cultures detected only ClC3, ClC4, ClC5, and VDAC. (C) Positive immunocytochemical staining with antibodies against ClC3, ClC4, ClC5, and VDAC was found in DRG axons; CFTR immunostaining was negative. No staining was seen when antibody was preabsorbed with peptide (+ peptide) or in the absence of primary antibody (− primary). (D) Functional VAACs in DRG neurons are shown by monitoring changes in cytoplasmic Cl− by two-photon microscopy with the fluorescence indicator MEQ (blue fluorescence superimposed on DIC image of DRG cell body). (E) Influx of Cl− quenches MEQ fluorescence as shown by perfusing cells in normal saline after incubation in low Cl− saline, in which 145 mM sodium gluconate was substituted for NaCl. (F) VAAC function is shown by the influx of Cl− during cell swelling (decreased MEQ fluorescence, black trace) produced by switching from isotonic (320 mOsm/kg) to hypotonic conditions (280 mOsm/kg), and efflux of Cl− is seen during cell volume reduction in 390 mOsm/kg solution. Cl− influx during cell swelling was significantly inhibited by 100 μM NPPB (red) (−3.56 ± 0.12 versus −1.09 ± 0.074; P < 0.001). Asterisks indicate when responses are significantly different from baseline in the presence (red) or absence (black) of NPPB. ANOVA and Dunnett’s post hoc analysis of responses compared at sequential intervals of 200 s, relative to isotonic solution (320 mOsm/kg). Mean and SEM of responses in 11 neurons are plotted. Changes in cell diameter are plotted as percentage relative to starting conditions in isotonic saline (defined as 100%). (G) Hypotonic saline below the normal osmotic strength of 320 mOsm/kg caused release of ATP from DRG neurons in the absence of electrical stimulation. ATP release was significantly inhibited by the chloride channel blocker, 100 μM NPPB (red triangle) (n = 12), indicating release through VAACs (P < 0.001, ANOVA, n = 56). Scale bar, 20 μm; 100-bp cDNA ladder in (A) and (B).
To test for functional VAACs in DRG neurons, we monitored transmembrane Cl− flux by two-photon live-cell microscopy using the cell-permeable Cl− indicator 6-methoxy-N-ethyl-1,2-dihydroquinoline (DiH-MEQ) (46) (Fig. 3, D and E). We observed Cl− influx during cell swelling produced by switching from isotonic conditions (320 mOsm/kg) to hypotonic conditions (280 mOsm/kg), and Cl− efflux during cell volume reduction in 390 mOsm/kg (Fig. 3F, black trace). Influx of Cl− during cell swelling was significantly inhibited by the VAAC channel inhibitor NPPB (100 μM) (Fig. 3F, red trace).
Our mRNA and immunocytochemical analyses showing that members of the VAAC family were present in DRG neurons and our observation of transmembrane Cl− flux accompanying osmotically induced changes in cell volume are consistent with the hypothesis that these channels might release ATP in response to axon swelling. We tested this hypothesis by systematically varying medium osmotic strength and measuring the concentration of ATP in the extracellular medium (Fig. 3G). Decreasing osmotic strength from the normal 320 mOsm/kg to 305 mOsm/kg or lower caused a significant release of ATP from DRG neurons (Fig. 3G). The release of ATP in hypotonic solution (280 mOsm/kg) was significantly inhibited by NPPB (100 μM), which blocks VAACs, consistent with release of ATP through these channels (Fig. 3G, red trace).
Intrinsic optical signals, axon displacement, and ATP release
If the minute axon swelling that accompanies electrical excitation of axons (38) leads to the subsequent activation of stretch-activated chloride channels permeable to ATP, this could provide a nonsynaptic and nonvesicular mechanism for activity-dependent ATP release. We analyzed intrinsic optical signaling (IOS) in the multicompartment cultures as a sensitive method of detecting cell swelling to determine whether swelling of premyelinated axons accompanies action potential firing in mouse DRG neurons. We observed an increase in light transmission through DRG axons when trains of action potentials were fired (Fig. 4, A and B), consistent with axon swelling during trains of action potentials.
Fig. 4.
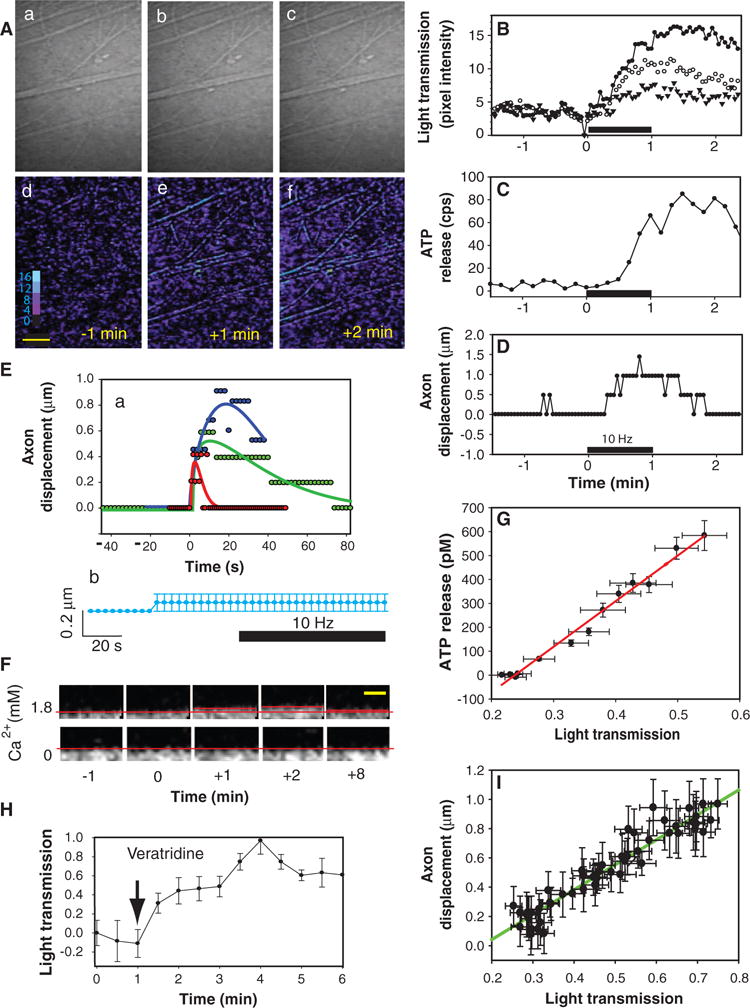
Neural impulses cause microscopic swelling and displacement of axons correlated with ATP release. (A) IOSs, representing changes in light transmission through axons, were measured with time-lapse transmitted light microscopy (a to c). [Warmer colors indicate greater light transmission (d to f).] The increase in IOS 1 and 2 min after 60-s stimulation at 10 Hz is shown in (Ae) and (Af). (B) Raw IOS data from three axons or fascicles shown in (A) are plotted. (C) ATP release, measured in the same axons by single-photon imaging microscopy, closely tracked the electrically induced changes in IOS. cps, counts per second. (D) Minute displacement of the axons was measured in the same axons after digital magnification of the transmitted light image and tracking movement of the edge of the axon membrane over time. The plotted data appear pixilated because the small axon displacements are near the 0.5-μm resolution of the microscope. (E) Axon displacement could be detected after as few as 10 action potentials at 10 Hz (red). Stimulating the same axons for 5 s (green) and 10 s (blue) produced proportionately larger and longer-lasting displacements (curve fitting by regression to a five-parameter Weibull function). No axon displacement was seen during electrical stimulation in the presence of 1 μM TTX to block sodium-dependent action potentials (b) (n = 7, mean and SEM are plotted in light blue). (F) Axon displacement in response to 10-Hz stimulation (60 s) was also measured by confocal microscopy. Note the 1.5-μm displacement of axon 2 min after 10-Hz stimulation for 60 s. Stimulation in the absence of extracellular calcium inhibited axon displacement. (G) Linear regression of data from multiple experiments showed that ATP release (rise to peak) was highly correlated with the increase in light transmission through axons (P < 0.0001; r2 = 0.983; n = 12). (H) The increase in light transmission, indicative of axon swelling, could be induced by the sodium channel agonist veratridine (2 μM) (n = 8) in the absence of electrical stimulation. One minute after veratridine application, ATP concentration increased by 156.7 ± 35.7 pM (P < 0.007, paired t test; n = 6). (I) Axon displacement also was directly related to the increase in light transmission (P < 0.0001; r2 = 0.9078; n = 48). Scale bars, 17 μm (A), 5 μm (F). Transmitted light intensity is shown on an eight-bit pseudo color scale (Ad).
We also observed minute (1.5 μm) displacement of axons firing action potentials directly, using simultaneous time-lapse transmission light microscopy at maximum magnification (Fig. 4, D and E), and this displacement was confirmed by time-lapse confocal microscopy (Fig. 4F). Although axonal displacement was near the 0.5-μm resolution limit of the microscope and pixel density in the charge-coupled device (CCD) camera, it could be detected after stimulation with as few as 10 action potentials at 10 Hz (Fig. 4E, a, red trace). Indeed, mechanical and optical responses in axons to single action potentials have been observed (34, 37, 38). Axon displacement in response to stimulation in the present experiments was observed on glass- or plastic-bottomed culture dishes coated with various substrates, including collagen, polylysine, or laminin. No axon displacement was seen during electrical stimulation in the presence of 1 μM TTX to block sodium-dependent action potentials (n = 7; Fig. 4E, b).
Excitation-induced displacement of axons and neurons is not limited to cell culture; it has been described in several types of excised nervous system tissue. Shortening of squid axons secondary to an increase in fiber volume was reported by Hill in 1950 using specialized microscopy (31) and in the crayfish giant axon with laser interferometry (33). Using piezoelectric transducers and fiber-optic displacement sensors, Tasaki and colleagues have investigated the physical contraction of the frog spinal cord secondary to axon swelling (47), swelling and displacement of dorsal root ganglia (48), olfactory bulbs (49), and squid giant axon (30) after stimulation similar to that used in the present experiments, and in the retina in response to light (50). Rapid, transient volume changes accompanying sodium-dependent action potentials have been measured by atomic force microscopy in nerve terminals of the mammalian neurohypophysis followed by a slower reduction in terminal volume associated with secretion of dense-core granules (34). As with the small changes in temperature that accompany action potential firing (28, 29), which are a necessary consequence of the work expended in the transmembrane flux of ions across the axon membrane during depolarization and repolarization, the biological significance of the minute mechanical responses in axons accompanying action potential firing has been unclear.
To determine whether these physical phenomena in axons accompanying neural excitation correlate with ATP release, we combined IOS, time-lapse transmission light microscopy, and single-photon imaging for ATP release in the same microscope imaging system. Increased light transmission through axons (Fig. 4B) closely paralleled the axon displacement (Fig. 4D) and release kinetics of ATP measured in the same axon (Fig. 4C). Pooling data from replicate experiments showed that the rise to peak concentration of ATP was a linear function of the increase in IOS in neurons stimulated at 10 Hz for 60 s (Fig. 4G). These responses could be induced without electrical stimulation by the sodium channel activator veratridine (100 μM), which caused an increase in light transmission through axons indicative of axon swelling (Fig. 4H) (n = 8) and an increase in extracellular ATP concentration of 156.7 ± 35.7 pM above prestimulus values (n = 6, P < 0.007). This indicates that, as with ATP release (Fig. 2A), axon swelling induced by electrical stimulation requires activation of voltage-dependent sodium channels and can be produced in the absence of electrical stimulation by activating sodium channels pharmacologically. Axon displacement was also linearly related to the increasing IOS during the rising phase of the increase in ATP concentration (Fig. 4I).
Previous studies have shown that axon displacement accompanying action potential firing is inhibited by the absence of extracellular calcium (34, 38). When electrical stimulation was delivered in solutions lacking calcium and magnesium, axon displacement (Figs. 4F and 5A) and IOS (Fig. 5B) were blocked. ATP release was also inhibited after electrical stimulation in low calcium concentration (Fig. 2A), consistent with a causal relationship between ATP release and activity-dependent volume changes in axons.
Fig. 5.
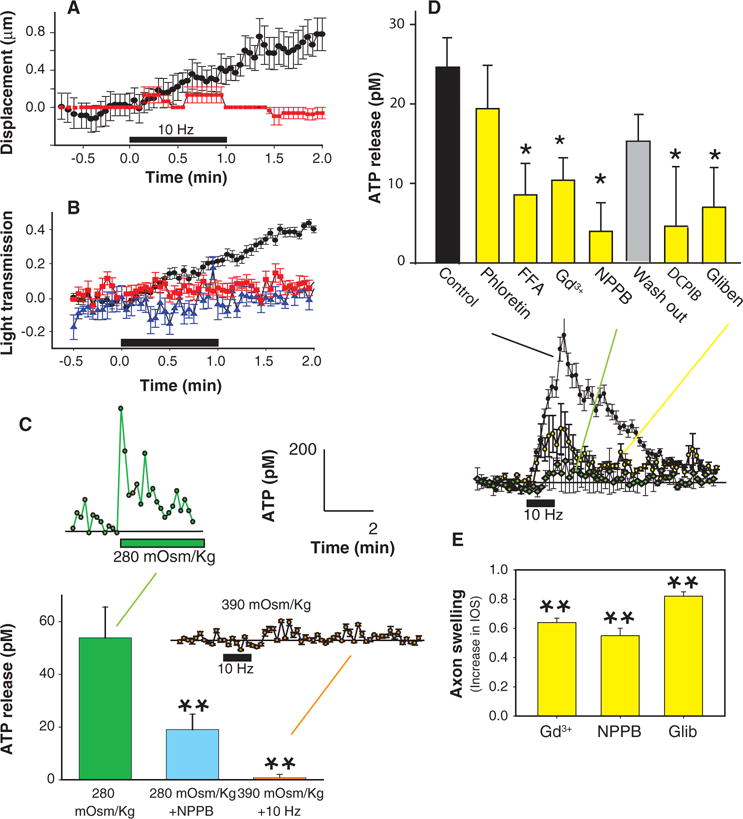
Action potential–induced ATP release from DRG axons through VAACs. (A) Displacement of axons during the rising phase of ATP concentration (black) (n = 9) was inhibited by electrical stimulation in the absence of Ca2+ and Mg2+ (red) (n = 6). (B) Light transmission through axons increased during the rising phase of ATP concentration induced by electrical stimulation of axons at 10 Hz (60 s) (black) (n = 9), but no changes in light transmission were seen in the absence of electrical stimulation (blue) (n = 9) or when stimulation was applied in the absence of extracellular Ca2+ and Mg2+ (red) (n = 6). Low-calcium solution also blocked electrically induced ATP release (Fig. 2A). (C) Hypotonic solution (280 mOsm/kg, green bar) (n = 10) caused ATP release in the absence of electrical stimulation, and this could be inhibited by co-incubation in the chloride channel blocker (NPPB) (100 μM) (blue bar) (n = 12). Hypertonic conditions (390 mOsm/kg) blocked the electrically induced release of ATP (orange bar) (n = 11). Summary data from multiple experiments using luminometry to measure ATP release are shown in the bar graph (P < 0.01, ANOVA; n = 33). ATP responses recorded with single-photon imaging microscopy are shown as insets (280 mOsm/kg, n = 1; 390 mOsm/kg with 10-Hz stimulation, n = 3). (D) Pharmacological analysis with anion channel blockers (yellow bars) implicates the maxi-anion channel in electrically induced ATP release from DRG axons (P < 0.01, ANOVA; n = 18, 13, 18, 18, 12, 3, 8, and 15). The intermediate conductance anion channel blocker phloretin (100 μM) was not effective in blocking ATP release, but 100 μM FFA, 50 μM Gd3+, 100 μM NPPB, 10 μM DCPIB, and 100 μM glibenclamide (Gliben) significantly inhibited action potential–induced ATP release from DRG axons. Release of ATP from axons in response to electrical stimulation could be restored after washing out the chloride channel inhibitor NPPB (gray bar). Consistent with the results from luminometry, inhibition of electrically induced ATP release by glibenclamide (yellow) (n = 3) and NPPB (green) (n = 3) was observed with respect to control (black) (n = 11) by single-photon imaging microscopy and shown as insets. (E) Pharmacological block of chloride channels with Gd3+ (n = 3), NPPB (n = 3), or glibenclamide (Glib) (n = 3) did not prevent axon swelling measured by IOS, indicating that the inhibition of ATP release is not caused by interference with action potential firing or axon swelling. *P < 0.05, **P < 0.01 with respect to control.
If ATP is released through VAACs in response to axon swelling induced by action potentials, then it should be inhibited under conditions that prevent axons from swelling during action potential firing. We tested this hypothesis by stimulating axons in saline solutions with increased osmotic pressure. Both single-photon imaging and luminometry showed that ATP release was blocked during electrical stimulation under hypertonic conditions (390 mOsm/kg) (Fig. 5C). Together with our data showing that ATP release was evoked by hypotonic conditions (Fig. 3G), these results indicate that axon swelling beyond normal volume is necessary for the electrically induced release of ATP from DRG neurons.
We next tested the ability of various chloride channel blockers to inhibit ATP release from DRG neurons in response to 10-Hz stimulation for 5 min (Fig. 5D). Phloretin, which blocks intermediate conductance chloride currents (51), had no significant effect on electrically induced ATP release. In contrast, flufenamic acid (FFA), NPPB, Gd3+, glibenclamide, and 4-(2-butyl-6,7-dichlor-2-cyclopentyl-indan-1-on-5-yl) oxybutyric acid (DCPIB) all reduced ATP release from DRG neurons after electrical stimulation at 10 Hz for 5 min (Fig. 5D). Action potential–induced ATP release was restored after washing out the reversible VAAC chloride channel inhibitor NPPB (Fig. 5D). This pharmacological profile implicates large-conductance VAACs (16, 17) in electrically induced ATP release from axons.
Strong IOS was apparent after electrical stimulation in the presence of Gd+3, glibenclamide, and NPPB (Fig. 5E). Therefore, inhibition of ATP release by electrical stimulation in the presence of these inhibitors cannot be explained by pharmacological inhibition of axon swelling or impairment of action potential firing, but rather appears to be a consequence of blocking VRCs necessary for ATP release.
Nonvesicular signaling in axon-glia interactions
These results indicate that ATP is released from axons through VAACs activated by axon swelling during action potential firing. This could provide a mechanism for nonsynaptic, activity-dependent communication between axons and other cells, including glia. We tested this hypothesis using calcium imaging to investigate activity-dependent axon-astrocyte signaling, which is mediated in part by ATP released from axons firing action potentials (4). Electrical stimulation of axons in coculture with astrocytes stimulated intracellular calcium responses in astrocytes (Fig. 6A). The frequency of spontaneous calcium spikes in astrocytes before axon stimulation was not affected by the chloride channel blocker NPPB (Fig. 6B); however, electrically induced calcium responses in astrocytes were significantly inhibited by NPPB (Fig. 6B). These results indicate that activity-dependent axon-astrocyte communication is mediated in part by means of ATP release from VAACs.
Fig. 6.
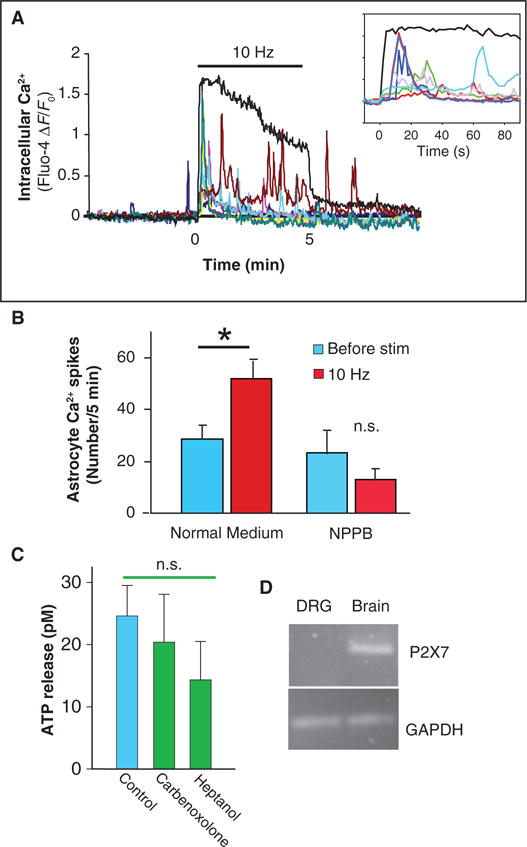
Nonsynaptic activity-dependent communication between axons and astrocytes by ATP release through VAACs. (A) Action potentials were stimulated in DRG neurons grown in coculture with astrocytes, and calcium responses were measured with Fluo-4 AM. Action potentials elicited a rapid rise in intracellular calcium in DRG axons (black trace), followed by calcium responses in astrocytes (colored traces; each trace represents a different astrocyte in the same microscope field). DRG axons were stimulated at 10 Hz for 5 min. Inset shows the same data on an expanded scale; note delayed glial response. (B) The number of calcium spikes in astrocytes during a 5-min stimulation period (red bars) was compared to the number of responses 5 min before stimulation (blue bars) from multiple experiments (n = 9). Stimulation of axons significantly increased the number of calcium responses in astrocytes, but this was blocked by pretreatment with the chloride channel blocker NPPB (100 μM). NPPB had no significant effect on the frequency of spontaneous astrocytic calcium spikes before stimulation (blue) (*P = 0.018, n = 9; n.s., not significant). (C) Release of ATP from DRG axons, in response to action potential firing (10 Hz, 5 min), was not blocked by gap junction blockers carbenoxolone and heptanol (green bars) (P = 0.48, ANOVA; n = 16, 12, and 14). (D) PCR failed to detect P2X7 receptors in DRG neurons, which can release ATP from some nonneuronal cells. GAPDH is a loading control, and mRNA from brain is a positive control.
Additional ATP release mechanisms
Our findings do not exclude the possibility that gap junction hemichannels or other mechanisms could contribute to electrically induced ATP release from axons; however, additional investigation provided no evidence to support their involvement in ATP release from DRG neurons. Although ATP can be released through gap junction hemichannels in astrocytes (12), functional gap junction hemichannels have not been identified in DRG neurons. Moreover, we were unable to detect Lucifer yellow, a fluorescent tracer permeable through gap junction hemichannels, inside DRG neurons after prolonged electrical stimulation (30 min at 10 Hz) in cultures containing the dye, although it was readily internalized into astrocytes (fig. S1). Furthermore, heptanol and carbenoxolone, two pharmacological blockers of gap junction hemichannels, failed to inhibit electrically induced ATP release from DRG axons (Fig. 6C). In marked contrast, these inhibitors blocked Lucifer yellow filling of astrocytes and dye coupling between astrocytes through gap junctions in monoculture (fig. S1). CFTR has been implicated in ATP release from lung epithelial cells (14), and the P2X7 receptor in ATP release from astrocytes (13); however, we were unable to detect these channels in DRG neurons by RT-PCR analysis (Figs. 3, A and B, and 6D) and CFTR in DRG axons by immunocytochemistry (Fig. 3C). Thus, we conclude that ATP release in response to electrical stimulation of DRG axons can occur through a pathway independent of the vesicular release protein SNAP-25, gap junction hemichannels, the CFTR, and P2X7 receptor, but is instead sensitive to five different compounds that block VAACs.
DISCUSSION
These studies implicate axonal swelling and the subsequent activation of volume-sensitive channels in the nonsynaptic and nonvesicular activity-dependent release of ATP from axons. We found that action potential firing caused microscopic axon swelling, which was accompanied by increased light transmission through axons and minute axonal displacement. This in turn activated Cl− channels in the axon membrane, with a pharmacological profile consistent with VAACs, a class of channels that restore normal cell volume after cell swelling through the release of water together with ATP, glutamate, and other organic and inorganic anions (17, 18) (table S1).
ATP release induced by electrical depolarization depended on sodium-dependent action potentials but not on vesicular release. Electrical stimulation in the presence of TTX blocked ATP release, and ATP release could be induced in the absence of electrical stimulation by the sodium channel activator veratridine. Electrically induced ATP release was not, however, blocked by botulinum toxin or bafilomycin, which inhibit synaptic vesicle release. Axon swelling produced osmotically in the absence of electrical stimulation induced ATP release from DRG neurons, in part through VAAC activation, as indicated by its inhibition by NPPB.
Action potential firing caused axon swelling that could be measured by the increase in light transmission through axons and by microscopic physical displacement of axons. ATP release was linearly related to this swelling. Manipulations that blocked swelling and displacement of axons during electrical stimulation, such as low calcium or hypertonic medium, also blocked ATP release, supporting a causal relationship between the two.
RT-PCR and immunocytochemistry of DRG neurons revealed the presence of candidate genes that have been associated with biophysically identified VAACs in other cells. Pharmacological evidence and physiological studies of transmembrane Cl− flux demonstrated functional VAACs in these neurons.
Five different pharmacological inhibitors of VAACs decreased electrically induced ATP release from DRG neurons, whereas phloretin (51), which blocks the intermediate conductance chloride channel (VRAC), did not. This pharmacological profile implicates the maxi-anion channel, which is sensitive to block by Gd3+, NPPB, DCPIB, and DIDS, but insensitive to phloretin (20) in electrically induced ATP release. The large 1.3-nm-radius pore can permit efflux of small organic anions and ATP.
More than one channel type may be responsible for the results reported here. In addition to the VRAC inhibitors DCPIB and NPPB, an inhibitor that does not block the maxi-anion channel in nonneuronal cells, glibenclamide, inhibited ATP release from DRG neurons stimulated at 10 Hz. In nonexcitable cells, glibenclamide is a potent inhibitor of the CFTR, but no evidence for this chloride channel could be found in DRG neurons by RT-PCR or immunocytochemistry, and Gd3+, which does not block CFTR, did block action potential–induced ATP release. FFA, an inhibitor of calcium-activated chloride channels, also inhibited ATP release from DRG neurons. This cannot be explained by inhibition of hemichannels, because our results provided no evidence for functional hemichannels in DRG axons. FFA inhibits excitatory amino acid release from astrocytes through VAAC activation under hypotonic conditions, suggesting a possible pathway contributing to ATP release (52). VDAC, identified in DRG neurons by RT-PCR and immunocytochemistry, has a large 1.7-nm-diameter pore, which could release ATP (22), but this gene is excluded from the maxi-chloride current by gene knockout experiments (22, 23).
Most information concerning VAAC function and pharmacology derives from studies on the response to hypotonic stress in nonexcitable cells (17). Much less is known about VAACs in excitable cells, where chloride channels have an additional function in maintaining resting membrane potential and excitability. The functional characteristics and pharmacological properties of VAACs could differ between DRG neurons and other cells. Excitable and nonexcitable cells have different types and concentrations of plasma membrane ion channels, and intracellular chloride concentration in neurons is dynamic and actively regulated by transport; often, intracellular Cl− is maintained far from electrochemical equilibrium. Moreover, differences are seen in pharmacological blockade of ATP and amino acid release from VAACs in studies of volume regulation in nonexcitable cells such as astrocytes, indicating that different types of VAACs can contribute to ATP and amino acid release from the same cell type under different conditions. For instance, one study found that phloretin inhibited excitatory amino acid release from astrocytes in response to VAACs stimulated by hypotonic conditions (53), whereas a similar study by another group found only weak effects of phloretin (54). Whereas Gd3+ fails to affect excitatory amino acid release or VAAC currents in rat astrocytes (55), it inhibits hypotonicity-induced ATP release from astrocytes in another study (21).
Osmotic imbalance is a severe cellular stressor that causes large changes in cell volume and is associated with large transmembrane flux of water, activating many transporters, ion exchangers, and ion channels (notably Cl− and K+) and stimulating intracellular signaling cascades to cope with stress and to mediate recovery of cell volume. In contrast, the volume changes in axons produced by action potentials are exceedingly small. Microscopic action potential–induced axon swelling results from the transmembrane flux of ions and water during membrane depolarization and repolarization, and calcium is paramount in causing electrically induced axon swelling. Further progress on identifying the extent to which different VAACs contribute to ATP release under different conditions awaits genetic identification of VAAC channels, but our findings reveal a function for VAACs in releasing ATP and possibly other anionic cell-cell signaling molecules from neurons in response to membrane swelling during excitation.
Our data do not suggest that ATP cannot be released from synaptic vesicles. Rather, they show that a nonvesicular mechanism for ATP release from DRG neurons can be activated by action potential firing. In regions of neurons lacking synapses or accumulations of synaptic vesicles, such as along axon segments, nonvesicular release of ATP in response to action potential firing could participate in cell-cell or autocrine signaling. We found that this mechanism of activity-dependent, nonvesicular release of ATP through VAACs was important in signaling from axons to astrocytes, which are not synaptically coupled to axons. Vesicular and nonvesicular mechanisms of neurotransmitter release are likely to have different functions and respond differently to distinct patterns of impulse activity in axons. Our studies provide five pharmacological agents, two ionic conditions (Gd3+ and low Ca2+ solution), and hypertonic conditions that inhibit electrically induced release of ATP from axons. These tools will facilitate investigations into the functional significance of ATP release through VAACs in axon communication with other cells.
Many cells in the nervous system have membrane receptors for ATP (4). Therefore, such diverse functions as activity-dependent effects on development, cell differentiation, vasculature, and immune responses in the brain could be regulated by neural impulse activity communicated by ATP release outside synaptic regions. Structural changes in white matter fiber tracts are seen in the human brain after learning (56, 57) and in animals raised in enriched environments (58), suggesting the possibility of activity-dependent signaling from axons. Electrically induced release of ATP from DRG axons in cell culture stimulates myelination (1–3), and such regulation could be important in nervous system development and cognitive function or dysfunction through myelin-dependent alterations in impulse conduction velocity (27).
ATP receptors are also present on neurons. This nonsynaptic mechanism of communicating electrical activity to neurons could expand transmission of information in the brain beyond the synapse to include autocrine and two-way communication among axons, dendrites, and cell bodies (59). Volume-regulated anion channels are also permeable by glutamate and other small amino acids (17, 60), which could activate neurotransmitter receptors on neurons and glia. This broader and nonlinear form of communication could coordinate responses among different neurons that are not synaptically coupled and could be relevant to diseases accompanied by hyperexcitation, such as chronic pain or seizure. ATP release has been implicated in neuron-glia signaling in chronic pain (7) and, during seizure, released ATP contributes to excitation and activation of microglia and astrocytes. The generation of adenosine by hydrolysis of ATP released from neurons also contributes to the arrest of seizures (61). However, the frequency-response data would suggest that this ATP release mechanism would also operate when trains of action potentials are transmitted at rates accompanying normal physiological activity.
MATERIALS AND METHODS
Neuron cell culture
DRG neurons were dissected from the spinal cords of embryonic day 13.5 (E13.5) mouse fetuses. Cells were dissociated from fetal ganglia and plated on the side or center compartment of multicompartment cell culture chambers as described previously (3). Culture medium contained minimum essential medium components (Invitrogen) supplemented with N3 [transferrin (200 μg/ml), 200 μM putrescine, 60 nM sodium selenite, triiodothyronine (20 ng/ml), insulin (10 μg/ml), 40 nM progesterone, corticosterone (40 ng/ml), 0.001% bovine serum albumin], NGF (nerve growth factor; 100 ng/ml), and 5% heat-inactivated horse serum. Neurons were maintained at 37°C in a cell culture incubator with a 10% CO2 atmosphere. One day after plating, the antimitotic agent 5-fluoro-2-deoxyuridine (13 μg/ml) was added to cultures to prevent nonneuronal cell division. The culture medium was changed with fresh medium (half volume) every 3 days. These cultures contain no Schwann cells, as verified by PCR (1), and DRG neurons do not form synapses in monoculture. The axon compartment is free of DRG cell bodies and other cells (25). The neurons were used for experiments after growing 3 to 4 weeks in culture to allow extensive axon outgrowth under the barriers separating the cell body and axon compartments.
Neuron-astrocyte cocultures
For calcium-imaging studies of axon-astrocyte signaling, cortical astrocyte cultures were prepared from P0 (postnatal day 0) to P2 Sprague-Dawley rats and grown in culture flasks in Dulbecco’s modified Eagle’s medium (DMEM; Invitrogen) containing 10% fetal bovine serum (Invitrogen) for 2 weeks until reaching confluence. Flasks were then shaken at 175 rpm at 37°C for 2 hours to remove nonadherent contaminating cells. After a complete medium change, flasks were returned to the shaker overnight. The next day, astrocytes were detached from the flasks with 0.25% trypsin (Invitrogen) and plated onto the side compartments of multicompartment cell culture chambers made on glass-bottomed dishes (World Precision Instruments) coated with poly-L-lysine (0.1 mg/ml; Sigma-Aldrich) and 1% collagen (Purecol). After astrocytes were maintained for 1 week in the cell culture incubator, DRG neurons were prepared (as described above) and plated on the astrocytes in DRG neuron culture medium.
Electrical stimulation
Multicompartment cell cultures fitted with platinum stimulation electrodes were used for electrical stimulation of DRG axons (25). For imaging studies, multicompartmented cultures were made on glass-bottomed 35-mm culture dishes coated with poly-L-lysine (Sigma-Aldrich) and then collagen. Plastic culture dishes coated with collagen were used for measuring ATP release by luminometry. Axons from DRG neurons plated in either the side or the central compartment grow under the fluid-tight partition into the adjacent compartment. This provides a high-resistance electrical seal around the axons for stimulation through platinum electrodes on opposite sides of the barrier. This high-resistance seal allows stimulation with low-voltage pulses (6 V, 0.2 ms biphasic). Neurons that do not grow axons under the barrier are not excited to fire action potentials by the stimulus, because the current density in the low-resistance bulk culture fluid is well below activation threshold (25, 26). DRG neurons do not have dendrites or synapses. They do not fire action potentials spontaneously in monoculture, and they respond to a brief electrical stimulus with a single action potential.
ATP measurements
ATP concentration was measured by two methods based on a chemiluminescence luciferin/luciferase assay. For measurement by luminometry, ATP released into the culture medium by electrical stimulation of DRG axons was measured in multicompartment DRG neuronal cultures maintained at 37°C on a humidified heat block. The culture medium was replaced with balanced saline solution [in mM, 145 NaCl, 4.5 KCl, 10 Hepes, 2 CaCl2, 1 MgCl2, 10 glucose, and 320 mOsm/kg by addition of sucrose (pH 7.3)] or measurements were carried out, without changing the normal culture medium, at 37°C and maintained at pH 7.3 by 10% CO2/90% air superfusion. ATP responses did not differ in the two solutions. Hypertonic solution was made by adding additional sucrose, and hypotonic solution was made by omitting sucrose and adding water. The cultures rested undisturbed on the heat block for 30 min before experimentation. Samples (10 μl) of culture medium were taken from cultures with a pipette and delivered into glass test tubes containing 90 μl of ATP assay reaction mix (Sigma-Aldrich). Samples were taken before stimulation and again 5 min after 10-Hz stimulation or at other sampling intervals and stimulus frequencies and durations as described in specific experiments. Luminescence was measured immediately with a luminometer (Lumat LB Model 9507, EG&G). The ATP concentration was determined by linear regression of luminescence integrated over 5 s against ATP calibration standards in each experiment after subtraction of background readings. The plotted data show changes in ATP concentration after electrical stimulation. All drugs and ionic conditions used were tested for possible interference with the ATP assay.
For measurement by single-photon imaging, multicompartment cultures made on glass-bottomed dishes (#1 coverslip thickness) were placed on the stage of a Zeiss Axiovert 100 inverted microscope and superfused with balanced saline solution (formula above) containing luciferase (40 μg/ml; Sigma) and D-luciferin (1.5 mg/ml; Sigma). A constant, gentle flow rate of 55 μl/min was maintained with a perfusion pump equipped with a six-way injection valve (model 7000, Rheodyne Inc.) to introduce drugs for inhibitor experiments into the perfusion stream with minimal mechanical disturbance of cultures. More stable recordings were obtained by stopping the perfusion briefly during the period of image acquisition.
The microscope was equipped with an oil immersion Plan Neofluar 40× 1.3 numerical aperture (NA) objective lens, and a high-gain, low-noise image intensifier designed for ultralow light levels (C2400-40, Hamamatsu) with the intensifier adjusted to maximum gain. The intensifier was coupled through a relay lens to a Hamamatsu CCD video camera. The signal from the CCD camera was input to a DSP2000 image processor (DAGE-MTI) for high-resolution, real-time image processing, frame integration, and storage. The video signal from the signal processor was captured and digitized with a FlashBus frame grabber (Integral Technologies) for analysis with Metamorph and Metafluor image software (Molecular Devices). The same software also controlled light shutters and signal routing for image acquisition and illumination. Photon-imaging experiments were conducted in a dark room with the microscope housed inside a light-tight black box to exclude extraneous photons.
After signal processing through high-gain amplifiers set near maximum gain and contrast, high-level thresholding was applied to exclude all but single-photon events. Images were acquired at 32 frames per second and integrated (summed) for 1 s. A transmitted light image was then acquired immediately following the 32-frame integration of single-photon events with the same camera but after rapidly switching off the intensifier to obtain a bright-field image using dim transillumination (see IOS method below). Bright-field images were processed for intrinsic optical signals (described below). This acquisition sequence was repeated at 10-s intervals and the digitized images were saved to build a time-lapse video.
Typically, electrical stimulation was started after acquiring 2 min of baseline data and continued for another 8 min. Other sampling intervals were sometimes used as described in specific experiments. All imaging experiments were conducted at room temperature.
The number of photons in each image frame, representing the number of photons accumulated during 1 s, was counted with the automated imaging morphometry analysis software in Metamorph. The photon counts were converted to ATP concentration by calibration against ATP concentration standards (r2 = 0.994), and the changes in ATP concentration were plotted over time.
Luminometry and single-photon imaging microscopy are complementary techniques. Single-photon imaging provides more rapid sampling, which is essential for kinetic studies of ATP release. Luminometry requires tens of seconds between samples (typically 1 min). The number of samples that can be removed from the cell culture compartments for ATP assay by luminometry is limited to fewer than five. Cell culture compartments contain only 200 μl of fluid. Extracting more than five samples reduces the volume of solution, compromising reliable collection of samples without incurring the possibility of disturbing the cells mechanically or contaminating the sample with cells. Photon imaging can be carried out continuously and noninvasively. This excludes the possibility that ATP release might have been produced by mechanical stimulation in obtaining the fluid sample for luminometry, and it allows large numbers of repeated measurements to be made on the same preparation. Luminometry enables greater replication among experiments because the large volume of luciferin and luciferase required to superfuse cultures makes photon imaging prohibitively expensive for large numbers of replicates. Single-photon imaging is also time-consuming to perform and analyze compared with luminometry. The reaction conditions for the chemiluminescence reaction can be optimized in the buffer for ATP measurements by luminometry, but with single-photon imaging the composition of the culture medium must be formulated for optimal maintenance of DRG neurons in culture. Photon imaging measures ATP concentration only within the narrow focal plane of the objective lens (adjacent to the axon), rather than diluted into the bulk volume of solution. The concentration of ATP adjacent to the axon is higher and more biologically relevant than the concentration diluted into the bulk medium; however, this still underestimates the concentration of ATP at the membrane. Photon imaging allows spatial analysis that can be performed on individual living cells together with transmitted light imaging and measurements of axon displacement in the same cell.
In experiments involving the addition of compounds blocking ion channels, single-photon imaging required adding compounds at working strength to the cultures containing live cells. Luminometry, however, involved taking a small 10-μl sample of medium from the cultures and placing it in a cuvette containing a 10 times larger volume of reaction mixture optimized for the assay of ATP. The cells were exposed to the same concentration of drugs in both cases, but the concentration of the drug in the assay mixture was 10 times higher in single-photon imaging than with luminometry. Some of the compounds can interfere with the luciferin-luciferase reaction at higher concentration.
Possible interference of drug treatments with the ATP measurements was tested with standard ATP solutions for all experimental treatments using both methods of ATP analysis. EGTA (2 mM), in the absence of Ca2+ and Mg2+, or 50 μM Gd3+ interfered with the ATP assay when used in single-photon imaging microscopy, but culture medium containing 50 μM Gd3+ and low calcium (0.5 mM) in the absence of EGTA did not interfere with the sensitivity of the luminometry ATP assay (which dilutes the sample 10 times in the ATP reaction mixture), nor did the other drugs at the concentrations used in these experiments. Carbonate-free saline was used for experiments with Gd3+.
ATP release from intact nerve
ATP release was also measured from freshly isolated rat optic nerve and dorsal roots of the spinal cord and sciatic nerve. Adult Sprague-Dawley rats were anesthetized, and nerves were dissected and bathed in normal balanced salt solution bubbled with 95% O2/5% CO2 in a volume of 0.25 to 0.5 ml. Hepes buffer in the formula for the balanced saline solution (above) was replaced with 1.25 mM NaH2PO4 and 26 mM NaHCO3 buffer. Dorsal roots and desheathed sciatic nerves were stimulated through a pair of platinum stimulation electrodes connected to a constant-current stimulator, using biphasic pulses delivered to a segment of nerve lifted out of the bath and protected from desiccation by a coating of mineral oil. Optic nerves were stimulated through a glass suction electrode. Ten microliters of the saline solution bathing the nerve was sampled at 1-min intervals before and after 10-Hz stimulation for 5 min, and the concentration of ATP was measured with a luminometer.
Intrinsic optical signaling
IOS was performed with transillumination and digital image processing for background subtraction and averaging. Stable illumination intensity was provided by a Kepco ATE-15-25M constant-current regulated power supply (Kepco Inc.) in constant-power mode to deliver consistent voltage of ~4 V to a 12-V, 100-W tungsten filament illumination source. The heat filter was removed from the light path to transmit maximal infrared wavelengths, which provide the greatest IOS resulting from light scattering through axons. Two neutral density (n.d.) filters (0.3 and 1.3 n.d.) were used in combination to dim the intensity of illumination through a long working distance, bright-field condenser. Electronic shutters driven by Metafluor software limited illumination to the 1- to 2-s acquisition period during which 32 to 64 frames were averaged. Images were acquired every 1 to 10 s, depending on the experiment. Microscopy was similar in other respects to that described above for single-photon imaging, but without high-gain image intensification.
The time-lapse images were postprocessed for IOS by background subtraction with a reference image before stimulation, followed by gain and contrast enhancement and display of images on a pseudo color scale. Changes in intensity of light transmission through axon fascicles were measured by calculating the mean intensity of pixels in a circular region of interest positioned on several different axon fascicles in the image. Light transmission was normalized to the maximum intensity in each experiment to allow combining data from multiple replicate experiments. The pixel intensity values were exported and the fractional transmission with respect to the maximum intensity in each experiment was plotted against time.
Microscopic axon displacement
Axon displacement was detected by increasing the magnification of bright-field images acquired in time-lapse recording by 800% with the digital zoom function in Metamorph. Microscopic axon displacement of axons was imperceptible without postprocessing because the changes were small and developed slowly, but they were readily apparent when the time-lapse videos were replayed at high speed. The x and y location of individual pixels on the edge of axons was recorded for each image frame in the time-lapse sequence and tracked with the Track Objects function of Metamorph to obtain a quantitative measure of axon displacement. The resultant displacement was calculated (square root of x2 + y2) and subtracted from the starting location to enable pooling data from several replicate experiments and to normalize for differences in orientation of individual axons in the microscope field. These changes were near the ~0.5-μm resolution of the microscope with the objective lens and long-working condenser used. Stationary objects in the field were tracked as controls. These points did not move.
Axon displacement was confirmed by time-lapse confocal microscopy. DRG neurons were incubated with a membrane fluorescent dye (Vybrant DiI, 5 μM) in low-serum medium for 20 min at 37°C, and then washed with balanced saline solution at room temperature. Culture dishes were placed on a TE300 inverted microscope (Nikon) equipped with a Radiance 2100 laser scanning head (Bio-Rad) and imaged with a 60× 1.4 NA Plan Apochromatic lens using 543-nm laser illumination and an HQ590/70 emission filter. Fluorescence emission from neurons was collected by a photomultiplier tube (PMT), and images were acquired with Lasersharp 2000 software (Zeiss). Two images were averaged and acquired at 10-s intervals for 10 min. Displacement of axons was analyzed by Metamorph software as described above.
Ca2+ imaging
Neurons were incubated with the calcium indicator Fluo-4 AM (10 μg/ml) (Invitrogen) in solution containing 0.02% pluronic acid F-127 and 0.1% bovine serum albumin in normal balanced saline solution at 37°C for 30 min. This was followed by 30-min incubation in balanced saline solution at room temperature to permit deesterification of the dye inside neurons. Fluorescence in live cells was monitored by confocal microscopy with a 40× 1.30 NA Plan Fluor objective lens on a Nikon TE200 inverted microscope and Radiance 2100 laser scanning confocal microscope (Bio-Rad). Excitation at 488 nm was provided by scanning laser, and emission was collected by PMT through an HQ528/50 filter. Images were acquired with Lasersharp 2000 software (Zeiss), and quantification and image analysis was performed with ImageJ software (National Institutes of Health) and Metamorph software. The same Fluo-4 loading procedure was used for experiments imaging calcium responses in astrocytes in coculture with DRG neurons.
Intracellular chloride measurement
Changes in cytoplasmic Cl− in DRG neurons were monitored with two-photon microscopy to excite the fluorescent indicator 6-methoxy-N-ethylquinolinium iodide (MEQ) (Molecular Probes, Invitrogen Inc.). The cell-permeable indicator DiH-MEQ was synthesized from MEQ following the procedure of Biwersi and Verkman (46). Briefly, 16 μmol MEQ was reacted with 32 μmol NaBH4 at room temperature under N2 in the dark for 30 min. DiH-MEQ was then purified by chloroform extraction, dried with anhydrous Na2SO4 for 5 min, stored at −40°C under N2, and used within 1 week. Neurons cultured on glass coverslips were loaded with DiH-MEQ by 10-min incubation in 50 μM DiH-MEQ at room temperature and washed with physiological buffer for 20 to 30 min to allow the internalized DiH-MEQ to become oxidized into the cell-impermeable Cl− indicator MEQ. The indicator was excited by two-photon excitation with a 5-W, Ti:S femtosecond mode-locked laser (Mira, Coherent Inc.) at a wavelength of 735 nm, and the fluorescence emission from MEQ was detected through a 435– to 485–band pass (bp) filter on a Zeiss 510 two-photon/confocal microscope. Intracellular chloride quenches the fluorescence of MEQ without altering its excitation or emission spectra (344 and 440 nm, respectively). Neurons were superfused on the microscope stage with Hepes-buffered balanced saline solutions of 280, 320, and 390 mOsm/kg controlled by an electronic six-channel valve controller (Warner Instruments). Cell morphology was monitored in alternation with MEQ fluorescence with differential interference contrast (DIC) optics and a transmitted light detector with illumination at 543 nm provided by a HeNe laser to measure changes in cell volume. Images were acquired sequentially at ~3-s intervals.
RT-PCR
Total RNA was extracted from DRG neuronal cultures with TRIzol (Invitrogen) and also from whole brain and lung to obtain mRNA for positive controls. Total RNA (2 μg) was used for reverse transcription reaction containing the following reagents (Invitrogen): oligo(dT)12–18, deoxynucleotide triphosphate (dNTP), dithiothreitol (DTT), RNaseOUT, SuperScript II, and reaction buffer. The resulting complementary DNA (cDNA) was used for PCR with PCR SuperMix (Invitrogen), and the PCR products were separated on a 1% agarose gel by eletrophoresis and stained with ethidium bromide or SYBR gold. PCR was carried out on a PTC-200 thermal cycler (MJ Research) using 30 to 35 cycles of 94°C for denaturing (30 s), 58°C to 62°C for annealing (1 min), 72°C for extension (1 min), and a final extension after the last cycle at 72°C for 7 min. The primer sequences for chloride channels were identical to those used by Parkerson and Sontheimer (62), who adopted them from Kulka et al. (63) (ClC-1, ClC-5, ClC-6), Enz et al. (64) (ClkC-2, ClC-3, ClC-4), Huber et al. (65) (CFTR), and Bres et al. (66) (VDAC-1). P2X7 primers were from Duan et al. (67).
CLC1: 5′-TGTGGAACGCTCAGAACTGCAGTC-3′, 5′-TCTAGTGCCAAGACACCTCTGAGC-3′
CLC2: 5′-CAAGTTCCTCTCCCTCTTTG-3′, 5′-GAACTGTCCAAAGCCAGGG-3′
CLC3: 5′-CCTCTTTCCAAAGTATAGCAC-3′, 5′-TTACTGGCATTCATGTCATTTC-3′
CLC4: 5′-GGTACATGGCTGAACTCTTC-3′, 5′-GAGTCATGTTGGGGTCATTG-3′
CLC5: 5′-TGCTGACTGTCCTTACTCAG-3′, 5′-CAGGATGTTCCGAAGCTTCA-3′
CLC6: 5′-TGTGCTGCTGCTGCCGGTGGTG-3′, 5′-CTGACTGCATTCCTCCACCGACGTT-3′
CLC7: 5′-ATGAGCACACCTGTGACCTGCCTG-3′, 5′-CGAGGAAGAGATGCCTCCTGTGGC-3′
CFTR: 5′-CGCAGGTTCTCAGTAGACGAT-3′, 5′-CCTCAACCAGAAAAACCAGTACGCA-3′
VDAC-1: 5′-GGACTGAGTATGGGCTGACG-3′, 5′-GCTGCTATTCCGAAGCGAGTGTTAC-3′
P2X7: 5′-TCCACCCTGTCCTACTTTGG-3′, 5′-CTTGCAGACTTTTCCCAAGC-3′
The expected sizes for the PCR products in the order listed above are 656, 499, 552, 297, 269, 345, 377, 607, 478, and 253 bp.
RT-PCR was also carried out on DRG neurons plucked individually from cultures by means of a glass microelectrode with a broken tip, positioned with a micromanipulator on the stage of an inverted microscope. Suction was used to draw the neuron into the glass capillary. The cells were delivered into a PCR tube by breaking the tip of the microelectrode into the tube and freezing the sample in a mixture of dry ice and ethanol. RNA from 20 neurons was extracted and amplified by two rounds of RNA amplification with MessageAmp II aRNA kit (Ambion), yielding a total of 50 μg of amplified RNA product. Two micrograms of amplified RNA product was used for reverse transcription to cDNA with SuperScript II (Invitrogen).
Immunocytochemistry
DRG neuronal cultures on glass-bottomed culture dishes were fixed with Dent’s fixative [80% methanol, 20% dimethyl sulfoxide (DMSO)] for 30 min and washed with phosphate-buffered saline (PBS). Neurons were permeabilized with 0.1% Triton X-100 for 5 min, then washed with PBS, and incubated with 3% normal goat serum in PBS (or donkey serum as appropriate for the specific secondary antibody used) for 1 hour to block nonspecific binding. Primary antibody was diluted in blocking solution and added to cultures incubated at 4°C overnight. After washing with PBS, the appropriate secondary antibody was diluted in blocking solution and added to cultures for 1.5 hours at room temperature. After a thorough wash with PBS, the coverslips were removed from dishes and mounted onto slides. ClC3, ClC4, ClC5, ClC7, and CFTR antibodies (Santa Cruz Biotechnology) were diluted 1:50 to 1:500. VDAC antibody (Sigma) was diluted 1:500. The specificity of the antibody was tested by preabsorption of the primary antibody with the peptide used to generate the antibody or controls lacking primary antibody.
Pharmacology
NPPB (Tocris) and FFA (Sigma) were dissolved in DMSO as 100 mM stock solutions. GdCl3 (Sigma) and carbenoxolone (Sigma) were dissolved in water as 50 and 100 mM stock solutions, respectively. Glibenclamide (Sigma) was dissolved in DMSO as a 50 mM stock solution. Phloretin (Sigma) was dissolved in methanol as a 100 mM stock solution. DCPIB was dissolved in 100 mM ethanol and used at 10 μM. Bafilomycin A1 (Sigma) was dissolved in DMSO as a 1 mM stock solution. Drugs were added directly to the culture dish at least 20 min before experiments; bafilomycin was added to cultures 1 hour before experiments. Botulinum toxin A was added to cultures at a final concentration of 3 nM 24 to 48 hours before experiments to block vesicular release. Immunoblot confirmed cleavage of SNAP-25 in the DRG neurons. Previous studies show block of neurosecretion from DRG neurons in cell culture within 4 hours of botulinum toxin treatment, which is sustained for 15 days after removal of the toxin (45).
Statistical analysis
Statistical significance was tested by analysis of variance (ANOVA) in experimental designs involving multiple groups, followed by Dunnett’s post hoc test for evaluating differences with respect to a control group and Fisher’s comparison test for designs comparing differences among all groups. Two-sided Student’s t test was used for analysis of experimental designs with two groups, and a paired t test was used in experiments in which repeated measures were made in the same sample. Data are displayed as means and SEM. Linear regression was by least-squares fitting. Minitab version 12 and SigmaPlot version 10 computer programs were used for statistical analysis and plotting.
Supplementary Material
Fig. S1. Absence of functional gap junction hemichannels in DRG neurons and positive controls.
Table S1. Guide to chloride channels with emphasis on those implicated in release of ATP and small amino acids during cell volume regulation.
Acknowledgments
This manuscript is dedicated with thanks for many helpful discussions to I. Tasaki (1910 to 2009). We thank P. Wadeson for assistance with cell culture; P. Lee for the immunoblot in Fig. 2C and RNA amplification from single cells; O. Bukalo for assistance with electrical stimulation of rat optic nerve; and P. Basser, O. Rennert, C. Smith, and C. McBain for critically reading the manuscript.
Funding: Supported by National Institute of Child Health and Human Development funds for intramural research.
Footnotes
Author contributions: R.D.F. designed and performed experiments, analyzed the data, and wrote the paper. Y.N. performed experiments that did not involve IOS, single-photon, axon displacement, or MEQ imaging.
Competing interests: The authors declare that they have no competing interests.
SUPPLEMENTARY MATERIALS
REFERENCES AND NOTES
- 1.Stevens B, Fields RD. Response of Schwann cells to action potentials in development. Science. 2000;287:2267–2271. doi: 10.1126/science.287.5461.2267. [DOI] [PubMed] [Google Scholar]
- 2.Stevens B, Porta S, Haak LL, Gallo V, Fields RD. Adenosine: A neuron-glial transmitter promoting myelination in the CNS in response to action potentials. Neuron. 2002;36:855–868. doi: 10.1016/s0896-6273(02)01067-x. [DOI] [PMC free article] [PubMed] [Google Scholar]
- 3.Ishibashi T, Dakin KA, Stevens S, Lee PR, Kozlov SV, Stewart CL, Fields RD. Astrocytes promote myelination in response to electrical impulses. Neuron. 2006;49:823–832. doi: 10.1016/j.neuron.2006.02.006. [DOI] [PMC free article] [PubMed] [Google Scholar]
- 4.Fields RD, Burnstock G. Purinergic signalling in neuron-glia interactions. Nat Rev Neurosci. 2006;7:423–436. doi: 10.1038/nrn1928. [DOI] [PMC free article] [PubMed] [Google Scholar]
- 5.MacVicar BA, Salter MW. Neuroscience: Controlled capillaries. Nature. 2006;443:642–643. doi: 10.1038/443642a. [DOI] [PubMed] [Google Scholar]
- 6.Inoue K. ATP receptors of microglia involved in pain. Novartis Found Symp. 2006;276:263–272. discussion 273–281. [PubMed] [Google Scholar]
- 7.Fields RD. New culprits in chronic pain. Sci Am. 2009;301:50–57. doi: 10.1038/scientificamerican1109-50. [DOI] [PubMed] [Google Scholar]
- 8.Su C, Bevan JA, Burnstock G. [3H]Adenosine triphosphate: Release during stimulation of enteric nerves. Science. 1971;173:336–338. doi: 10.1126/science.173.3994.336. [DOI] [PubMed] [Google Scholar]
- 9.Holton P. The liberation of adenosine triphosphate on antidromic stimulation of sensory nerves. J Physiol. 1959;145:494–504. doi: 10.1113/jphysiol.1959.sp006157. [DOI] [PMC free article] [PubMed] [Google Scholar]
- 10.Wieraszko A, Goldsmith G, Seyfried TN. Stimulation-dependent release of adenosine triphosphate from hippocampal slices. Brain Res. 1989;485:244–250. doi: 10.1016/0006-8993(89)90567-2. [DOI] [PubMed] [Google Scholar]
- 11.Hamilton N, Vayro S, Kirchhoff F, Verkhratsky A, Robins J, Gorecki DC, Butt AM. Mechanism of ATP- and glutamate-mediated calicum signaling in white matter astrocytes. Glia. 2008;56:734–749. doi: 10.1002/glia.20649. [DOI] [PubMed] [Google Scholar]
- 12.Lazarowski E. Regulated release of nucleotides and UDP sugars from astrocytoma cells. Novartis Found Symp. 2006;276:73–84. discussion 84–90, 107–112, 275–281. [PubMed] [Google Scholar]
- 13.Suadicani SO, Brosnan CF, Scemes E. P2X7 receptors mediate ATP release and amplification of astrocytic intercellular Ca2+ signaling. J Neurosci. 2006;26:1378–1385. doi: 10.1523/JNEUROSCI.3902-05.2006. [DOI] [PMC free article] [PubMed] [Google Scholar]
- 14.Schwiebert EM, Egan ME, Hwang TH, Fulmer SB, Allen SS, Cutting GR, Guggino WB. CFTR regulates outwardly rectifying chloride channels through an autocrine mechanism involving ATP. Cell. 1995;81:1063–1073. doi: 10.1016/s0092-8674(05)80011-x. [DOI] [PubMed] [Google Scholar]
- 15.Burnstock G. Release of vasoactive substances from endothelial cells by shear stress and purinergic mechanosensory transduction. J Anat. 1999;194:335–342. doi: 10.1046/j.1469-7580.1999.19430335.x. [DOI] [PMC free article] [PubMed] [Google Scholar]
- 16.Sabirov RZ, Okada Y. ATP release via anion channels. Purinergic Signal. 2005;1:311–328. doi: 10.1007/s11302-005-1557-0. [DOI] [PMC free article] [PubMed] [Google Scholar]
- 17.Kimelberg HK, Macvicar BA, Sontheimer H. Anion channels in astrocytes: Biophysics, pharmacology, and function. Glia. 2006;54:747–757. doi: 10.1002/glia.20423. [DOI] [PMC free article] [PubMed] [Google Scholar]
- 18.Alexander SPH, Mathie A, Peters JA. Guide to Receptors and Channels (GRAC), 4th edition. Br J Pharmacol. 2009;158:S1–S254. doi: 10.1111/j.1476-5381.2009.00499.x. [DOI] [PMC free article] [PubMed] [Google Scholar]
- 19.Duran C, Thompson CH, Xiao Q, Hartzell HC. Chloride channels: Often enigmatic, rarely predictable. Annu Rev Physiol. 2010;72:95–121. doi: 10.1146/annurev-physiol-021909-135811. [DOI] [PMC free article] [PubMed] [Google Scholar]
- 20.Sabirov RZ, Okada Y. The maxi-anion channel: A classical channel playing novel roles through an unidentified molecular entity. J Physiol Sci. 2009;59:3–21. doi: 10.1007/s12576-008-0008-4. [DOI] [PMC free article] [PubMed] [Google Scholar]
- 21.Liu HT, Toychiev AH, Takahashi N, Sabirov RZ, Okada Y. Maxi-anion channel as a candidate pathway for osmosensitive ATP release from mouse astrocytes in primary culture. Cell Res. 2008;18:558–565. doi: 10.1038/cr.2008.49. [DOI] [PubMed] [Google Scholar]
- 22.De Pinto V, Messina A, Lane DJR, Lawen A. Voltage-dependent anion-selective channel (VDAC) in the plasma membrane. FEBS Lett. 2010;584:1793–1799. doi: 10.1016/j.febslet.2010.02.049. [DOI] [PubMed] [Google Scholar]
- 23.Sabirov RZ, Sheiko T, Liu H, Deng D, Okada Y, Craigen WJ. Genetic demonstration that the plasma membrane maxianion channel and voltage-dependent anion channels are unrelated proteins. J Biol Chem. 2006;281:1897–1904. doi: 10.1074/jbc.M509482200. [DOI] [PubMed] [Google Scholar]
- 24.Suadicani SO, Cherkas PS, Zuckerman J, Smith DN, Spray DC, Hanani M. Bidirectional calcium signaling between satellite glial cells and neurons in cultured mouse trigeminal ganglia. Neuron Glia Biol. 2010;6:43–51. doi: 10.1017/S1740925X09990408. [DOI] [PMC free article] [PubMed] [Google Scholar]
- 25.Fields RD, Yu C, Neale EA, Nelson PG. Practical Electrophysiological Methods. Wiley; New York: 1992. chap. 2.9. [Google Scholar]
- 26.Li M, Jia M, Fields RD, Nelson PG. Modulation of calcium currents by electrical activity. J Neurophysiol. 1996;76:2595–2607. doi: 10.1152/jn.1996.76.4.2595. [DOI] [PubMed] [Google Scholar]
- 27.Fields RD. White matter in learning, cognition and psychiatric disorders. Trends Neurosci. 2008;31:361–370. doi: 10.1016/j.tins.2008.04.001. [DOI] [PMC free article] [PubMed] [Google Scholar]
- 28.Abbott BC, Hill AV, Howarth JV. The positive and negative heat production associated with a nerve impulse. Proc R Soc Lond B Biol Sci. 1958;148:149–187. doi: 10.1098/rspb.1958.0012. [DOI] [PubMed] [Google Scholar]
- 29.Tasaki I, Nakaye T. Heat generated by the dark-adapted squid retina in response to light pulses. Science. 1985;227:654–655. doi: 10.1126/science.3969556. [DOI] [PubMed] [Google Scholar]
- 30.Iwasa K, Tasaki I, Gibbons RC. Swelling of nerve fibers associated with action potentials. Science. 1980;210:338–339. doi: 10.1126/science.7423196. [DOI] [PubMed] [Google Scholar]
- 31.Hill DK. The volume change resulting from stimulation of a giant nerve fibre. J Physiol. 1950;111:304–327. doi: 10.1113/jphysiol.1950.sp004481. [DOI] [PMC free article] [PubMed] [Google Scholar]
- 32.Sandlin R, Lerman L, Barry W, Tasaki I. Application of laser interferometry to physiological studies of excitable tissues. Nature. 1968;217:575–576. doi: 10.1038/217575b0. [DOI] [PubMed] [Google Scholar]
- 33.Hill BC, Schubert ED, Nokes MA, Michelson RP. Laser interferometer measurement of changes in crayfish axon diameter concurrent with action potential. Science. 1977;196:426–428. doi: 10.1126/science.850785. [DOI] [PubMed] [Google Scholar]
- 34.Kim GH, Kosterin P, Obaid AL, Salzberg BM. A mechanical spike accompanies the action potential in mammalian nerve terminals. Biophys J. 2007;92:3122–3129. doi: 10.1529/biophysj.106.103754. [DOI] [PMC free article] [PubMed] [Google Scholar]
- 35.Cohen LB, Keynes RD. Evidence for structural changes during the action potential in nerves from the walking legs of Maia squinado. J Physiol. 1968;194:85–86P. [PubMed] [Google Scholar]
- 36.Hill DK, Keynes RD. Opacity changes in stimulated nerve. J Physiol. 1949;108:278–281. [PubMed] [Google Scholar]
- 37.Salzberg BM, Obaid AL, Gainer H. Large and rapid changes in light scattering accompany secretion by nerve terminals in the mammalian neurohypophysis. J Gen Physiol. 1985;86:395–411. doi: 10.1085/jgp.86.3.395. [DOI] [PMC free article] [PubMed] [Google Scholar]
- 38.Tasaki I. Rapid structural changes in nerve fibers and cells associated with their excitation processes. Jpn J Physiol. 1999;49:125–138. doi: 10.2170/jjphysiol.49.125. [DOI] [PubMed] [Google Scholar]
- 39.Haller M, Mironov SL, Richter DW. Intrinsic optical signals in respiratory brain stem regions of mice: Neurotransmitters, neuromodulators, and metabolic stress. J Neurophysiol. 2001;86:412–421. doi: 10.1152/jn.2001.86.1.412. [DOI] [PubMed] [Google Scholar]
- 40.Wang Z, Haydon PG, Yeung ES. Direct observation of calcium-independent intercellular ATP signaling in astrocytes. Anal Chem. 2000;72:2001–2007. doi: 10.1021/ac9912146. [DOI] [PubMed] [Google Scholar]
- 41.Ritter AM, Ritchie C, Martin WJ. Relationship between the firing frequency of injured peripheral neurons and inhibition of firing by sodium channel blockers. J Pain. 2007;8:287–295. doi: 10.1016/j.jpain.2006.09.002. [DOI] [PubMed] [Google Scholar]
- 42.Kriegler S, Chiu SY. Calcium signaling of glial cells along mammalian axons. J Neurosci. 1993;13:4229–4245. doi: 10.1523/JNEUROSCI.13-10-04229.1993. [DOI] [PMC free article] [PubMed] [Google Scholar]
- 43.Butt AM. Neurotransmitter-mediated calcium signalling in oligodendrocyte physiology and pathology. Glia. 2006;54:666–675. doi: 10.1002/glia.20424. [DOI] [PubMed] [Google Scholar]
- 44.Araque A, Li N, Doyle RT, Haydon PG. SNARE protein-dependent glutamate release from astrocytes. J Neurosci. 2000;20:666–673. doi: 10.1523/JNEUROSCI.20-02-00666.2000. [DOI] [PMC free article] [PubMed] [Google Scholar]
- 45.Welch MJ, Purkiss JR, Foster KA. Sensitivity of embryonic rat dorsal root ganglia neurons to Clostridium botulinum neurotoxins. Toxicon. 2000;38:245–258. doi: 10.1016/s0041-0101(99)00153-1. [DOI] [PubMed] [Google Scholar]
- 46.Biwersi J, Verkman AS. Cell-permeable fluorescent indicator for cytosolic chloride. Biochemistry. 1991;30:7879–7883. doi: 10.1021/bi00246a001. [DOI] [PubMed] [Google Scholar]
- 47.Tasaki I, Byrne PM. Mechanical changes in the amphibian spinal cord produced by afferent volleys of nerve impulses. Brain Res. 1984;301:265–272. doi: 10.1016/0006-8993(84)91095-3. [DOI] [PubMed] [Google Scholar]
- 48.Tasaki I, Byrne PM. Swelling of frog dorsal root ganglion and spinal cord produced by afferent volley of impulses. Brain Res. 1983;272:360–363. doi: 10.1016/0006-8993(83)90584-x. [DOI] [PubMed] [Google Scholar]
- 49.Tasaki I, Byrne PM. Large mechanical changes in the bullfrog olfactory bulb evoked by afferent fiber stimulation. Brain Res. 1988;475:173–176. doi: 10.1016/0006-8993(88)90214-4. [DOI] [PubMed] [Google Scholar]
- 50.Tasaki I, Byrne PM. Rapid mechanical changes in the amphibian retina evoked by brief light pulses. Biochem Biophys Res Commun. 1987;143:93–97. doi: 10.1016/0006-291x(87)90634-6. [DOI] [PubMed] [Google Scholar]
- 51.Fan HT, Morishima S, Kida H, Okada Y. Phloretin differentially inhibits volume-sensitive and cyclic AMP-activated, but not Ca-activated Cl− channels. Br J Pharmacol. 2001;133:1096–1106. doi: 10.1038/sj.bjp.0704159. [DOI] [PMC free article] [PubMed] [Google Scholar]
- 52.Takano T, Kang J, Jaiswal JK, Simon SM, Lin JHC, Uy Y, Li Y, Yang J, Dienel G, Zielke HR, Nedergaard M. Receptor-mediated glutamate release from volume sensitive channels in astrocytes. Proc Natl Acad Sci USA. 2005;102:16466–16471. doi: 10.1073/pnas.0506382102. [DOI] [PMC free article] [PubMed] [Google Scholar]
- 53.Mongin AA, Kimelberg HK. ATP potently modulates anion channel-mediated excitatory amino acid release from cultured astrocytes. Am J Physiol Cell Physiol. 2002;283:C569–C578. doi: 10.1152/ajpcell.00438.2001. [DOI] [PubMed] [Google Scholar]
- 54.Liu HT, Tashmukhamedov BA, Inoue H, Okada Y, Sabirov RZ. Roles of two types of anion channels in glutamate release from mouse astrocytes under ischemic or osmotic stress. Glia. 2006;54:343–357. doi: 10.1002/glia.20400. [DOI] [PubMed] [Google Scholar]
- 55.Abdullaev IF, Rudkouskaya A, Schools GP, Kimelberg HK, Mongin AA. Pharmacological comparison of swelling-activated excitatory amino acid release and Cl− currents in cultured rat astrocytes. J Physiol. 2006;572:677–689. doi: 10.1113/jphysiol.2005.103820. [DOI] [PMC free article] [PubMed] [Google Scholar]
- 56.Scholz J, Klein MC, Behrens TEJ, Johansen-Berg H. Training induces changes in white-matter architecture. Nat Neurosci. 2009;12:1370–1371. doi: 10.1038/nn.2412. [DOI] [PMC free article] [PubMed] [Google Scholar]
- 57.Carreiras M, Seghier ML, Baquero S, Estévez A, Lozano A, Devlin JT, Price CJ. An anatomical signature for literacy. Nature. 2009;461:983–986. doi: 10.1038/nature08461. [DOI] [PubMed] [Google Scholar]
- 58.Markham JA, Greenough WT. Experience-driven brain plasticity: Beyond the synapse. Neuron Glia Biol. 2004;1:351–363. doi: 10.1017/s1740925x05000219. [DOI] [PMC free article] [PubMed] [Google Scholar]
- 59.Bullock TH, Bennett MVL, Johnston D, Josephson R, Marder E, Fields RD. The neuron doctrine, redux. Science. 2005;310:791–793. doi: 10.1126/science.1114394. [DOI] [PubMed] [Google Scholar]
- 60.Liu HT, Akita T, Shimizu T, Sabirov RZ, Okada Y. Bradykinin-induced astrocyte-neuron signalling: Glutamate release is mediated by ROS-activated volume-sensitive outwardly rectifying anion channels. J Physiol. 2009;587:2197–2209. doi: 10.1113/jphysiol.2008.165084. [DOI] [PMC free article] [PubMed] [Google Scholar]
- 61.Li T, Quan Lan J, Fredholm BB, Simon RP, Boison D. Adenosine dysfunction in astrogliosis: Cause for seizure generation? Neuron Glia Biol. 2007;3:353–366. doi: 10.1017/S1740925X0800015X. [DOI] [PMC free article] [PubMed] [Google Scholar]
- 62.Parkerson KA, Sontheimer H. Biophysical and pharmacological characterization of hypotonically activated chloride currents in cortical astrocytes. Glia. 2004;46:419–436. doi: 10.1002/glia.10361. [DOI] [PMC free article] [PubMed] [Google Scholar]
- 63.Kulka M, Schwingshackl A, Befus AD. Mast cells express chloride channels of the ClC family. Inflamm Res. 2002;51:451–456. doi: 10.1007/pl00012411. [DOI] [PubMed] [Google Scholar]
- 64.Enz R, Ross BJ, Cutting GR. Expression of the voltage-gated chloride channel ClC-2 in rod bipolar cells of the rat retina. J Neurosci. 1999;19:9841–9847. doi: 10.1523/JNEUROSCI.19-22-09841.1999. [DOI] [PMC free article] [PubMed] [Google Scholar]
- 65.Huber S, Braun G, Burger-Kentischer A, Reinhart B, Luckow B, Horster M. CFTR mRNA and its truncated splice variant (TRN-CFTR) are differentially expressed during collecting duct ontogeny. FEBS Lett. 1998;423:362–366. doi: 10.1016/s0014-5793(98)00112-4. [DOI] [PubMed] [Google Scholar]
- 66.Brès V, Hurbin A, Duvoid A, Orcel H, Moos FC, Rabié A, Hussy N. Pharmacological characterization of volume-sensitive, taurine permeable anion channels in rate supraoptic glial cells. Br J Pharmacol. 2000;130:1976–1982. doi: 10.1038/sj.bjp.0703492. [DOI] [PMC free article] [PubMed] [Google Scholar]
- 67.Duan S, Anderson CM, Keung EC, Chen Y, Chen Y, Swanson RA. P2X7 receptor-mediated release of excitatory amino acids from astrocytes. J Neurosci. 2003;23:1320–1328. doi: 10.1523/JNEUROSCI.23-04-01320.2003. [DOI] [PMC free article] [PubMed] [Google Scholar]
Associated Data
This section collects any data citations, data availability statements, or supplementary materials included in this article.
Supplementary Materials
Fig. S1. Absence of functional gap junction hemichannels in DRG neurons and positive controls.
Table S1. Guide to chloride channels with emphasis on those implicated in release of ATP and small amino acids during cell volume regulation.