Abstract
To ensure cell-based assays are performed properly, both cell concentration and viability have to be determined so that the data can be normalized to generate meaningful and comparable results. Cell-based assays performed in immuno-oncology, toxicology, or bioprocessing research often require measuring of multiple samples and conditions, thus the current automated cell counter that uses single disposable counting slides is not practical for high-throughput screening assays. In the recent years, a plate-based image cytometry system has been developed for high-throughput biomolecular screening assays. In this work, we demonstrate a high-throughput AO/PI-based cell concentration and viability method using the Celigo image cytometer. First, we validate the method by comparing directly to Cellometer automated cell counter. Next, cell concentration dynamic range, viability dynamic range, and consistency are determined. The high-throughput AO/PI method described here allows for 96-well to 384-well plate samples to be analyzed in less than 7 min, which greatly reduces the time required for the single sample-based automated cell counter. In addition, this method can improve the efficiency for high-throughput screening assays, where multiple cell counts and viability measurements are needed prior to performing assays such as flow cytometry, ELISA, or simply plating cells for cell culture.
Keywords: Image cytometry, High-throughput, Screening assay, Viability, Concentration, Acridine orange, Propidium iodide, Celigo
Introduction
Cell concentration and viability are two simple yet important parameters to measure when working with cell-based research such as immuno-oncology, toxicology, and bioprocessing (Ongena et al. 2010; Chan et al. 2011a, b; 2012b). Assays from standard cell culture, plating cells for ELISA, to preparing cells for flow cytometric analysis, all require accurate measurements of cell concentration and viability in order to generate meaningful and comparable results (Chan et al. 2013). Traditionally, cell concentration and viability have been measured by manual counting trypan blue-stained cell sample on a hemacytometer. However, this method is time-consuming and has high operator-dependent variation.
In the recent years, numerous fluorescent image-based automated cell counters have emerged in the market for simple cell concentration and viability measurement such as Countess II (ThermoFisher Scientific) (Han et al. 2015; Roma et al. 2015), LUNA (Logos Biosystems) (Duong et al. 2012; Kang et al. 2012), and Cellometer (Nexcelom Bioscience) (Ranguelova et al. 2013; Jain et al. 2015). In general, these image cytometry instruments utilize disposable counting chambers filled with fluorescently stained cells for single sample counting. Although the automated cell counters have increased efficiency for cell-based assays, single use disposable counting chambers remain time-consuming for counting multiple samples simultaneously. Specifically, Cellometer has been used with acridine orange (AO) and propidium iodide (PI) fluorescence detection for direct cell counting and viability measurement (Chan et al. 2012a, 2014), where the system has been validated through comparison to flow cytometry in many publications (Kuksin et al. 2016). Sample preparation, image acquisition, and analysis takes approximately 1.5 min to obtain results, and therefore the total required time to image and obtain results significantly increases to more than 2 h for 96 samples. Since many of the assays described previously often times require multiple samples and conditions for performing an experiment, the single use automated cell counters are not practical for higher throughput biomolecular screening assays.
Recently, a plate-based image cytometry system, Celigo, has been developed for high-throughput cell-based assays (Nabzdyk et al. 2011; Vinci et al. 2012). The optics of the Celigo system are designed using the F-Theta lens and large uniform bright-field illumination to generate uniform whole well bright-field and fluorescent images for analysis. In addition, the system also utilizes galvanometer mirrors that can rapidly capture multiple images across the plate with minimal stage movement.
In this work, we demonstrate a high-throughput AO/PI-based cell concentration and viability method using the Celigo image cytometer. AO is a membrane permeable nuclear dye that stains both live and dead cells green, while PI is a membrane impermeable nuclear dye that stains dead cells red. When dead cells contained both AO and PI, fluorescence resonance energy transfer (FRET) occurred, where AO emission was absorbed by PI molecules, thus only live cells fluoresced green. First, we validated the method by comparing directly to Cellometer automated cell counter. Next, cell concentration and viability dynamic range were determined. Finally, concentration and viability consistency were determined. The high-throughput AO/PI method described here allows 96–384 samples to be analyzed in less than 7 min, which greatly reduces the total time required for imaging and analysis of a large number of samples. In addition, this method can improve the efficiency for high-throughput screening assays, where multiple cell counts and viability measurements are needed prior to performing the assay.
Materials and methods
Celigo image cytometer instrumentation and software
The Celigo image cytometer (Nexcelom Bioscience, Lawrence, MA, USA) has been used in various cell-based assays in previous publications (Feng et al. 2011; Vinci et al. 2012), which utilized a transmission and epifluorescence optical setup for one bright-field (BF) and three fluorescent (FL) imaging channels (blue, green, red, and far red) to perform plate-based image cytometric analysis. Both BF and FL imaging channels utilize high power light-emitting diode (LED) for illumination and excitation. Each FL imaging channel used a specific fluorescent filter set for the corresponding colors: blue (EX 377/50 nm, EM 470/22 nm), green (EX 483/32 nm, EM 536/40 nm), red (EX 531/40 nm, EM 629/53 nm), and far red (EX 628/40 nm, EM 688/31 nm). The green and red channels are used to detect AO and PI, respectively. The exposure times for AO and PI are 7000 and 5000 µs, respectively.
The combined optics and digital imaging allowed variable imaging resolutions from 1 to 8 µm2/pixel. The proprietary optics setup can capture highly uniform image of the entire well on a standard microplate. In addition, the F-Theta lens and Galvanometric mirrors allowed rapid image capturing process, where 96 whole well images can be captured in less than 4 min for bright-field imaging. The motion stage would move to the center of each well, and rapidly capture 16 images using the Galvanometric mirrors. This process allowed minimum movement of the plate holder stage, thus reducing the time required to scan the entire plate and reducing the perturbation of the samples. Cells that are seeded in standard microplates (6, 12, 24, 48, 96, 384, and 1536-well) can be auto-focused using the Celigo software. Two focus mechanisms can be applied: Image-Based Auto-Focus (IBAF) uses a software algorithm to step upward and downward in the Z-axis to determine the best focus for each well. Hardware-Based Auto-Focus (HBAF) measures the distance between two beams indicating the thickness of the bottom plastic film, and the measured distanced is applied to each well to focus. In this work, Greiner 96-well microplates were used due to their consistency and flatness across the well and plate.
The Celigo software consisted of five major sections: START, SCAN, ANALYZE, GATE, and RESULTS. The START section allows users to select the type of microplates to use in the experiment, as well as entering the general information about the experiment. The SCAN section allows users to setup imaging and scanning parameters for the microplate, such as imaging channels and areas to scan on the plate. The ANALYZE section allows the users to setup image analysis parameters to count the cells of interest in the plate. The GATE section allows users to graph histogram and scatter plot of data analyzed from the captured images, and perform flow-like gating process. Finally, the RESULTS section allows the users to view counting results, export data to excel, as well as whole-well stitched images.
Cellometer image cytometer instrumentation and disposable counting chamber
The Cellometer Vision instrumentation (Nexcelom Bioscinece) has been described previously (Chan et al. 2012a, 2013, 2014). The system utilizes a transmission and epifluorescence optical setup for one BF and two FL channels to perform image-based cytometric analysis. BF imaging uses a broadband white LED and fluorescence imaging used two different monochromatic LEDs (470 and 527 nm) as the excitation light sources. Each monochromatic excitation is paired with a specific excitation (nm)/emission (nm) filter set, VB-535-402 (EX 475/40 nm, EM 535/40 nm) and VB-660-502 (EX 540/30 nm, EM 660/40 nm) for the detection of acridine orange (AO) and propidium iodide (PI). The exposure times for AO and PI are 300 and 4000 ms, respectively.
The AO/PI-stained target cell samples are pipetted into the Nexcelom disposable counting chamber, which holds precisely 20 µl of samples. An automated stage moves the counting chamber linearly to 4 locations for BF and FL imaging and analysis, upon imaging the target cells are identified and counted by the software to calculate concentration and viability. The system has a concentration dynamic range of 1 × 10⁵ – 7 × 10⁷ cells/ml, which correlates to *10–10,000 counted cells.
Jurkat cell preparation and AO/PI staining protocol
The Jurkat cell line (TIB-152, ATCC, Manassa, VA, USA) were cultured in RPMI 1640 medium with 10 % FBS, and 1 % pen/strep and maintained at 37 °C and 5 % CO2. All reagents used were purchased from Thermo Scientific (Waltham, MA, USA).
The Jurkat cells are stained with AO and PI to determine live cell concentration and viability. For Cellometer, the AO/PI staining solution (Nexcelom Bioscience, Lawrence, MA) was mixed 1:1 with the Jurkat sample (20 µl:20 µl), immediately pipetted into the disposable counting chamber, and then analyzed in the Cellometer. For Celigo, the AO/PI staining solution was diluted 10× in PBS and 180 µl was pipetted into each well on a 96-well microplate (Greiner 655090). Next, 20 µl of Jurkat cells were added to each well with AO/PI. The 96-well microplate was centrifuged and immediately scanned and analyzed in the Celigo.
Validation of the Celigo high-throughput concentration and viability detection method
In order to validate the Celigo high-throughput concentration and viability detection method, two Jurkat cell cultures were collected at high and low concentrations. Jurkat cells at different concentrations were stained with AO/PI following the Cellometer and Celigo staining protocol described above for comparison. Live cell concentrations of 20 Jurkat samples in disposable counting chambers or 96-well plate were analyzed on Cellometer and Celigo, respectively. The live cell concentration and viability results were immediately generated and displayed from the completed Cellometer counts. Celigo cell counts per well were exported to excel, where cell concentrations were calculated by dividing the total number of counted cells by 0.02 ml (volume of cells pipetted per well), cell viability was calculated by dividing live cell count (AO count) by total cell count (AO + PI count). A 2 t test was also calculated in excel to determine the p value and statistically compare Celigo and Cellometer results.
Consistency of the Celigo concentration and viability detection method
In order to demonstrate the consistency of the Celigo high-throughput method, a 96-well plate of Jurkat cells stained with AO/PI was scanned and analyzed using Celigo. The live and dead cell count data were exported to an excel template for direct concentration and viability calculation. The average, standard deviation, and coefficient of variation of cell count, concentration, and viability were also calculated in excel.
Linearity of the Celigo concentration and viability detection method
In order to measure the linearity of the Celigo high-throughput method, both concentration and viability series of Jurkat cells were measured on Celigo. For concentration linearity, a flask of Jurkat cell culture was collected and the concentration was measured on the Cellometer. Next, the cell sample was centrifuged and resuspended in PBS to produce an initial working concentration of 3.6 × 10⁶ cells/ml. The concentrated cell sample was serially diluted by 2× to generate 12 different concentrations of Jurkat cells from 4 × 10⁶ to 2 × 10³ cells/ml. After preparing the different cell concentration samples, 180 µl of 10× diluted AO/PI staining solution was pipetted into each well on a 96-well microplate, and 20 µl of Jurkat cells at each concentration was transferred into column 1–12. The microplate was immediately analyzed using the Celigo.
For viability linearity, Jurkat cell sample was prepared at a concentration of 5 × 10⁵ cells/ml in 10 ml. Half of the cells was heat-killed by boiling for 15 min and then mixed with the healthy sample to artificially generate Jurkat cell sample at 0, 25, 50, 75, and 100 % viability. After preparing the different cell viability samples, 180 µl of 10× diluted AO/PI staining solution was pipetted into each well on a 96-well microplate, and 20 µl of Jurkat cells at each viability was transferred into column 1–6. The microplate was immediately analyzed using the Celigo.
Results and discussion
Cellometer and Celigo concentration and viability comparison results
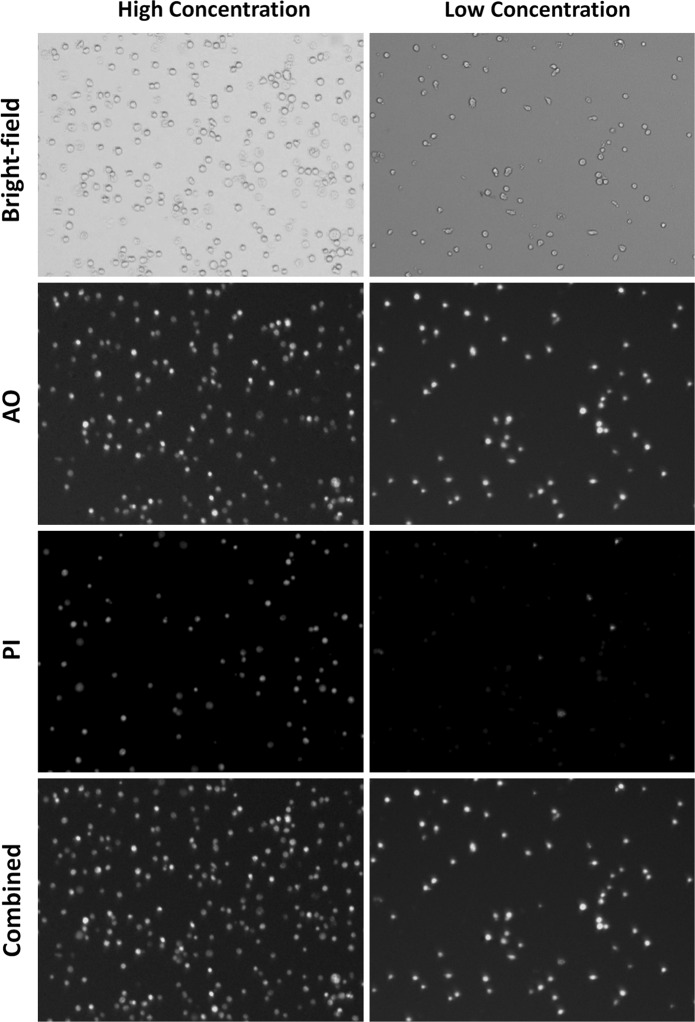
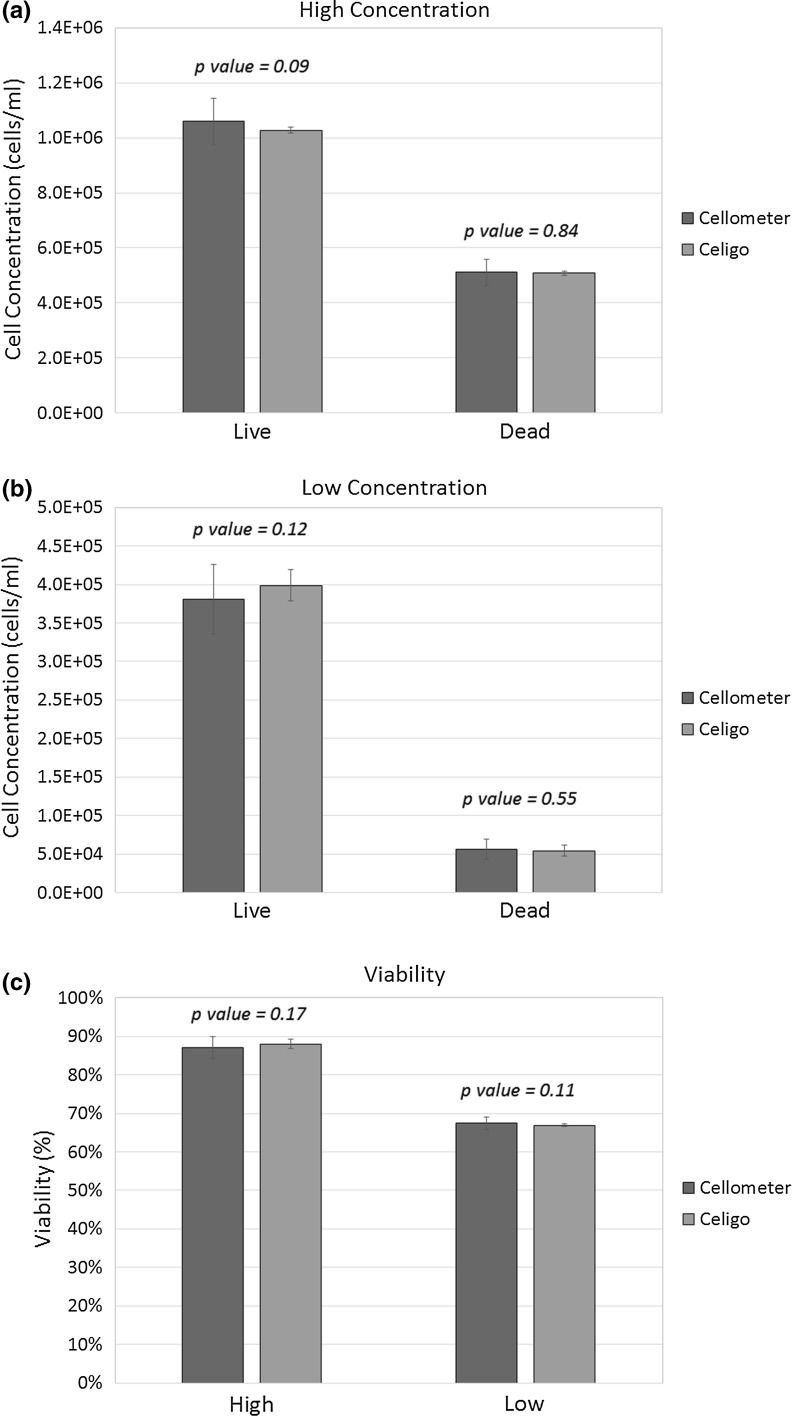
The bright-field and fluorescent images captured using Celigo are shown in Fig. 1. In order to validate the Celigo high-throughput cell counting and viability method, high and low concentrations of Jurkat cells were measured on Cellometer and Celigo using AO/PI. The concentration and viability comparison results are graphed in Fig. 2. The high and low concentration comparison showed comparable results between Cellometer and Celigo. The numerical results are shown in Table 1, where p values for concentration and viability of each sample are greater than 0.05, which indicates that they are statistically the same. Importantly, the results generated using Celigo showed lower standard deviation in comparison to Cellometer due to the fact that the entire microplate was analyzed at the same time, using the same cell parameters, thus improving the statistical significance of each cell count. In addition, the image capture and analysis times for Cellometer and Celigo were approximately 60 and 3 min for 20 Jurkat samples, respectively, validating that Celigo greatly increased the throughput for cell counting.
Fig. 1.
Bright-field and fluorescent images captured on Celigo image cytometer. The bright-field images showed outlines of Jurkat cells in the wells. The AO (pseudo-color green) and PI (pseudo-color red) fluorescent images showed more cells in the high concentration samples for both AO and PI positive Jurkat cells. The combined image showed that there was minimum optical cross-talk between the AO and PI fluorescence. (Color figure online)
Fig. 2.
Comparison of Jurkat cell concentration and viability measurement for high and low concentration samples between Cellometer and Celigo image cytometers. a High and b low Jurkat cell concentration results showing comparable measurement between the two systems. It is important to note that the error bars for Celigo are much lower than those for Cellometer due to the fact that Celigo analyzes a larger number of cell samples. c Viability comparison also showed comparable results and smaller error for Celigo. The calculated p values was greater than 0.05 for all the comparison results indicating that they are statistically the same. (Color figure online)
Table 1.
Comparison of numerical results between Cellometer and Celigo image cytometers
| Cellometer | Celigo | p value | |||
|---|---|---|---|---|---|
| AVE | STD | AVE | STD | ||
| High | |||||
| Live | 1.06E+06 | 8.44E+04 | 1.03E+06 | 5.09E+05 | 0.09 |
| Dead | 5.11E+05 | 4.74E+04 | 1.07E+04 | 7.60E+03 | 0.84 |
| Viability | 67.5 % | 1.6 % | 66.9 % | 0.4 % | 0.11 |
| Low | |||||
| Live | 3.81E+05 | 4.48E+04 | 3.99E+05 | 2.05E+04 | 0.12 |
| Dead | 5.65E+04 | 1.32E+04 | 5.44E+04 | 7.12E+03 | 0.55 |
| Viability | 87.1 % | 2.8 % | 88.0 % | 1.2 % | 0.17 |
Consistency results of the Celigo high-throughput detection method
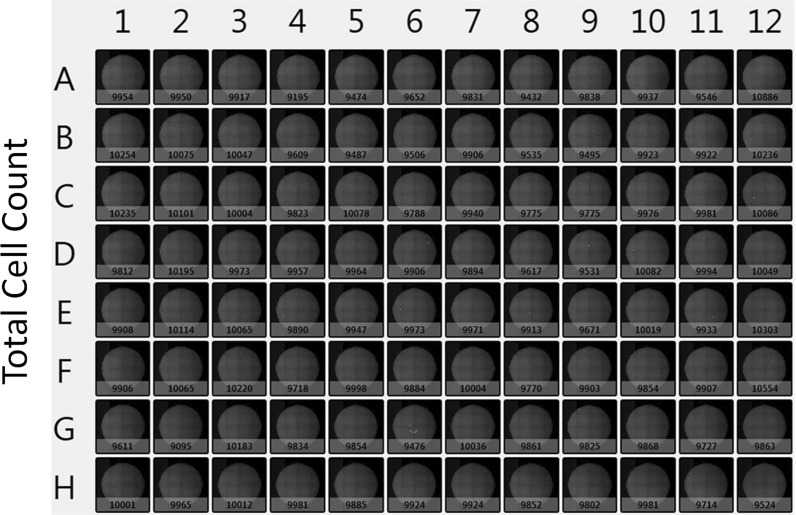
In this experiment, we characterized the Celigo high-throughput cell counting method by determining the consistency of the whole plate measurement, as well as concentration and viability linearity range. The whole plate cell count and viability results are shown in Fig. 3, which were directly obtained from the Celigo software. These results were exported to excel to calculate the coefficient of variation (CV) of live cell count and viability. The average live cell count was 9565 ± 237 and the CV is 2.5 %. The average viability is 96.1 ± 0.4 % and the CV is 0.4 %. The results showed highly consistent data from the whole plate of cell counting, which can further improve statistical analysis of multi-sample experiments.
Fig. 3.
An example of whole plate total cell counting results directly obtained from the Celigo software. The results are exported directly to excel and the data are analyzed according to the assay requirement
Dynamic range and linearity results of the Celigo high-throughput detection method
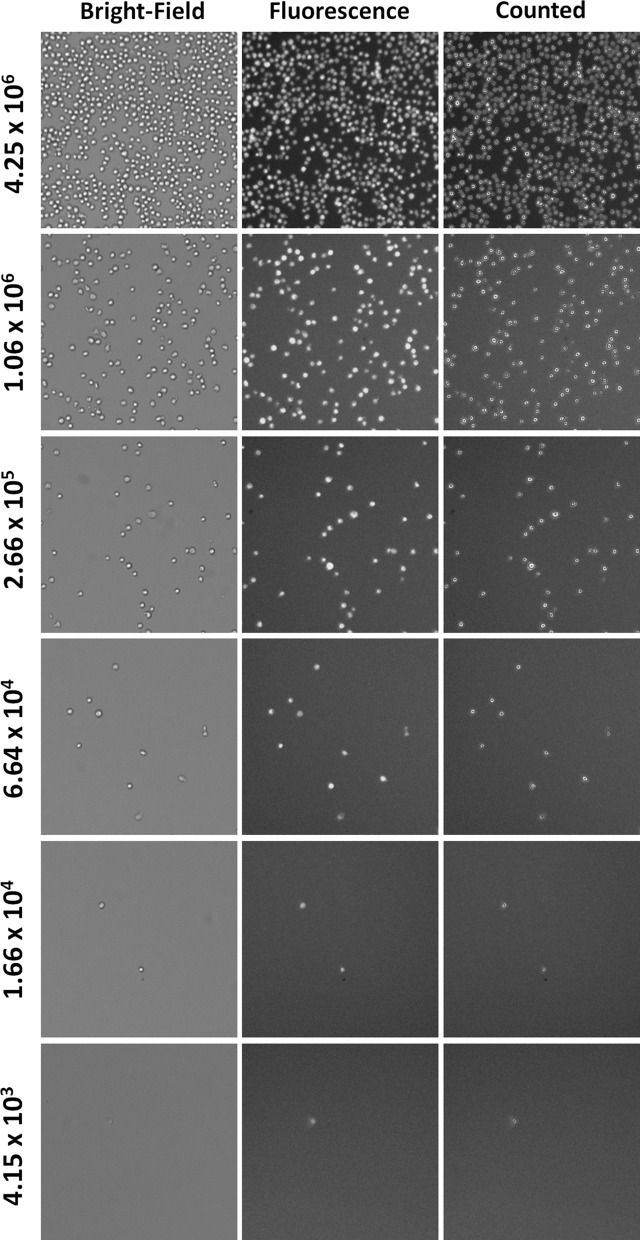
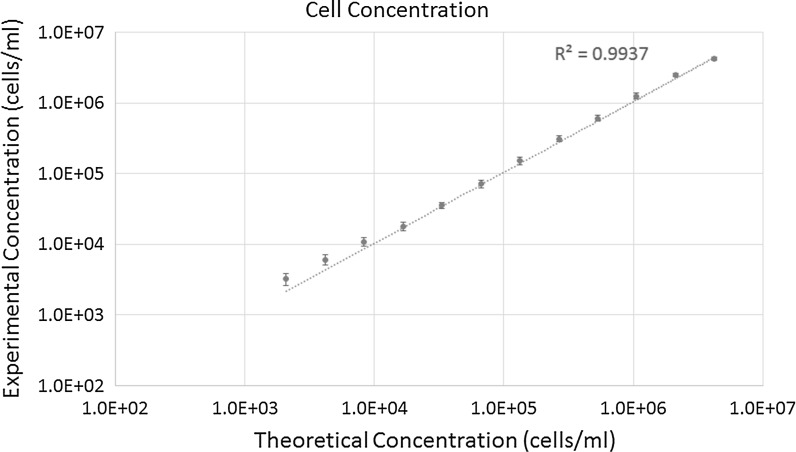
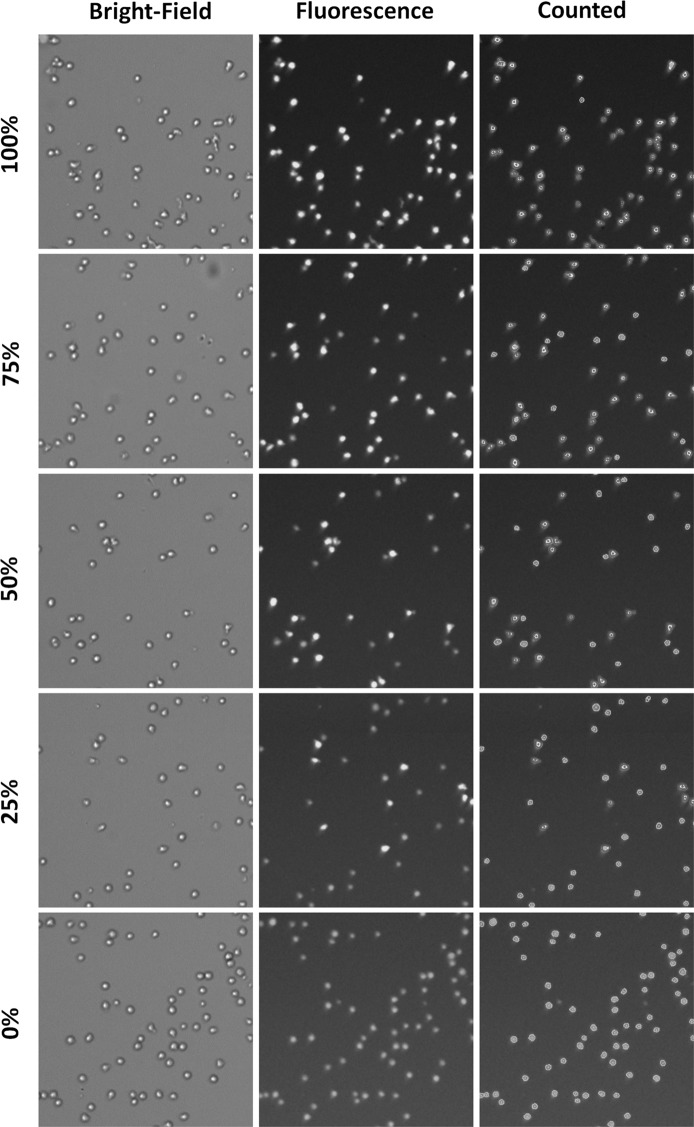
The bright-field and fluorescent images of AO stained Jurkat cells are shown in Fig. 4. The images showed decreasing cell number as concentration decreased. The linearity range graph for cell concentration is shown in Fig. 5. The results showed that the maximum concentration was 4.25 × 10⁶ cells/ml, while minimum concentration was 3.23 × 10³ cells/ml. However, since the Celigo images and analyzes the entire well, a single cell may be imaged and detected. In comparison to the theoretical values, the R2 value of 0.9937 indicates that they are highly linearly correlated. The bright-field and combined AO/PI fluorescent images of Jurkat cells at different viability percentages are shown in Fig. 6. The images showed decreasing AO positive cells and increasing PI positive cells as the viability decreased. It is important to note that in this experiment, we pipetted 20 µl into each well, however, when the volume of cells pipetted in was decreased by 2 or 4 times, then the upper concentration can increase correspondingly to 8.50 × 10⁶ or 1.70 × 10⁷ cells/ml.
Fig. 4.
Bright-field and fluorescent images of AO stained Jurkat cells at different concentrations. Serial dilutions of Jurkat cells were stained with AO to generate concentration linearity plot. The images showed decreasing cell numbers as the concentration decreased. In addition, the purple outline of the Jurkat cells indicated that these cells were counted by the software. Even at very low concentration when only a few cells were present, the Celigo software was able to count each AO or PI positive cell. (Color figure online)
Fig. 5.
The concentration linearity graph shows a R2 value of 0.9937, which indicates high correlation between the calculated theoretical values and experimental results
Fig. 6.
Bright-field and combined images of AO/PI stained Jurkat cells at different viability percentages. Different viability percentages were generated by mixing live and heat-killed Jurkat cells to create a viability linearity plot. The images show decreasing AO positive cells and increasing PI positive cells as the viability decreased. In addition, the purple and blue outlines of the live and dead Jurkat cells, respectively, indicated that these cells were counted by the software. (Color figure online)
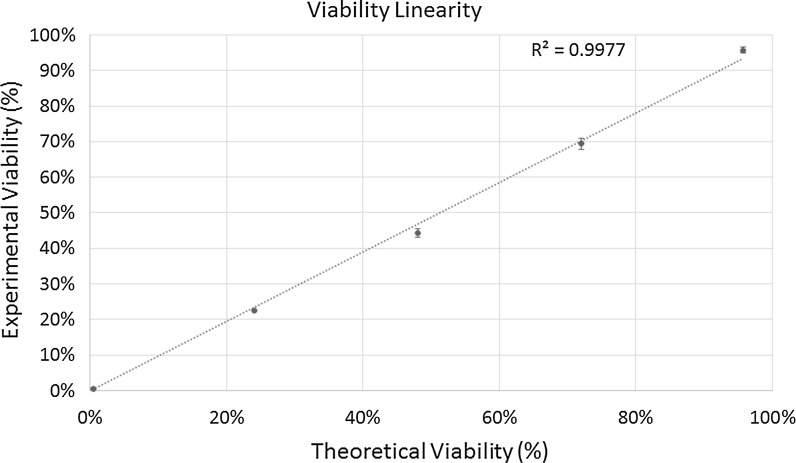
The linearity range graph for cell viability is shown in Fig. 7. The results showed strong correlation between experimental and theoretical viability values, generating a R2 value of 0.9977. It is also important to note that the high-throughput AO/PI method can measure viability percentages from 0 to 100 %. The Celigo image cytometer can generate accurate and consistent cell concentration and viability measurements by increasing the number of cells counted per sample, which increases the dynamic range of the system.
Fig. 7.
The viability linearity graph shows a R2 value of 0.9977, which indicates high correlation between the calculated theoretical values and experimental results
Conclusion
In conclusion, we have demonstrated a plate-based high-throughput cell count and AO/PI viability detection method using the Celigo image cytometer. The method was validated against the Cellometer automated cell counter, which utilizes single use disposable counting chambers. Currently, Cellometer has been validated against manual counting as well as flow cytometry. Therefore, by comparing Celigo to Cellometer, the comparison showed highly accurate results (Chan et al. 2011a, 2014; Kuksin et al. 2016). In addition, Celigo image cytometer has been utilized in several publications for direct cell counting and cytotoxicity measurement, thus confirming the use of the system for viability detection (Hansen et al. 2015; Mazor et al. 2016; Riedl et al. 2016). The method was further characterized by determining the consistency and dynamic range for cell concentration and viability measurement, which showed highly consistent results and improved dynamic range. The ability to analyze samples in a plate format reduced the assay time significantly from 60 to 3 min for 20 samples, which greatly increased throughput. The proposed method can be used for assays involving cytotoxicity measurement for cancer research, simple cell counting for ELISA plating, for flow cytometry assays, or quality assurance for bioprocessing samples. These types of assays often require multiple samples, which can fully utilize the advantages of the Celigo image cytometry method.
Compliance with ethical standards
Conflict of interest
The authors, LLC, TS, KK, DK, SK, OD, SC, NL, and JQ declare competing financial interests. The work performed in this manuscript is for reporting on product performance of Nexcelom Bioscience, LLC. The performed experiments were to demonstrate novel high-throughput screening method for cell concentration and viability using AO/PI on Celigo image cytometer.
References
- Chan LL, Zhong XM, Qiu J, et al. Cellometer vision as an alternative to flow cytometry for cell cycle analysis, mitochondrial potential, and immunophenotyping. Cytom Part A. 2011;79A:507–517. doi: 10.1002/cyto.a.21071. [DOI] [PubMed] [Google Scholar]
- Chan LLY, Lai N, Wang E, et al. A rapid detection method for apoptosis and necrosis measurement using the Cellometer imaging cytometry. Apoptosis. 2011;16:1295–1303. doi: 10.1007/s10495-011-0651-8. [DOI] [PubMed] [Google Scholar]
- Chan LL, Wilkinson AR, Paradis BD, et al. Rapid image-based cytometry for comparison of fluorescent viability staining methods. J Fluoresc. 2012;22:1301–1311. doi: 10.1007/s10895-012-1072-y. [DOI] [PubMed] [Google Scholar]
- Chan LL, Zhong XM, Pirani A, et al. A novel method for kinetic measurements of rare cell proliferation using Cellometer image-based cytometry. J Immunol Methods. 2012;377:8–14. doi: 10.1016/j.jim.2012.01.006. [DOI] [PubMed] [Google Scholar]
- Chan LLY, Laverty DJ, Smith T, et al. Accurate measurement of peripheral blood mononuclear cell concentration using image cytometry to eliminate RBC-induced counting error. J Immunol Methods. 2013;388:25–32. doi: 10.1016/j.jim.2012.11.010. [DOI] [PubMed] [Google Scholar]
- Chan LL-Y, Kuksin D, Laverty DJ, et al. Morphological observation and analysis using automated image cytometry for the comparison of trypan blue and fluorescence-based viability detection method. Cytotech. 2014 doi: 10.1007/s10616-014-9704-5. [DOI] [PMC free article] [PubMed] [Google Scholar]
- Duong H-Q, Hwang JS, Kim HJ, et al. Aldehyde dehydrogenase 1A1 confers intrinsic and acquired resistance to gemcitabine in human pancreatic adenocarcinoma MIA PaCa-2 cells. Int J Oncol. 2012;41:855–861. doi: 10.3892/ijo.2012.1516. [DOI] [PMC free article] [PubMed] [Google Scholar]
- Feng L, Sun X, Csizmadia E, et al. Vascular CD39/ENTPD1 directly promotes tumor cell growth by scavenging extracellular adenosine triphosphate. Neoplasia. 2011;13:206–216. doi: 10.1593/neo.101332. [DOI] [PMC free article] [PubMed] [Google Scholar]
- Han X, Liu Z, Jo Mc, et al. CRISPR-Cas9 delivery to hard-to-transfect cells via membrane deformation. Sci Adv. 2015;1:1–8. doi: 10.1126/sciadv.1500454. [DOI] [PMC free article] [PubMed] [Google Scholar]
- Hansen HG, Nilsson CN, Lund AM, et al. Versatile microscale screening platform for improving recombinant protein productivity in Chinese hamster ovary cells. Sci Rep. 2015;5:18016. doi: 10.1038/srep18016. [DOI] [PMC free article] [PubMed] [Google Scholar]
- Jain A, Samykutty A, Jackson C, et al. Curcumin inhibits PhIP induced cytotoxicity in breast epithelial cells through multiple molecular targets. Cancer Lett. 2015;365:122–131. doi: 10.1016/j.canlet.2015.05.017. [DOI] [PMC free article] [PubMed] [Google Scholar]
- Kang HJ, Yi YW, Kim HJ, et al. BRCA1 negatively regulates IGF-1 expression through an estrogen-responsive element-like site. Cell Death Dis. 2012;3:2–10. doi: 10.1038/cddis.2012.78. [DOI] [PMC free article] [PubMed] [Google Scholar]
- Kuksin D, Kuksin CA, Qiu J, et al. Cellometer image cytometry as a complementary tool to flow cytometry for verifying gated cell populations. Anal Biochem. 2016;503:1–7. doi: 10.1016/j.ab.2016.03.010. [DOI] [PubMed] [Google Scholar]
- Mazor Y, Yang C, Borrok MJ, et al. Enhancement of immune effector functions by modulating IgG’s intrinsic affinity for target antigen. PLoS ONE. 2016;11:e0157788. doi: 10.1371/journal.pone.0157788. [DOI] [PMC free article] [PubMed] [Google Scholar]
- Nabzdyk CS, Chun M, Pradhan L, et al. High throughput RNAi assay optimization using adherent cell cytometry. J Transl Med. 2011;9:1–9. doi: 10.1186/1479-5876-9-48. [DOI] [PMC free article] [PubMed] [Google Scholar]
- Ongena K, Das C, Smith JL et al (2010) Determining cell number during cell culture using the scepter cell counter. J Vis Exp (45). pii: 2204. doi:10.3791/2204 [DOI] [PMC free article] [PubMed]
- Ranguelova K, Rice AB, Lardinois OM, et al. Sulfite-mediated oxidation of myeloperoxidase to a free radical: immuno-spin trapping detection in human neutrophils. Free Radic Biol Med. 2013;60:98–106. doi: 10.1016/j.freeradbiomed.2013.01.022. [DOI] [PMC free article] [PubMed] [Google Scholar]
- Riedl T, Boxtel Ev, Bosch M, et al. High-throughput screening for internalizing antibodies by homogeneous fluorescence imaging of a pH-activated probe. J Biomol Screen. 2016;21:12–23. doi: 10.1177/1087057115613270. [DOI] [PMC free article] [PubMed] [Google Scholar]
- Roma A, Ovadje P, Steckle M, et al. Selective induction of apoptosis by Azadarichta indica leaf extract by targeting oxidative vulnerabilities in human cancer cells. J Pharm Pharm Sci. 2015;18:729–746. doi: 10.18433/J3VG76. [DOI] [PubMed] [Google Scholar]
- Vinci M, Gowan S, Boxall F, et al. Advances in establishment and analysis of threedimensional tumor spheroid-based functional assays for target validation and drug evaluation. BMC Biol. 2012;10:1–20. doi: 10.1186/1741-7007-10-29. [DOI] [PMC free article] [PubMed] [Google Scholar]


