

Single-molecule approaches offer exquisite sensitivity in space and time along with the ability to observe heterogeneous behavior and actually manipulate macromolecules. In this review, Chen and Larson examine the unique insights that single-molecule techniques have yielded on the mechanisms of gene expression.
Keywords: fluorescence, single molecule, splicing, transcription
Abstract
The production of a single mRNA is the result of many sequential steps, from docking of transcription factors to polymerase initiation, elongation, splicing, and, finally, termination. Much of our knowledge about the fundamentals of RNA synthesis and processing come from ensemble in vitro biochemical measurements. Single-molecule approaches are very much in this same reductionist tradition but offer exquisite sensitivity in space and time along with the ability to observe heterogeneous behavior and actually manipulate macromolecules. These techniques can also be applied in vivo, allowing one to address questions in living cells that were previously restricted to reconstituted systems. In this review, we examine the unique insights that single-molecule techniques have yielded on the mechanisms of gene expression.
Single-molecule experiments are now pervasive in biology. What started out as an experimental approach for characterizing ion channels in the 1970s (Neher and Sakmann 1976) has now become a fixture in hundreds of laboratories addressing fundamental questions in biochemistry, cell biology, genetics, and development. The methodology is nearly as diverse as the problems that are addressed and encompasses imaging, optical tweezers, atomic force microscopy, electrophysiology, and cryo-electron microscopy (cryo-EM), to list a few. The unifying principle behind these approaches is straightforward: the ability to observe the heterogeneous, rare, or fleeting behavior of macromolecules that is normally masked by ensemble techniques. In this review, we focus on the role that single-molecule approaches have played in advancing our understanding of the early steps in gene expression.
In general, transcription by RNA polymerase (RNAP) in bacteria or RNA polymerase II (Pol II) in eukaryotes begins when transcription factors (TFs) are recruited to the promoter. This leads to the assembly of the preinitiation complex (PIC) that contains a semicompetent polymerase. The PIC is necessary for unwinding duplex DNA and setting the stage for processive elongation by the polymerase. After conformational changes in the PIC, the polymerase escapes the promoter region and enters into productive elongation. In eukaryotes, the nascent RNA undergoes further modifications such as addition of a 5′ cap, synthesis of a poly-A tail, and splicing before the mature mRNA is formed. These early steps of gene expression are uniquely suited to elucidation through single-molecule methods. For example, single-molecule experimental approaches allow one to visualize the order of assembly for molecular complexes (i.e., the PIC) and observe the variety of pathways that can result in initiation of RNAP. The ability to observe kinetics in unperturbed systems can provide clues to the mechanisms of transcription. RNAPs can also be manipulated by single-molecule optical trapping to reveal the inner workings of force generation by this enzyme. Furthermore, single-molecule imaging has also revealed the heterogeneity of gene expression that exists among cells in a population, the understanding of which has broad implications for emerging single-cell genomic techniques. Finally, single-molecule approaches seem to be one emerging route for connecting precise in vivo measurements with in vitro experiments of increasing complexity.
Advances in single-molecule biology have been spurred by technological innovations in the physical sciences occurring over decades. As there have been many excellent studies that review the diverse single-molecule techniques like optical tweezers (Greenleaf et al. 2007), fluorescence (Piston and Kremers 2007; Joo et al. 2008; Li and Xie 2011; Liu et al. 2015), and superresolution imaging (Huang et al. 2010; Schermelleh et al. 2010), we refer the reader to these references for technical details. Instead, we chose to focus on the observations that could have been made only with single-molecule techniques and the insights on gene expression that we have gained from them.
TF search dynamics
The first step of transcription occurs when TFs are recruited to the promoter and begin the assembly of the PIC. The classical biochemical model posits a stepwise assembly aided by cooperative interactions, with different subunits associating in ordered sequence (Orphanides and Weinberg 2002). Such a model carries an implicit notion of energy consumption and directionality (Coulon et al. 2013) and opens up many avenues where regulation of initiation can take place. There has been intense interest in understanding how TFs find their way to their targets, particularly because some factors exist in limiting quantities in the nucleus. Early biochemical studies measured an in vitro association rate of 1010 M−1 sec−1 for the Lac repressor on its target DNA (Riggs et al. 1970). This rate was 100 times faster than the collision rate predicted based on simple three-dimensional (3D) diffusion and 1000 times faster than any known protein–protein interactions. To explain the unexpectedly fast search times, theoretical models loosely termed “facilitated diffusion” were proposed, the most popular of which describes proteins colliding with DNA during 3D diffusion in the nucleus, binding nonspecifically, and then “rolling” or “hopping” along the DNA strand until they find their correct promoter targets (Richter and Eigen 1974; Berg and Blomeerg 1976; Berg et al. 1981).
Single-molecule studies, with the unique capability to track individual TF molecules in space and time, have provided most of the evidence for or against facilitated diffusion. Wang et al. (2006) imaged GFP-labeled LacI repressor proteins and found that they bound nonspecifically to tethered DNA templates. The bound LacI molecules were observed to slide along the DNA in a random walk fashion for distances of up to ∼3 µm. Based on measurements of the one-dimensional (1D) diffusion coefficient, the investigators estimated that the LacI repressor could find its target sequence 90 times faster if it used the “bind-and-slide” mechanism in addition to 3D diffusion. Similarly, p53, a protein known to interact with DNA nonspecifically, was also shown to slide on tethered naked λ-phage DNA (Tafvizi et al. 2008), with a velocity that indicated minimal protein–DNA friction or few energetic barriers to sliding. A direct observation of EcoRV interacting nonspecifically with linear DNA showed that, in addition to sliding, EcoRV could hop or jump between sliding events (Bonnet et al. 2008).
If TFs do indeed use a bind-and-slide mechanism to aid in their target search, then we would predict that the length of contiguous DNA available for sliding on should affect the kinetics of target search. In fact, Riggs et al. (1970) had originally discounted the bind-and-slide mechanism because they observed that shearing of DNA by sonication did not affect the rate of Lac finding its target sequence. Other in vitro single-molecule studies have also found that binding of bacteriophage λ repressor CI to its operator DNA (Wang et al. 2009) and Escherichia coli RNAP binding to a promoter sequence (Friedman et al. 2013) both occur with kinetics that are independent of the length of flanking DNA sequence, thus arguing against the model of facilitated diffusion. In contrast, it was also observed that binding times of Sox2 to nonspecific DNA templates increased with the length of the template (Chen et al. 2014).
Another prediction of the bind-and-slide mechanism is that once a TF is bound to DNA, the time it that takes to find its correct target by sliding will not depend on its concentration in the nucleus. In contrast, a search mechanism based only on free 3D diffusion will always be dependent on concentration. Thus, in the limit of high concentrations, the probability of finding the correct target by free 3D diffusion increases, eventually dominating over sliding because proteins will simply arrive at the target first through 3D diffusion. To distinguish between these two mechanisms, Wang et al. (2013) measured the association rates of E. coli RNAP to promoter sequences on λ-phage DNA curtains as a function of RNAP concentration. They observed that at 50 pM RNAP, facilitated diffusion did indeed accelerate promoter search by a factor of 3. Since this concentration amounts to 0.05 molecules of RNAP per bacterium, it cannot be physiologically relevant. They also calculated that 0.5 molecules of RNAP per bacterium was the concentration limit above which facilitated diffusion is expected to be ineffective. Furthermore, the investigators saw no instance of RNAP sliding on DNA in any of their time-lapse images. Thus, it appears that facilitated diffusion was not likely to be a mechanism used by RNAP in E. coli. Ultimately, the specific mechanism of target search may depend on the TF, its concentration in cells, and its binding properties on DNA (Fig. 1).
Figure 1.
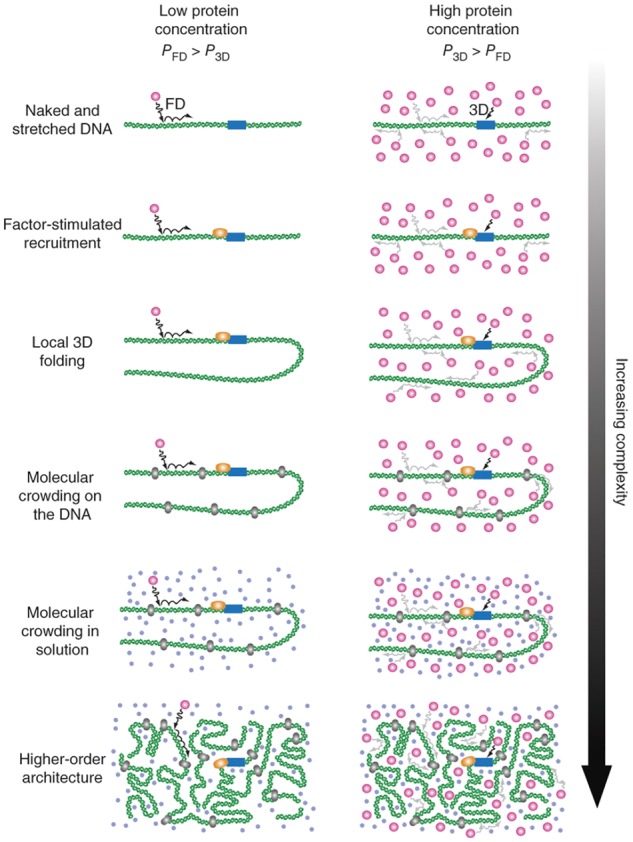
TF target search in an increasingly complex in vivo environment. To reconcile unexpectedly fast TF search times, facilitated diffusion was proposed. In this model, TFs bind unspecifically when they collide with DNA while diffusing within the nucleus and then slide along the DNA until they arrive at the correct site or fall off. At low protein concentrations, sliding is expected to speed up the search times, but at high protein concentrations, this is not expected to be the case. Furthermore, the crowded environment within the nucleus, where DNA-bound obstacles or higher-order chromatin architecture exist, is expected to complicate TF search modes. Reprinted by permission from Macmillan Publishers Ltd.: Nature Structural and Molecular Biology (Wang et al. 2013) © 2013.
Moving beyond in vitro measurements, an important biological question is whether facilitated diffusion takes place in the crowded milieu of a living cell. Sophisticated imaging systems now allow us to track the motions of single molecules of fluorescently labeled TFs over time. Elf et al. (2007) followed single YFP-labeled LacI proteins in living E. coli. cells. The investigators measured an apparent diffusion rate that is slower than simple 3D diffusion but faster than 1D sliding on DNA. Thus, the investigators inferred that LacI spends ∼87% of its time nonspecifically bound and sliding along DNA and undergoing 3D diffusion in between these binding events. This partition between 3D and 1D diffusion would enable LacI to find its target on the genome in no more than ∼270 sec even though there are only ∼20 copies of the protein in a cell. In an innovative follow-up study, the Elf laboratory was able to confirm the existence of facilitated diffusion by observing the effect of DNA “roadblocks” on gene activation kinetics (Hammar et al. 2012). In eukaryotes, facilitated diffusion has been observed by single-particle tracking of Tet repressors in human U2OS cells (Normanno et al. 2015), with a broad distribution of nonspecific binding times. Although there are not many data points, it is interesting to note the striking difference in nonspecific binding times measured in prokaryotes (a few milliseconds) and eukaryotes (∼1 sec). Single-molecule tracking of TFs have allowed the measurement of Kon and Koff of binding to DNA, but these measurements have often been confounded by technical challenges due to fluorophore photobleaching and photophysics (Elf et al. 2007). However, with the advent of improved fluorophores (Grimm et al. 2015) and new imaging and computational methods (Mazza et al. 2012; Gebhardt et al. 2013), one will soon be able to measure TF kinetics with greater accuracy.
In eukaryotic cells, the presence of higher-order chromatin architecture and packaging by nucleosomes is expected to complicate target search and may engender a larger diversity of search mechanisms. For example, the proto-oncogenic c-Myc and the positive transcription elongation factor complex (P-TEFb) display different modes of motion (Izeddin et al. 2014). While c-Myc moved by free 3D diffusion, P-TEFb appeared to undergo anomalous subdiffusion, thought to be due to spatial or temporal obstructions. An analysis of single-molecule tracks showed that while c-Myc was equally likely to move in any direction at each step regardless of the direction of the previous step, P-TEFb was more likely to move in the opposite direction from the previous step. This finding was consistent with P-TEFb diffusing in a space where it often encounters obstructions and has to return back to previously visited locations. Thus, it appears that even within the same nuclear compartment, different TFs experience different local environments, which give rise to vastly different outcomes in target search: c-Myc would take ∼70 times longer than P-TEFb to find a target located at a distance of 250 nm away, while that difference would be reduced to only eightfold longer if the target was located 5 µm away. Finally, alternating between sliding (1D) and jumping (3D) would also allow TFs to bypass obstacles like protein factors or nucleosomes that pose a barrier to sliding (Bonnet et al. 2008).
The mobility and binding kinetics of TFs can have profound implications on the regulation of transcription and development. For example, it has been observed that even before distinct lineages have been determined, Sox2 binding dynamics differ between four-cell blastocytes, and those cells with more long-lived Sox2 binding contribute more pluripotent progeny downstream (White et al. 2016). Single-molecule tracking of fluorescently tagged p53 and glucocorticoid receptor (GR) show that, at transcriptionally active domains, TFs bind transiently (<1 sec dwell time on DNA), with only a small fraction (<8%) engaged in productive binding (∼5 sec dwell time on DNA) (Morisaki et al. 2014). Based on the classical biochemical view that the transcription complex is assembled in a stepwise ordered fashion, assembly of a productive transcriptional complex within the short residence times of TFs and activators is expected to be very inefficient. However, recent dynamic measurements do in fact indicate that factors show cooperativity. The pluripotency factors Sox2 and Oct4 interact such that Sox2 “assists” the Oct4 target search (Chen et al. 2014). This observation is similar to that of Hager and colleagues (Voss et al. 2011) about assisted loading of steroid receptors on response elements. The opposite phenomenon—assisted “unloading”—has also been observed: When binding sites overlap with nucleosomes, the presence of the nucleosome speeds up the dissociation (decreases dwell time) of the TF (Luo et al. 2014). Interestingly, a symmetric relationship in which steroid receptors can induce the loading of FoxA1 and vice versa has also been described (Swinstead et al. 2016). However, even with cooperative interactions between components, the assembly of >70 protein subunits for a eukaryotic PIC seems like an impossible task. Thus, it is no surprise that only one in 90 collisions of Pol II with the DNA template is thought to result in productive elongation (Darzacq et al. 2007). Notably, even though RNAP in bacteria requires fewer accessory factors, it still forms an open complex relatively inefficiently, once every 30 interactions with the promoter (Friedman and Gelles 2012). The difficulty in fully activating a gene could help to prevent spurious undesired transcription and has also been suggested as a possible cause of transcriptional bursting.
Nuclear architecture
Another way to increase the efficiency of target search is if transcription sites were not randomly dispersed throughout the nuclear volume but instead were organized in a way that reduces the time it takes for low-copy-number factors to find their targets. The notion that the nonrandom structure and arrangement of chromosomes within the nucleus—transcription factories, topological domains, chromosome territories, etc.—might aid in this process is a recurring theme in gene regulation. “Transcription factories” have been proposed, in which Pol II molecules congregate at specific fixed foci within the nucleus and work together to transcribe the DNA template that is brought to the foci (Cook 1999). Early evidence for this model came from fixed cell images that show newly synthesized RNA concentrated in specific foci within the nucleoplasm (Cook 1999) and that widely separated genes colocalize at Pol II foci in a transcription-dependent manner (Osborne et al. 2004). More recently, Cisse et al. (2013) used advanced single-molecule imaging techniques and observed a nonhomogeneous distribution of fluorescently labeled Pol II in live U2OS cells. However, the Pol II clusters appeared to form and disassemble transiently with an average lifetime of ∼5 sec, and the dynamics of clustering was sensitive to reagents that stimulated or inhibited transcription. Thus, the transcription factories would not be stable in any sense of the word. Moreover, a similar study by Zhao et al. (2014) labeled and imaged close to 72% of all RNA Pol II molecules in the nucleus of fixed U2OS cells and found that >85% of the molecules exist in singular form, unassociated with other like molecules, thus arguing against the transcription factories model. Recent advances in imaging techniques use single-plane illumination (Gebhardt et al. 2013; Liu et al. 2014) and better fluorophores (Grimm et al. 2015) to improve signal to noise ratios significantly and will enable better measurements of transcription dynamics.
Recently, multiple genome-wide studies have proposed the existence of topologically associated domains (TADs) on the order of 1 Mb as one of the fundamental building blocks of nuclear architecture (Dixon et al. 2012; Nora et al. 2012). Within TADs, gene regulatory clusters are kilobase-size nuclear domains created by functional interactions between promoters and enhancers (Li et al. 2012; Kieffer-Kwon et al. 2013). This spatial architecture also varies from cell to cell (Nagano et al. 2013) and changes in response to gene activation (Therizols et al. 2014), spurring a wave of imaging studies seeking to better understand the nature of these compartments (Chen et al. 2013; Williamson et al. 2014; Beliveau et al. 2015; Shachar et al. 2015; Boettiger et al. 2016). In one study, the “first passage time” (FPT) was determined for two regions of genomic DNA in the context of V(D)J recombination at the mouse IgH locus (Lucas et al. 2014). The FPT is the time it would take for these two regions of the chromosome to come into contact and is analogous to the time it would take a single TF to find its target. The FPT for the VH region to encounter the DHJH elements (spanning ∼1–2 Mb and located within a 1-µm confinement radius) is ∼30 min. For c-Myc, the FPT over this same distance is 8 min, and for P-TEFb, it is ∼10 sec (Izeddin et al. 2014). The previously described hindered diffusion that P-TEFb undergoes, possibly due to nuclear compartmentalization, may prevent it from straying too far away from its target. Importantly, these time scales all scale nonlinearly with the spatial dimension (Izeddin et al. 2014; Lucas et al. 2014). For example, by decreasing the confinement radius twofold, the FPT for the IgH locus decreases 16-fold, but a twofold increase in diffusion gives only a fourfold decrease in FPT. Thus, the compartment size—by whatever means it is established—is a highly effective means of increasing on rates.
Polymerase initiation
After the transcription machinery assembles at the promoter, polymerase goes through several conformational steps during initiation, before becoming elongation-competent. In prokaryotes, RNAP forms the closed complex (RPc) upon initial recruitment to the promoter. It then transitions to the RNAP–promoter open complex (RPo) and begins to unwind ∼14 base pairs (bp) around the transcription start site. In the next step, the RNAP–promoter initial transcribing complex (RPitc) undergoes repeated cycles of abortive synthesis, transcribing and releasing short RNA products before returning and restarting again. Finally, RNAP breaks out of abortive synthesis only when it manages to synthesize ∼9–11 nucleotides (nt), allowing it to escape the promoter and enter into productive synthesis as a processive RNAP–DNA elongation complex (Lee et al. 2012). X-ray crystallography has provided a wealth of information about the structures and mechanisms of each intermediate (Sainsbury et al. 2015), but single-molecule techniques have been particularly useful for elucidating the kinetics of each step in vitro.
It is now possible to reconstitute RNAPs in vitro and characterize all of the major steps in initiation at the single-molecule level. In one such method, DNA templates are labeled with Alexa488 (donor) and tethered onto a coverglass. These molecules appear as diffraction-limited spots when imaged on a wide-field microscope. When Cy3-labeled (acceptor) RNAP is added, it assembles on the template to form the closed complex. Close proximity of the two fluorophores results in Förster resonance energy transfer (FRET) and produces emission in both donor and acceptor channels when only the donor fluorophore is excited. With this method, formation of the closed and open complexes can be visualized by the colocalization of spots from different fluorescent channels. In addition, short oligos labeled with Cy5 can also be included that will hybridize to nascent RNA, adding yet another colocalized spot in a third channel to track elongation. This technique, termed colocalization single-molecule spectroscopy (CoSMoS), can be used to observe all of the major steps of transcription initiation at the single-molecule level. With this method, Friedman and Gelles (2012) were able to measure the kinetics of RNAP closed complex formation on σ54-dependent promoters. They observed two distinct closed complex intermediates: an unstable form that quickly dissociates and a stable long-lived form that is a required precursor for formation of the open complex. Successful progression into the open complex was relatively infrequent, occurring, on average, only once every 30 times RNAP binds the template, again highlighting the stochastic and rate-limiting nature of the transition from closed complex to productive elongation. Once in the open complex form, synthesis of nascent RNA begins, and σ54 dissociates shortly after.
Other single-molecule studies have provided even more detailed mechanistic understanding of transcription initiation. Despite clear evidence that RPitc was engaged in synthesis of short RNA products, DNA footprinting data showed that the 5′ boundary of DNA occupied by RPitc remained unchanged from the previous RPo state, as if it was stationary. Thus, three different models were put forward to explain this inconsistency. In the “transient excursions” model, it was thought that RNAP translocates forward and springs back when synthesis is aborted and the RNA product is released (Carpousis and Gralla 1985). This excursion happens so quickly that the motion is not detected by a time-averaged bulk measurement such as DNA footprinting, and hence it appears to be stationary. In the “inchworming” model, RNAP was proposed to be composed of two modules connected by a flexible element (Straney and Crothers 1987; Krummel and Chamberlin 1989). While the upstream module remains stationary at its promoter position, the downstream module containing the catalytic active center detaches, translocates downstream, and returns when synthesis is aborted. Finally, in the “scrunching” model, it was proposed that RNAP remains at its promoter position and instead unwinds and pulls downstream DNA into the catalytic center for RNA synthesis (Brieba and Sousa 2001; Pal et al. 2005). In this scenario, RNAP has to accommodate up to ∼9–11 bp of unwound DNA within itself, which it eventually extrudes when synthesis is aborted.
Two different single-molecule studies were able to show clear evidence for the “scrunching” model. FRET measurements from fluorophores labeled at different sites on RNAP and the promoter DNA showed that both ends of RNAP remained stationary relative to promoter DNA, whereas downstream DNA appeared to translocate toward RNAP, consistent with the “scrunching” model (Kapanidis et al. 2006). A different study that measured changes in positive or negative supercoiling induced by RPitc was able to show that RPitc unwinds and pulls in a length of template DNA that is dependent on the RNA synthesis (Revyakin et al. 2006). Scrunching was observed in ∼80% of transcription cycles regardless of whether they were productive or abortive, leading the investigators to propose that the scrunched state is an obligatory intermediate and that the energy accumulated during scrunching is used to drive full promoter escape into productive elongation. It has also been shown that scrunching in RNAP helps to determine the exact DNA base from which to begin transcription (Robb et al. 2013; Winkelman et al. 2016). Recent cryo-EM structures of human PICs show breaks in electron density on the nontemplate DNA strand in the RPitc, and this was proposed to be disordered due to possible scrunching within RPitc (He et al. 2016). Thus, it appears that scrunching could be a universal scanning mechanism in both prokaryotes and eukaryotes that helps position the correct starting base in the catalytic center of polymerase.
For a while, single-molecule studies had not been able to provide the same level of mechanistic detail for eukaryotic transcription initiation because of the difficulty in assembling the full transcription machinery in vitro. Revyakin et al. (2012) were able to reconstitute human Pol II on a DNA template tethered to a glass slide and observe transcription using a technique similar to CoSMoS. Eukaryotic in vitro transcription reactions were known to produce <0.1 transcription per template per hour, far slower than the actual in vivo rates, but, by imaging thousands of tethered molecules simultaneously on a wide-field TIRF microscope over several hours, the investigators were able to observe several rounds of transcription reinitiation. Thus, the investigators were able to probe the effect of different promoter mutations and activator sequences on transcription rates. Connecting protein dynamics to a real-time measure of RNA synthesis will allow us to construct a full kinetic model of transcription (Zhang et al. 2014).
More recently, the 32-protein, 1.5 MDa PIC from Saccharomyces cerevisiae has been assembled on promoter DNA in vitro that included all of the general TFs (Murakami et al. 2013). This PIC was also functional, with rates that approached in vivo transcription rates. Using optical tweezers to follow single PICs in real time, the PIC was observed to unwind a remarkably large tract of downstream DNA (∼85 bp) to form the transcription bubble with the help of TFIIH (Fazal et al. 2015). Similar to RNAP in prokaryotic transcription, the polymerase repeatedly translocates and synthesizes RNA products up to the length of the open transcription bubble, scanning for a transcription start site. When the bubble collapses, the PIC returns to the closed or open complex back at the promoter. Occasionally, Pol II is successful at escaping the promoter region to continue into productive elongation. The investigators also saw evidence of “scrunching,” where downstream DNA is drawn into the catalytic active center, but did not explain where the unwound DNA is accommodated within Pol II.
Transcriptional bursting
In cells, RNA synthesis for a single gene has been observed to occur in irregular spurts that are separated by long periods of transcriptional inactivity. These “transcriptional bursts” amount to “memory” between transcripts: The synthesis of one transcript is likely to be accompanied by the synthesis of another over certain time intervals. Transcriptional bursting has now been observed in yeast (Zenklusen et al. 2008; Lenstra et al. 2015), slime mold (Chubb et al. 2006; Muramoto et al. 2010; Stevense et al. 2010), fly (Garcia et al. 2013), mouse (Lionnet et al. 2011), and human (Yunger et al. 2010) cell lines and is a significant source of expression variation between cells. In fact, subsequent steps of gene expression such as RNA export, RNA decay, translation, etc. have been shown to act as dynamic “buffers” that help to smooth out the effects of transcriptional bursting (Little et al. 2013; Stoeger et al. 2016). Thus, although heterogeneity at the single-cell level has been recognized for decades (Ko et al. 1990; White et al. 1995), progress in recent years has solidified the view that this heterogeneity is also a dynamic property: The expression state of the cell depends on when it is observed. By and large, the physiological effects of this dynamic behavior likely depend on the gene or the organism and resist general classification. However, the underlying cause of transcriptional bursting is an important area of investigation because there is the potential to gain mechanistic insight into the process of gene regulation at the molecular level, and single-molecule techniques are well-suited for this purpose.
The first evidence of transcriptional bursting came from early EM images of Miller chromatin spreads, showing nascent transcripts splayed out on either side of the DNA strand. While highly transcribed rRNA genes in Xenopus oocytes give rise to the beautiful “Christmas tree” structures shown in biology textbooks with closely and regularly spaced polymerases (Miller and Bakken 1972), chromosomal RNA from nonribosomal transcription units in fly embryos appear irregularly spaced on the active gene (McKnight and Miller 1979). Although it is possible that the polymerase spacing only appears irregular because some of the transcripts and associated polymerase were lost during preparation, this technique provided the first hints that the dynamics of transcription were not constant. The concept of transcriptional bursting re-emerged in light of new findings from measuring RNA (by PP7/MS2 or fluorescence in-situ hybridization [FISH]) and protein content in single cells (Femino et al. 1998; Golding et al. 2005). In FISH, the number of RNA transcripts in each cell within a population is imaged and counted, and the distribution of transcripts over the entire population of cells can shed light on the underlying dynamics of bursting (Raj et al. 2006). However, bursting parameters can only be inferred by fitting the data to theoretical models (Paulsson 2004; Shahrezaei and Swain 2008). Moreover, cell-to-cell variations (e.g., cell size) (Padovan-Merhar et al. 2015) contribute extrinsic noise that can complicate the study of intrinsic transcription dynamics. While measuring protein concentrations is several steps removed from the act of transcription, it does have the benefit of reading out the entire gene expression process (Newman et al. 2006). Live-cell single-molecule visualization of transcription using the MS2 or PP7 system comes the closest to capturing the actual transcriptional dynamics of the gene (Janicki et al. 2004), but the system relies on exogenous stem loops inserted into the gene of interest.
Using the language of transcriptional bursting—burst size, frequency, and duration—allows one to state more precisely what aspect of transcription is changed during regulation (Fig. 2). Work from many laboratories indicates that all quantities appear to be regulated. Burst size ranges from about two RNA per burst (Lenstra et al. 2015) to hundreds (Raj et al. 2006), and burst frequency ranges from minutes to hours. Some genes (such as housekeeping genes in yeast) do not appear to show bursting at all, and their expression levels are well approximated by a Poisson distribution (Zenklusen et al. 2008; Gandhi et al. 2011). In general, for a given average expression level, a gene that has a large burst size and low frequency will have greater expression variation than a gene that has a small burst size and high frequency of activation. In addition to the oft-used two-state description of transcription (Peccoud and Ycart 1995), more exotic models have also emerged recently that describe transcription as a continuum of possible states (Corrigan et al. 2016; Featherstone et al. 2016). Thus, transcription dynamics are a signature of the underlying behavior.
Figure 2.

Transcriptional bursting visualized with direct measurement of nascent RNA. (A–D) Time-lapse microscopy of single-copy reporter gene expression in U2OS cells. Nascent RNA was visualized by the binding of the high-affinity MS2 protein to RNA stem loops. (E,F) Integrated fluorescence intensity, which reflects nascent RNA, was plotted as a function of time for two individual genes in two different cells. On and off periods of the transcriptional burst are indicated. Reprinted from Larson et al. 2013.
There is not one mechanism for transcriptional bursting, and, as the experimental methods improve, it seems likely that many processes will be unearthed. In bacteria, it has been proposed that bursting is gene-independent (So et al. 2011), and recent work from the Xie laboratory (Chong et al. 2014) suggests that the general mechanism is related to DNA topology. However, there is conflicting evidence that the same gene can be expressed with both large and small bursts (Choi et al. 2008). In eukaryotes, bursting behavior has been observed to vary widely and be more gene-specific. In yeast, promoter sequences have been shown to have a strong effect on bursting behavior (Hornung et al. 2012), and mutations in the TATA box could change burst size (Blake et al. 2006). These results reinforce the connection to earlier work on transcription reinitiation (Hawley and Roeder 1987; Yudkovsky et al. 2000), although it is not yet clear that these phenomena are the same in vivo. In addition, mutations in chromatin remodelers affected both burst size and frequency. In an elegant single-molecule study that used EM to map nucleosome conformations of the PHO5 promoter on DNA plasmids isolated from single cells, Brown et al. (2013) observed a distribution of nucleosome conformations that corresponded to the dynamic activity states of the gene (Fig. 3).
Figure 3.

EM analysis of PH05 plasmids isolated from S. cerevisiae. The nucleosome position is inferred from the position of single-stranded loops stabilized through psoralen cross-linking. The stochastic partitioning between different nucleosome occupancy states can be directly determined from the electron micrograph. (Left diagram) Structure of the PHO5 gene, with ovals representing nucleosomes. The arrow indicates the transcription start site. Reprinted from Brown et al. 2013.
Work on synthetic reporters in mammalian cells indicates that the same reporter showed vastly different bursting properties depending on whether that gene was integrated into a chromosome or was present as a circular plasmid (Larson et al. 2013). Related to this observation is the recent finding that bursts may be related to the interaction between enhancers and promoters. Blobel and coworkers (Bartman et al. 2016) visualized nascent RNA production from the β-globin and γ-globin genes in primary adult human erythroid cells and observed that the transcription of these genes, both of which are controlled by the same distal enhancer (locus control region), is mutually exclusive. The interpretation of this finding is that a burst of RNA synthesis from either gene can happen only as a result of a promoter–enhancer contact, and this enhancer can contact only one promoter at a time. In contrast, two genes driven from a single enhancer showed coordinated bursting, challenging the view that every burst arises from a stable enhancer–promoter contact (Fukaya et al. 2016). Finally, TFs (both sequence-specific and general factors) show temporal variability in occupancy that is consistent with their role in controlling bursting dynamics. For example, the CUP1 array in yeast showed different cycles of Ace1p binding, correlating with a slow cycling of transcription (Karpova et al. 2008). Another trans-acting factor, Pol II, which is, of course, essential for RNA synthesis for most genes, shows temporal clustering behavior that occurs on the same time scale as the ensuing burst (Cho et al. 2016). In summary, there is evidence that multiple processes—including DNA topology, TF binding, nucleosome occupancy, chromatin state, and enhancer–promoter interaction—all contribute to the bursting behavior. The actual dynamics of each gene may reflect the combinatorial interaction of these processes, but it is important to emphasize the potential of single-molecule approaches for unraveling this behavior.
What started out as a peculiarity of single-molecule biophysics is now a pressing issue in the era of single-cell genomics. For example, looking for correlations or subpopulations in single-cell RNA sequencing (RNA-seq) data will be confounded by the intrinsic dynamics of transcriptional bursting (Trapnell 2015). Reconciling the stochastic nature of transcriptional bursts with the greater use of time-resolved genome-wide approaches and/or single-cell analysis is thus an active area of research.
Transcription elongation
The step of transcription where single-molecule studies have historically yielded the most information is elongation. Since single-molecule spectroscopy provides unparalleled spatial and temporal information, it is particularly suited for observing the physical translocation of molecules. In a ground-breaking single-molecule study of transcription, Schafer et al. (1991) assembled stalled RNAP:DNA complexes and immobilized them onto a coverglass. When transcription was restarted, RNAPs were observed to transcribe steadily at rates of 6.2–14 nt/sec, with different molecules transcribing at different characteristic rates. Furthermore, the distribution of rates was much larger than would be expected from measurement error. This observation runs counter to the traditional biochemical view that enzymes transcribe at an “average rate” and highlights the advantage of single-molecule studies over bulk measurements.
What could be the cause of heterogeneity in RNAP elongation rates? In a follow-up study, the wider than expected distribution was again observed despite careful elimination of possible causes such as temperature and mechanical perturbations (Tolić-Nørrelykke et al. 2004). This result led the investigators to speculate that RNAP existed in several different long-lived conformational states that have different kinetic rates. Furthermore, there was a wide distribution of instantaneous velocities even at the same position on the template, indicating that heterogeneity was not a result of sequence but was perhaps because RNAP was slowly switching between more or less competent states (Davenport et al. 2000). It is worth noting that, in contrast, using a different single-molecule approach, Adelman et al. (2002) found that RNAP has relatively homogenous elongation rates but was subject to short stochastic pauses. Depending on the time window used for averaging, the calculation of instantaneous velocities can be confounded by pauses.
It is now recognized that, in prokaryotes, pausing during transcription is widespread even in the absence of known pause sequences on the DNA template. Single-molecule studies showed that RNAPs that were transcribing faster were less likely to pause (Davenport et al. 2000) and that pauses occurred stochastically in time with no apparent long-term memory of previous pauses (Adelman et al. 2002). Since then, single-molecule techniques were greatly improved and were able to achieve single-base-pair spatial resolution (Abbondanzieri et al. 2005). The results so far suggest that RNAP can stochastically switch to an off-pathway paused state that exists in kinetic competition with the active translocating state. This kind of pausing is different from sequence-specific or promoter-proximal pausing seen by chromatin immunoprecipitation (ChIP) (Jonkers and Lis 2015).
In general, pauses appear to separate into two types: Approximately 5% of pauses were sequence-nonspecific and long (20 sec to >30 min), and the other ∼95% were short, ubiquitous (approximately one per 100 bp), and dependent on DNA template sequence. During the long pauses, RNAP appears to stop abruptly and then slowly backtrack ∼5 bp before stopping again completely (Shaevitz et al. 2003). The duration and frequency of these long pauses could also be reduced by the addition of GreA and GreB TFs that are known to stimulate cleavage of nascent RNA. These observations suggested that long pauses are involved in transcription proofreading, where RNAP backtracks to allow the wrongly added base to be cleaved off before elongation can be restarted again. On the other hand, for short pauses, RNAP did not appear to backtrack (Neuman et al. 2003). The duration or frequency of the short pauses was not affected by an assisting or resisting force on RNAP. Thus, a model was proposed in which the paused RNAP state is an off-pathway intermediate that competes kinetically with forward translocation. From this intermediate, it can transition to other paused states, such as backtracking or termination, or return to the on-pathway translocating state.
While the early single-molecule studies of elongation and pausing have been performed on prokaryotic RNAP, more recent studies have observed the same pausing behaviors in eukaryotes, which can be accounted for by backtracking and/or nucleosomes. Galburt et al. (2007) observed that backtrack pause durations of Pol II from S. cerevisiae followed a power law behavior, which can be explained by a model in which, during a pause, Pol II diffuses along the template in discrete base-pair steps and recovers from the pause only when the 3′ end of the nascent chain is aligned once more with the active site. Two general TFs, TFIIS or TFIIF, were independently able to rescue Pol II from paused states and could also work synergistically to rescue Pol II that had undergone large backtracking (Ishibashi et al. 2014; Schweikhard et al. 2014).
The causes of pausing or backtracking are unclear, but supercoiling has been shown to be involved. During transcription, as polymerase unwinds DNA, it generates positive supercoiling ahead (downstream) and negative supercoiling behind (upstream). While torsional stress is relieved in vivo by DNA rotation or topoisomerases, polymerase is still predicted to experience fluctuating torsional stress. Using magnetic tweezers to wind up the DNA template along the cylindrical axis and observing the elongation speed of RNAP on it, Ma et al. (2013) showed that resistive torque can induce pausing and increase both the duration and frequency of pause. As resistive torque builds up, RNAP will eventually stall and even backtrack (Ma et al. 2013). The velocity of RNAP between pauses depended on the amount of positive or negative torque, providing direct evidence that supercoiling can regulate the kinetics of transcription elongation. In a similar vein, in both in vitro and live-cell experiments, Chong et al. (2014) showed that buildup of unrelieved positive supercoiling could slow down and eventually halt transcription initiation or elongation. This stall could be rescued by the addition of gyrase, which works by relieving positive supercoiling. Furthermore, the investigators showed that mRNA copy number distribution of a highly transcribed gene in E. coli was directly affected by gyrase concentration in vivo, suggesting that fluctuations in supercoiling are responsible for transcriptional bursting of induced genes in prokaryotes.
In eukaryotes, another cause of pausing or backtracking might be the encounter between the polymerase and a barrier such as a nucleosome. Hodges et al. (2009) used optical tweezers to measure Pol II elongation rates on DNA templates with preloaded nucleosomes and showed that Pol II was more likely to pause. The investigators concluded that, during forward translocation and backtracking, Pol II does not actively unwrap DNA. Instead, Pol II advances opportunistically when local fluctuations unwrap DNA from the nucleosome, likely through a ratcheting mechanism. These results provided a mechanistic explanation for previous bulk biochemical studies that showed that histones do not fall off the template when Pol II transcribes through. Instead, histones are transferred around the passing Pol II molecule through a mechanism hypothesized to involve looping of the DNA template (Studitsky et al. 1994, 1997). This model was further supported by single-molecule atomic force microscopy (AFM) images of Pol II transcribing on a DNA template that contained a nucleosome bound at a specific position (Bintu et al. 2011). From the images, one could infer the existence of loops (thought to be ∼90 bp) forming in the vicinity of Pol II, which had been hypothesized to aid in the transfer of histones around to the upstream side of Pol II. In a different study, it was shown that the DNA sequence, specific histone–DNA contacts, and even modifications in the histone tails could alter the mechanical barrier that nucleosomes posed to a transcribing Pol II (Bintu et al. 2012). These results highlight a mechanism by which transcription elongation rates could be regulated in vivo.
The biological consequences of pausing are still an active area of research. In bacteria, RNAP pausing is a ubiquitous mechanism of gene regulation, with well-studied cases such as the trp operon being a paradigmatic example (Landick et al. 1987). A recent study identified thousands of new pause sites in E. coli and Bacillus subtilis (Larson et al. 2014), suggesting that our understanding is far from complete. In eukaryotes, pauses and/or changes in elongation have also been associated with alternative splicing (de la Mata et al. 2003; Fong et al. 2014) and changes in start site selection (Braberg et al. 2013), both of which will affect downstream expression. However, just because there exists an optimum rate at which these processes occur, it does not necessarily mean that the cell uses this regulatory “knob” to change gene expression (Palangat and Larson 2012). Single-molecule assays might be capable of distinguishing changes in speed in unperturbed systems and correlating such changes to expression outcomes.
Splicing
RNAP was an early showcase for the power of single-molecule biophysical approaches such as imaging and optical trapping. It can be attached to large latex beads on which transcription can be reconstituted from purified components in a highly stable and processive manner (Palangat et al. 2012). The spliceosome shares none of these characteristics. It is a dynamic single-turnover enzyme that assembles on each intron, carries out one splicing reaction, and then disassembles. The canonical pathway for spliceosome assembly and activation is the binding of U1-snRNPs and U2-snRNPs to the 5′ splice site (5′-ss) and the branch point, respectively. Next comes the recruitment of the tri-snRNP (U4/5/6) and the multiprotein Prp19 complex known as the nineteen complex (NTC). “Activation” of the spliceosome is followed by RNA splicing, both of which require disassembly of components of the spliceosome. Splicing itself proceeds through a two-step chemical transesterification process. This reaction can be reconstituted from cell extracts but not from purified RNA and protein (Hoskins and Moore 2012). Moreover, only recently have high-resolution cryo-EM structures emerged for this ribonuclear protein complex, which contains >200 macromolecules (Yan et al. 2015; Agafonov et al. 2016; Wan et al. 2016). These same characteristics that have made splicing refractory to other biochemical approaches provide a unique opportunity for single-molecule approaches. In fact, splicing was originally discovered through single-molecule imaging (Berget et al. 1977).
In pioneering work from Hoskins and coworkers (Crawford et al. 2008; Hoskins et al. 2011), this process of splicing was reconstituted from yeast whole-cell extracts and visualized with single-molecule microscopy in vitro. The kinetic picture that emerged revealed a number of important features. First, spliceosome assembly is highly ordered, indicating that, although factors such as the U1-snRNPs and U2-snRNPs bind and unbind on the time scale of seconds to minutes, there is a directionality to the process that is reinforced by the consumption of ATP (Hoskins et al. 2011). Second, commitment to splicing does not occur through a single irreversible step but rather is the cumulative outcome of many coupled reactions. As a consequence, no single kinetic step dominates the reaction, and the net rate of splicing is due to many sequential kinetic steps. For these in vitro studies, the time from U1-snRNP binding to intron removal was measured to be ∼12 min (Fig. 4). One of the primary conclusions of this single-molecule analysis is that spliceosome assembly and pre-mRNA splicing are reversible at almost every step, which opens up the possibility of regulation at multiple points. Subsequent work using this same approach indicates that the order of assembly of the spliceosome can follow slightly different routes and still result in the same pre-mRNA splicing outcome. Thus, there is a considerable plasticity to the spliceosome (Shcherbakova et al. 2013).
Figure 4.

Spliceosome assembly follows a highly ordered, reversible pathway. The individual rate constants as determined from single-molecule fluorescence time-lapse recordings of dwell time are indicated. Note the absence of a single rate-limiting step that dominates the kinetics. From Hoskins et al. (2011). Reprinted with permission from AAAS.
One way of observing this plasticity at the molecular level is with single-molecule FRET (smFRET), which has been used by several laboratories to examine the first chemical step of splicing. This first chemical step occurs when the adenosine branch point residue carries out a nucleophilic attack on the first nucleotide of the intron at the 5′-ss, which requires bringing the branch site and the 5′-ss into molecular contact. The tri-snRNP complex (U2, U5, and U6) aids in positioning these substrates and is capable of adopting multiple configurations (Guo et al. 2009; Abelson et al. 2010). After binding of the NTC complex, the pre-mRNA adopts a high FRET configuration, indicating that the branch site and the 5′-ss are in proximity (Crawford et al. 2013; Krishnan et al. 2013). In fact, helicases such as Prp16 can remodel the complex to select for certain branch points in the first step of splicing, which ensures fidelity of splicing (Semlow et al. 2016). However, until the formation of the catalytic complex, the pre-mRNA is configured such that the 5′-ss and the branch point are spatially separated, which is likely to prevent premature catalysis. After the 5′-ss and branch site come into proximity, there is a loss of the intron and NTC fluorescence, indicating that the splicing reaction eventually goes to completion. Krishnan et al. (2013) further proposed, based on the dynamics observed in smFRET studies, that the pre-mRNA samples multiple conformations during the first catalytic step, again suggesting the possibility of regulation at multiple intermediate steps. However, it is the ATPase activity of proteins such as Prp2 that provides directionality to the reaction (Krishnan et al. 2013). Thus, just as in the case of RNA synthesis by RNAP, the spliceosome operates according to a thermal ratchet principle.
How does this model inform our understanding of splicing in vivo? In recent years, a number of studies have measured the kinetics of splicing using single-molecule live-cell imaging approaches. One of the primary benefits of such an approach is that one is able to directly visualize the coupling between synthesis and RNA processing for single RNAs made from single genes. Furthermore, these kinetic studies have elucidated the variability in timing of splicing, which provides insight into which steps might be rate-limiting and/or subject to regulation. Using the MS2 RNA-imaging approach, Schmidt et al. (2011) measured a splicing time of ∼3 min. Importantly, they determined that splicing kinetics were not determined by a single rate-limiting step but followed a sequential path that results in a kinetic process that is less noisy and more deterministic (Schmidt et al. 2011). It is tempting to assign these sequential steps to the serial transesterification reactions described above. Work from the Shav-Tal laboratory (Brody et al. 2011) measured the accumulation of snRNPs during splicing and demonstrated that the elongation machinery does not “wait” for each splicing event to go to completion but rather moves ahead so that more introns accumulate. Likewise, adding more introns did not measurably change the rate of transcript synthesis, indicating that elongation proceeds independently of splicing (Brody et al. 2011).
Further evidence of the relationship between elongation and splicing rates was obtained by Coulon et al. (2014). Using dual labeling of intronic and exonic RNA, one is able to separate the kinetics of elongation, splicing, and cleavage. For the β-globin reporter gene in that study, splicing of the terminal intron proceeded with a splicing time of ∼4 min. This rate was determined by a sequential kinetic process, similar to what was shown in previous in vitro (Hoskins et al. 2011) and in vivo (Schmidt et al. 2011) assays. Notably, the single-molecule approach revealed that transcripts exhibit stochastic processing, with some transcripts being spliced cotranscriptionally and others spliced post-transcriptionally. Another single-molecule study of β-globin transcription and splicing revealed a much faster splicing rate of ∼30 sec (Martin et al. 2013). The investigators also showed how splice site strength can change the kinetics of intron removal. Similarly, Tyagi and coworkers (Vargas et al. 2011) demonstrated that constitutive and alternative splicing can proceed with different kinetics, with the former occurring predominantly cotranscriptionally and the latter occurring predominantly post-transcriptionally. These data point the way toward a more refined model of splice site selection that is biophysically motivated: Direct measures of splicing kinetics might be a better way of developing sequence-based rules for splice site selection than mRNA isoform abundance.
Overall, the enduring interest in splicing kinetics that has persisted over several decades reflects a broader agenda of understanding the remarkable dynamics of the spliceosome in relation to the enzymatic result. Although it is early days for single-molecule studies of splicing, future studies that rely on simultaneous observation of splicing factors and pre-mRNA in living cells carry much promise for understanding both the mechanism and regulation of splicing in vivo.
Conclusion and outlook
Single-molecule approaches are now being used to study processes of increasing complexity. Nowhere is this complexity more evident than the transcribing gene: Megadalton complexes involved in elongation, splicing, termination, and cleavage simultaneously interact on nascent RNA to control RNA synthesis and processing. Some of these processes have been examined in great depth, while others have not. For example, there are only a few studies of transcription termination in prokaryotes (Yin et al. 1999; Larson et al. 2008) and virtually none in eukaryotes. While it is still a work in progress, single-molecule biophysical methods promise us a future with the ability to observe the totality of events on a single RNA; that is, one can observe the order of events, the sequential assembly of complexes, and the time-resolved behavior of enzymes in a perturbation-free manner. By including techniques such as smFRET, which provides dynamic structural information, and optical trapping and AFM, which allow one to manipulate macromolecules, it is possible to probe the inner workings of an enzyme. One exciting prospect in the field is the convergence of increasingly complex in vitro assays and decreasingly complex in vivo assays. The fact that spliceosome assembly (Hoskins et al. 2011), PIC assembly (Revyakin et al. 2012), and transcription initiation (Fazal et al. 2015) can now be reconstituted and observed at the single-molecule level is inspiring. Single-molecule in vivo imaging is also advancing on parallel fronts and allowing researchers to see these same kinetic processes in the living nucleus (Larson et al. 2011; Chen et al. 2014).
Acknowledgments
We acknowledge Maxime Dahan, Timothée Lionnet, Aaron Hoskins, Tineke Lenstra, and Murali Palangat for critical comments on the manuscript. In addition, both anonymous referees provided advice that greatly improved the final review. This work was supported by the Intramural Research Program of the National Cancer Institute.
Footnotes
Article is online at http://www.genesdev.org/cgi/doi/10.1101/gad.281725.116.
References
- Abbondanzieri EA, Greenleaf WJ, Shaevitz JW, Landick R, Block SM. 2005. Direct observation of base-pair stepping by RNA polymerase. Nature 438: 460–465. [DOI] [PMC free article] [PubMed] [Google Scholar]
- Abelson J, Blanco M, Ditzler MA, Fuller F, Aravamudhan P, Wood M, Villa T, Ryan DE, Pleiss JA, Maeder C, et al. 2010. Conformational dynamics of single pre-mRNA molecules during in vitro splicing. Nat Struct Mol Biol 17: 504–512. [DOI] [PMC free article] [PubMed] [Google Scholar]
- Adelman K, La Porta A, Santangelo TJ, Lis JT, Roberts JW, Wang MD. 2002. Single molecule analysis of RNA polymerase elongation reveals uniform kinetic behavior. Proc Natl Acad Sci 99: 13538–13543. [DOI] [PMC free article] [PubMed] [Google Scholar]
- Agafonov DE, Kastner B, Dybkov O, Hofele RV, Liu WT, Urlaub H, Luhrmann R, Stark H. 2016. Molecular architecture of the human U4/U6.U5 tri-snRNP. Science 351: 1416–1420. [DOI] [PubMed] [Google Scholar]
- Bartman CR, Hsu SC, Hsiung CC, Raj A, Blobel GA. 2016. Enhancer regulation of transcriptional bursting parameters revealed by forced chromatin looping. Mol Cell 62: 237–247. [DOI] [PMC free article] [PubMed] [Google Scholar]
- Beliveau BJ, Boettiger AN, Avendaño MS, Jungmann R, McCole RB, Joyce EF, Kim-Kiselak C, Bantignies F, Fonseka CY, Erceg J, et al. 2015. Single-molecule super-resolution imaging of chromosomes and in situ haplotype visualization using Oligopaint FISH probes. Nat Commun 6: 7147. [DOI] [PMC free article] [PubMed] [Google Scholar]
- Berg OG, Blomeerg C. 1976. Association kinetics with coupled diffusional flows: special application to the Lac repressor-operator system. Biophys Chem 4: 367–381. [DOI] [PubMed] [Google Scholar]
- Berg OG, Winter RB, von Hippel PH. 1981. Diffusion-driven mechanisms of protein translocation on nucleic acids. 1. Models and theory. Biochemistry 20: 6929–6948. [DOI] [PubMed] [Google Scholar]
- Berget SM, Moore C, Sharp PA. 1977. Spliced segments at the 5′ terminus of adenovirus 2 late mRNA. Rev Med Virol 10: 356–362. [PubMed] [Google Scholar]
- Bintu L, Kopaczynska M, Hodges C, Lubkowska L, Kashlev M, Bustamante C. 2011. The elongation rate of RNA polymerase determines the fate of transcribed nucleosomes. Nat Struct Mol Biol 18: 1394–1399. [DOI] [PMC free article] [PubMed] [Google Scholar]
- Bintu L, Ishibashi T, Dangkulwanich M, Wu YY, Lubkowska L, Kashlev M, Bustamante C. 2012. Nucleosomal elements that control the topography of the barrier to transcription. Cell 151: 738–749. [DOI] [PMC free article] [PubMed] [Google Scholar]
- Blake WJ, Balazsi G, Kohanski MA, Isaacs FJ, Murphy KF, Kuang Y, Cantor CR, Walt DR, Collins JJ. 2006. Phenotypic consequences of promoter-mediated transcriptional noise. Mol Cell 24: 853–865. [DOI] [PubMed] [Google Scholar]
- Boettiger AN, Bintu B, Moffitt JR, Wang S, Beliveau BJ, Fudenberg G, Imakaev M, Mirny LA, Wu C, Zhuang X. 2016. Super-resolution imaging reveals distinct chromatin folding for different epigenetic states. Nature 529: 418–422. [DOI] [PMC free article] [PubMed] [Google Scholar]
- Bonnet I, Biebricher A, Porte PL, Loverdo C, Benichou O, Voituriez R, Escude C, Wende W, Pingoud A, Desbiolles P. 2008. Sliding and jumping of single EcoRV restriction enzymes on non-cognate DNA. Nucleic Acids Res 36: 4118–4127. [DOI] [PMC free article] [PubMed] [Google Scholar]
- Braberg H, Jin H, Moehle EA, Chan YA, Wang S, Shales M, Benschop JJ, Morris JH, Qiu C, Hu F, et al. 2013. From structure to systems: high-resolution, quantitative genetic analysis of RNA polymerase II. Cell 154: 775–788. [DOI] [PMC free article] [PubMed] [Google Scholar]
- Brieba LG, Sousa R. 2001. T7 promoter release mediated by DNA scrunching. EMBO J 20: 6826–6835. [DOI] [PMC free article] [PubMed] [Google Scholar]
- Brody Y, Neufeld N, Bieberstein N, Causse SZ, Böhnlein E-M, Neugebauer KM, Darzacq X, Shav-Tal Y. 2011. The in vivo kinetics of RNA polymerase II elongation during co-transcriptional splicing. PLoS Biol 9: e1000573. [DOI] [PMC free article] [PubMed] [Google Scholar]
- Brown CR, Mao C, Falkovskaia E, Jurica MS, Boeger H. 2013. Linking stochastic fluctuations in chromatin structure and gene expression. PLoS Biol 11: e1001621. [DOI] [PMC free article] [PubMed] [Google Scholar]
- Carpousis AJ, Gralla JD. 1985. Interaction of RNA polymerase with lacUV5 promoter DNA during mRNA initiation and elongation. J Mol Biol 183: 165–177. [DOI] [PubMed] [Google Scholar]
- Chen B, Gilbert LA, Cimini BA, Schnitzbauer J, Zhang W, Li GW, Park J, Blackburn EH, Weissman JS, Qi LS, et al. 2013. Dynamic imaging of genomic loci in living human cells by an optimized CRISPR/Cas system. Cell 155: 1479–1491. [DOI] [PMC free article] [PubMed] [Google Scholar]
- Chen J, Zhang Z, Li L, Chen BC, Revyakin A, Hajj B, Legant W, Dahan M, Lionnet T, Betzig E, et al. 2014. Single-molecule dynamics of enhanceosome assembly in embryonic stem cells. Cell 156: 1274–1285. [DOI] [PMC free article] [PubMed] [Google Scholar]
- Cho W, Jayanth N, English BP, Inoue T, Andrews JO, Cissé I. 2016. RNA polymerase II cluster dynamics predict mRNA output in living cells. Elife 5: e13617. [DOI] [PMC free article] [PubMed] [Google Scholar]
- Choi PJ, Cai L, Frieda K, Xie XS. 2008. A stochastic single-molecule event triggers phenotype switching of a bacterial cell. Science 322: 442–446. [DOI] [PMC free article] [PubMed] [Google Scholar]
- Chong S, Chen C, Ge H, Xie XS. 2014. Mechanism of transcriptional bursting in bacteria. Cell 158: 314–326. [DOI] [PMC free article] [PubMed] [Google Scholar]
- Chubb JR, Trcek T, Shenoy SM, Singer RH. 2006. Transcriptional pulsing of a developmental gene. Curr Biol 16: 1018–1025. [DOI] [PMC free article] [PubMed] [Google Scholar]
- Cisse II, Izeddin I, Causse SZ, Boudarene L, Senecal A, Muresan L, Dugast-Darzacq C, Hajj B. 2013. Real-time dynamics of RNA polymerase II clustering in live human cells. Science 245: 664–667. [DOI] [PubMed] [Google Scholar]
- Cook PR. 1999. The organization of replication and transcription. Science 284: 1790–1795. [DOI] [PubMed] [Google Scholar]
- Corrigan AM, Tunnacliffe E, Cannon D, Chubb JR. 2016. A continuum model of transcriptional bursting. Elife 5: e13051. [DOI] [PMC free article] [PubMed] [Google Scholar]
- Coulon A, Chow CC, Singer RH, Larson DR. 2013. Eukaryotic transcriptional dynamics: from single molecules to cell populations. Nat Rev Genet 14: 572–584. [DOI] [PMC free article] [PubMed] [Google Scholar]
- Coulon A, Ferguson ML, de Turris V, Palangat M, Chow CC, Larson DR. 2014. Kinetic competition during the transcription cycle results in stochastic RNA processing. Elife 3: e03939. [DOI] [PMC free article] [PubMed] [Google Scholar]
- Crawford DJ, Hoskins AA, Friedman LJ, Gelles J, Moore MJ. 2008. Visualizing the splicing of single pre-mRNA molecules in whole cell extract. RNA 14: 170–179. [DOI] [PMC free article] [PubMed] [Google Scholar]
- Crawford DJ, Hoskins AA, Friedman LJ, Gelles J, Moore MJ. 2013. Single-molecule colocalization FRET evidence that spliceosome activation precedes stable approach of 5′ splice site and branch site. Proc Natl Acad Sci 110: 6783–6788. [DOI] [PMC free article] [PubMed] [Google Scholar]
- Darzacq X, Shav-Tal Y, de Turris V, Brody Y, Shenoy SM, Phair RD, Singer RH. 2007. In vivo dynamics of RNA polymerase II transcription. Nat Struct Mol Biol 14: 796–806. [DOI] [PMC free article] [PubMed] [Google Scholar]
- Davenport RJ, Wuite GJ, Landick R, Bustamante C. 2000. Single-molecule study of transcriptional pausing and arrest by E. coli RNA polymerase. Science 287: 2497–2500. [DOI] [PubMed] [Google Scholar]
- de la Mata M, Alonso CR, Kadener S, Fededa JP, Blaustein M, Pelisch F, Cramer P, Bentley D, Kornblihtt AR. 2003. A slow RNA polymerase II affects alternative splicing in vivo. Mol Cell 12: 525–532. [DOI] [PubMed] [Google Scholar]
- Dixon JR, Selvaraj S, Yue F, Kim A, Li Y, Shen Y, Hu M, Liu JS, Ren B. 2012. Topological domains in mammalian genomes identified by analysis of chromatin interactions. Nature 485: 376–380. [DOI] [PMC free article] [PubMed] [Google Scholar]
- Elf J, Li G-W, Xie XS. 2007. Probing transcription factor dynamics at the single-molecule level in a living cell. Science 316: 1191–1194. [DOI] [PMC free article] [PubMed] [Google Scholar]
- Fazal FM, Meng CA, Murakami K, Kornberg RD, Block SM. 2015. Real-time observation of the initiation of RNA polymerase II transcription. Nature 525: 274–277. [DOI] [PMC free article] [PubMed] [Google Scholar]
- Featherstone K, Hey K, Momiji H, McNamara AV, Patist AL, Woodburn J, Spiller DG, Christian HC, McNeilly AS, Mullins JJ, et al. 2016. Spatially coordinated dynamic gene transcription in living pituitary tissue. Elife 5: 1–25. [DOI] [PMC free article] [PubMed] [Google Scholar]
- Femino AM, Fay FS, Fogarty K, Singer RH. 1998. Visualization of single RNA transcripts in situ. Science 280: 585–590. [DOI] [PubMed] [Google Scholar]
- Fong N, Kim H, Zhou Y, Ji X, Qiu J, Saldi T, Diener K, Jones K, Fu XD, Bentley DL. 2014. Pre-mRNA splicing is facilitated by an optimal RNA polymerase II elongation rate. Genes Dev 28: 2663–2676. [DOI] [PMC free article] [PubMed] [Google Scholar]
- Friedman LJ, Gelles J. 2012. Mechanism of transcription initiation at an activator-dependent promoter defined by single-molecule observation. Cell 148: 679–689. [DOI] [PMC free article] [PubMed] [Google Scholar]
- Friedman LJ, Mumm JP, Gelles J. 2013. RNA polymerase approaches its promoter without long-range sliding along DNA. Proc Natl Acad Sci 110: 9740–9745. [DOI] [PMC free article] [PubMed] [Google Scholar]
- Fukaya T, Lim B, Levine M. 2016. Enhancer control of transcriptional bursting. Cell 166: 358–368. [DOI] [PMC free article] [PubMed] [Google Scholar]
- Galburt EA, Grill SW, Wiedmann A, Lubkowska L, Choy J, Nogales E, Kashlev M, Bustamante C. 2007. Backtracking determines the force sensitivity of RNAP II in a factor-dependent manner. Nature 446: 820–823. [DOI] [PubMed] [Google Scholar]
- Gandhi SJ, Zenklusen D, Lionnet T, Singer RH. 2011. Transcription of functionally related constitutive genes is not coordinated. Nat Struct Mol Biol 18: 27–34. [DOI] [PMC free article] [PubMed] [Google Scholar]
- Garcia HG, Tikhonov M, Lin A, Gregor T. 2013. Quantitative imaging of transcription in living Drosophila embryos links polymerase activity to patterning. Curr Biol 23: 2140–2145. [DOI] [PMC free article] [PubMed] [Google Scholar]
- Gebhardt JCM, Suter DM, Roy R, Zhao ZW, Chapman AR, Basu S, Maniatis T, Xie XS. 2013. Single-molecule imaging of transcription factor binding to DNA in live mammalian cells. Nat Methods 10: 421–426. [DOI] [PMC free article] [PubMed] [Google Scholar]
- Golding I, Paulsson J, Zawilski SM, Cox EC. 2005. Real-time kinetics of gene activity in individual bacteria. Cell 123: 1025–1036. [DOI] [PubMed] [Google Scholar]
- Greenleaf WJ, Woodside MT, Block SM. 2007. High-resolution, single-molecule measurements of biomolecular motion. Annu Rev Biophys Biomol Struct 36: 171–190. [DOI] [PMC free article] [PubMed] [Google Scholar]
- Grimm JB, English BP, Chen J, Slaughter JP, Zhang Z, Revyakin A, Patel R, Macklin JJ, Normanno D, Singer RH, et al. 2015. A general method to improve fluorophores for live-cell and single-molecule microscopy. Nat Methods 12: 4–7. [DOI] [PMC free article] [PubMed] [Google Scholar]
- Guo Z, Karunatilaka KS, Rueda D. 2009. Single-molecule analysis of protein-free U2–U6 snRNAs. Nat Struct Mol Biol 16: 1154–1159. [DOI] [PMC free article] [PubMed] [Google Scholar]
- Hammar P, Leroy P, Mahmutovic A, Marklund EG, Berg OG, Elf J. 2012. The lac repressor displays facilitated diffusion in living cells. Science 336: 1595–1598. [DOI] [PubMed] [Google Scholar]
- Hawley DK, Roeder RG. 1987. Functional steps in transcription initiation and reinitiation from the major late promoter in a HeLa nuclear extract. J Biol Chem 262: 3452–3461. [PubMed] [Google Scholar]
- He Y, Yan C, Fang J, Inouye C, Tjian R, Ivanov I, Nogales E. 2016. Near-atomic resolution visualization of human transcription promoter opening. Nature 533: 1–21. [DOI] [PMC free article] [PubMed] [Google Scholar]
- Hodges C, Bintu L, Lubkowska L, Kashlev M, Bustamante C. 2009. Nucleosomal fluctuations govern the transcription dynamics of RNA polymerase II. Science 325: 626–628. [DOI] [PMC free article] [PubMed] [Google Scholar]
- Hornung G, Bar-Ziv R, Rosin D, Tokuriki N, Tawfik DS, Oren M, Barkai N. 2012. Noise-mean relationship in mutated promoters. Genome Res 22: 2409–2417. [DOI] [PMC free article] [PubMed] [Google Scholar]
- Hoskins AA, Moore MJ. 2012. The spliceosome: a flexible, reversible macromolecular machine. Trends Biochem Sci 37: 179–188. [DOI] [PMC free article] [PubMed] [Google Scholar]
- Hoskins AA, Friedman LJ, Gallagher SS, Crawford DJ, Anderson EG, Wombacher R, Ramirez N, Cornish VW, Gelles J, Moore MJ. 2011. Ordered and dynamic assembly of single spliceosomes. Science 331: 1289–1296. [DOI] [PMC free article] [PubMed] [Google Scholar]
- Huang B, Babcock H, Zhuang X. 2010. Breaking the diffraction barrier: super-resolution imaging of cells. Cell 143: 1047–1058. [DOI] [PMC free article] [PubMed] [Google Scholar]
- Ishibashi T, Dangkulwanich M, Coello Y, Lionberger TA, Lubkowska L, Ponticelli AS, Kashlev M, Bustamante C. 2014. Transcription factors IIS and IIF enhance transcription efficiency by differentially modifying RNA polymerase pausing dynamics. Proc Natl Acad Sci 111: 3419–3424. [DOI] [PMC free article] [PubMed] [Google Scholar]
- Izeddin I, Récamier V, Bosanac L, Cissé II, Boudarene L, Dugast-Darzacq C, Proux F, Bénichou O, Voituriez R, Bensaude O, et al. 2014. Single-molecule tracking in live cells reveals distinct target-search strategies of transcription factors in the nucleus. Elife 2014: 1–27. [DOI] [PMC free article] [PubMed] [Google Scholar]
- Janicki SM, Tsukamoto T, Salghetti SE, Tansey WP, Sachidanandam R, Prasanth KV, Ried T, Shav-Tal Y, Bertrand E, Singer RH, et al. 2004. From silencing to gene expression: real-time analysis in single cells. Cell 116: 683–698. [DOI] [PMC free article] [PubMed] [Google Scholar]
- Jonkers I, Lis JT. 2015. Getting up to speed with transcription elongation by RNA polymerase II. Nat Rev Mol Cell Biol 16: 167–177. [DOI] [PMC free article] [PubMed] [Google Scholar]
- Joo C, Balci H, Ishitsuka Y, Buranachai C, Ha T. 2008. Advances in single-molecule fluorescence methods for molecular biology. Annu Rev Biochem 77: 51–76. [DOI] [PubMed] [Google Scholar]
- Kapanidis AN, Margeat E, Ho SO, Kortkhonjia E, Weiss S, Ebright RH. 2006. Initial transcription by RNA polymerase proceeds through a DNA-scrunching mechanism. Science 314: 1144–1147. [DOI] [PMC free article] [PubMed] [Google Scholar]
- Karpova TS, Kim MJ, Spriet C, Nalley K, Stasevich TJ, Kherrouche Z, Heliot L, Mcnally JG. 2008. Concurrent fast and slow cycling. Science 319: 466–469. [DOI] [PubMed] [Google Scholar]
- Kieffer-Kwon KR, Tang Z, Mathe E, Qian J, Sung MH, Li G, Resch W, Baek S, Pruett N, Grontved L, et al. 2013. Interactome maps of mouse gene regulatory domains reveal basic principles of transcriptional regulation. Cell 155: 1507–1520. [DOI] [PMC free article] [PubMed] [Google Scholar]
- Ko MS, Nakauchi H, Takahashi N. 1990. The dose-dependence of glucocorticoid-inducible gene expression results from the change in the number of transcriptionally active templates. EMBO J 9: 2835–2842. [DOI] [PMC free article] [PubMed] [Google Scholar]
- Krishnan R, Blanco MR, Kahlscheuer ML, Abelson J, Guthrie C, Walter NG. 2013. Biased Brownian ratcheting leads to pre-mRNA remodeling and capture prior to first-step splicing. Nat Struct Mol Biol 20: 1450–1457. [DOI] [PMC free article] [PubMed] [Google Scholar]
- Krummel B, Chamberlin MJ. 1989. RNA chain initiation by Escherichia coli RNA polymerase: structural transitions of the enzyme in early ternary complexes. Biochemistry 28: 7829–7842. [DOI] [PubMed] [Google Scholar]
- Landick R, Carey J, Yanofsky C. 1987. Detection of transcription-pausing in vivo in the trp operon leader region. Proc Natl Acad Sci 84: 1507–1511. [DOI] [PMC free article] [PubMed] [Google Scholar]
- Larson MH, Greenleaf WJ, Landick R, Block SM. 2008. Applied force reveals mechanistic and energetic details of transcription termination. Cell 132: 971–982. [DOI] [PMC free article] [PubMed] [Google Scholar]
- Larson DR, Zenklusen D, Wu B, Chao JA, Singer RH. 2011. Real-time observation of transcription initiation and elongation on an endogenous yeast gene. Science 332: 275–278. [DOI] [PMC free article] [PubMed] [Google Scholar]
- Larson DR, Fritzsch C, Sun L, Meng X, Lawrence DS, Singer RH. 2013. Direct observation of frequency modulated transcription in single cells using light activation. Elife 2: e00750. [DOI] [PMC free article] [PubMed] [Google Scholar]
- Larson MH, Mooney RA, Peters JM, Windgassen T, Nayak D, Gross CA, Block SM, Greenleaf WJ, Landick R, Weissman JS. 2014. A pause sequence enriched at translation start sites drives transcription dynamics in vivo. Science 344: 1042–1047. [DOI] [PMC free article] [PubMed] [Google Scholar]
- Lee DJ, Minchin SD, Busby SJW. 2012. Activating transcription in bacteria. Annu Rev Microbiol 66: 125–152. [DOI] [PubMed] [Google Scholar]
- Lenstra TL, Coulon A, Chow CC, Larson DR. 2015. Single-molecule imaging reveals a switch between spurious and functional ncRNA transcription. Mol Cell 60: 597–610. [DOI] [PMC free article] [PubMed] [Google Scholar]
- Li GW, Xie XS. 2011. Central dogma at the single-molecule level in living cells. Nature 475: 308–315. [DOI] [PMC free article] [PubMed] [Google Scholar]
- Li G, Ruan X, Auerbach RK, Sandhu KS, Zheng M, Wang P, Poh HM, Goh Y, Lim J, Zhang J, et al. 2012. Extensive promoter-centered chromatin interactions provide a topological basis for transcription regulation. Cell 148: 84–98. [DOI] [PMC free article] [PubMed] [Google Scholar]
- Lionnet T, Czaplinski K, Darzacq X, Shav-Tal Y, Wells AL, Chao JA, Park HY, de Turris V, Lopez-Jones M, Singer RH. 2011. A transgenic mouse for in vivo detection of endogenous labeled mRNA. Nat Methods 8: 165–170. [DOI] [PMC free article] [PubMed] [Google Scholar]
- Little SC, Tikhonov M, Gregor T. 2013. Precise developmental gene expression arises from globally stochastic transcriptional activity. Cell 154: 789–800. [DOI] [PMC free article] [PubMed] [Google Scholar]
- Liu Z, Legant WR, Chen B-C, Li L, Grimm JB, Lavis LD, Betzig E, Tjian R. 2014. 3D imaging of Sox2 enhancer clusters in embryonic stem cells. Elife 3: 1–29. [DOI] [PMC free article] [PubMed] [Google Scholar]
- Liu Z, Lavis LD, Betzig E. 2015. Imaging live-cell dynamics and structure at the single-molecule level. Mol Cell 58: 644–659. [DOI] [PubMed] [Google Scholar]
- Lucas JS, Zhang Y, Dudko OK, Murre C. 2014. 3D trajectories adopted by coding and regulatory DNA elements: first-passage times for genomic interactions. Cell 158: 339–352. [DOI] [PMC free article] [PubMed] [Google Scholar]
- Luo Y, North JA, Rose SD, Poirier MG. 2014. Nucleosomes accelerate transcription factor dissociation. Nucleic Acids Res 42: 3017–3027. [DOI] [PMC free article] [PubMed] [Google Scholar]
- Ma J, Bai L, Wang MD. 2013. Transcription under torsion. Science 340: 1580–1583. [DOI] [PMC free article] [PubMed] [Google Scholar]
- Martin RM, Rino J, Carvalho C, Kirchhausen T, Carmo-Fonseca M. 2013. Live-cell visualization of pre-mRNA splicing with single-molecule sensitivity. Cell Rep 4: 1144–1155. [DOI] [PMC free article] [PubMed] [Google Scholar]
- Mazza D, Abernathy A, Golob N, Morisaki T, McNally JG. 2012. A benchmark for chromatin binding measurements in live cells. Nucleic Acids Res 40: 1–13. [DOI] [PMC free article] [PubMed] [Google Scholar]
- McKnight SL, Miller OL Jr. 1979. Post-replicative nonribosomal transcription units in D. melanogaster embryos. Cell 17: 551–563. [DOI] [PubMed] [Google Scholar]
- Miller OL, Bakken A. 1972. Morphological studies of transcription. Acta Endocrinol 71: S155–S177. [DOI] [PubMed] [Google Scholar]
- Morisaki T, Müller WG, Golob N, Mazza D, McNally JG. 2014. Single-molecule analysis of transcription factor binding at transcription sites in live cells. Nat Commun 5: 4456. [DOI] [PMC free article] [PubMed] [Google Scholar]
- Murakami K, Elmlund H, Kalisman N, Bushnell DA, Adams CM, Azubel M, Elmlund D, Levi-Kalisman Y, Liu X, Gibbons BJ, et al. 2013. Architecture of an RNA polymerase II transcription pre-initiation complex. Science 342: 1238724. [DOI] [PMC free article] [PubMed] [Google Scholar]
- Muramoto T, Müller I, Thomas G, Melvin A, Chubb JR. 2010. Methylation of H3K4 is required for inheritance of active transcriptional states. Curr Biol 20: 397–406. [DOI] [PubMed] [Google Scholar]
- Nagano T, Lubling Y, Stevens TJ, Schoenfelder S, Yaffe E, Dean W, Laue ED, Tanay A, Fraser P. 2013. Single-cell Hi-C reveals cell-to-cell variability in chromosome structure. Nature 502: 59–64. [DOI] [PMC free article] [PubMed] [Google Scholar]
- Neher E, Sakmann B. 1976. Single-channel currents recorded from membrane of denervated frog muscle fibres. Nature 260: 799–802. [DOI] [PubMed] [Google Scholar]
- Neuman KC, Abbondanzieri EA, Landick R, Gelles J, Block SM. 2003. Ubiquitous transcriptional pausing is independent of RNA polymerase backtracking. Cell 115: 437–447. [DOI] [PubMed] [Google Scholar]
- Newman JRS, Ghaemmaghami S, Ihmels J, Breslow DK, Noble M, DeRisi JL, Weissman JS. 2006. Single-cell proteomic analysis of S. cerevisiae reveals the architecture of biological noise. Nature 441: 840–846. [DOI] [PubMed] [Google Scholar]
- Nora EP, Lajoie BR, Schulz EG, Giorgetti L, Okamoto I, Servant N, Piolot T, van Berkum NL, Meisig J, Sedat J, et al. 2012. Spatial partitioning of the regulatory landscape of the X-inactivation centre. Nature 485: 381–385. [DOI] [PMC free article] [PubMed] [Google Scholar]
- Normanno D, Boudarène L, Dugast-Darzacq C, Chen J, Richter C, Proux F, Bénichou O, Voituriez R, Darzacq X, Dahan M. 2015. Probing the target search of DNA-binding proteins in mammalian cells using TetR as model searcher. Nat Commun 6: 7357. [DOI] [PMC free article] [PubMed] [Google Scholar]
- Orphanides G, Weinberg D. 2002. A unified theory of gene expression. Cell 108: 439–451. [DOI] [PubMed] [Google Scholar]
- Osborne CS, Chakalova L, Brown KE, Carter D, Horton A, Debrand E, Goyenechea B, Mitchell JA, Lopes S, Reik W, et al. 2004. Active genes dynamically colocalize to shared sites of ongoing transcription. Nat Genet 36: 1065–1071. [DOI] [PubMed] [Google Scholar]
- Padovan-Merhar O, Nair GP, Biaesch AG, Mayer A, Scarfone S, Foley SW, Wu AR, Churchman LS, Singh A, Raj A. 2015. Single mammalian cells compensate for differences in cellular volume and DNA copy number through independent global transcriptional mechanisms. Mol Cell 58: 339–352. [DOI] [PMC free article] [PubMed] [Google Scholar]
- Pal M, Ponticelli AS, Luse DS. 2005. The role of the transcription bubble and TFIIB in promoter clearance by RNA polymerase II. Mol Cell 19: 101–110. [DOI] [PubMed] [Google Scholar]
- Palangat M, Larson DR. 2012. Complexity of RNA polymerase II elongation dynamics. Biochim Biophys Acta 1819: 667–672. [DOI] [PMC free article] [PubMed] [Google Scholar]
- Palangat M, Larson MH, Hu X, Gnatt A, Block SM, Landick R. 2012. Efficient reconstitution of transcription elongation complexes for single-molecule studies of eukaryotic RNA polymerase II. Transcription 3: 146–153. [DOI] [PMC free article] [PubMed] [Google Scholar]
- Paulsson J. 2004. Summing up the noise in gene networks. Nature 427: 415–418. [DOI] [PubMed] [Google Scholar]
- Peccoud J, Ycart B. 1995. Markovian modeling of gene-product synthesis. Theor Popul Biol 48: 222–234. [Google Scholar]
- Piston DW, Kremers G-J. 2007. Fluorescent protein FRET: the good, the bad and the ugly. Trends Biochem Sci 32: 407–414. [DOI] [PubMed] [Google Scholar]
- Raj A, Peskin CS, Tranchina D, Vargas DY, Tyagi S. 2006. Stochastic mRNA synthesis in mammalian cells. PLoS Biol 4: e309. [DOI] [PMC free article] [PubMed] [Google Scholar]
- Revyakin A, Liu C, Ebright RH, Strick TR. 2006. Abortive initiation and productive initiation by RNA polymerase involve DNA scunching. Science 314: 1139–1143. [DOI] [PMC free article] [PubMed] [Google Scholar]
- Revyakin A, Zhang Z, Coleman RA, Li Y, Inouye C, Lucas JK, Park S-R, Chu S, Tjian R. 2012. Transcription initiation by human RNA polymerase II visualized at single-molecule resolution. Genes Dev 26: 1691–1702. [DOI] [PMC free article] [PubMed] [Google Scholar]
- Richter PH, Eigen M. 1974. Diffusion controlled reaction rates in spheroidal geometry. Biophys Chem 2: 255–263. [DOI] [PubMed] [Google Scholar]
- Riggs AD, Bourgeois S, Cohn M. 1970. The lac repressor-operator interaction. J Mol Biol 53: 401–417. [DOI] [PubMed] [Google Scholar]
- Robb NC, Cordes T, Hwang LC, Gryte K, Duchi D, Craggs TD, Santoso Y, Weiss S, Ebright RH, Kapanidis AN. 2013. The transcription bubble of the RNA polymerase–promoter open complex exhibits conformational heterogeneity and millisecond-scale dynamics: implications for transcription start-site selection. J Mol Biol 425: 875–885. [DOI] [PMC free article] [PubMed] [Google Scholar]
- Sainsbury S, Bernecky C, Cramer P. 2015. Structural basis of transcription initiation by RNA polymerase II. Nat Rev Mol Cell Biol 16: 129–143. [DOI] [PubMed] [Google Scholar]
- Schafer DA, Gelles J, Sheetz MP, Landick R. 1991. Transcription by single molecules of RNA polymerase observed by light microscopy. Nature 352: 444–448. [DOI] [PubMed] [Google Scholar]
- Schermelleh L, Heintzmann R, Leonhardt H. 2010. A guide to super-resolution fluorescence microscopy. J Cell Biol 190: 165–175. [DOI] [PMC free article] [PubMed] [Google Scholar]
- Schmidt U, Basyuk E, Robert MC, Yoshida M, Villemin JP, Auboeuf D, Aitken S, Bertrand E. 2011. Real-time imaging of cotranscriptional splicing reveals a kinetic model that reduces noise: implications for alternative splicing regulation. J Cell Biol 193: 819–829. [DOI] [PMC free article] [PubMed] [Google Scholar]
- Schweikhard V, Meng C, Murakami K, Kaplan CD, Kornberg RD, Block SM. 2014. Transcription factors TFIIF and TFIIS promote transcript elongation by RNA polymerase II by synergistic and independent mechanisms. Proc Natl Acad Sci 111: 6642–6647. [DOI] [PMC free article] [PubMed] [Google Scholar]
- Semlow DR, Blanco MR, Walter NG, Staley JP. 2016. Spliceosomal DEAH-box ATPases remodel pre-mRNA to activate alternative splice sites. Cell 164: 985–998. [DOI] [PMC free article] [PubMed] [Google Scholar]
- Shachar S, Voss TC, Pegoraro G, Sciascia N, Misteli T. 2015. Identification of gene positioning factors using high-throughput imaging mapping. Cell 162: 911–923. [DOI] [PMC free article] [PubMed] [Google Scholar]
- Shaevitz JW, Abbondanzieri EA, Landick R, Block SM. 2003. Backtracking by single RNA polymerase molecules observed at near-base-pair resolution. Nature 426: 684–687. [DOI] [PMC free article] [PubMed] [Google Scholar]
- Shahrezaei V, Swain PS. 2008. Analytical distributions for stochastic gene expression. Proc Natl Acad Sci 105: 17256–17261. [DOI] [PMC free article] [PubMed] [Google Scholar]
- Shcherbakova I, Hoskins AA, Friedman LJ, Serebrov V, Correa IR Jr, Xu MQ, Gelles J, Moore MJ. 2013. Alternative spliceosome assembly pathways revealed by single-molecule fluorescence microscopy. Cell Rep 5: 151–165. [DOI] [PMC free article] [PubMed] [Google Scholar]
- So L, Ghosh A, Zong C, Sepulveda LA, Segev R, Golding I. 2011. General properties of transcriptional time series in Escherichia coli. Nat Genet 43: 554–560. [DOI] [PMC free article] [PubMed] [Google Scholar]
- Stevense M, Muramoto T, Müller I, Chubb JR. 2010. Digital nature of the immediate-early transcriptional response. Development 137: 579–584. [DOI] [PMC free article] [PubMed] [Google Scholar]
- Stoeger T, Battich N, Pelkmans L. 2016. Passive noise filtering by cellular compartmentalization. Cell 164: 1151–1161. [DOI] [PubMed] [Google Scholar]
- Straney DC, Crothers DM. 1987. A stressed intermediate in the formation of stably initiated RNA chains at the Escherichia coli lac UV5 promoter. J Mol Biol 193: 267–278. [DOI] [PubMed] [Google Scholar]
- Studitsky VM, Clark DJ, Felsenfeld G. 1994. A histone octamer can step around a transcribing polymerase without leaving the template. Cell 76: 371–382. [DOI] [PubMed] [Google Scholar]
- Studitsky VM, Kassavetis GA, Geiduschek EP, Felsenfeld G. 1997. Mechanism of transcription through the nucleosome by eukaryotic RNA polymerase. Science 278: 1960–1963. [DOI] [PubMed] [Google Scholar]
- Swinstead EE, Miranda TB, Paakinaho V, Baek S, Goldstein I, Hawkins M, Karpova TS, Ball D, Mazza D, Lavis LD, et al. 2016. Steroid receptors reprogram FoxA1 occupancy through dynamic chromatin transitions. Cell 165: 593–605. [DOI] [PMC free article] [PubMed] [Google Scholar]
- Tafvizi A, Huang F, Leith JS, Fersht AR, Mirny LA, van Oijen AM. 2008. Tumor suppressor p53 slides on DNA with low friction and high stability. Biophys J 95: L01–L03. [DOI] [PMC free article] [PubMed] [Google Scholar]
- Therizols P, Illingworth RS, Courilleau C, Boyle S, Wood AJ, Bickmore WA. 2014. Chromatin decondensation is sufficient to alter nuclear organization in embryonic stem cells. Science 346: 1238–1242. [DOI] [PMC free article] [PubMed] [Google Scholar]
- Tolić-Nørrelykke SF, Engh AM, Landick R, Gelles J. 2004. Diversity in the rates of transcript elongation by single RNA polymerase molecules. J Biol Chem 279: 3292–3299. [DOI] [PubMed] [Google Scholar]
- Trapnell C. 2015. Defining cell types and states with single-cell genomics. Genome Res 25: 1491–1498. [DOI] [PMC free article] [PubMed] [Google Scholar]
- Vargas DY, Shah K, Batish M, Levandoski M, Sinha S, Marras SAE, Schedl P, Tyagi S. 2011. Single-molecule imaging of transcriptionally coupled and uncoupled splicing. Cell 147: 1054–1065. [DOI] [PMC free article] [PubMed] [Google Scholar]
- Voss TC, Schiltz RL, Sung MH, Yen PM, Stamatoyannopoulos JA, Biddie SC, Johnson TA, Miranda TB, John S, Hager GL. 2011. Dynamic exchange at regulatory elements during chromatin remodeling underlies assisted loading mechanism. Cell 146: 544–554. [DOI] [PMC free article] [PubMed] [Google Scholar]
- Wan R, Yan C, Bai R, Wang L, Huang M, Wong CC, Shi Y. 2016. The 3.8 A structure of the U4/U6.U5 tri-snRNP: insights into spliceosome assembly and catalysis. Science 351: 466–475. [DOI] [PubMed] [Google Scholar]
- Wang YM, Austin RH, Cox EC. 2006. Single molecule measurements of repressor protein 1D diffusion on DNA. Phys Rev Lett 97: 048302. [DOI] [PubMed] [Google Scholar]
- Wang Y, Guo L, Golding I, Cox EC, Ong NP. 2009. Quantitative transcription factor binding kinetics at the single-molecule level. Biophys J 96: 609–620. [DOI] [PMC free article] [PubMed] [Google Scholar]
- Wang F, Redding S, Finkelstein IJ, Gorman J, Reichman DR, Greene EC. 2013. The promoter-search mechanism of Escherichia coli RNA polymerase is dominated by three-dimensional diffusion. Nat Struct Mol Biol 20: 174–181. [DOI] [PMC free article] [PubMed] [Google Scholar]
- White MR, Masuko M, Amet L, Elliott G, Braddock M, Kingsman AJ, Kingsman SM. 1995. Real-time analysis of the transcriptional regulation of HIV and hCMV promoters in single mammalian cells. J Cell Sci 108: 441–455. [DOI] [PubMed] [Google Scholar]
- White MD, Angiolini JF, Alvarez YD, Kaur G, Zhao ZW, Mocskos E, Bruno L, Bissiere S, Levi V, Plachta N. 2016. Long-lived binding of Sox2 to DNA predicts cell fate in the four-cell mouse embryo. Cell 165: 75–87. [DOI] [PubMed] [Google Scholar]
- Williamson I, Berlivet S, Eskeland R, Boyle S, Illingworth RS, Paquette D, Dostie J, Bickmore WA. 2014. Spatial genome organization: contrasting views from chromosome conformation capture and fluorescence in situ hybridization. Genes Dev 28: 2778–2791. [DOI] [PMC free article] [PubMed] [Google Scholar]
- Winkelman JT, Vvedenskaya IO, Zhang Y, Zhang Y, Bird JG, Taylor DM, Gourse RL, Ebright RH, Nickels BE. 2016. Multiplexed protein-DNA cross-linking: scrunching in transcription start site selection. Science 351: 1090–1093. [DOI] [PMC free article] [PubMed] [Google Scholar]
- Yan C, Hang J, Wan R, Huang M, Wong CC, Shi Y. 2015. Structure of a yeast spliceosome at 3.6-angstrom resolution. Science 349: 1182–1191. [DOI] [PubMed] [Google Scholar]
- Yin H, Artsimovitch I, Landick R, Gelles J. 1999. Nonequilibrium mechanism of transcription termination from observations of single RNA polymerase molecules. Proc Natl Acad Sci 96: 13124–13129. [DOI] [PMC free article] [PubMed] [Google Scholar]
- Yudkovsky N, Ranish JA, Hahn S. 2000. A transcription reinitiation intermediate that is stabilized by activator. Nature 408: 225–229. [DOI] [PubMed] [Google Scholar]
- Yunger S, Rosenfeld L, Garini Y, Shav-Tal Y. 2010. Single-allele analysis of transcription kinetics in living mammalian cells. Nat Methods 7: 631–633. [DOI] [PubMed] [Google Scholar]
- Zenklusen D, Larson DR, Singer RH. 2008. Single-RNA counting reveals alternative modes of gene expression in yeast. Nat Struct Mol Biol 15: 1263–1271. [DOI] [PMC free article] [PubMed] [Google Scholar]
- Zhang Z, Revyakin A, Grimm JB, Lavis LD, Tjian R. 2014. Single-molecule tracking of the transcription cycle by sub-second RNA detection. Elife 3: 1–20. [DOI] [PMC free article] [PubMed] [Google Scholar]
- Zhao ZW, Roy R, Gebhardt JCM, Suter DM, Chapman AR, Xie XS. 2014. Spatial organization of RNA polymerase II inside a mammalian cell nucleus revealed by reflected light-sheet superresolution microscopy. Proc Natl Acad Sci 111: 681–686. [DOI] [PMC free article] [PubMed] [Google Scholar]