

Abstract
Adenylosuccinate lyase (ADSL) deficiency is a rare inborn error of metabolism resulting in accumulation of metabolites including succinylaminoimidazole carboxamide riboside (SAICAr) and succinyladenosine (S-Ado) in the brain and other tissues. Patients with ADSL have progressive psychomotor retardation, neonatal seizures, global developmental delay, hypotonia, and autistic features, although variable clinical manifestations may make the initial diagnosis challenging. Two cases of the severe form of the disease are reported here: an 18-month-old boy with global developmental delay, intractable neonatal seizures, progressive cerebral atrophy, and marked hypomyelination, and a 3-month-old girl presenting with microcephaly, neonatal seizures, and marked psychomotor retardation. In both patients in vivo proton magnetic resonance spectroscopy (MRS) showed the presence of S-Ado signal at 8.3 ppm, consistent with a prior report. Interestingly, SAICAr signal was also detectable at 7.5 ppm in affected white matter, which has not been reported in vivo before. A novel splice-site mutation, c.IVS12 + 1/G > C, in the ADSL gene was identified in the second patient. Our findings confirm the utility of in vivo proton MRS in suggesting a specific diagnosis of ADSL deficiency, and also demonstrate an additional in vivo resonance (7.5 ppm) of SAICAr in the cases of severe disease.
Keywords: adenylosuccinate lyase deficiency, proton MR spectroscopy, MRI, neonatal seizures
A rare autosomal recessive neurodegenerative disease, adenylosuccinate lyase (ADSL) deficiency, is an inborn error of metabolism involving the de novo purine pathway (1). ADSL deficiency was first described in 1984 in a group of children with mental retardation and seizures (2). Approximately 60 cases have been reported (3) with a high prevalence of missense mutations leading to impairment of ADSL enzymatic activity (4,5).
Mutations in the ADSL gene located on chromosome 22q13.1-q13.2 have been described (6). Deficiency of ADSL enzyme occurs in most body fluids and cells, reaching nearly undetectable levels in liver and kidney (1). The defect is apparent in two steps of purine synthesis: converting succinylaminoimidazolecarboxamide ribonucleotide (SAICAR) into aminoimidazolecarboxamide ribonucleotide (AICAR), and succinyladenosine monophosphate (S-AMP) into adenosine monophosphate (AMP). The defect results in the accumulation of succinylaminoimidazolecarboxamide riboside (SAICAr) and succinyladenosine (S-Ado), which are the normally undetectable dephosphorylation products of SAICAR and S-AMP, respectively. These excess metabolites can be detected in cerebrospinal fluid (CSF), urine, and, to a lesser extent, plasma. Deleterious effects of ADSL deficiency may be attributable to the deficiency of biosynthesis of purine metabolites, overloading of potentially toxic intermediate metabolites with secondary impairment of energy metabolism (1,7).
Variable clinical expression is observed in patients with ADSL deficiency. Clinical features include psychomotor retardation, neonatal seizures, global developmental delay, hypotonia, and autistic features. Three distinct clinical phenotypes have been described according to the onset and severity of symptoms (8). Symptoms are severe in type I and relatively moderate to mild in type II form (9). A neonatal form has also been reported, in which patients present with severe neonatal encephalopathy with refractory seizures and respiratory failure resulting in death in the first few weeks of life (8,10). The S-Ado/SAICAr ratios in CSF are inversely correlated with clinical severity. S-Ado/SAICAr ratios < 1 are observed in the neonatal fatal form. Ratios around 1 are typically detectable in type I (severe form), whereas ratios above 2 are found in type II (moderate to mild form) (1,8,9).
The Bratton-Marschall assay on urine for diazotizable amines can be used to diagnose this condition (11). However, high rates of false-positive results are observed due to certain medications normally taken by patients. Therefore, high-performance liquid chromatography (HPLC) analysis is used to confirm the diagnosis by detection of both SAICAr and S-Ado in body fluids. High-resolution in vitro nuclear magnetic resonance (NMR) spectroscopy of CSF or urine can also be very useful to measure S-Ado and SAICAr concentrations precisely (12,13). Furthermore, mutation analysis of the ADSL gene is available as an important diagnostic test, and a prior study has also reported the presence of detectable S-Ado signal in the brain using in vivo magnetic resonance spectroscopy (MRS) (14,15).
ADSL deficiency is characterized by a progressive neurodegenerative course resulting in increased morbidity and mortality. To date, there is no effective therapy for ADSL deficiency (7), with supportive and symptomatic treatment as the goal to promote quality of life for patients and families. Some attempts to correct the biochemical consequences of this disorder have been made. The use of allopurinol and oral supplements of adenine in order to replenish decreased concentrations of adenine nucleotides result in no improvement in patient symptoms (1). Nevertheless, early diagnosis allows a better understanding and care of patients and families. With early diagnosis these patients may benefit from potential effective interventions in the future.
Here we report the proton MRS and MRI findings of two affected infants with ADSL deficiency presenting with refractory epileptic encephalopathy.
CLINICAL REPORT
Case 1
This patient was the first male child born to healthy, nonconsanguineous parents at 41 weeks gestation after an uncomplicated pregnancy. Meconium-stained fluid and a nonvigorous infant were noted at delivery and his birthweight was 4.1 kg (75th percentile). Seizures that started in the newborn period were initially controlled successfully with phenobarbital. He was then weaned off after a short seizure-free period. However, soon after discontinuing the medication seizures restarted and became refractory. He was noted to have complex partial seizures at 11 months of age along with infantile spasms. At 13 months the electroencephalogram (EEG) pattern evolved to hypsarrhythmia. The infantile spasms failed to respond to ketogenic diet, while seizures were improved only transiently with a course of steroids. The complex partial seizures have been resistant to multiple anticonvulsants. In addition, the patient presented with global developmental delay and progressive psychomotor retardation. At 13 months he achieved some degree of head control, could hold objects, but was unable to transfer hand-to-hand. In terms of language, he was also cooing and able to smile responsively. By 21 months of age signs of neuroregression were evident as loss of motor and language milestones were noted. Serial neurologic assessments revealed progression of axial hypotonia advancing to peripheral spasticity and opisthotonus posturing episodes. The extensive genetics work-up was unremarkable. Ultimately, urine, plasma, and CSF samples were sent for NMR studies and showed increased levels of S-Ado and SAICAr in urine and CSF, which was diagnostic for ADSL deficiency. The ratio S-Ado/SAICAr metabolites was ~1, correlating with the severe form (Table 1 patient 1). The c.736 A > G/K246E mutation was confirmed in one allele of the ADSL gene of one of the parents. This mutation was already reported in a patient with severe phenotype of ADSL deficiency (4). The mutation in the second allele was not found in full genomic exon sequencing including 20–25 bp of exon-intron boundaries. The ADSL mRNA sequence also failed to reveal any sequence alteration.
Table 1.
Fluid NMR Spectroscopy Result
Case 2
The patient was a female first-born child to healthy nonconsanguineous parents, with prenatal ultrasound significant for microcephaly. She was born at 41 weeks gestation via vaginal delivery assisted by vacuum extraction. Her birthweight was 3610 g (50th percentile) and head circumference was 32.8 cm (3rd percentile). At birth she presented with severe respiratory distress, with Apgar scores of 1, 4, and 6 at 1, 5, and 10 minutes. Seizures started within 48 hours after birth and were initially attributed to asphyxia. The constellation of clinical features including microcephaly and an aberrant immature gyration pattern on brain MRI, however, suggested an alternative or additional etiology for the neonatal seizures. The patient subsequently developed medically refractory epilepsy and severe psychomotor retardation. At the age of 6 months she had frequent seizures and infantile spasms. Anticonvulsants included phenobarbital, levetiracetam, clonazepam, and valproic acid. EEG confirmed epileptic encephalopathy. She was able to drink by herself, make partial eye contact, and had severe axial hypotonia with spasticity of upper and lower extremities. At 15 months of age she remained with severe hypotonia and gained no head control. She still suffered from multiple epileptic seizures daily. Genetic analysis with single nucleotide polymorphism (SNP) array showed a de novo 280 kb deletion in chromosome 2p16.3. At 3 months of age urine, plasma, and CSF samples were analyzed with in vitro NMR, showing increased levels of S-Ado and SAICAr in urine and CSF, consistent with the diagnosis for ADSL deficiency (Table 1 patient 2). The ratio S-Ado/SAICAr metabolites was ~1, correlating with the severe form (type I) of this condition. ADSL gene molecular analysis showed one missense mutation, c.802 G > A/D268N, also found in the father’s ADSL gene sequencing. This mutation was described in one patient previously (16). The second mutation was found in the donor splice site of intron 12, c.IVS12 + 1/G > C. This novel mutation was also found in the mother’s DNA.
BRAIN MRI AND IN VIVO PROTON MRS
Case 1
Conventional 1.5 T brain MRI (Siemens Avanto, Erlangen, Germany) including sagittal T1, axial T2, and FLAIR) showed global hypomyelination with parenchymal volume loss and enlargement of the ventricles, which rapidly progressed during the first year of life (Fig. 1). At 18 months of age, single-voxel MRS was performed with the PRESS sequence at 1.5 T (TR/TE = 1500/135 msec, 2 × 2 × 2 mL voxel size, 128 averages) in two regions: thalamus and occipitoparietal white matter (WM) region. MRS of metabolites normally observed at long TE including choline (Cho), creatine (Cr), and N-acetyl aspartate (NAA) was unremarkable (peak area ratios; thalamus: NAA/Cr =1.24, Cho/Cr = 1.41, occipitoparietal WM: NAA/Cr = 0.99, Cho/Cr = 0.91). However, the WM spectrum exhibited a peak at 8.3 ppm attributable to S-Ado, as well as a peak at 7.5 ppm, assigned to SAICAr (Fig. 2a); these peaks were not clearly visible in the spectrum from the thalamus (Fig. 2b). These peaks are not observed in MRS of the brain in normal subjects, as has been demonstrated previously (15).
Figure 1.
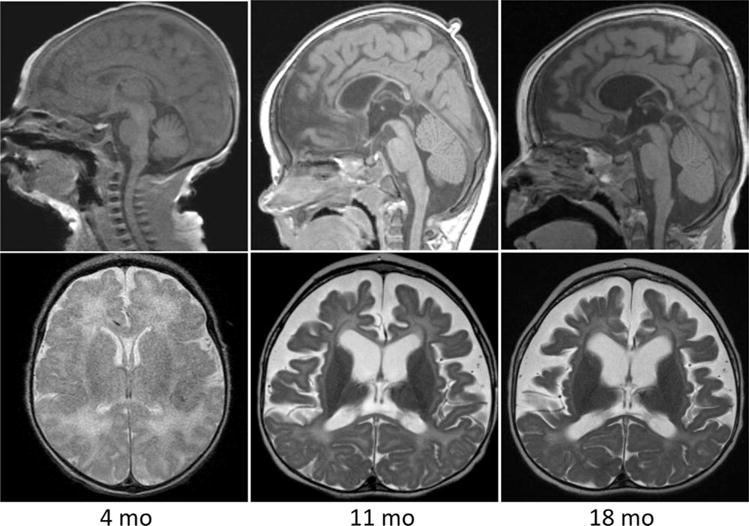
Sagittal T1 and axial T2-weighted images of the brain obtained at 4, 11, and 18 months of age in patient 1. Overall images were unremarkable at 4 months. At 11 months there is dramatic cortical and white matter volume loss with a thin corpus callosum and profound hypomyelination. At 18 months there is persistent diffuse hypomyelination, microcephaly, and global volume loss.
Figure 2.
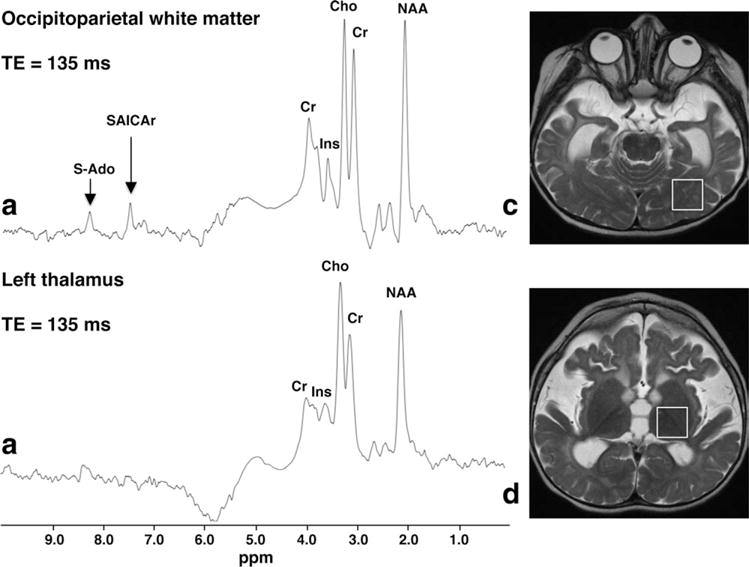
Single-voxel proton MRS (TR/TE 1500/135 msec) obtained at 1.5 T from the left occipitoparietal region (a) and thalamus (b) of patient 1 at the age of 18 months. Corresponding ROIs are shown in (c,d), respectively. The thalamus spectrum (b) is unremarkable, but the WM spectrum (a) clearly shows abnormally elevated peaks at 8.3 and 7.5 ppm, which are assigned to S-Ado and SAICAr, respectively.
Case 2
At 3 months of age conventional 3 T brain MRI (Siemens TRIO, including sagittal T1, axial T2, and FLAIR) showed simplified gyration pattern, delayed myelination with hyperintense occipital white matter on T2-weighted images (Fig. 3). MR spectra were acquired at 3 T from a single voxel of ~5 mL (1.4 × 2 × 1.8 cm) positioned in the periventricular occipital WM using a PRESS sequence with and without water suppression, and acquired at two echo times (TR/TE = 6000/30 msec, 64 averages, and TR/TE = 2000/136 msec, 128 averages). Relative brain metabolite concentrations (for Cho, NAA, myo-inositol [Ins], and the sum of glutamate and glutamine [Glx] relative to Cr) were determined using the LCModel software (17): Cho/Cr = 0.43, NAA/Cr = 0.77, Ins/Cr = 1.27, and Glx/Cr = 1.66. These relative concentrations were compared with reference values (Cho/Cr = 0.43 ± 0.07, NAA/Cr = 1.11 ± 0.20, Ins/Cr = 1.38 ± 0.47, and Glx/Cr = 1.99 ± 0.4; mean ± SD) obtained in a group of eight subjects of comparable age (3.34 ± 1.00 months; mean ± SD) who underwent cerebral screening with MRS and for whom no brain pathologies were reported. It should be noted that in this age group quite large differences in metabolite concentrations occur as a function of age due to differences in the degree of myelination. Although the relative concentration of NAA is rather low in the current ADSL subject, all relative metabolite concentrations were found to be in the normal range (mean ± 2SD).
Figure 3.
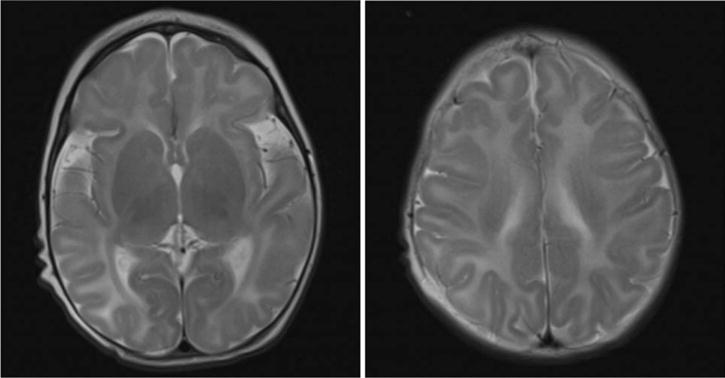
Axial T2-weighted images of the brain of patient 2, obtained at 3 months of age. These images show a simplified gyration pattern, global hypomyelination, and abnormal hyperintense signal intensity in the occipital WM.
The intensity of the signals at 8.3 and 6.1 ppm of S-Ado and those at 7.5 and 5.7 ppm of SAICAr present in the short TE spectrum (Fig. 4) were fitted using the AMARES fitting routine of jMRUI. From these intensities a concentration ratio of S-Ado/SAICAr of 0.6 was determined. For this calculation it was taken into account that the signal of S-Ado at 8.3 ppm consists of two singlets each representing one proton, the singlet of SAICAr at 7.5 ppm represents one proton, and the two doublets at 6.1 ppm (S-Ado) and 5.7 ppm (SAICAr) both also represent one proton.
Figure 4.
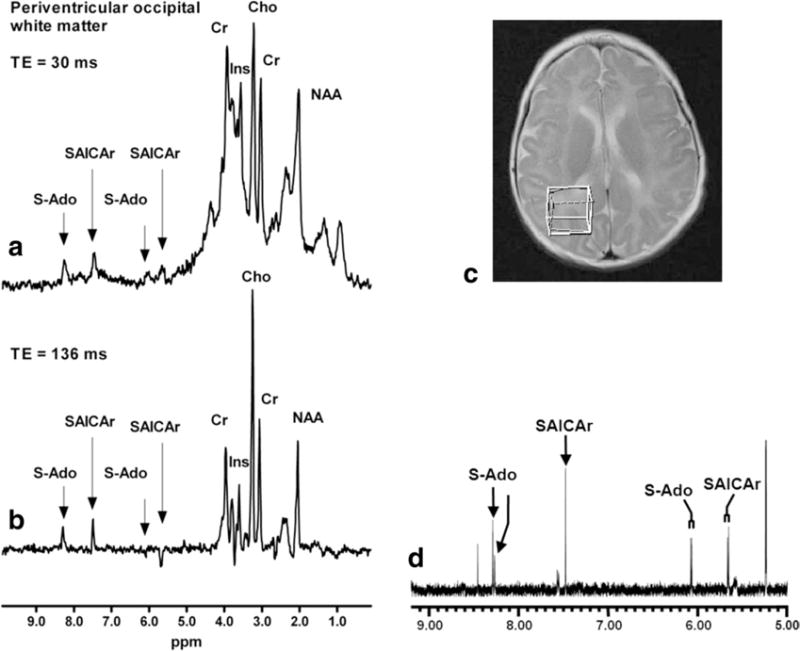
Single-voxel proton MR spectra (TR/TE 1500/135 msec) obtained at 3 T from the periventricular occipital white matter of patient 2 (ROI shown in c). The upper in vivo spectrum (a) was acquired at a short echo time (TR/TE = 6000/30 msec) showing peaks at 8.3 and 6.1 ppm for S-Ado and at 7.5 and 5.7 ppm for SAICAr. The lower in vivo spectrum (b) was acquired at a longer echo time (TR/TE = 2000/136 msec), showing similar peaks at 8.3 and 7.5 ppm for S-Ado and SAICAr, and signals with inverted phase at 5.7 ppm for SAICAr and at 6.1 ppm for S-Ado. The inverted phase is caused by J-modulation. The signals at 6.08 and 5.67 ppm, observed as doublets in the in vitro CSF NMR spectrum (d), were assigned to the C1′ ribose proton in S-Ado and SAICAr, respectively. The signals at 8.28 and 7.49 ppm were assigned to the ring protons in S-Ado and SAICAr, respectively.
In addition, these signal intensities were compared with the signal intensity of the methyl group of creatine, corresponding to three protons, in the same spectrum. Based on the relative intensities and assuming similar relaxation behavior for all signals and a creatine concentration of 4.5 to 5.5 mM, concentrations of S-Ado and SAICAr were estimated to be on the order of magnitude of 1.2–1.4 mM and 1.9–2.2 mM, respectively.
DISCUSSION
This report of two cases confirms the prior study (15) that the S-Ado signal is visible (at about 8.3 ppm) in the proton MR spectrum of occipitoparietal WM and may be useful for the diagnosis of ADSL deficiency. In both of the current cases a signal from SAICAr was also clearly visible at 7.5 ppm, which was not previously seen in vivo but was seen in high-resolution in vitro proton NMR (Table 1) (15). The 7.5 ppm signal derives from the ring proton of SAICAr. The presence of detectable SAICAr in case 1 may reflect decreased binding affinity or catalytic function towards SAICAr in this mutant ADSL, resulting in S-Ado/SAICAr ratios of 0.94 (urine) and 1.02 (CSF), consistent with the severe form of the patient’s disease. Case 2 presented S-Ado/SAICAr ratios of 0.99 (urine) and 0.69 (CSF). The S-Ado/SAICAr ratio < 1 in CSF correlates with neurological severity of case 2 and signs of neuronal migration defect in brain MRI (Fig. 3), which was not present in case 1. The in vitro proton spectrum revealed additional signals from S-Ado and SAICAr which may be seen at 6.1 and 5.7 ppm, respectively; however, in vivo these signals were not observed in case 1, probably because of their proximity to the brain water signal and the effects of the water suppression pulses. For patient 2 the two signals gave positive resonances at TE 30 msec and negative resonances at TE 136 msec, due to J-modulation. Interestingly, in patient 1 MRS failed to detect S-Ado and SAICAr signals in the thalamus, which showed normal MRI appearance. This finding suggests that the greatest metabolic abnormality is in WM regions with abnormal MRI appearance, indicating regions to target when performing single voxel MRS. S-Ado and SAICAr signals are visible at long or short TE and at either 1.5 or 3.0 T (15). For patient 1 the study was performed at long TE at 1.5 T; however, greater sensitivity of detection would be expected using short TE and higher magnetic field strengths as in case 2. In order to identify the S-Ado and SAICAr signals, spectral analysis software should display a spectral width of at least 10 ppm; currently, most commercial vendor-supplied spectroscopy packages only routinely display by default the region of the spectrum from 0 to 5 ppm, which excludes these signals of interest.
It should be noted that under high sensitivity conditions, other signals may be detected in the region of the brain spectrum downfield from water. These signals include exchangeable amide protons from NAA at 7.9 ppm, glutamine at 6.8 ppm, creatine at 6.7 ppm, histidine (19), and homocarnosine (imidazol ring residues, whose resonant frequencies depend on pH) at 7 and 8 ppm, respectively (18). Most of these signals have low amplitudes and short T2 relaxation times, and hence are not observed in vivo in the normal human brain at long TE, and the visibility of the exchangeable protons is also highly dependent on the water suppression methodology used (19).
The “conventional” detectable MRS metabolites (Cho, Cr, and NAA) in both patients were relatively unremarkable, with near normal ratios of NAA/Cr and Cho/Cr. The higher Cho signal in patient 2 (3-month-old) compared to patient 1 (18-month-old) can be attributed to a younger age (ie, less mature brain) and perhaps also the higher magnetic field strength of scan. This is consistent with patients reported previously (15) whose brain MRIs showed signs of hypomyelination. A recent retrospective study of MRS imaging in a large number of patients with leukodystrophies showed that hypomyelination typically reveals normal spectroscopic findings (20). This is in contrast to both actively demyelinating leukodystrophies, in which marked elevation in Cho and diminution in NAA are observed, and rarefaction of the WM, which typically results in decreased levels of all three metabolites. Aside from ADSL deficiency, other leukodystrophies can present with pathognomonic patterns on MRS. Canavan disease (caused by aspartoacylase deficiency) and Salla disease (defect in lysosomal protein transport sialin) are included among conditions showing an elevated NAA signal at 2.0 ppm (21,22). Complex II deficiency, which shows an elevated succinate signal (2.4 ppm), and ribose-5-phosphate isomerase deficiency with abnormal arabitol/ribitol resonances around 3.8 ppm are two other examples (23).
The patients presented here had MRI findings of cerebral and cerebellar volume loss, thin corpus callosum, and profound hypomyelination, consistent with previous reports of patients with ADSL deficiency (8,15). A recent review of seven cases (10) also described patients with poor myelination pattern, abnormal WM signal suggestive of dysmyelination, and lissencephaly. While these brain MRI findings in the setting of the neurological symptomatology might suggest the diagnosis of ADSL deficiency, other inherited neurometabolic disorders with similar clinical presentation are more often included in the diagnostic investigation. Therefore, MRS may be an important investigational tool in guiding or establishing the diagnosis of ADSL deficiency. The proton NMR spectroscopy in vitro analysis also proved to be a useful method to confirm the diagnosis and determine the S-Ado/SAICAr ratio which correlated with the severe phenotype presented by both patients (Table 1).
The ADSL gene sequence showed a novel splice site mutation (c.IVS12 + 1/G > C) and another previously described missense mutation (K246E) (4,16). A mutation in the second allele was not found in case 1. However, it is important to emphasize that the molecular analysis is not essential in establishing the diagnosis of this inherited metabolic condition.
In conclusion, ADSL deficiency is a rare and likely underdiagnosed inborn error of metabolism that needs to be considered in the diagnostic work-up of infants with unexplained neonatal seizures, developmental delay, hypotonia, autistic features, microcephaly, and brain MRI signs of hypo- or dysmyelination. In vivo MRS is a useful noninvasive procedure, which may lead directly to a diagnosis of ADSL deficiency if elevated peaks corresponding to S-Ado are detected. Furthermore, the two cases reported here with severe clinical presentation also showed detectable SAICAr peaks in vivo.
References
- 1.Van den Berghe G, Vincent MF, Jaeken J. Inborn errors of the purine nucleotide cycle: adenylosuccinase deficiency. J Inherit Metab Dis. 1997;20:193–202. doi: 10.1023/a:1005304722259. [DOI] [PubMed] [Google Scholar]
- 2.Jaeken J, Van den Berghe G. An infantile autistic syndrome characterised by the presence of succinylpurines in body fluids. Lancet. 1984;2:1058–1061. [PubMed] [Google Scholar]
- 3.Gitiaux C, Ceballos-Picot I, Marie S, et al. Misleading behavioural phenotype with adenylosuccinate lyase deficiency. Eur J Hum Genet. 2008;17:133–136. doi: 10.1038/ejhg.2008.174. [DOI] [PMC free article] [PubMed] [Google Scholar]
- 4.Marie S, Cuppens H, Heuterspreute M, et al. Mutation analysis in adenylosuccinate lyase deficiency: eight novel mutations in the re-evaluated full ADSL coding sequence. Hum Mutat. 1999;13:197–202. doi: 10.1002/(SICI)1098-1004(1999)13:3<197::AID-HUMU3>3.0.CO;2-D. [DOI] [PubMed] [Google Scholar]
- 5.Van den Bergh F, Vincent MF, Jaeken J, Van den Berghe G. Residual adenylosuccinase activities in fibroblasts of adenylosuccinase-deficient children: parallel deficiency with adenylosuccinate and succinyl-AICAR in profoundly retarded patients and nonparallel deficiency in a mildly retarded girl. J Inherit Metab Dis. 1993;16:415–424. doi: 10.1007/BF00710291. [DOI] [PubMed] [Google Scholar]
- 6.Fon EA, Demczuk S, Delattre O, Thomas G, Rouleau GA. Mapping of the human adenylosuccinate lyase (ADSL) gene to chromosome 22q13.1—>q13.2. Cytogenet Cell Genet. 1993;64:201–203. doi: 10.1159/000133575. [DOI] [PubMed] [Google Scholar]
- 7.Jaeken J, Wadman SK, Duran M, et al. Adenylosuccinase deficiency: an inborn error of purine nucleotide synthesis. Eur J Pediatr. 1988;148:126–131. doi: 10.1007/BF00445919. [DOI] [PubMed] [Google Scholar]
- 8.Jurecka A, Zikanova M, Tylki-Szymanska A, et al. Clinical, biochemical and molecular findings in seven Polish patients with adenylosuccinate lyase deficiency. Mol Genet Metab. 2008;94:435–442. doi: 10.1016/j.ymgme.2008.04.013. [DOI] [PubMed] [Google Scholar]
- 9.Ciardo F, Salerno C, Curatolo P. Neurologic aspects of adenylosuccinate lyase deficiency. J Child Neurol. 2001;16:301–308. doi: 10.1177/088307380101600501. [DOI] [PubMed] [Google Scholar]
- 10.Jurecka A, Jurkiewicz E, Tylki-Szymanska A. Magnetic resonance imaging of the brain in adenylosuccinate lyase deficiency: a report of seven cases and a review of the literature. Eur J Pediatr. 2012;171:131–138. doi: 10.1007/s00431-011-1503-9. [DOI] [PubMed] [Google Scholar]
- 11.Laikind PK, Seegmiller JE, Gruber HE. Detection of 5′-phosphoribosyl-4-(N-succinylcarboxamide)-5-aminoimidazole in urine by use of the Bratton-Marshall reaction: identification of patients deficient in adenylosuccinate lyase activity. Anal Biochem. 1986;156:81–90. doi: 10.1016/0003-2697(86)90158-2. [DOI] [PubMed] [Google Scholar]
- 12.Moolenaar SH, Engelke UF, Wevers RA. Proton nuclear magnetic resonance spectroscopy of body fluids in the field of inborn errors of metabolism. Ann Clin Biochem. 2003;40(Pt 1):16–24. doi: 10.1258/000456303321016132. [DOI] [PubMed] [Google Scholar]
- 13.Wevers RA, Engelke UF, Moolenaar SH, et al. 1H-NMR spectroscopy of body fluids: inborn errors of purine and pyrimidine metabolism. Clin Chem. 1999;45:539–548. [PubMed] [Google Scholar]
- 14.Ariyananda Lde Z, Lee P, Antonopoulos C, Colman RF. Biochemical and biophysical analysis of five disease-associated human adenylosuccinate lyase mutants. Biochemistry. 2009;48:5291–5302. doi: 10.1021/bi802321m. [DOI] [PMC free article] [PubMed] [Google Scholar]
- 15.Henneke M, Dreha-Kulaczewski S, Brockmann K, et al. In vivo proton MR spectroscopy findings specific for adenylosuccinate lyase deficiency. NMR Biomed. 2010;23:441–445. doi: 10.1002/nbm.1480. [DOI] [PubMed] [Google Scholar]
- 16.Kmoch S, Hartmannova H, Stiburkova B, Krijt J, Zikanova M, Sebesta I. Human adenylosuccinate lyase (ADSL), cloning and characterization of full-length cDNA and its isoform, gene structure and molecular basis for ADSL deficiency in six patients. Hum Mol Genet. 2000;9:1501–1513. doi: 10.1093/hmg/9.10.1501. [DOI] [PubMed] [Google Scholar]
- 17.Provencher SW. Estimation of metabolite concentrations from localized in vivo proton NMR spectra. Magn Reson Med. 1993;30:672–679. doi: 10.1002/mrm.1910300604. [DOI] [PubMed] [Google Scholar]
- 18.Vermathen P, Capizzano AA, Maudsley AA. Administration and (1)H MRS detection of histidine in human brain: application to in vivo pH measurement. Magn Reson Med. 2000;43:665–675. doi: 10.1002/(sici)1522-2594(200005)43:5<665::aid-mrm8>3.0.co;2-3. [DOI] [PubMed] [Google Scholar]
- 19.MacMillan EL, Chong DG, Dreher W, Henning A, Boesch C, Kreis R. Magnetization exchange with water and T1 relaxation of the downfield resonances in human brain spectra at 3.0 T. Magn Reson Med. 2011;65:1239–1246. doi: 10.1002/mrm.22813. [DOI] [PubMed] [Google Scholar]
- 20.Bizzi A, Castelli G, Bugiani M, et al. Classification of childhood white matter disorders using proton MR spectroscopic imaging. AJNR Am J Neuroradiol. 2008;29:1270–1275. doi: 10.3174/ajnr.A1106. [DOI] [PMC free article] [PubMed] [Google Scholar]
- 21.Janson CG, McPhee SW, Francis J, et al. Natural history of Canavan disease revealed by proton magnetic resonance spectroscopy (1H-MRS) and diffusion-weighted MRI. Neuropediatrics. 2006;37:209–221. doi: 10.1055/s-2006-924734. [DOI] [PubMed] [Google Scholar]
- 22.Varho T, Komu M, Sonninen P, et al. A new metabolite contributing to N-acetyl signal in 1H MRS of the brain in Salla disease. Neurology. 1999;52:1668–1672. doi: 10.1212/wnl.52.8.1668. [DOI] [PubMed] [Google Scholar]
- 23.Gillard JH, Waldman AD, Barker PB. Clinical MR neuroimaging: diffusion, perfusion, and spectroscopy. 2nd. Cambridge, UK: Cambridge University Press; 2010. pp. 806–821. [Google Scholar]