Abstract
Ferraresi C, Bertucci D, Schiavinato J, Reiff R, Araújo A, Panepucci R, Matheucci E, Cunha AF, Arakelian VM, Hamblin MR, Parizotto N, Bagnato V: Effects of light-emitting diode therapy on muscle hypertrophy, gene expression, performance, damage, and delayed-onset muscle soreness: case-control study with a pair of identical twins.
Objective
The aim of this study was to verify how a pair of monozygotic twins would respond to light-emitting diode therapy (LEDT) or placebo combined with a strength-training program during 12 weeks.
Design
This case-control study enrolled a pair of male monozygotic twins, allocated randomly to LEDT or placebo therapies. Light-emitting diode therapy or placebo was applied from a flexible light-emitting diode array (λ = 850 nm, total energy = 75 J, t = 15 seconds) to both quadriceps femoris muscles of each twin immediately after each strength training session (3 times/wk for 12 weeks) consisting of leg press and leg extension exercises with load of 80% and 50% of the 1-repetition maximum test, respectively. Muscle biopsies, magnetic resonance imaging, maximal load, and fatigue resistance tests were conducted before and after the training program to assess gene expression, muscle hypertrophy and performance, respectively. Creatine kinase levels in blood and visual analog scale assessed muscle damage and delayed-onset muscle soreness, respectively, during the training program.
Results
Compared with placebo, LEDT increased the maximal load in exercise and reduced fatigue, creatine kinase, and visual analog scale. Gene expression analyses showed decreases in markers of inflammation (interleukin 1β) and muscle atrophy (myostatin) with LEDT. Protein synthesis (mammalian target of rapamycin) and oxidative stress defense (SOD2 [mitochondrial superoxide dismutase]) were up-regulated with LEDT, together with increases in thigh muscle hypertrophy.
Conclusions
Light-emitting diode therapy can be useful to reduce muscle damage, pain, and atrophy, as well as to increase muscle mass, recovery, and athletic performance in rehabilitation programs and sports medicine.
Keywords: Biopsy, Creatine Kinase, Low-Level Laser Therapy, Photobiomodulation, Visual Analog Scale
Phototherapy using lasers and other light sources is commonly used in medicine for different treatments.1,2 Since 1960s, low-level lasers (up to 500 mW)3 have provided a successful and noninvasive therapy to manage pain4 and inflammatory processes and accelerate tissue healing.5
The mechanisms of action of phototherapy on biological tissues are related to light absorption by chromophores in the cells, with cytochrome c oxidase (Cox) proposed as the main light-absorbing protein.6 The Cox enzyme, unit IV in the mitochondrial respiratory chain, triggers a variety of secondary effects after light absorption. Among these effects, the literature highlights increases in adenosine triphosphate (ATP) synthesis7,8 and modulations in DNA and RNA synthesis rates, which in turn affect cell proliferation and gene expression related to several cellular pathways such as mitosis, apoptosis, inflammation, and mitochondrial energy metabolism.6–9
Recently, photobiomodulation in the form of low-level laser therapy and light-emitting diode therapy (LEDT) has been applied over human skeletal muscles before or after bouts of exercises in order to (i) accelerate muscle recovery, (ii) protect against muscle damage induced by exercise, and (iii) improve performance, such as increasing muscle strength and fatigue resistance.10–14 These effects are valuable in rehabilitation processes that involve exercise programs to recover from muscle lesions and can mitigate the adverse effects of orthopedic surgical procedures, such as muscle weakness and atrophy,15 and accelerate the return to athletic sports or functional activity.
Few studies have evaluated the chronic effects (≥8 weeks) of applying phototherapy to muscles that are under metabolic and/ or mechanical stress, as seen in exercise training-programs used in humans to increase performance.11,13 Moreover, there has been no study reporting the chronic effects of phototherapy on muscle performance (including maximal load tests and fatigue resistance), hypertrophy, muscle damage, delayed-onset muscle soreness (DOMS), and molecular responses (gene expression) in humans. In addition, it is also important to establish the safety of this treatment applied in a chronic manner, because this therapy produces effects on muscle tissue lasting 24 to 48 hours,8,16,17 suggesting possible cumulative effects if applied repetitively. Finally, no published study has controlled the genetic aspects of the subjects, because it is known that genetic differences between individual subjects can promote different adaptations to exercise.18
With these perspectives in mind, our case-control study investigated whether an intense strength training program combined with the chronic use of LEDT could increase muscle recovery, performance (strength and fatigue resistance), and muscle hypertrophy (volume); modulate gene expression; and also decrease the score for DOMS in a pair of identical twins. This study enrolled a pair of identical twins because of their genetic identity19 in order to exclude or drastically minimize the effects of genetic disparities between the subjects, because it is known that muscle performance and recovery can depend on intrinsic genetic responses to exercise18,20,21 and moreover that phototherapy promotes modulation in gene expression.6,9
METHODS
Subjects
Two 19-year-old male identical (monozygotic) twins, 1.72 m, 70 kg, college soccer players, living together and having the same habits and diet, were enrolled in this study approved by the human ethics committee of the Federal University of São Carlos, Brazil (opinion no 205/2012) and conducted in this university in compliance with the Declaration of Helsinki (1964) and its later amendments.
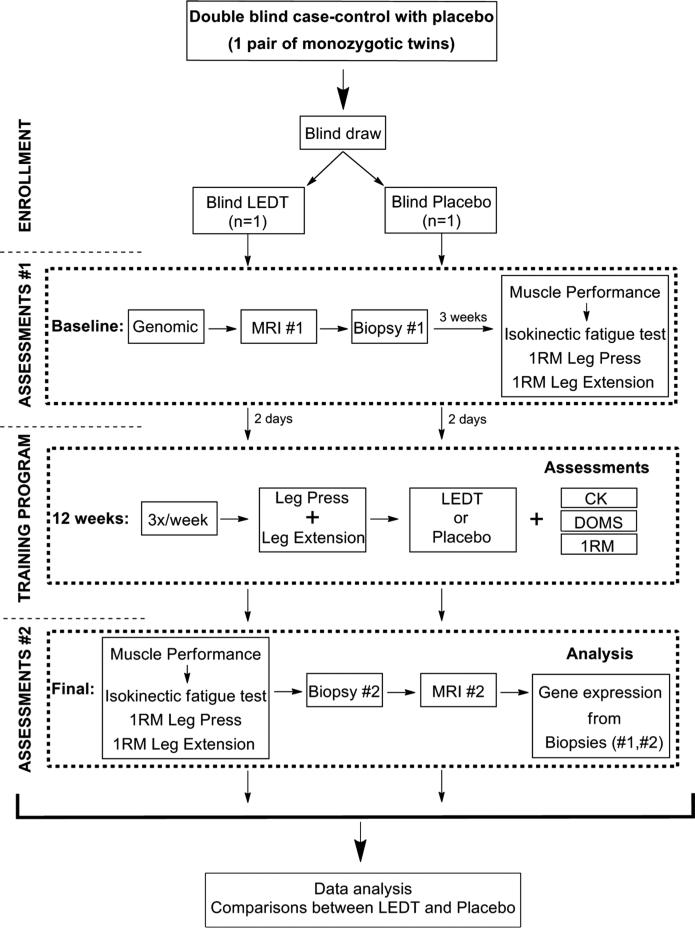
After signing an informed consent form, the subjects were subjected to (i) genomic analysis to confirm their identity as monozygotic twins19; (ii) an intense strength training program using a leg press and leg extension fitness machine combined with LEDT or placebo; (iii) assessments of muscle performance, score of DOMS by visual analog scale (VAS), and a biochemical marker of muscle damage (creatine kinase [CK]; (iv) magnetic resonance imaging (MRI) analysis to calculate thigh muscle volume22,23; and (v) muscle biopsies of the vastus lateralis24 to quantify gene expression modulation by quantitative real-time polymerase chain reaction (qPCR). Figure 1 shows a flowchart of the study.
FIGURE 1.
Flowchart of the study.
Genomic Analysis
Sixteen loci with short tandem repeats were investigated to determine whether both brothers were monozygotic twins. DNA samples were obtained from cells of the oral mucosa using a swab, and DNA was extracted using Qiamp DNA Mini Kit (Qiagen, Valencia, CA). Coamplifications of the loci D3S1358, vWA, D16S539, D8S1179, D21S11, D18S51, TH01, FGA, D5S818, D13S317, D7S820, TPOX, CSF1PO, penta D, penta E, and amelogenin were performed by PCR using Human ID kit (QGene, São Carlos, Brazil). Reactions for multiplex PCR were prepared according to the manufacturer's guidelines. Briefly, these reactions used 15 ng of genomic DNA, 1 U of Taq DNA polymerase, buffer (1×), primers and water to complete 15 μL of reaction volume. All loci were amplified in a Veriti 96-Well Thermal Cycler (Applied Biosystems, Waltham, MA) following the program: step 1: 1× (95°C, 7 minutes); step 2: 10× (94°C, 1 minute; 60°C, 1 minute; 70°C, 1.5 minutes); step 3: 22× (90°C, 1 minute; 60°C, 1 minute; 70°C, 1.5 minutes); step 4: 1× (60°C, 30 minutes); step 5: keep at 4°C. Amplified products were detected and separated by capillary electrophoresis using a MegaBACE 1000 (GE Healthcare Bio-Sciences Corp., Pittsburgh, PA). Results were analyzed, and allele designations were set automatically using Fragment Profiler software, version 1.2 (GE).
Magnetic Resonance Imaging and Muscle Hypertrophy (Volume)
These analyses quantified the muscle volume after the training program, because strength exercises are known to promote muscle hypertrophy.25 A MAGNETOM C! 0.35-T (Siemens, München, Deutschland) scanner was used to acquire axial images from thigh muscles. T1-weighted spin echo with a 430-millisecond repetition time, 26-millisecond echo time in matrix of 256 × 256 pixels was used to acquire MRI data using 10-mm-thick sections similarly to previous studies.22,23 Subjects did not eat or drink for 8 hours before their scans in the supine position.22 Slices from the proximal border of the patella to the anterior superior iliac spine were used to quantify the volume of the thigh muscles, subtracting bone and fat tissues. Cross-sectional areas were measured every each 4 consecutive slices (3-cm gap between slices)22 using Weasis software (version 1.1.2). Muscle volume (in cm3) of the slices was calculated by multiplying the tissue area (in cm2) by slice thickness (10 mm). Volume of all gaps was calculated using truncated pyramids22,23 as follows:
where V is the total thigh volume, A is the muscle cross-sectional area, t is slice thickness, h is the distance (gap) between every 4 consecutive slices, and N is the number of slices used to calculations. Total volume was calculated as the summation of volume of the slices and gaps of the left thigh. The same number of slices (12) was used before and after the training program for both twins. Magnetic resonance imaging was carried out at baseline (prior baseline biopsy) and final (24 hours after second biopsy). Cross-sectional area of each slice was quantified by evaluator 1, who was blinded to the therapy (LEDT or placebo) and training program.
Muscle Biospy
Muscle biopsies were performed to acquire muscle samples for gene expression analyses to identify molecular responses resulting from the training program combined with phototherapy. Both twins were instructed to not perform any kind of training or exercise for 7 days prior to the first muscle biopsy (baseline). The fragment of the vastus lateralis was obtained from the half distance between an imaginary line beginning at the greater trochanter to the superior border of the patella.24 The skin was cleansed, and local anesthesia was applied using 2% lidocaine without vasoconstrictor. Afterward, a small incision using scalpel no. 11 was made in the skin (approximately 0.5 cm), through subcutaneous tissue and fascia.24 Thereafter, a biopsy needle of 4.5 mm was inserted to collect the muscle fragment. Immediately after withdrawal, the muscle fragment was deposited in a cryotube free of DNase and RNAse, frozen in liquid nitrogen and stored at −80°C until analysis of gene expression. The final biopsy was conducted exactly 24 hours after the last training session.
Muscle Performance
Muscle performance assessments were performed to measure (i) muscle fatigue resistance and (ii) the maximal muscle strength. Three weeks after the first muscle biopsy, both twins were evaluated for muscle fatigue using the fatigue index in an isokinetic dynamometer (Multi-Joint System 3; Biodex, New York, NY), and the load of 1-repetition maximum (1RM) test using the leg press as previously described11,13 for baseline. One-repetition maximum test in leg extension fitness machine was conducted for each leg with the range of motion (ROM) from 90 to 15 degrees of knee flexion. This ROM was chosen (i) based on scientific evidence reporting the peak of the torque of the knee extensor muscles occurring near 60 to 70 degrees of knee flexion26–28; (ii) to keep the same ROM used in the isokinetic test15; and (iii) to make it possible for both volunteers to extend their knee joint to a comfortable position,29 reducing the possibility of resistance occurring via stretching of hamstring muscles.30 The final evaluations of muscle performance were performed at the 35th training session. Both twins performed all these evaluations individually and were blinded to the results. In addition, all tests were performed by evaluator 2, who was blinded to therapy (LEDT or placebo) and MRI analyses.
Training Program
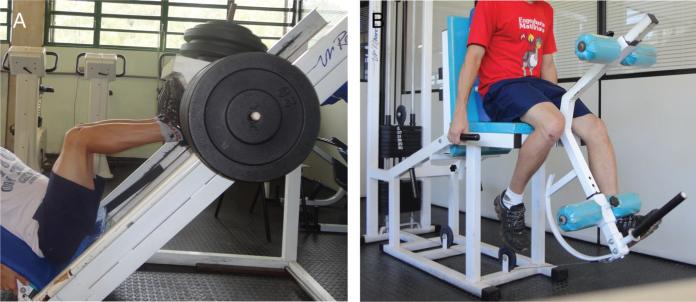
The intense strength training program using leg press and leg extension was based on literature protocols to obtain the maximum muscle strength and volume increase.25 Two days after baseline evaluations for muscle performance, both monozygotic twins started the training program for 12 consecutive weeks, with a relatively high frequency (3 days a week: Monday, Wednesday, Friday) in blinded mode; that is, each twin did not see the training of his brother. The intensity of each training session was 80% and 50% of the load determined by the 1RM test in the leg press and leg extension fitness machine, respectively11 (Fig. 2). Each training session comprised 40 repetitions of leg press (4 sets of 10) plus 30 repetitions of leg extension (3 sets of 10) or until exhaustion understood as an incapacity of the subjects to lift the weights (leg press or leg extension exercises). If a set was not completed, the number of repetitions was recorded, and immediately a rest interval was started consisting of 2 minutes between sets.11 For leg extension, the rest interval started immediately after both legs performed each set of exercises. Retests of 1RM by the leg press and leg extension machine were carried out at the 12th and 24th training session, replacing these sessions. Evaluator 2 supervised all training sessions.
FIGURE 2.
A, Exercise in leg press. B, Exercise in leg extension fitness machine.
Light-Emitting Diode Therapy or Placebo
Light-emitting diode therapy was chosen as the phototherapy of this study because of its ease of application. Evaluator 3 randomized the twins by a simple draw at the beginning of the study to receive LEDT or placebo. Each therapy was applied over the quadriceps femoris muscles of each leg for 15 seconds immediately after each training session: right leg first and left leg second, with the order of application alternating each time. Both twins were blinded to these therapies, and in addition, evaluator 3 was blinded to muscle performance, CK, and muscle soreness assessments during the study.
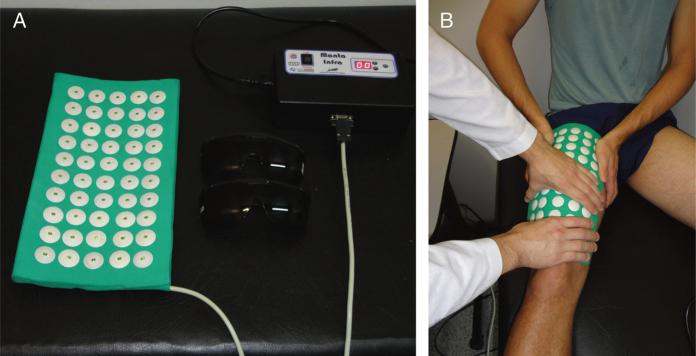
Light-emitting diode therapy used a flexible array of 34 × 18 cm (612 cm2) containing 50 in-frared LEDs (850 nm) specially built for research by the University of São Paulo and Federal University of São Carlos, Brazil (Fig. 3). This device (prototype) was designed to cover the quadriceps femoris muscles at each session of irradiation, making the therapy sessions faster and standardized when compared with using multiple points of irradiation by single probes or circular clusters. Each LED had a spot area of 0.2 cm2 and an optical power of 100 mW, delivering 1.5 J during 15 seconds. The total power was 5000 mW, and total energy delivered was 75 J at each application. Light-emitting diode parameters were measured and calibrated using an optical energy meter PM100D Thorlabs (Newton, NJ) fitted with a sensor model S130C. All LEDT parameters are given in Table 1.
FIGURE 3.
A, Array of LEDs used to LEDT. B, Light-emitting diode therapy or placebo applied immediately on quadriceps femoris muscles after each training session.
TABLE 1.
Parameters of LEDT
| No. LEDs: 50 infrared | Power density per LED: 500 mW/cm2 |
| Wavelength: 850 (+/− 20) nm | Power density of array: 8.1 mW/cm2 |
| LED spot size: 0.2 cm2 | Treatment time: 15 s |
| LED array size: 612 cm2 | Total energy per application: 75 J |
| Pulse frequency: continuous | Energy density per LED: 7.5 J/cm2 |
| Optical output power of each LED: 100 mW | Energy density of array: 0.122 J/cm2 |
| Optical output power of array: 5,000 mW | Application mode: in contact with the skin |
A hidden button in the LED device was switched on by evaluator 3 during placebo therapy, causing the device to emit no light (0 mW and 0 J). Because of the invisible nature of 850-nm light, neither twin could distinguish placebo therapy from LEDT. There was no sensation of heat when the device was applied to the skin.
Biochemical Marker of Muscle Damage and Score of DOMS Assessments
Creatine kinase, a muscle enzyme related to muscle damage that can be measured in the bloodstream,31 was analyzed using 30 KL of blood collected from the earlobe 5 minutes before and 24 hours after the 1st, 13th, 25th, and 36th training sessions. Creatine kinase was measured by Reflotron Plus biochemical analyzer (Roche, Mannheim, DE)31 following the manufacturer_s guidelines. Briefly, the CK strip (Roche) was filled with 30 μL of blood and after exactly 15 seconds was read on the Reflotron Plus. A VAS with 10 cm was used to measure the DOMS4 24 hours after the 1st, 13th, 25th, and 36th training sessions, because it is known that strength training exercise promotes microdamage in the muscles and an inflammatory process that induces pain with peaks between 24 and 72 hours.32 Muscle pain was elicited through a maximum voluntary isometric contraction at 0 degrees of knee flexion and without load. These analyses were carried out by evaluator 2.
Gene Expression Analyses
Gene expression analyses aimed to assess the effects of the training program combined with phototherapy on genes known to be related to oxidative stress defenses (mitochondrial superoxide dismutase [SOD2]), protein synthesis and muscle hypertrophy (mammalian target of rapamycin [mTOR]), inflammation (interleukin 1β [IL-1β]), and muscle weakness and atrophy (myostatin [MSTN]).33–35 Gene expression of SOD2, mTOR, IL-1β, and MSTN was compared with RPS13 (ribosomal protein S13). RPS13 was chosen as the most stable reference gene36 when compared with other reference genes, such as GAPDH (glyceraldehyde-3-phosphate dehydrogenase), HPRT1 (hypoxanthine phosphoribosyltransferase), and RPS29 (ribosomal protein S29). Messenger RNA from muscle samples was extracted using TRIzol (Life Technologies, Waltham, MA) and reverse transcribed using High-Capacity cDNA Reverse Transcription kit (Applied Biosystems, Waltham, MA). Quantitative real-time PCR reactions used GoTaq qPCR Master Mix kit (Applied Biosystems, Waltham, MA) with thermal cycles of 50°C (1 × 2 minutes), 95°C (1 × 10 minutes), 95°C (40 × 15 seconds), 60°C (40 × 1 minute), 95°C (1 × 15 seconds), 60°C (1 × 30 seconds), 95°C (1 × 15 seconds). Fold change (FC) of gene expression was calculated using comparative cycle threshold (2−ΔΔct).37 All pairs of primers used are given in Table 2.
TABLE 2.
Designed pairs of primers used in qPCR
| Gene NM | Gene Primer | Sequence |
|---|---|---|
| RPS29 (NM_001032) | RPS29_RT_F | 5′ GCACTGCTGAGAGCAAGATG 3′ |
| RPS29_RT_R | 5′ ATAGGCAGTGCCAAGGAAGA 3′ | |
| RPS13 (NM_001017) | RPS13_RT_F | 5′ TCTCCTTTCGTTGCCTGATC 3′ |
| RPS13_RT_R | 5′ AATCTGCTCCTTCACGTCG 3′ | |
| GAPDH (NM_002046) | GAPDH_RT_F | 5′ ACATCGCTCAGACACCATG 3′ |
| GAPDH_RT_R | 5′ TGTAGTTGAGGTCAATGAAGGG 3′ | |
| HPRT1 (NM_000194) | HPRT1_RT_F | 5′ TGCTGAGGATTTGGAAAGGG 3′ |
| HPRT1_RT_R | 5′ ACAGAGGGCTACAATGTGATG 3′ | |
| SOD2 (NM_000636) | SOD2_RT_F | 5′ CCTGGAACCTCACATCAACG 3′ |
| SOD2_RT_R | 5′ GCTATCTGGGCTGTAACATCTC 3′ | |
| mTOR (NM_004958) | MTOR_RT_F | 5′ CTGAACTGGAGGCTGATGG 3′ |
| MTOR_RT_R | 5′ TGGTCCCCGTTTTCTTATGG 3′ | |
| IL-1β (NM_000576) | IL-1β_RT_F | 5′ GGTACATCAGCACCTCTCAAG 3′ |
| IL-1β_RT_R | 5′ CACATTCAGCACAGGACTCTC 3′ | |
| MSTN (NM_005259) | MST_RT_F | 5′ TGATCTTGCTGTAACCTTCCC 3′ |
| MST_RT_R | 5′ TCGTGATTCTGTTGAGTGCTC 3′ |
RESULTS
Genomic Analysis
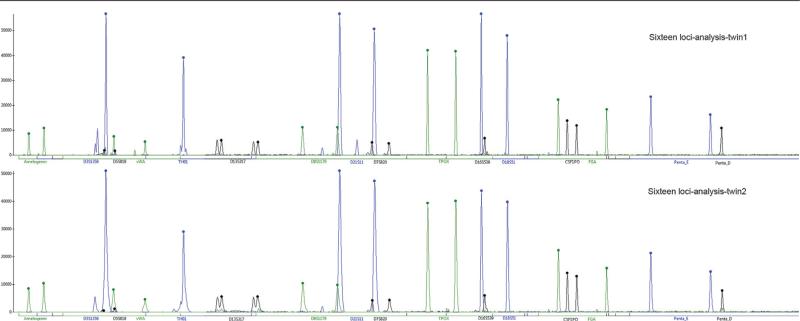
All 16 loci tested confirmed that both brothers were monozygotic twins (Fig. 4).
FIGURE 4.
Genomic analysis of the 16 loci with short tandem repeats (STRs): amelogenin, D3S1358, D5S818, vWA, TH01, D13S317, D8S1179, D21S11, D7S820, TPOX, D16S539, D18S51, CSF1PO, FGA, penta E, penta D. Note that for both twins (twins 1 and 2) all loci have the same position and peaks, attesting their condition of identical twins (monozygotic).
Muscle Performance
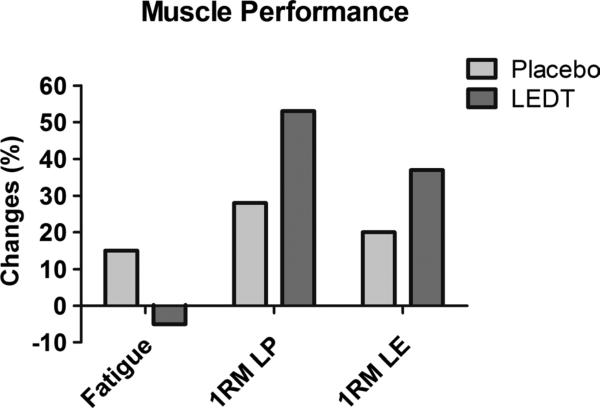
Light-emitting diode therapy increased the 1RM load in leg press (+53%, from 320 to 490 kg) and in leg extension machine (+37%, from 60 to 82.5 kg) but basically did not change muscle fatigue in the isokinetic dynamometer (−3%, from 59% to 56%). On the other hand, placebo therapy increased muscle fatigue (+15%, from 57% to 66%) and produced smaller increments in 1RM load in leg press (+28%, from 320 to 410 kg) and leg extension (+20%, from 62.5 to 75 kg) (Fig. 5).
FIGURE 5.
Muscle performance assessing muscle fatigue resistance; 1RM test in leg press (LP) and in leg extension fitness machine (LE). Values are given in percentage (%).
Muscle Damage and DOMS
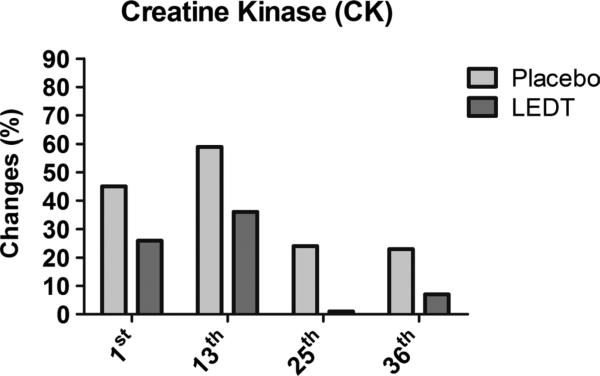
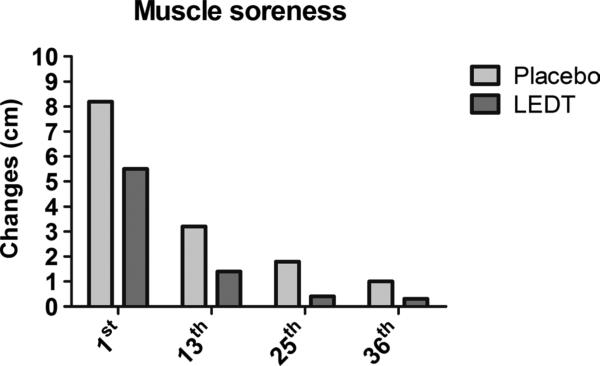
Light-emitting diode therapy produced smaller increases in CK at 1st (+26%, from 225 to 284 UL), 13th (+36%, from 191 to 260 UL), 25th (+1%, from 225 to 229 UL), and 36th (+7%, from 204 to 220 UL) training sessions compared with placebo at 1st (+45%, from 259 to 376 UL), 13th (+59%, from 153 to 244 UL), 25th (+24%, from 158 to 196 UL), and 36th (+23%, from 146 to 181 UL) (Fig. 6). Light-emitting diode therapy decreased pain score on VAS compared with placebo at 1st (5.5 vs 8.2), 13th (1.4 vs 3.2), 25th (0.4 vs 1.8), and 36th (0.3 vs 1.0) training sessions (Fig. 7).
FIGURE 6.
Muscle damage assessed by CK at the 1st, 13th, 25th, and 36th training sessions. Values are given in percentage (%).
FIGURE 7.
Delayed-onset muscle soreness assessed by VAS at the 1st, 13th, 25th, and 36th training sessions. Values are given in centimeters.
Muscle Hypertrophy (Volume)
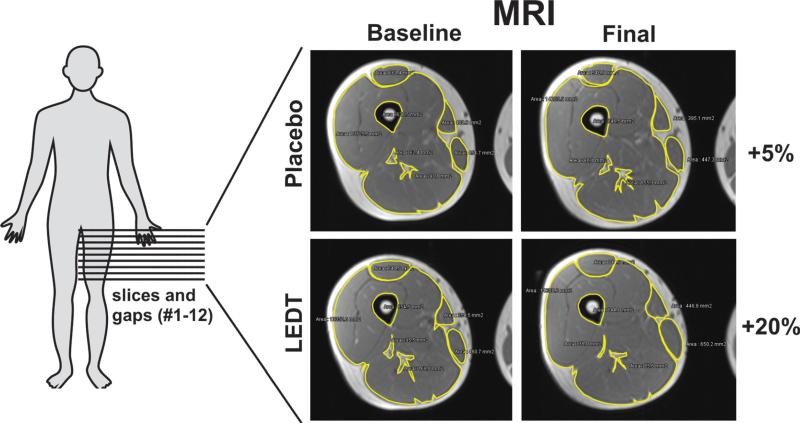
There was an increase in the volume in thigh muscles measured by MRI when LEDT was combined with the training program (+20%, from 2937 to 3523 cm3), whereas placebo therapy gave a smaller increase in muscle volume (+5%, from 3152 to 3316 cm3) (Fig. 8).
FIGURE 8.
Magnetic resonance imaging of thigh muscles before (baseline) and after (final) the training program. Twelve slices and gaps were used to calculate muscle volume. Images from level 5 (slice 5) for both twins are representing the whole difference between therapies, taking into account all 12 slices and gaps. Results are presented in percentage.
Gene Expression
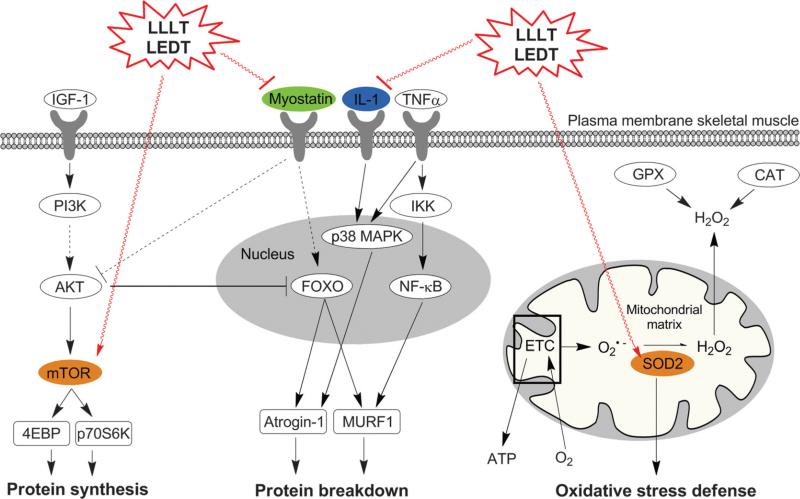
Expressions of IL-1β and MSTN were decreased with LEDT (FC = −11.5 and −4.0, respectively) compared with placebo (FC = +2.3 and −1.4). Moreover, mTOR and SOD2 expression were increased with LEDT (FC = +1.4 and +1.4, respectively) compared with placebo (FC = +1.1 and +1.0) (Table 3). Figure 9 illustrates possible cell signaling mechanisms in human skeletal muscle mediated by phototherapy.
TABLE 3.
Fold change of gene expression following placebo or LEDT
| Gene | Placebo | LEDT |
|---|---|---|
| IL-1β | 2.3 | −11.5 |
| MSTN | −1.4 | −4.0 |
| mTOR | 1.1 | 1.4 |
| SOD2 | 1.0 | 1.4 |
FIGURE 9.
Supposed effect of phototherapy by LEDT and low-level laser therapy (LLLT) in human skeletal muscle cell signaling. Colored genes were modulated with LEDT. ETC indicates mitochondrial electron transport chain.
DISCUSSION
The present study shows for the first time the beneficial effects of phototherapy by LEDT on skeletal muscles of genetically identical humans (monozygotic twins) subjected to a strength training program. Light-emitting diode therapy compared with placebo therapy promoted a resistance to muscle fatigue, reduced a biochemical marker of muscle damage (CK), lessened the score of delayed onset muscle soreness (VAS), and reduced expression of genes related to inflammation (IL-1A) and atrophy (MSTN). Moreover, LEDT increased the maximal load achievable in exercise, the expression of genes related to oxidative stress defense (SOD2), and protein synthesis (mTOR) and produced thigh muscle hypertrophy shown by MRI.
The results regarding gene expression of IL-1β, a known gene marker of inflammation, strongly suggest that LEDT produced an anti-inflammatory effect, as reported by previous studies.6,38,39 Likewise, gene expression of MSTN, a gene marker of muscle wasting and weakness,33 was also decreased with LEDT applied after the training program, suggesting an important reduction in the signaling seen in muscle atrophy.20,21 Genes related to a marker of cell proliferation and protein synthesis (mTOR)34 and oxidative stress defense (SOD2)35 were also increased by LEDT, confirming the molecular effects of phototherapy39 in humans. To our best knowledge, there is no previous study reporting these effects of phototherapy on gene expression in human skeletal muscles.
The effects of phototherapy on RNA synthesis in conjunction with the greater increase in muscle volume (MRI analysis) and performance (load in 1RM tests and fatigue resistance), combined with reduction of muscle damage (CK levels) and DOMS (pain assessed by VAS score), strongly suggest that several signaling pathways involved in cell proliferation and protein synthesis, energy metabolism, cytoprotection, inflammation, and oxidative stress39 were modulated by phototherapy resulting in macroscopic and functional benefits for human skeletal muscles.
Previous clinical trials11,13,14,16 as well as in vitro8 and preclinical animal studies7,40 have shown decreased levels of CK (muscle damage) and DOMS, an increased load, resistance to muscle fatigue, more muscle ATP and glycogen synthesis, better oxidative stress defense, improved mitochondrial activity (Cox), and proliferation of muscle cells with the use of phototherapy that has generally been applied after exercises. Moreover, increases in ATP content in muscle cells and tissue, fatigue resistance, strength, oxidative stress defense, prevention of muscle damage, and improvement of the kinetics of oxygen consumption7,8,10,12,17,41–43 can also be elicited when phototherapy is applied to muscles before a single bout of exercise (muscular preconditioning). However, it seems there is an optimum time to apply phototherapy when used in a muscular preconditioning regimen as judged by increases in ATP synthesis in muscles, mitochondrial metabolism, and fatigue resistance that are maximal at some hours after light application.8,17
The results reported in the present study can give better direction for the use of phototherapy in clinical practice in the sports medicine and rehabilitation fields. Regarding sports medicine, athletes and sportsmen could be benefited by phototherapy with a fast muscle recovery, a better gain in hyper-trophy (muscle mass), and improvement of muscle performance, without the use of any forbidden performance-enhancing drugs.44 Moreover, there would be the added benefit of reduction in muscle damage and atrophy and less inflammation and pain.4 On the other hand, patients suffering from inflammation, pain, loss of muscle mass and strength, and muscle atrophy as result of orthopedic surgical procedures,15 for example, could possibly be benefited with the use of phototherapy combined with exercise training programs during their rehabilitation. Therefore, the return of the subjects to sports or functional activities could be accelerated.
It is important to note that LEDT parameters used in this study were based on previous studies,11,13 applying a small energy per LED (1.5 J) and a total of 75 J distributed over the entire area of the quadriceps femoris muscles, and there were no adverse cumulative effects of the light. Previous studies have already reported that phototherapy can produce effects for 24 hours (in vitro and in vivo)8,17 and possibly as long as 48 hours in human skeletal muscles.16 It could be envisaged that cumulative exposure or excessive light doses could produce an inhibition or a lack of positive effects on human skeletal muscles based on the biphasic dose response3 typical of phototherapy as previously reported in the literature, but no evidence of this adverse effect was found in the present study.
There are several mechanisms of action that have been proposed to account for the effects of phototherapy on cells.39 All of these mechanisms are based on the light absorption by chromophores in the cells, especially by Cox inside the mitochondria, triggering improvements in muscle recovery and performance.12 The absorption of the light (from low-level lasers and LEDs) by Cox promotes modulations in cell metabolism altering the energetic state of the cells via increased mitochondrial membrane potential and increased synthesis of ATP and cyclic adenosine monophosphate,6–9,39 which in turn possibly modulate the synthesis rate of DNA and RNA via mitochondrial retrograde signaling.39
Although this study enrolled a pair of identical twins, living together and having the same diet and habits, to remove any genetic bias related to intrinsic individual responses to the exercises and/or the LEDT, future studies should enroll more volunteers to deeply investigate the molecular responses of muscles to exercise combined with phototherapy. In summary, the present study should encourage physical therapists to use LEDT as an adjuvant therapy in rehabilitation programs involving treatment of damaged skeletal muscles, as well as an adjuvant therapy for training programs to improve strength, fatigue resistance, and muscle mass.
ACKNOWLEDGMENTS
The authors thank Vilmar Baldissera, PhD, for his contribution to set up the strength training program. CF thanks FAPESP for his PhD scholarships (no. 2010/07194-7 and 2012/05919-0).
Footnotes
Disclosures:
CF received financial support from Fundação de Amparo à Pesquisa do Estado de São PauloYFAPESP as PhD scholarships (processes 2010/07194-7 and 2012/05919-0).
Financial disclosure statements have been obtained, and no conflicts of interest have been reported by the authors or by any individuals in control of the content of this article.
REFERENCES
- 1.Huikeshoven M, Koster PH, de Borgie CA, et al. Redarkening of port-wine stains 10 years after pulsed-dye-laser treatment. N Engl J Med. 2007;356:1235–40. doi: 10.1056/NEJMoa064329. [DOI] [PubMed] [Google Scholar]
- 2.Ibrahimi OA, Sakamoto FH, Anderson RR. Picosecond laser pulses for tattoo removal: a good, old idea. JAMA dermatology. 2013;149:241. doi: 10.1001/jamadermatol.2013.2136. [DOI] [PubMed] [Google Scholar]
- 3.Huang YY, Chen AC, Carroll JD, et al. Biphasic dose response in low level light therapy. Dose Response. 2009;7:358–83. doi: 10.2203/dose-response.09-027.Hamblin. [DOI] [PMC free article] [PubMed] [Google Scholar]
- 4.Chow RT, Johnson MI, Lopes-Martins RA, et al. Efficacy of low-level laser therapy in the management of neck pain: a systematic review and meta-analysis of randomised placebo or active-treatment controlled trials. Lancet. 2009;374:1897–908. doi: 10.1016/S0140-6736(09)61522-1. [DOI] [PubMed] [Google Scholar]
- 5.Enwemeka CS, Parker JC, Dowdy DS, et al. The efficacy of low-power lasers in tissue repair and pain control: a meta-analysis study. Photomed Laser Surg. 2004;22:323–9. doi: 10.1089/pho.2004.22.323. [DOI] [PubMed] [Google Scholar]
- 6.Karu T. Primary and secondary mechanisms of action of visible to near-IR radiation on cells. J Photochem Photobiol B. 1999;49:1–17. doi: 10.1016/S1011-1344(98)00219-X. [DOI] [PubMed] [Google Scholar]
- 7.Ferraresi C, Parizotto NA, Pires de Sousa MV, et al. Light-emitting diode therapy in exercise-trained mice increases muscle performance, cytochrome c oxidase activity, ATP and cell proliferation. J Biophotonics. 2015;8:740–54. doi: 10.1002/jbio.201400087. [DOI] [PMC free article] [PubMed] [Google Scholar]
- 8.Ferraresi C, Kaippert B, Avci P, et al. Low-level laser (light) therapy increases mitochondrial membrane potential and ATP synthesis in C2C12 myotubes with a peak response at 3–6 h. Photochem Photobiol. 2015;91:411–6. doi: 10.1111/php.12397. [DOI] [PMC free article] [PubMed] [Google Scholar]
- 9.Masha RT, Houreld NN, Abrahamse H. Low-intensity laser irradiation at 660 nm stimulates transcription of genes involved in the electron transport chain. Photomed Laser Surg. 2013;31:47–53. doi: 10.1089/pho.2012.3369. [DOI] [PubMed] [Google Scholar]
- 10.Borsa PA, Larkin KA, True JM. Does phototherapy enhance skeletal muscle contractile function and postexercise recovery? A systematic review. J Athl Train. 2013;48:57–67. doi: 10.4085/1062-6050-48.1.12. [DOI] [PMC free article] [PubMed] [Google Scholar]
- 11.Ferraresi C, de Brito Oliveira T, de Oliveira Zafalon L, et al. Effects of low level laser therapy (808 nm) on physical strength training in humans. Lasers Med Sci. 2011;26:349–58. doi: 10.1007/s10103-010-0855-0. [DOI] [PubMed] [Google Scholar]
- 12.Ferraresi C, Hamblin MR, Parizotto NA. Low-level laser (light) therapy (LLLT) on muscle tissue: performance, fatigue and repair benefited by the power of light. Photonics Lasers Med. 2012;1:267–86. doi: 10.1515/plm-2012-0032. [DOI] [PMC free article] [PubMed] [Google Scholar]
- 13.Vieira WH, Ferraresi C, Perez SE, et al. Effects of low-level laser therapy (808 nm) on isokinetic muscle performance of young women submitted to endurance training: a randomized controlled clinical trial. Lasers Med Sci. 2012;27:497–504. doi: 10.1007/s10103-011-0984-0. [DOI] [PubMed] [Google Scholar]
- 14.Douris P, Southard V, Ferrigi R, et al. Effect of phototherapy on delayed onset muscle soreness. Photomed Laser Surg. 2006;24:377–82. doi: 10.1089/pho.2006.24.377. [DOI] [PubMed] [Google Scholar]
- 15.Delfino GB, Peviani SM, Durigan JL, et al. Quadriceps muscle atrophy after anterior cruciate ligament transection involves increased mRNA levels of atrogin-1, muscle ring finger 1, and myostatin. Am J Phys Med Rehabil. 2013;92:411–9. doi: 10.1097/PHM.0b013e3182643f82. [DOI] [PubMed] [Google Scholar]
- 16.de Brito Vieira WH, Bezerra RM, Queiroz RA, et al. Use of low-level laser therapy (808 nm) to muscle fatigue resistance: a randomized double-blind crossover trial. Photomed Laser Surg. 2014;32:678–85. doi: 10.1089/pho.2014.3812. [DOI] [PubMed] [Google Scholar]
- 17.Ferraresi C, de Sousa MV, Huang YY, et al. Time response of increases in ATP and muscle resistance to fatigue after low-level laser (light) therapy (LLLT) in mice. Lasers Med Sci. 2015;30:1259–67. doi: 10.1007/s10103-015-1723-8. [DOI] [PubMed] [Google Scholar]
- 18.Pérusse L, Rankinen T, Hagberg JM, et al. Advances in exercise, fitness, and performance genomics in 2012. Med Sci Sports Exerc. 2013;45:824–31. doi: 10.1249/MSS.0b013e31828b28a3. [DOI] [PMC free article] [PubMed] [Google Scholar]
- 19.van Dongen J, Slagboom PE, Draisma HH, et al. The continuing value of twin studies in the omics era. Nat Rev Genet. 2012;13:640–53. doi: 10.1038/nrg3243. [DOI] [PubMed] [Google Scholar]
- 20.Coffey VG, Hawley JA. The molecular bases of training adaptation. Sports Med. 2007;37:737–63. doi: 10.2165/00007256-200737090-00001. [DOI] [PubMed] [Google Scholar]
- 21.Toigo M, Boutellier U. New fundamental resistance exercise determinants of molecular and cellular muscle adaptations. Eur J Appl Physiol. 2006;97:643–63. doi: 10.1007/s00421-006-0238-1. [DOI] [PubMed] [Google Scholar]
- 22.Tracy BL, Ivey FM, Jeffrey Metter E, et al. A more efficient magnetic resonance imaging-based strategy for measuring quadriceps muscle volume. Med Sci Sports Exerc. 2003;35:425–33. doi: 10.1249/01.MSS.0000053722.53302.D6. [DOI] [PubMed] [Google Scholar]
- 23.Ross R, Rissanen J, Pedwell H, et al. Influence of diet and exercise on skeletal muscle and visceral adipose tissue in men. J Appl Physiol (1985) 1996;81:2445–55. doi: 10.1152/jappl.1996.81.6.2445. [DOI] [PubMed] [Google Scholar]
- 24.Schilling BK, Fry AC, Chiu LZ, et al. Myosin heavy chain isoform expression and in vivo isometric performance: a regression model. J Strength Cond Res. 2005;19:270–5. doi: 10.1519/15374.1. [DOI] [PubMed] [Google Scholar]
- 25.Wernbom M, Augustsson J, Thomeé R. The influence of frequency, intensity, volume and mode of strength training on whole muscle cross-sectional area in humans. Sports Med. 2007;37:225–64. doi: 10.2165/00007256-200737030-00004. [DOI] [PubMed] [Google Scholar]
- 26.Ferraresi C, Baldissera V, Perez SEA, et al. One-repetition maximum test and isokinetic leg extension and flexion: correlations and predicted values. Isokinet Exerc Sci. 2013;21:69–76. [Google Scholar]
- 27.Papadopoulos C, Kalapotharakos VI, Chimonidis E, et al. Effects of knee angle on lower extremity extension force and activation time characteristics of selected thigh muscles. Isokinet Exerc Sci. 2008;16:41–6. [Google Scholar]
- 28.Dvir . Isokinetics: Muscle Testing, Interpretation and Clinical Applications. 2nd ed. Churchill Livingstone; New York, NY: 2004. [Google Scholar]
- 29.Pincivero DM, Gear WS, Sterner RL. Assessment of the reliability of high-intensity quadriceps femoris muscle fatigue. Med Sci Sports Exerc. 2001;33(2):334–8. doi: 10.1097/00005768-200102000-00025. [DOI] [PubMed] [Google Scholar]
- 30.Pincivero DM, Gandaio CM, Ito Y. Gender-specific knee extensor torque, flexor torque, and muscle fatigue responses during maximal effort contractions. Eur J Appl Physiol. 2003;89:134–41. doi: 10.1007/s00421-002-0739-5. [DOI] [PubMed] [Google Scholar]
- 31.Hornery DJ, Farrow D, Mujika I, et al. An integrated physiological and performance profile of professional tennis. Br J Sports Med. 2007;41:531–6. doi: 10.1136/bjsm.2006.031351. discussion 536. [DOI] [PMC free article] [PubMed] [Google Scholar]
- 32.Cheung K, Hume P, Maxwell L. Delayed onset muscle soreness: treatment strategies and performance factors. Sports Med. 2003;33(2):145–64. doi: 10.2165/00007256-200333020-00005. [DOI] [PubMed] [Google Scholar]
- 33.Schuelke M, Wagner KR, Stolz LE, et al. Myostatin mutation associated with gross muscle hypertrophy in a child. N Engl J Med. 2004;350:2682–8. doi: 10.1056/NEJMoa040933. [DOI] [PubMed] [Google Scholar]
- 34.Glass DJ. Signalling pathways that mediate skeletal muscle hypertrophy and atrophy. Nat Cell Biol. 2003;5:87–90. doi: 10.1038/ncb0203-87. [DOI] [PubMed] [Google Scholar]
- 35.Powers SK, Jackson MJ. Exercise-induced oxidative stress: cellular mechanisms and impact on muscle force production. Physiol Rev. 2008;88:1243–76. doi: 10.1152/physrev.00031.2007. [DOI] [PMC free article] [PubMed] [Google Scholar]
- 36.Vandesompele J, de Preter K, Pattyn F, et al. Accurate normalization of real-time quantitative RT-PCR data by geometric averaging of multiple internal control genes. Genome Biol. 2002;3:RESEARCH0034. doi: 10.1186/gb-2002-3-7-research0034. [DOI] [PMC free article] [PubMed] [Google Scholar]
- 37.Schmittgen TD, Livak KJ. Analyzing real-time PCR data by the comparative C(T) method. Nat Protocols. 2008;3:1101–8. doi: 10.1038/nprot.2008.73. [DOI] [PubMed] [Google Scholar]
- 38.Mantineo M, Pinheiro JP, Morgado AM. Low-level laser therapy on skeletal muscle inflammation: evaluation of irradiation parameters. J Biomed Opt. 2014;19:98002. doi: 10.1117/1.JBO.19.9.098002. [DOI] [PubMed] [Google Scholar]
- 39.Gao X, Xing D. Molecular mechanisms of cell proliferation induced by low power laser irradiation. J Biomed Sci. 2009;16:4. doi: 10.1186/1423-0127-16-4. [DOI] [PMC free article] [PubMed] [Google Scholar]
- 40.Sussai DA, Carvalho Pde T, Dourado DM, et al. Low-level laser therapy attenuates creatine kinase levels and apoptosis during forced swimming in rats. Lasers Med Sci. 2010;25:115–20. doi: 10.1007/s10103-009-0697-9. [DOI] [PubMed] [Google Scholar]
- 41.Ferraresi C, Dos Santos RV, Marques G, et al. Light-emitting diode therapy (LEDT) before matches prevents increase in creatine kinase with a light dose response in volleyball players. Lasers Med Sci. 2015;30:1281–7. doi: 10.1007/s10103-015-1728-3. [DOI] [PubMed] [Google Scholar]
- 42.Ferraresi C, Beltrame T, Fabrizzi F, et al. Muscular preconditioning using light-emitting diode therapy (LEDT) for high-intensity exercise: a randomized double-blind placebo-controlled trial with a single elite runner. Physiother Theory Pract. 2015;31:354–61. doi: 10.3109/09593985.2014.1003118. [DOI] [PMC free article] [PubMed] [Google Scholar]
- 43.Lopes-Martins RA, Marcos RL, Leonardo PS, et al. Effect of low-level laser (Ga-Al-As 655 nm) on skeletal muscle fatigue induced by electrical stimulation in rats. J Appl Physiol (1985) 2006;101:283–8. doi: 10.1152/japplphysiol.01318.2005. [DOI] [PubMed] [Google Scholar]
- 44.Hoffman JR, Kraemer WJ, Bhasin S, et al. Position stand on androgen and human growth hormone use. J Strength Cond Res. 2009;23(5 suppl):S1–59. doi: 10.1519/JSC.0b013e31819df2e6. [DOI] [PubMed] [Google Scholar]


