

Abstract
Background
Infantile hemangiomas (IH) are initially warm due to increased proliferation perfusion then involute with apoptosis and reduced perfusion. Objective quantitative evaluation of IH treatment response is essential for improving outcomes. We applied a functional imaging method, dynamic infrared (IR) thermography, to investigate IH status versus control skin and over time.
Materials and Methods
A preliminary prospective observational study was conducted among twenty-five subjects with superficial or mixed IHs (< 19 months) over 59 clinic visits. Infrared images of IHs and control sites, standardized color images and three-dimensional images were obtained. Tissue responses following application and removal of a cold stress were recorded with video IR thermography. Outcomes included areas under the curve during cooling (AUCcool) and rewarming (AUCrw) and thermal intensity distribution maps.
Results
AUCcool and AUCrw were significantly higher and cooling rate slower for IHs versus uninvolved tissue indicating greater heat, presumably due to greater perfusion and metabolism for the IH. IR distribution maps showed specific areas of high and low temperature. Significant changes in IH thermal activity were reflected in the difference (AUCcool – AUCrw), with 6.2 at 2.2 months increasing to 37.6 at 12.8 months. IH cooling rate increased with age, indicating slower recovery, and interpreted as reduced proliferation and/or involution.
Conclusions
Dynamic IR thermography was a well-tolerated, quantitative functional imaging modality appropriate for the clinic, particularly when structural changes, i.e., height, volume, color, were not readily observed. It may assist in monitoring progress, individualizing treatment and evaluating therapies.
Keywords: dynamic infrared thermography, infrared, functional imaging, quantitative imaging, infantile hemangioma, vascular tumors, propranolol
Introduction
Infantile hemangiomas (IHs) are benign rapidly proliferating vascular neoplasms with increased angiogenesis, perfusion and temperature versus uninvolved tissue. They may be superficial, deep or mixed based on the dermal involvement.1-4 Blood flow and temperature are elevated from microcirculation during proliferation until 6-10 months then decrease during involution over 7-10 years.5-8
Clinicians evaluate IHs from visual inspection, photography and palpation to infer extent of proliferation and involution. Histology provides structural and biomarker information but is impractical. Magnetic resonance imaging and computed topography are rarely used due to risks (sedation, radiation).9-13 Gray-scale and color Doppler ultrasound measure IH size, vasculature, and blood flow.14 However, quantitation requires trained, experienced ultrasound operators.11
Skin surface temperature depends upon blood perfusion, metabolism, thermal conductivity, drug effects, sympathetic nervous system activity, and environmental conditions.15-17 Infrared (IR) thermography records 7.5 – 13 μm radiation at the skin surface.16 It is a reliable technique to evaluate vascular function18; 19, vascular disease17; 20, tumors including breast cancer21; 22 and melanoma23, and infantile hemangiomas.24; 25 Tumor temperatures are higher than uninvolved skin26, due in part to differences in perfusion and metabolism.15; 27 Surface temperature is influenced by lesion size, i.e., higher with increasing size, and depth, i.e., inversely with vasculature distance.15; 28; 29
While static IR measures steady-state conditions, dynamic IR applies a stress (e.g., cooling, heating) to the skin altering the subsurface structures (vasculature). Thermal behavior is recorded as tissues respond to the stress to restore the original conditions. Thermal information, such as rate of rewarming and time to pre-stress temperature, thereby provides functional tissue information.30-32. Thereby, the IR behavior can reveal physiological abnormalities33, affording more information than static IR34. As tumors respond abnormally15, behavior after thermal stress may differentiate IHs from uninvolved tissue. Dynamic IR eliminates potentially confounding environmental effects.17
Dynamic IR has been used to quantify vascular and neurological conditions, e.g., neuropathy35-37, assess burn depth and predict healing time.38 Melanoma lesions had higher temperatures following cold stress than benign lesions and healthy skin by dynamic IR.20; 30; 39 Skin erythema associated with melanoma treatment (boron neutron capture therapy) a more rapid rewarming response to cold stress versus normal tissue.32
Proliferating IHs exhibit rapid endothelial growth, high type IV collagenase, proliferating cell nuclear antigen, proangiogenic factors and matrix metalloproteinases resulting in increased vasculature with compressed vessel lumens.6; 40; 41 They have high vessel density, high Doppler shifts, low resistance flow 42, and 2 to 3-fold increases in blood velocity compared to normal capillaries.14 Thermograms show higher temperatures for actively growing tumors.43 Endothelial cellular activity is significantly reduced and vascular channels dilate during involution.6; 40 The tightly packed endothelial matrix in proliferating IHs does not readily exhibit vasoconstriction and temperature reduction with cold stress, in contrast to normal tissue response of rapid vasoconstriction then vasodilation.
In developing objective, clinically feasible methods, we investigate dynamic IR thermography to characterize IHs versus uninvolved skin. In a preliminary study, we examine IH status as a function of time (age) in mixed or superficial IHs. Three-dimensional scans and standardized color images of IHs and controls are obtained since tumor size impacts the thermal signature.
Materials and Methods
Subjects
Subjects < 19 months old were enrolled from October 2011 to February 2013. Those with ulceration, IHs on the lip, eyelid, or genitals were excluded due to potential distress from cold exposure. The Institutional Review Board approved the protocol and parents/guardians provided written informed consent. Clinicians decided treatment as oral propranolol (1-2 mg/kg per day divided twice daily), topical timolol (0.5 mg timolol maleate 0.5% gel divided two applications)44 or observation (no treatment).
Experimental Procedure - Image Collection
Non-clinician research staff conducted the procedures after subject acclimation to room conditions without draughts for least 15 minutes. Subjects were maintained in a calm state throughout. High-resolution digital color images were taken 30 cm perpendicular to the sites (Nikon D90 camera, Micro Nikkor 60-mm lens, Nikon R1 Wireless Close-Up flash, Nikon Inc., Nikon Corporation, Tokyo, Japan).45 Three dimensional (3D) surface images were collected at 60 cm with an Artec MHT scanner (Artec Group, San Diego, CA, USA). Static IR images of IHs and controls were taken 60 cm perpendicular to the sites at an emissivity of 0.9816 (FLIR T400 camera, range 7.5 – 13 μm; uncooled microbolometer focal plan array detector, 320 × 240 pixels resolution; sensitivity < 0.05°C at 30°C; accuracy ± 2°C (<2%), factory calibration, FLIR Systems, Inc., Wilsonville, OR, USA).
Dynamic IR Image Collection
Next, a cold stress (Jack Frost™ insulated cold pack, Cardinal Health, McGaw Park, IL) was applied to the IH and adjacent skin for 30 sec (18 ± 0.2°C, coefficient of variation %CV of 0.03). Temperatures were video recorded (7 frames/sec) for 30 sec after removal, i.e., during rewarming.30; 46
Image Processing
Color corrected images were separated into L*, a* and b* channels (ImageJ, NIH, Washington, DC, USA)47, co-registered with static IR images and analyzed with a custom graphical user interface in MATLAB® (v7.14 (R2012a), MathWorks, Natick, MA, USA) 48. This generated a color image encompassing the region of IH thermal activity, typically extending beyond the visible borders. IH height and volume were determined using a distance map (3dMD Vultus Software, 3dMD, Atlanta, GA, USA).49
Dynamic data were extracted from video frames. The region of interest (ROI) was the temperature area higher than the uninvolved control at 30 sec (ExaminIR Software, FLIR Systems, Inc.) and used for all times. Data at cooling removal and over 30 seconds (5 sec intervals) generated rewarming curves.50 The highest 10% of temperature post cooling isolated the highest thermal activity within the IH and segmented it from uninvolved skin for a better signal to noise ratio versus thresholds.18; 51; 52 Outcomes were area under the curve during cooling (AUCcool) and rewarming (AUCrw), difference (AUCcool and AUCrw), temperature after cooling, cooling rate, rewarming rate, temperature changes with cooling (ΔT cool) and rewarming (ΔT rewarm), and temperature intensity distribution maps (Matlab®).
Statistical Analysis
Method reproducibility was the coefficient of variation (%CV = σ/μ*100). IH and controls were compared using univariate general linear models (GLM) with IH height, site and age as covariates with p < 0.05 (SPSS v21, SPSS, Inc., Chicago, IL). Data were stratified into four groups for time (age) effects: 1-2, 3-5, 6-9 and 10-18 months since rapid growth occurs between 6-9 weeks53, early proliferation before 3 months, most growth before 5 months, peak plateau around 7 months and involution after 10-12 months.54 Groups were compared using GLM with control values, IH height, treatment and static temperature as covariates and post-hoc least significant difference (LSD) for pairwise comparisons (p < 0.05). Factors influencing the dynamic responses were examined with multiple regression (backward) analyses.
Results
Subjects
Twenty-five subjects with 26 IHs (17 mixed, 9 superficial) participated. The age at first evaluation was 5.3 ± 3.2 months (range 1.6 – 13.6) for 19 females and 6 males. Ten received propranolol, 8 (9 IHs) received timolol and 7 were untreated. IHs were on the face/head (8), chest/abdomen/back (8), arm/shoulder (7) and leg/hip (3). Fifty-nine evaluations (mean 2 per subject) were distributed over 4 groups with ages at evaluation: 2.2, 4.5, 8.0 and 12.8 months (Table 1).
Table 1. The mean age at evaluation, number of evaluations and treatment status are shown for the four age strata.
| Age at Evaluation Mean ± SD | Number of Evaluations | No. Treated | No. Untreated | |
|---|---|---|---|---|
| Group 1 | 2.2 ± 0.7 | 7 | 7 | 0 |
| Group 2 | 4.5 ± 0.8 | 27 | 21 | 6 |
| Group 3 | 8.0 ± 1.1 | 13 | 11 | 2 |
| Group 4 | 12.8 ± 2.3 | 12 | 10 | 2 |
| Total | -- | 59 | 49 | 10 |
IR Imaging Method Reproducibility
Static IR reproducibility image collection after repositioning (13 subjects, two days) had coefficients of variation of 0.01 – 0.36 and 0.09 – 0.32, respectively. Camera distance at 45, 60 and 75 cm (6 subjects) had %CV of 0.02 – 0.59 for static IR. Color-IR image co-registration and ROI selection reproducibility was determined (4 IHs, 2 tests) by upsampling the IR image to match the color image size and a bilinear interpolation to calculate pixel intensity by linearly weighting the 4 closet neighboring values. The %CVs were 0.01 – 0.06 for static temperature and 0.0 – 6.4 for area above the highest 10% of temperature. Static skin temperatures for contralateral and adjacent sites were 32.7° ± 1.2°C and 32.5° ± 1.4°C, respectively (n = 24, p = 0.36). Adjacent skin sites served as controls to minimize the cooling procedures.30; 46
Dynamic IR: Hemangiomas versus Control Sites
Dynamic IR outcomes revealed significant differences for IHs versus control sites (Table 2). Temperature post cooling, AUCcool, AUCrw and static IR were higher for IHs than controls (p < 0.001) (Figure 1). The temperature drop with cooling was smaller, cooling rate lower, and difference (AUCcool – AUCrw) smaller for IH than controls. The temperature difference (IH – control) was greater after 30 sec cooling than the static difference with values of 3.7 ± 1.9 °C and 1.1 ± 0.7 °C, respectively (p = 0.017). Similarly, dynamic outcomes and static temperature for IH versus control differenced significantly for each group (data not shown), with only AUCrw, AUCcool, and temperature after cooling differing for 12.8 months.
Table 2. The static and dynamic thermal imaging outcomes for IH and control sites are provided as mean values, confidence interval at 95%, confidence interval at 95% for the difference, and statistical parameters.
| Outcome | Hemangioma | Control | 95% CI for Difference | F statistic, P value |
|---|---|---|---|---|
| Static | ||||
| Mean Temperature, °C | 35.36 (35.03 – 35.70) | 32.95 (33.60 – 34.39) | 1.42 (0.83 – 2.00) | 23.2, p < 0.001 |
| Temperature, highest 10% | 35.97 (35.65 – 36.30) | 34.36 (34.03 – 34.70) | 1.61 (1.04 – 2.18) | 31.8, < 0.001 |
| Dynamic | ||||
| Difference AUC cooling-AUC rewarming, highest 10% | 22.7 (15.2 – 30.2) | 38.8 (31.0 – 46.5) | 16.1 (2.9 – 29.3) | 5.89, 0.017 |
| AUC cooling, highest 10% | 1043.2 (1028.9 – 1057.4) | 973.6 (959.0 – 988.3) | 69.5 (44.6 – 94.5) | 30.7, < 0.001 |
| AUC rewarming, highest 10% | 1020.5 (1000.8 – 1040.2) | 934.8 (914.5 – 955.1) | 85.6 (51.1 – 120.1) | 24.3, < 0.001 |
| Temperature immediately after cooling | 33.64 (32.90 – 34.39) | 30.56 (29.79 – 31.33) | 3.09 (1.78 – 4.39) | 22.0, < 0.001 |
| ΔT with cooling | -1.68 (-2.37 - -1.00) | -4.00 (-4.70 - - 3.29) | 2.31 (1.11 – 3.51) | 14.7, < 0.001 |
| ΔT with rewarming | 0.50 (0.22 – 0.79 | 0.96 (0.67 – 1.26) | 0.46 (-0.96 – 0.05) | 3.2, 0.075 |
| Cooling rate, highest 10% | -0.08 (-0.10 – - 0.05) | -0.13 (-0.15 - -0.10) | 0.05 (0.01 – 0.09) | 6.6, 0.012 |
Figure 1. Dynamic Thermal Imaging Outcomes.
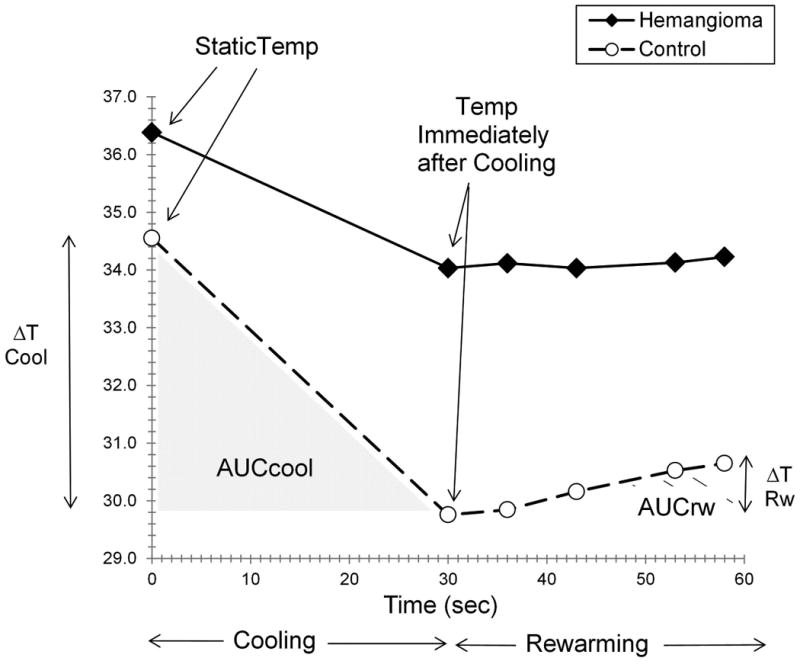
Figure 1 shows the behavior of an IH and uninvolved control site during application and removal of a cold stress for a subject with AUCrw comparable to the overall mean. AUCcool, AUCrw, temperature after cooling, ΔT cool, ΔT rewarm and static temperature are indicated.
Example Dynamic Thermal Output
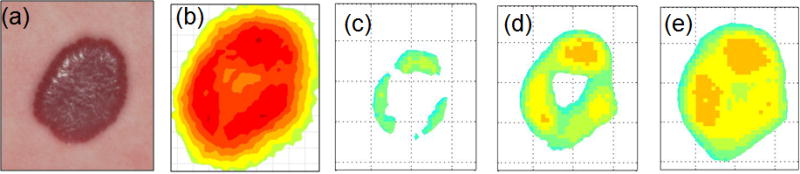
Figure 2 shows color and IR images before cooling (static), after stress removal, and during rewarming for a mixed IH treated with propranolol. The co-registered plots show the corresponding IR intensity distributions (highest 10% temperature). The area decreased from 2252 to 247 pixels upon cooling, with temperatures of 36.1 °C and 35.0 °C. There was a rapid increase in both thermal area and intensity by 5 sec after cooling (time 35 sec).
Figure 2. Dynamic Thermal Response.
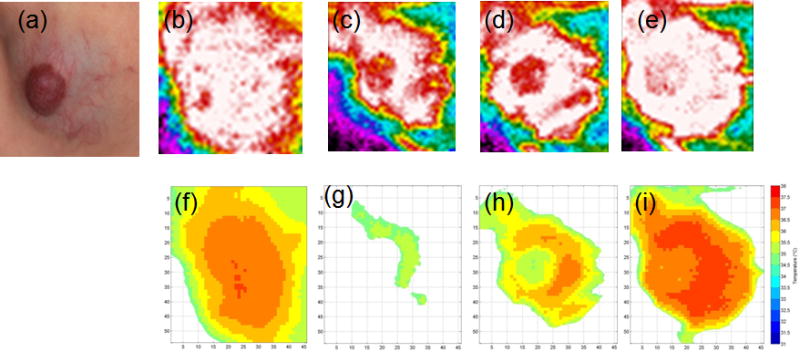
Figure 2 illustrates the color image, corresponding static IR image and dynamic IR images over 60 seconds for a mixed IH treated with propranolol (a). Thermal intensity is indicated by colors (white highest, red, orange, yellow, green, etc.) in panels (b) prior to cooling, (c) after 30 seconds of cooling, (d) after 5 seconds of rewarming, and after 30 seconds of rewarming (e). The co-registered color and static IR images (panel a) show the hemangioma thermal area of involvement to extend beyond the visible borders in the color image. The graphs show thermal distributions of the highest 10% of temperature. The graphs (panels f – i) show the areas of highest thermal activity relative to the color image (panel a). Before cooling (static, time 0), temperature and area were 36.1 °C and 2252 pixels, respectively (panel f). Immediately after cool stress removal (T30 sec), temperature and area were 35.0 °C and 247 pixels, respectively (panel g). Five seconds later (T35 sec), temperature and area were 35.8 °C, respectively (panel h). After 30 seconds of rewarming (T60 sec), temperature and area were 36.4 °C and 1787 pixels (panel i). Graph colors indicate temperature, i.e., red color indicates 37.5 – 38.0 °C (panels f – i). IR areas increased over time after cooling (panels g – i). The area of 1787 pixels after 30 seconds of rewarming was lower than the pre-cooling value of 2252, indicating the area had not yet returned to pre-cooling levels.
Dynamic Thermal Response versus Age
Significant changes by age group were found (Table 3). Difference (AUCcool – AUCrw) increased with 2.2 and 12.8 mo being different from all others (p < 0.001). AUCrw and temperature after cooling decreased with increasing age, higher at 2.2 months than all others (p = 0.007, p = 0.009, respectively). The temperature drop (ΔT cooling) and cooling rate increased, with significant differences at 2.2 months versus all others and 4.5 months versus 12.8 months (p = 0.005, p = 0.001, respectively) (Table 3). AUCcool decreased but did not reach significance (p = 0.06). Control site values were included as covariates since they also varied by age (data not shown).
Table 3. The dynamic thermal, color, 3D and size outcomes by age group are shown as mean values, 95% confidence interval, statistical results from GLM analyses and post-hoc pairwise comparisons.
| Outcome | Group 1 Age 2.2 mo |
Group 2 Age 4.5 mo |
Group 3 Age 8.0 mo |
Group 4 Age 12.8 mo |
Statistics F, p value |
Significance Pairwise Comparisons |
|---|---|---|---|---|---|---|
| Dynamic IR | ||||||
| Difference (AUCcool – AUCrw), °C•sec | 6.2 (-4.0 – 16.4) |
21.2 (16.0 – 26.5) |
21.3 (13.8 – 28.8) |
37.6 (29.8 – 45.3) |
8.66, < 0.001 | 1 –s- all, 4 –s- all |
| AUCcool, °C•sec | 1076 (1053 – 1098) |
1041 (1030 – 1052) |
1052 (1036 – 1068) |
1042 (1026 – 1059) |
2.63, 0.060 | ns |
| AUCrw, °C•sec | 1072 (1042 – 1101) |
1019 (1004 – 1035) |
1031 (1009 – 1053) |
1004 (982 – 1027) |
4.51, 0.007 | 1 –s- all |
| Temp immediately after cooling, °C | 35.41 (34.34 – 36.48) |
33.60 (33.04 – 34.15) |
33.72 (32.97 – 34.53) |
33.03 (32.23 – 33.83) |
4.29, 0.009 | 1 –s- all |
| ΔT cooling, °C | -0.63 (-1.53 – 0.264) |
-1.66 (-2.13 - - 1.20) |
-1.83 (-2.49 - - 1.17) |
-2.66 (-3.35 - - 1.98) |
4.57, 0.006 | 1 –s- all 2 –s- 4 |
| ΔT rewarming, °C | 0.53 (0.17 – 0.89) |
0.55 (0.36 – 0.74) |
0.79 (0.53 – 1.05) |
0.68 (0.53 – 0.96) |
0.88, 0.456 | ns |
| Cooling rate, °C/sec | -0.041 (-0.068 - - 0.013) |
-0.073 (-0.088 - - 0.059) |
-0.086 (- 0.106 - - 0.065) |
- 0.111 (-0.133 - - 0.090) |
6.04, 0.001 | 1 –s- all 2 –s- 4 |
| Color, 3D and Size Outcomes | ||||||
| Lightness Intensity | -26.5 (-33.0 - - 20.0) |
-19.0 (-22.1 – -16.0) |
-15.3 (-19.9 - -10.7) |
-19.3 (-24.7 - -13.9) |
2.96, 0.048 | 1 –s- 2,3 |
| Height, mm | 5.4 (3.2 – 7.6) |
6.4 (5.4 – 7.4) |
4.4 (3.0 – 5.9) |
3.7 (1.9 – 5.5) |
3.14, 0.040 | 2 –s- 3,4 |
| Volume, mm3 | 1.1 (-2.6 – 4.8) |
5.8 (3.9 - 7.7) |
2.5 (-0.2 – 5.2) |
5.4 (2.6 – 8.2) |
2.62, 0.060 | ns |
| IR Intensity, static IR | 0.88 (0.34 – 1.42) |
1.20 (0.94 – 1.45) |
1.16 (0.78 – 1.55) |
0.77 (0.32 – 1.22) |
1.05, 0.386 | ns |
| Red Color Mean | 151.9 (149.5 – 154.2) |
147.7 (146.7 - 148.7) |
147.2 (145.7 – 148.6) |
147.7 (146.0 – 149.5) |
4.13, 0.015 | 1 –s- all |
| Size from color photo, pixels | 46373 (37602 – 55143) |
46856 (42740 – 50973) |
53724 (47533 – 59914) |
44463 (37161 – 51766) |
1.55, 0.222 | ns |
Figure 3 illustrates dynamic IR responses for two subjects, with the corresponding height, size and color data (Table 4). A progressive decrease in AUCcool and AUCrw from 2 to 12 months occurred for the IH treated with timolol (Fig 3a). Little change upon cooling was found from 4.9 to 8.9 months in a propranolol-treated IH (Fig 3b).
Figure 3. a,b Dynamic IR Responses Over Time.
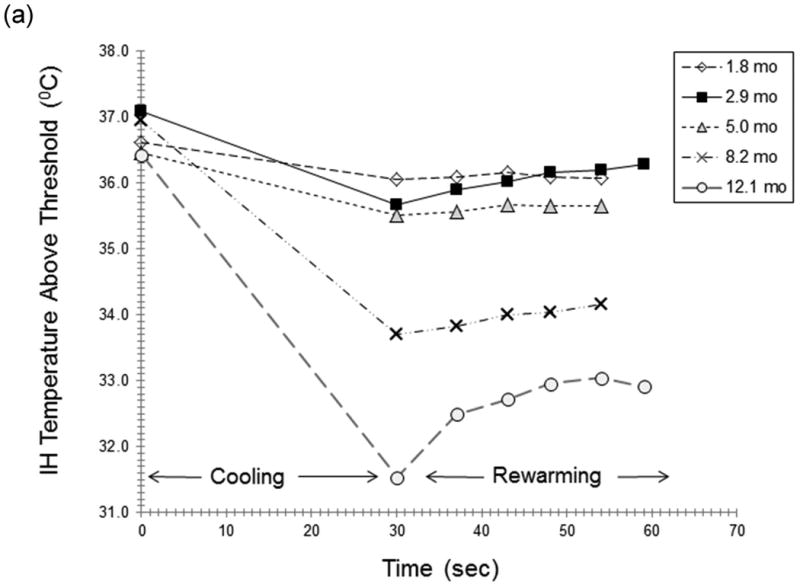
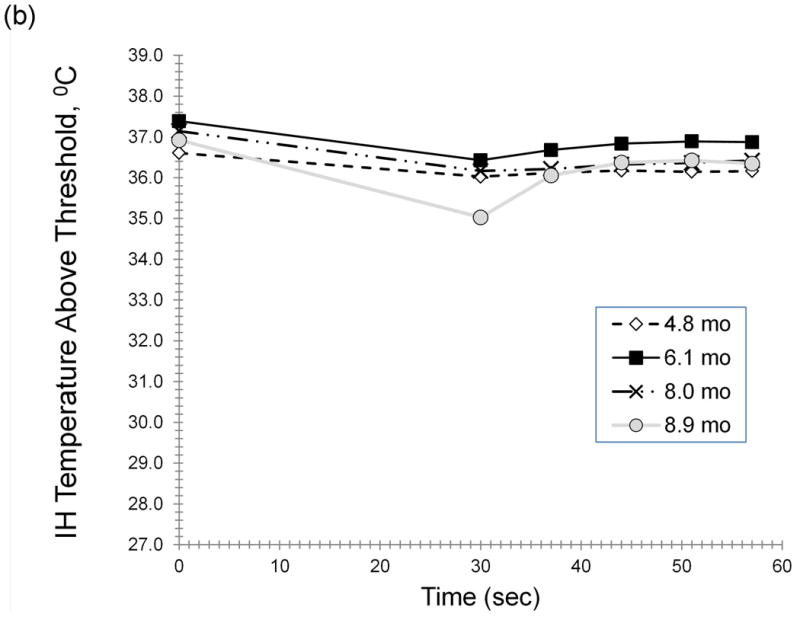
Figure 3 illustrates the dynamic IR responses over time for two individual subjects. A progressive reduction in AUCcool and AUCrw from 2 to 12 months was observed for an IH treated with topical timolol (Fig 3a). Curves are shown for responses at 1.8 (-◊-), 2.9 (-■-), 5.0 (-Δ-), 8.2 (-x-) and 12.1 (-o-) months (Fig 3a). Little change in response to cooling was found from 4.9 to 8.9 months in a subject receiving oral propranolol (Fig 3b). Curves are shown for cooling responses at 4.8 (-◊-), 6.1 (-■-), 8.0 (-x-) and 8.9 (-o-) months
Table 4. The age and quantitative data for IH height, size measured from the color image, and red color intensity are shown for the two subjects in Figure 3 A,B.
Color, Size with Age and Regression Modeling
Lightness intensity decreased (lighter) with differences at 2.2 versus 4.5 and 8.0 months (p = 0.048) (Table 3). Height decreased and 4.5 differed from 8.0 and 12.8 months. Red color was greater at 2.2 months than all others. Static IR (intensity) and IH size (color image) did not differ with age. AUCrw was influenced by age, IH height, IH volume, and static IR difference (IH – control) with model R = 0.708, R2 = 0.502 and analysis of variance F = 10.7, p < 0.001. Model results were similar for difference (AUCcool – AUCrw) and AUCcool.
Thermal Intensity and Distribution Maps
Figure 4 and 5 display dynamic IR thermal intensity distribution maps for a proliferating superficial IH at 1.8 months (Fig 4) and an untreated mixed IH at 13.4 months (Fig 5). The thermal ROI extended beyond the visible IH borders prior to cooling. The area decreased markedly with cooling, with only regions of highest thermal activity detected, and then increased. Figure 6 shows co-registered maps, immediately after cooling for IHs in Figures 2, 4 and 5, providing pictures showing varying regions of IH thermal activity.
Figure 4. Thermal Intensity Distribution Map 1.
The figure shows co-registered color images (panel a) and thermal distribution maps (panels b – e) before cooling and during rewarming. The superficial IH was approximately 1.8 cm × 1.6 cm (color image, panel a) at 1.8 months before initiation of topical timolol treatment. The temperature is lower in the center (panel b), 36.7 °C and 1296 pixels in area. After cooling, the highest temperatures were in regions toward the periphery with increasing activity at the top and left (panels d, e)). The area of the highest 10% temperature increased from 150 pixels (panel c, temperature 34.7 °C), to 503 pixels (panel d, temperature 35.2 °C) and 753 pixels (panel e, temperature 35.5 °C) over 26 seconds of rewarming. The area (panel e) was smaller than the static image (panel b) indicating that the IH had not yet returned to static conditions. The temperature increased from 34.7 to 35.5 °C.
Figure 5. Thermal Intensity Distribution Map 2.
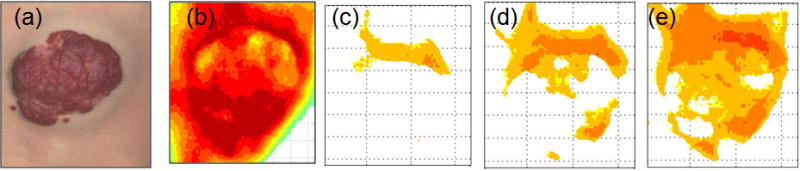
The figure shows co-registered color images and thermal distribution maps before cooling and during rewarming. The untreated mixed IH was approximately 4.3 cm × 3.7 cm (color image, panel a) at 13.4 months. Prior to cooling, the highest temperatures were at the top and bottom with cooler regions toward the center (panel b). After cooling and during rewarming, the highest activity was at the top and in the deep portion of the IH (panels c, d, e). The thermal area increased from 485 pixels after 30 sec of cooling (panel c, temperature 36.3 °C), to 1440 pixels after 7 seconds of rewarming (panel d, temperature 36.3 °C), and 2857 pixels after 29 seconds of rewarming (panel c, temperature 36.4 °C). Temperature increased from 36.2 to 36.4 °C. Lower temperatures were noted in the superficial portion (panels a, c, d, e).
Figure 6. Thermal Distribution Maps with Color Images.
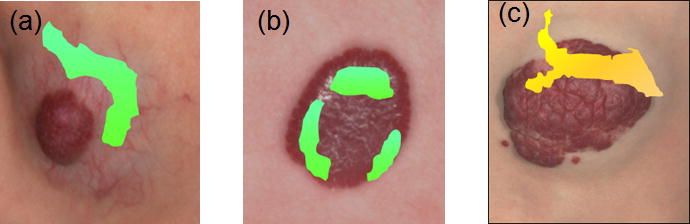
The figure shows color images of three hemangiomas overlaid with the corresponding thermal distribution maps. immediately after the 30 sec cool stress. Panel (a) is the mixed IH treated with propranolol from Figure 2 where Fig 2 (a) is overlaid with the thermal map of Fig 2 (g). The area of highest thermal activity is in the deeper portion above the red superficial area. Panel (b) is the superficial IH in Figure 4 prior to initiation of timolol therapy where Fig 4 (a) is overlaid with the thermal map of Fig 4 (c). The highest thermal activity is at the outer edges of the hemangioma. Panel (c) is the untreated mixed IH in Figure 5 where Fig 5 (a) is overlaid with Fig 5 (c). The highest thermal activity is at the top portion of the red superficial portion.
Discussion
The preliminary study aims were to examine functional imaging, i.e., dynamic IR thermography, characterize IH status versus uninvolved skin and objectively quantify changes over time. The clinically feasible method demonstrated significant differences in response to a cold stress among 25 subjects < 19 months with 59 evaluations. AUCcool and AUCrw were significantly higher and cooling rate slower for IHs than controls. Significant changes in IH thermal activity were reflected in difference (AUCcool – AUCrw) with the lowest value of 6.2 at 2.2 months increasing to 37.6 at 12.8 months (Table 3) and associated with reduced AUCrw. Dynamic outcomes depended upon age, IH height, IH volume and static temperature difference. Dynamic IR intensity distribution maps provided clinical pictures of specific high and low temperature areas relative to the color image (Figures 2, 4). Method variance was acceptable.47; 55
The dynamic data suggested greater IH thermal activity, likely due to more perfusion and metabolism, than uninvolved tissue15; 23; 27, resulting in lower susceptibility to cold exposure and greater capacity to recover than normal skin. Higher AUCrw at 2.2 months implied increased thermal activity, e.g., greater perfusion, metabolism, than older groups (Table 4), and was consistent with rapid endothelial cell proliferation.4 All group 1 IHs were classified clinically as proliferating. Delayed IH recovery after cooling with increasing age indicated changes consistent with involution including decreases in cell activity, vascular channels and perfusion.6; 40; 56 IH behavior after cooling depended on height, volume, static temperature difference and age. These dimensions must be considered in interpreting functional responses.
High variability in IH size, type, time and rate of resolution57 provide challenges for clinicians and families as changes can be difficult to detect.25 Dynamic IR imaging may reveal changes when other modalities do not. The IH in Figure 3a showed a progressively slower recovery from stress over 10 months, as demonstrated by decreasing AUCrw, despite slight changes in height and size (Table 4). Variation in IH blood velocity and volume occurred with simultaneous proliferation and involution.14 Decreasing AUCrw indicated relatively more areas of involution. In contrast, the IH in Figure 3b demonstrated little variation in the response over 4 months and increasing size. Dynamic IR may assist in identifying non-responders and/or IHs that rebound with treatment withdrawal, as in Figure 3b.
Our findings were consistent with previous reports on IH evaluation with IR techniques and extended them by adding dynamic IR to assess function. IR imaging detected differences of 3.0 ± 0.4°C versus uninvolved tissue in proliferating IHs.19 Localized static IR temperature (IH - contralateral control) decreased by 1.5°C (2.7°F) over six months for mixed or deep tumors corresponding to IH improvement (visual analog scale, VAS).24 Decreases in IR temperature (difference IH - control) occurred over 18 months, with highest values at 3 months and significant IH improvement (VAS).25 Reported differences of 1.1, 1.4, 0.9 and 0.6°C at baseline, 3, 12 and 15 months were lower than our static values of 1.2, 1.9, and 1.7°C at months 2.2, 4.5 and 12.8, respectively, perhaps due to variations in the IR devices and/or IH characteristics, treatment, etc. We averaged temperatures over the total IH area in contrast to local temperatures at the tumor center. Baseline IH surface area, depth, location and age impacted the temperature change. IH area was not significant in our model. In contrast to others, we found higher thermal activity for IHs versus controls even for subjects of 12 – 15 months. This suggested that heat sources remained after structural changes (Table 3), although height and volume directly impacted dynamic IR outcomes. IR imaging did not differentiate the location (depth) of heat and surface intensity maps revealed all heat within the tissue.58
IH thermal maps indicated specific regions where proliferation (higher temperature) continued and involution (reduced temperature) had begun (Figures 2, 4, 5, 6). The highest temperature in Figure 2 (time 30) was in the deeper component and may have been due to prolonged growth.54; 59 The temperature was lower in the center in Figure 4. The warmest regions weretoward the IH periphery after cooling (superimposed to color image, Figure 6), with increasing activity at the top and left during rewarming. The highest temperatures were at the top and bottom in static Figure 5. After cooling, the highest activity was at the top (Figure 6), with lower temperatures in the superficial portion. Doppler ultrasound found minimal changes in IH peripheral vascularity with propranolol60, perhaps consistent with persisting thermal activity after reduction in IH size.
Our finding of greater thermal activity for subjects in the youngest age group is, perhaps, relevant for premature infants. The occurrence of IHs was markedly higher in premature infants, with rates of 23% for neonates < 1000 g, compared to 1 – 4% among full term infants.61 Significant improvement in hemangiomas was observed among 9 premature and 7 full term infants after two months of systemic propranolol.62 Complex hemangiomas (disfiguring, ulcerated, impairing function) in 10 premature, 6 extremely premature and 8 full term infants were treated for 6 – 13 months with oral propranolol and scored for color, texture, size and thickness.63 The response to treatment, i.e., percent improvement, was significantly greater in premature at 81% than full term infants at 50%. This finding suggests that frequent evaluation of IHs in premature infants may further elucidate growth characteristics and differentiate treatment effects. Based on our experience, dynamic thermal imaging can be used with premature infants and offers the potential to discern physiological changes over time.
Some of specific features of this study were noteworthy, for they both emphasize the utility and potential limitations of the results. We did not measure perfusion via Doppler ultrasound. Dynamic thermography did not quantify perfusion64; 65 since it detected all heat sources heat. Studies comparing laser Doppler imaging and IR thermography techniques had variable results. The methods were not well correlated for Raynaud's disease66 or healthy subjects after cold stress.67 Conversely, they were correlated in studies of cutaneous microvascular flow68; 69 and at the distal artery after occlusive hyperaemia.70 IR thermography had been used extensively when sources of thermal activity other than perfusion are involved, e.g., tumor metabolism15; 21-23; 26, and thereby suited for IHs.
The study was not a randomized controlled comparison. The population varied in number of evaluations and intervals between visits, necessitating age classification to evaluate responses over time. Since most IH growth occurred between 2 – 5 months, we did not capture the early changes for many subjects.53; 54 The findings were limited to early IH progression, ages < 19 months. The small sample size prevented examination of treatment, although we used significant factors, e.g., height, treatment, as covariates. We combined superficial and mixed IHs, a potential confounder as growth rates vary by IH type.54 Additional studies with early enrollment, multiple visits and longer duration are warranted to fully evaluate IH growth and regression, compare dynamic IR to Doppler ultrasound and determine specific treatment effects.
Nevertheless, dynamic IR imaging was a well-tolerated, noninvasive, quantitative functional imaging modality appropriate for the clinic, particularly since changes within the IH cannot be observed by clinical assessment71 of structural features, i.e., height, volume, size, color. Dynamic IR may be a method to assist clinicians in differentiating current or new therapies54 and tracking treatment response, as changes could be detected prior to visible changes. Thermal distribution maps can potentially be used in administration of local treatments targeted to reach IH areas of continuing activity. It may be useful in identifying non-responders72 and monitoring individual progress.73 This method could be used to understand the functional basis for the immediate improvement upon initiation of propranolol.74 Future studies with dynamic IR are warranted as investigators seek validated methods to determine IH status.31
Acknowledgments
This research was funded by the Society of Pediatric Dermatology, American Foundation of Pharmaceutical Education Pre-Doctoral Fellowship, Center for Clinical & Translational Science & Training, and Imaging Research Center. The project was supported by the National Center for Research Resources and the National Center for Advancing Translational Sciences, National Institutes of Health, through Grant 8 UL1 TR000077-05. The content is solely the responsibility of the authors and does not necessarily represent the official views of the NIH
Abbreviations
- AUC
area under the curve
- AUCcool
area under the curve during cooling
- AUCrw
area under the curve during rewarming
- CCHMC
Cincinnati Children's Hospital Medical Center
- CV
coefficient of variation
- ΔT Cool
temperature difference between baseline and cooling
- ΔT Rewarm
temperature change during rewarming
- GLM
general linear models
- HVMC
Hemangioma and Vascular Malformation Center
- IH
infantile hemangioma
- IR
infrared
- LSD
least significant difference
- ROI
region of interest
- 3D
three dimensional
- T
time
- VAS
visual analog scale
Footnotes
Clinical Trial Registration: www.clinicaltrials.gov (Identifier NCT02061735)
Financial Disclosure: The authors have no financial relationships relevant to this article to disclose.
Conflict of Interest: The authors have no conflicts of interest in relation to this article to disclose.
References
- 1.Folkman J. Tumor angiogenesis. Adv Cancer Res. 1974;19:331–358. doi: 10.1016/s0065-230x(08)60058-5. [DOI] [PubMed] [Google Scholar]
- 2.Marchuk DA. Pathogenesis of hemangioma. J Clin Invest. 2001;107:665–666. doi: 10.1172/JCI12470. [DOI] [PMC free article] [PubMed] [Google Scholar]
- 3.Bischoff J. Progenitor cells in infantile hemangioma. J Craniofac Surg. 2009;20(Suppl 1):695–697. doi: 10.1097/SCS.0b013e318193d6ac. [DOI] [PMC free article] [PubMed] [Google Scholar]
- 4.Ritter MR, Butschek RA, Friedlander M, Friedlander SF. Pathogenesis of infantile haemangioma: new molecular and cellular insights. Expert Rev Mol Med. 2007;9:1–19. doi: 10.1017/S146239940700052X. [DOI] [PubMed] [Google Scholar]
- 5.Marler JJ, Mulliken JB. Current management of hemangiomas and vascular malformations. Clin Plast Surg. 2005;32:99–116. ix. doi: 10.1016/j.cps.2004.10.001. [DOI] [PubMed] [Google Scholar]
- 6.Mulliken JB, Glowacki J. Hemangiomas and vascular malformations in infants and children: a classification based on endothelial characteristics. Plast Reconstr Surg. 1982;69:412–422. doi: 10.1097/00006534-198203000-00002. [DOI] [PubMed] [Google Scholar]
- 7.Drolet BA, Esterly NB, Frieden IJ. Hemangiomas in children. N Engl J Med. 1999;341:173–181. doi: 10.1056/NEJM199907153410307. [DOI] [PubMed] [Google Scholar]
- 8.Rasalkar DD, Chu WC, Cheng FW, Lee V, Lee KH, Li CK. An institutional review of paediatric haemangiomas: prevalence, imaging features, and outcomes. Hong Kong Med J. 2010;16:334–340. [PubMed] [Google Scholar]
- 9.Dubois J, Garel L. Imaging and therapeutic approach of hemangiomas and vascular malformations in the pediatric age group. Pediatr Radiol. 1999;29:879–893. doi: 10.1007/s002470050718. [DOI] [PubMed] [Google Scholar]
- 10.Baker LL, Dillon WP, Hieshima GB, Dowd CF, Frieden IJ. Hemangiomas and vascular malformations of the head and neck: MR characterization. AJNR Am J Neuroradiol. 1993;14:307–314. [PMC free article] [PubMed] [Google Scholar]
- 11.Spierer O, Neudorfer M, Leibovitch I, Stolovitch C, Kessler A. Colour Doppler ultrasound imaging findings in paediatric periocular and orbital haemangiomas. Acta Ophthalmol. 2012;90:727–732. doi: 10.1111/j.1755-3768.2011.02155.x. [DOI] [PubMed] [Google Scholar]
- 12.Burrows PE, Laor T, Paltiel H, Robertson RL. Diagnostic imaging in the evaluation of vascular birthmarks. Dermatol Clin. 1998;16:455–488. doi: 10.1016/s0733-8635(05)70246-1. [DOI] [PubMed] [Google Scholar]
- 13.Argenta LC, David LR, Sanger C, Park C. Advances in hemangioma evaluation and treatment. J Craniofac Surg. 2006;17:748–755. doi: 10.1097/00001665-200607000-00028. [DOI] [PubMed] [Google Scholar]
- 14.Verity DH, Restori M, Rose GE. Natural history of periocular capillary haemangiomas: changes in internal blood velocity and lesion volume. Eye (Lond) 2006;20:1228–1237. doi: 10.1038/sj.eye.6702387. [DOI] [PubMed] [Google Scholar]
- 15.Wu Z, Liu HH, Lebanowski L, Liu Z, Hor PH. A basic step toward understanding skin surface temperature distributions caused by internal heat sources. Phys Med Biol. 2007;52:5379–5392. doi: 10.1088/0031-9155/52/17/019. [DOI] [PubMed] [Google Scholar]
- 16.Jones BF. A reappraisal of the use of infrared thermal image analysis in medicine. IEEE Trans Med Imaging. 1998;17:1019–1027. doi: 10.1109/42.746635. [DOI] [PubMed] [Google Scholar]
- 17.Fujimasa I, Chinzei T, Saito I. Converting far infrared image information to other physiological data. IEEE Eng Med Biol Mag. 2000;19:71–76. doi: 10.1109/51.844383. [DOI] [PubMed] [Google Scholar]
- 18.Janicek MJ, Demetri G, Janicek MR, Shaffer K, Fauci MA. Dynamic infrared imaging of newly diagnosed malignant lymphoma compared with Gallium-67 and Fluorine-18 fluorodeoxyglucose (FDG) positron emission tomography. Technol Cancer Res Treat. 2003;2:571–578. doi: 10.1177/153303460300200609. [DOI] [PubMed] [Google Scholar]
- 19.Saxena AK, Willital GH. Infrared thermography: experience from a decade of pediatric imaging. Eur J Pediatr. 2008;167:757–764. doi: 10.1007/s00431-007-0583-z. [DOI] [PubMed] [Google Scholar]
- 20.O'Reilly D, Taylor L, el-Hadidy K, Jayson MI. Measurement of cold challenge responses in primary Raynaud's phenomenon and Raynaud's phenomenon associated with systemic sclerosis. Ann Rheum Dis. 1992;51:1193–1196. doi: 10.1136/ard.51.11.1193. [DOI] [PMC free article] [PubMed] [Google Scholar]
- 21.Joro R, Laaperi AL, Soimakallio S, et al. Dynamic infrared imaging in identification of breast cancer tissue with combined image processing and frequency analysis. J Med Eng Technol. 2008;32:325–335. doi: 10.1080/03091900701541240. [DOI] [PubMed] [Google Scholar]
- 22.Wang J, Chang KJ, Chen CY, et al. Evaluation of the diagnostic performance of infrared imaging of the breast: a preliminary study. Biomed Eng Online. 2010;9:3. doi: 10.1186/1475-925X-9-3. [DOI] [PMC free article] [PubMed] [Google Scholar]
- 23.Cetingul MP, Herman C. The assessment of melanoma risk using the dynamic infrared imaging technique. Journal of Thermal Science and Engineering Applications. 2011;3 031006-031001-031006-031009. [Google Scholar]
- 24.Garcia-Romero MT, Chakkittakandiyil A, Pope E. The role of infrared thermography in evaluation of proliferative infantile hemangiomas. Results of a pilot study. Int J Dermatol. 2014;53:e216–217. doi: 10.1111/ijd.12045. [DOI] [PubMed] [Google Scholar]
- 25.Mohammed JA, Balma-Mena A, Chakkittakandiyil A, Matea F, Pope E. Infrared Thermography to Assess Proliferation and Involution of Infantile Hemangiomas: A Prospective Cohort Study. JAMA Dermatol. 2014 doi: 10.1001/jamadermatol.2014.112. [DOI] [PubMed] [Google Scholar]
- 26.Keyserlingk JR, Ahlgren PD, Yu E, Belliveau N, Yassa M. Functional infrared imaging of the breast. IEEE Eng Med Biol Mag. 2000;19:30–41. doi: 10.1109/51.844378. [DOI] [PubMed] [Google Scholar]
- 27.Tepper M, Gannot I. Parametric study of different contributors to tumor thermal profile. Proc SPIE. 2014;8940 89400P-89401-89400P-89412. [Google Scholar]
- 28.Draper JW, Boag JW. Skin temperature distributions over veins and tumours. Phys Med Biol. 1971;16:645–654. doi: 10.1088/0031-9155/16/4/008. [DOI] [PubMed] [Google Scholar]
- 29.Deng ZS, Liu J. Mathematical modeling of temperature mapping over skin surface and its implementation in thermal disease diagnostics. Comput Biol Med. 2004;34:495–521. doi: 10.1016/S0010-4825(03)00086-6. [DOI] [PubMed] [Google Scholar]
- 30.Pirtini Çetingül M, Herman C. The Assessment of Melanoma Risk Using the Dynamic Infrared Imaging Technique. Journal of Thermal Science and Engineering Applications. 2011;3:031006–031006. [Google Scholar]
- 31.Leaute-Labreze C, Hoeger P, Mazereeuw-Hautier J, et al. A randomized, controlled trial of oral propranolol in infantile hemangioma. N Engl J Med. 2015;372:735–746. doi: 10.1056/NEJMoa1404710. [DOI] [PubMed] [Google Scholar]
- 32.Santa Cruz GA, Bertotti J, Marin J, et al. Dynamic infrared imaging of cutaneous melanoma and normal skin in patients treated with BNCT. Appl Radiat Isot. 2009;67:S54–58. doi: 10.1016/j.apradiso.2009.03.093. [DOI] [PubMed] [Google Scholar]
- 33.Cetingul MP, Herman C. A heat transfer model of skin tissue for the detection of lesions: sensitivity analysis. Phys Med Biol. 2010;55:5933–5951. doi: 10.1088/0031-9155/55/19/020. [DOI] [PubMed] [Google Scholar]
- 34.Renkielska A, Nowakowski A, Kaczmarek M, Ruminski J. Burn depths evaluation based on active dynamic IR thermal imaging--a preliminary study. Burns. 2006;32:867–875. doi: 10.1016/j.burns.2006.01.024. [DOI] [PubMed] [Google Scholar]
- 35.Jiang LJ, Ng EY, Yeo AC, et al. A perspective on medical infrared imaging. J Med Eng Technol. 2005;29:257–267. doi: 10.1080/03091900512331333158. [DOI] [PubMed] [Google Scholar]
- 36.Bagavathiappan S, Philip J, Jayakumar T, et al. Correlation between plantar foot temperature and diabetic neuropathy: a case study by using an infrared thermal imaging technique. J Diabetes Sci Technol. 2010;4:1386–1392. doi: 10.1177/193229681000400613. [DOI] [PMC free article] [PubMed] [Google Scholar]
- 37.Lahiri B, Bagavathiappan S, Jayakumar T, Philip J. Medical applications of infrared thermography: A review. Infrared Physics & Technology. 2012;55:221–235. doi: 10.1016/j.infrared.2012.03.007. [DOI] [PMC free article] [PubMed] [Google Scholar]
- 38.Renkielska A, Kaczmarek M, Nowakowski A, et al. Active dynamic infrared thermal imaging in burn depth evaluation. J Burn Care Res. 2014;35:e294–303. doi: 10.1097/BCR.0000000000000059. [DOI] [PubMed] [Google Scholar]
- 39.Ruminski J, Kaczmarek M, Renkielska A, Nowakowski A. Thermal parametric imaging in the evaluation of skin burn depth. IEEE Trans Biomed Eng. 2007;54:303–312. doi: 10.1109/TBME.2006.886607. [DOI] [PubMed] [Google Scholar]
- 40.Takahashi K, Mulliken JB, Kozakewich HP, Rogers RA, Folkman J, Ezekowitz RA. Cellular markers that distinguish the phases of hemangioma during infancy and childhood. J Clin Invest. 1994;93:2357–2364. doi: 10.1172/JCI117241. [DOI] [PMC free article] [PubMed] [Google Scholar]
- 41.Marler JJ, Fishman SJ, Kilroy SM, et al. Increased expression of urinary matrix metalloproteinases parallels the extent and activity of vascular anomalies. Pediatrics. 2005;116:38–45. doi: 10.1542/peds.2004-1518. [DOI] [PubMed] [Google Scholar]
- 42.Dubois J, Patriquin HB, Garel L, et al. Soft-tissue hemangiomas in infants and children: diagnosis using Doppler sonography. AJR Am J Roentgenol. 1998;171:247–252. doi: 10.2214/ajr.171.1.9648798. [DOI] [PubMed] [Google Scholar]
- 43.Agache P. Measuring the Skin: Non-invasive Investigations, Physiology, Normal Constants. Springer; Berlin Heidelberg: 2004. Thermometry and Remote Thermography. [Google Scholar]
- 44.Chan H, McKay C, Adams S, Wargon O. RCT of timolol maleate gel for superficial infantile hemangiomas in 5- to 24-week-olds. Pediatrics. 2013;131:e1739–1747. doi: 10.1542/peds.2012-3828. [DOI] [PubMed] [Google Scholar]
- 45.Bailey JK, Burkes SA, Visscher MO, et al. Multimodal quantitative analysis of early pulsed-dye laser treatment of scars at a pediatric burn hospital. Dermatol Surg. 2012;38:1490–1496. doi: 10.1111/j.1524-4725.2012.02451.x. [DOI] [PubMed] [Google Scholar]
- 46.Hassan M, Little RF, Vogel A, et al. Quantitative assessment of tumor vasculature and response to therapy in kaposi's sarcoma using functional noninvasive imaging. Technol Cancer Res Treat. 2004;3:451–457. doi: 10.1177/153303460400300506. [DOI] [PubMed] [Google Scholar]
- 47.Canning J, Barford B, Sullivan D, Wickett R, Visscher M. Use of digital photography and image analysis techniques to quantify erythema in health care workers. Skin Res Technol. 2009;15:24–34. doi: 10.1111/j.1600-0846.2008.00333.x. [DOI] [PubMed] [Google Scholar]
- 48.Burkes SA, Adams DM, Hammill AM, et al. Skin Imaging Modalities Quantify Progression and Stage of Infantile Hemangiomas. Br J Dermatol. 2015 doi: 10.1111/bjd.13905. [DOI] [PubMed] [Google Scholar]
- 49.Verhoeven TJ, Coppen C, Barkhuysen R, et al. Three dimensional evaluation of facial asymmetry after mandibular reconstruction: validation of a new method using stereophotogrammetry. Int J Oral Maxillofac Surg. 2013;42:19–25. doi: 10.1016/j.ijom.2012.05.036. [DOI] [PubMed] [Google Scholar]
- 50.Meyer J, Gorbach AM, Liu WM, et al. Mast cell dependent vascular changes associated with an acute response to cold immersion in primary contact urticaria. PLoS One. 2013;8:e56773. doi: 10.1371/journal.pone.0056773. [DOI] [PMC free article] [PubMed] [Google Scholar]
- 51.Symonds ME, Henderson K, Elvidge L, et al. Thermal imaging to assess age-related changes of skin temperature within the supraclavicular region co-locating with brown adipose tissue in healthy children. J Pediatr. 2012;161:892–898. doi: 10.1016/j.jpeds.2012.04.056. [DOI] [PubMed] [Google Scholar]
- 52.Wojciech T, Gerald S, Tomoharu N, Lukasz M. Rough Fuzzy Image Analysis. CRC Press; 2010. Applications of Fuzzy Rule-based Systems in Medical Image Understanding. 6-1-6-31. [Google Scholar]
- 53.Tollefson MM, Frieden IJ. Early growth of infantile hemangiomas: what parents' photographs tell us. Pediatrics. 2012;130:e314–320. doi: 10.1542/peds.2011-3683. [DOI] [PubMed] [Google Scholar]
- 54.Chang LC, Haggstrom AN, Drolet BA, et al. Growth characteristics of infantile hemangiomas: implications for management. Pediatrics. 2008;122:360–367. doi: 10.1542/peds.2007-2767. [DOI] [PubMed] [Google Scholar]
- 55.Zaproudina N, Varmavuo V, Airaksinen O, Narhi M. Reproducibility of infrared thermography measurements in healthy individuals. Physiol Meas. 2008;29:515–524. doi: 10.1088/0967-3334/29/4/007. [DOI] [PubMed] [Google Scholar]
- 56.Beck DO, Gosain AK. The presentation and management of hemangiomas. Plast Reconstr Surg. 2009;123:181e–191e. doi: 10.1097/PRS.0b013e3181a65c59. [DOI] [PubMed] [Google Scholar]
- 57.Neri I, Balestri R, Patrizi A. Hemangiomas: new insight and medical treatment. Dermatol Ther. 2012;25:322–334. doi: 10.1111/j.1529-8019.2012.01481.x. [DOI] [PubMed] [Google Scholar]
- 58.Ring EF, Ammer K. Infrared thermal imaging in medicine. Physiol Meas. 2012;33:R33–46. doi: 10.1088/0967-3334/33/3/R33. [DOI] [PubMed] [Google Scholar]
- 59.Tambe K, Munshi V, Dewsbery C, Ainsworth JR, Willshaw H, Parulekar MV. Relationship of infantile periocular hemangioma depth to growth and regression pattern. J AAPOS. 2009;13:567–570. doi: 10.1016/j.jaapos.2009.09.014. [DOI] [PubMed] [Google Scholar]
- 60.Kutz AM, Aranibar L, Lobos N, Wortsman X. Color Doppler Ultrasound Follow-Up of Infantile Hemangiomas and Peripheral Vascularity in Patients Treated with Propranolol. Pediatr Dermatol. 2015 doi: 10.1111/pde.12596. [DOI] [PubMed] [Google Scholar]
- 61.Goelz R, Poets CF. Incidence and treatment of infantile haemangioma in preterm infants. Arch Dis Child Fetal Neonatal Ed. 2015;100:F85–91. doi: 10.1136/archdischild-2014-306197. [DOI] [PubMed] [Google Scholar]
- 62.Erbay A, Sanrialioglu F, Malbora B, et al. Propranolol for infantile hemangiomas: a preliminary report on efficacy and safety in very low birth weight infants. Turk J Pediatr. 2010;52:450–456. [PubMed] [Google Scholar]
- 63.Brazzelli V, Giorgini C, Barruscotti S, et al. Efficacy of propranolol in cutaneous haemangiomas: it is more effective on premature children. G Ital Dermatol Venereol. 2015 [PubMed] [Google Scholar]
- 64.Howell KJ, Dziadzio M, Smith RE. Thermography in the microvascular laboratory. Thermol Int. 2007;7:100–102. [Google Scholar]
- 65.Howell KJ, Lavorato A, Visentin MT, et al. Validation of a protocol for the assessment of skin temperature and blood flow in childhood localised scleroderma. Skin Res Technol. 2009;15:346–356. doi: 10.1111/j.1600-0846.2009.00371.x. [DOI] [PubMed] [Google Scholar]
- 66.Clark S, Dunn G, Moore T, Jayson Mt, King TA, Herrick AL. Comparison of thermography and laser Doppler imaging in the assessment of Raynaud's phenomenon. Microvasc Res. 2003;66:73–76. doi: 10.1016/s0026-2862(03)00018-9. [DOI] [PubMed] [Google Scholar]
- 67.Seifalian AM, Stansby G, Jackson A, Howell K, Hamilton G. Comparison of laser Doppler perfusion imaging, laser Doppler flowmetry, and thermographic imaging for assessment of blood flow in human skin. Eur J Vasc Surg. 1994;8:65–69. doi: 10.1016/s0950-821x(05)80123-9. [DOI] [PubMed] [Google Scholar]
- 68.Merla A, Di Romualdo S, Di Donato L, Proietti M, Salsano F, Romani GL. Combined thermal and laser Doppler imaging in the assessment of cutaneous tissue perfusion. Conf Proc IEEE Eng Med Biol Soc. 2007;2007:2630–2633. doi: 10.1109/IEMBS.2007.4352869. [DOI] [PubMed] [Google Scholar]
- 69.Pauling JD, Shipley JA, Raper S, et al. Comparison of infrared thermography and laser speckle contrast imaging for the dynamic assessment of digital microvascular function. Microvasc Res. 2012;83:162–167. doi: 10.1016/j.mvr.2011.06.012. [DOI] [PubMed] [Google Scholar]
- 70.Ahmadi N, McQuilkin GL, Akhtar MW, et al. Reproducibility and variability of digital thermal monitoring of vascular reactivity. Clin Physiol Funct Imaging. 2011;31:422–428. doi: 10.1111/j.1475-097X.2011.01037.x. [DOI] [PubMed] [Google Scholar]
- 71.Shi H, Song H, Wang J, et al. Ultrasound in assessing the efficacy of propranolol therapy for infantile hemangiomas. Ultrasound Med Biol. 2014;40:2622–2629. doi: 10.1016/j.ultrasmedbio.2014.06.021. [DOI] [PubMed] [Google Scholar]
- 72.Hogeling M, Adams S, Wargon O. A randomized controlled trial of propranolol for infantile hemangiomas. Pediatrics. 2011;128:e259–266. doi: 10.1542/peds.2010-0029. [DOI] [PubMed] [Google Scholar]
- 73.Tepper M, Gannot I. Monitoring tumor state from thermal images in animal and human models. Med Phys. 2015;42:1297–1306. doi: 10.1118/1.4907967. [DOI] [PubMed] [Google Scholar]
- 74.Manunza F, Syed S, Laguda B, et al. Propranolol for complicated infantile haemangiomas: a case series of 30 infants. Br J Dermatol. 2010;162:466–468. doi: 10.1111/j.1365-2133.2009.09597.x. [DOI] [PubMed] [Google Scholar]