

Abstract
Abnormal body temperature is a natural indicator of illness. Infrared thermography (IRT) is a fast, passive, non-contact and non-invasive alternative to conventional clinical thermometers for monitoring body temperature. Besides, IRT can also map body surface temperature remotely. Last five decades witnessed a steady increase in the utility of thermal imaging cameras to obtain correlations between the thermal physiology and skin temperature. IRT has been successfully used in diagnosis of breast cancer, diabetes neuropathy and peripheral vascular disorders. It has also been used to detect problems associated with gynecology, kidney transplantation, dermatology, heart, neonatal physiology, fever screening and brain imaging. With the advent of modern infrared cameras, data acquisition and processing techniques, it is now possible to have real time high resolution thermographic images, which is likely to surge further research in this field. The present efforts are focused on automatic analysis of temperature distribution of regions of interest and their statistical analysis for detection of abnormalities. This critical review focuses on advances in the area of medical IRT. The basics of IRT, essential theoretical background, the procedures adopted for various measurements and applications of IRT in various medical fields are discussed in this review. Besides background information is provided for beginners for better understanding of the subject.
Keywords: Infrared thermography, Medical thermography, Diabetes, Breast cancer, Dentistry, Fever screening
1. Introduction
Historically, temperature has been proved to be a very good indicator of health [1], [2]. Since 400 BC temperature has been used for clinical diagnosis [3]. Human, being a homeotherm, is capable of maintaining a constant temperature of the body, which may be different from surrounding temperature [4]. The body of homeotherms can be divided into two parts, viz. the inner core and the outer periphery [5]. The core temperature is preserved within a narrow limit (approximately 42–33 °C) [5]. This regulation of inner core temperature is essential for normal performance of human body. Change of core temperature by a few degrees is considered as a clear indication of probable illness [4]. The body controls its temperature by a physiological process, called thermoregulation [5].
Thermometers were developed around 17th century [2], [6]. George Martine regularly used thermometers to measure diurnal changes of temperature in normal subjects [7]. In 1868, Carl Wunderlich first systematically studied the temperature of subjects suffering from fever and compared with that of the normal subjects and thereby established temperature as a scientific indicator of illness [8]. He established that, temperature range between 36.3 and 37.5 °C could be considered as normal and temperature beyond this range should be considered as an indication of possible illness. During the initial days, liquid based thermometers were used [2]. The discovery of infrared radiation by Sir William Herschel in 1800 was quickly followed by the recording of first thermal image by his son, John Herschel, which opened new dimensions in the field of temperature measurement [2]. Hardy, in 1934, described the physiological role of infrared emission from human body and proposed that human skin can be considered as a blackbody radiator [9], [10]. He established the diagnostic importance of temperature measurement by infrared technique which paved the way for using infrared thermography (IRT) in medical sciences. But the first use was reported in the year 1960 only, because of non-availability of quality equipment and technical knowhow [6].
All objects with temperature above absolute zero emit electromagnetic radiation, which is known as infrared (i.e. below red) radiation or thermal radiation [4], [11], [12]. Wavelength of this radiation lies within a range of 0.75–1000 μm. This wide range can be further subdivided into three smaller groups, viz. near infrared or NIR (0.76–1.5 μm), medium infrared or MIR (1.5–5.6 μm) and far infrared or FIR (5.6–1000 μm). According to thermal radiation theory, blackbody is considered as a hypothetical object that absorbs all incident radiation and radiates a continuous spectrum according to Planck’s law [12]. Integrating Planck’s law for all frequencies, we get Stefan–Boltzman’s law (Eq. (1)), which describes the total emissive power from a blackbody [12].
| (1) |
Here E is the total emissive power (W/m2), σ is the Stefan Boltzman’s constant (σ = 5.676 × 10⁻⁸ W/m2 K4) and T is the absolute temperature (K). For real surfaces the Stefan Boltzman’s law is modified to the following form
| (2) |
where ε is the emissivity of the emitting surface at a fixed wavelength and absolute temperature T. For a perfect blackbody emissivity is unity, but for real materials emissivity is always less than unity. Table 1 shows the emissivity of different human tissues at infrared wavelengths [4], [13].
Table 1.
| Tissue | Emissivity |
|---|---|
| Black skin (3–12 μm) | 0.98 ± 0.01 |
| White skin (3–14 μm) | 0.97 ± 0.02 |
| Burnt skin (3–14 μm) | 0.97 ± 0.02 |
| Epicardium (fresh: 0.5 h) 3 μm | 0.85 |
| Epicardium (fresh: 0.5 h) 5 μm | 0.86 |
| Epicardium (9 days at −20 °C) | 0.99 |
| Pericardium (3 μm) | 0.88 |
| Pericardium (5 μm) | 0.94 |
| Pericardium (9 μm) | 0.95 |
Though the infrared emissions from human skin at 27 °C lies within the wavelength range of 2–20 μm, it peaks around 10 μm. For medical applications a very narrow wavelength band (8–12 μm), termed as body infrared rays, is in general used [14]. With the advent of newer generations of detectors, NIR and MIR regions are also used in medical thermography [15], [16]. The first modern infrared detector of lead-sulfide photo-detector, was originally developed for military applications, around World War II [17]. But later the technology was released for civilian uses and thereafter IRT has been used in medical sciences as well as in the field of non-destructive testing (NDT). In the field of NDT, the application of IRT is mainly in surface and sub-surface defect detection and online monitoring of processes [11], [18]. In IRT, thermal patterns on the surface of the test objects are monitored. Subsurface defects cause abnormal thermal patterns, which indicate the presence of those defects. Similarly in medical applications, due to clinical illness abnormal thermal patterns on the skin surfaces are monitored. A few typical applications of IRT are shown in Fig. 1 .
Fig. 1.
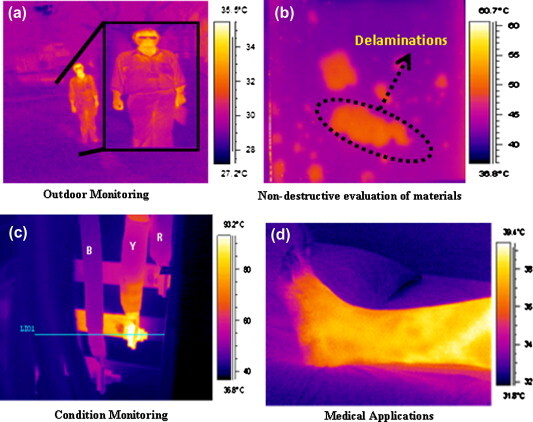
Various applications of infrared thermography: (a) Outdoor monitoring during night time. The objects could be easily visualized due to infrared emissions from the surfaces. (b) Non-destructive evaluation of materials, where delaminations appear as hot spots, in glass fiber reinforced polymer specimen. (c) Condition monitoring of three phase electrical panel. Here local hot spots are developed due to loose contact. (d) Medical application: thermal image of lower limb of a diabetic subject.
In 1963, Barnes demonstrated that thermograms can provide information of physical anomalies and thereby be useful for diagnosis of physical illness [19]. Sherman et al. used IRT for assessment of skin temperature asymmetries between paired limbs of subjects and concluded that IRT along with grid map of body is the simplest method for scanning body temperature [20]. Fauci et al. reviewed the history of IRT, various detector systems and its application in medical diagnosis [21]. Jiang et al. reviewed the perspective of IRT in medical thermography [22]. Ring et al. have highlighted the interesting opportunities for IRT in the medical field [23]. Several applications of IRT in medical science has been highlighted by Jung et al. [24] and Ammer and Ring [25]. IRT has been extensively used for diabetic neuropathy [16], [26], [27], [28], [29], [30], [31], vascular disorder [6], [32], [33], breast cancer detection [34], [35], [36], [37], [38], [39], [40], thermoregulation study [4], [5], fever screening [41], [42], [43], [44], brain imaging (thermoencephaloscopy) [45], dentistry and dermatology [46], [47], [48], muscular pain and shoulder impingement syndrome study [49], diagnosis of rheumatologic diseases [50], [51], [52], dry eye syndrome diagnosis [53], treatment of parasitic liver diseases [54], detection of metastatic liver disease [55], bowel ischemia [56], renal transplantation [57], [58], heart treatment [59], and gynecology [60], [61], [62]. IRT has been used in acupuncture treatment [63], [64], [65], cryotherapy [66], forensic medicine [67], [68] and assessment of radiation damage to human body [69] also. A comprehensive list of published literature (between 1989 and 2003) on various medical application of IRT and other relevant developments are reviewed by Ammer [70], [71].
On the basis of temperature sensing methodology, medical thermography can be subdivided into four principal categories, viz. electrical contact thermometry, cutaneous temperature discrimination, liquid crystal thermography and IRT [27]. In electrical contact thermometry, a single element or arrays of transducers (generally made of semiconductor resistors) are used to measure surface temperature of the subject in contact [27]. This technique sometimes serves as a reference for IRT, though it must be considered that excessive pressure from the sensor can alter the blood flow and thereby change the temperature [27]. Cutaneous temperature discrimination threshold is a measure of small nerve fiber function and Bertelsmann et al. have shown that it could be used for early diagnosis of diabetic subjects [27], [72]. In the case of liquid crystal thermography, the thermometer consists of flexible rubber sheets within which thermochromic cholesteric liquid crystals are arranged in several layers [73]. As the rubber sheets have a provision for inflation, the heat sensitive sheets are in good contact with the curved body surface. The liquid crystals change their color due to change in temperature and the resulted pattern represents the temperature distribution of the body surface. Though the technique is very cheap, it is contact based and time consuming. Moreover the technique has low thermal sensitivity (∼0.3–1.0 °C) and poor spatial resolution (>5 mm) [73]. In case of IRT, the thermal radiation emitted by a surface is detected by an infrared camera and the intensity of the emitted radiation is converted to temperature. IRT can be static or dynamic. In the former case, instantaneous temperature distribution is monitored, whereas in the latter case, temporal variation of temperature distribution is monitored. A series of thermal images are acquired, which constitute a time series in temperature. The dynamics is quantitatively analyzed by performing Fast Fourier transform (FFT) of the time series of temperature.
In this article, we have discussed the experimental conditions in detail, followed by discussions on skin emissivity, infrared cameras, development of infrared detectors, various image processing methods and data analysis. Finally various medical applications of IRT are highlighted.
2. Experimental conditions for medical IRT
Infrared radiation emitted by a surface depends on the experimental conditions such as moisture, airflow and surrounding temperature. Hence, it is an absolute necessity for thermography experiments, especially in medical applications where temperature changes are within a few degrees, to be performed in controlled environments. For comparing thermographic images, a standard protocol must be followed. Clark et al. presented a draft version of such a standard [74]. Ring and Ammer, in a recent paper, rightly reported that IRT can produce reliable results in medical application only when certain established standards are followed [75]. They lucidly described in detail the basic standards for examination room, temperature control, subject information processing, imaging system, image acquisition, image processing and analysis of results. These standards serve as a very useful guide for researchers pursuing research in the field of medical thermography.
During thermography experiments, the subjects are kept in a comfortable environment so that the mild thermal stress produced results in vasoconstriction aided cooling of skin which renders the hot spots due to underlying abnormalities clearly visible [4]. Amalu et al. reported that, the temperature and the humidity of the examination room must be controlled in such a way that the physiology of the subjects is not “stressed into a condition of shivering or perspiring” [36]. It is advisable that the subjects should refrain from exposure to direct sunlight and uses of cosmetics, antiperspirants or deodorants immediately before the thermography examinations. A thermal acclimation time is required for the subjects to achieve thermal equilibrium. The acclimation may be nude or normal depending upon the parts of the body to be examined. Fig. 2 shows the schematic of a typical experimental set-up. Experimental conditions exercised by a few research-groups are summarized in Table 2 . Gratt et al. discussed the additional requirements for facial thermography as clear faces (free from make-up) and no intervention from hairs [47]. Amalu et al. reported that, the experiment-room must be free from any secondary infrared sources like incandescent lamp or direct sun-light [36].
Fig. 2.
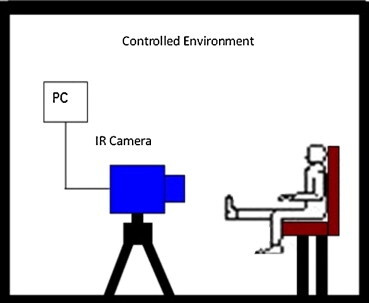
Schematic of a typical experimental set-up for medical thermography experiment. The temperature and humidity of the experiment-room is kept within a comfortable limit. The camera is placed normal to the observation surface to minimize geometrical errors in temperature measurement.
Table 2.
Experimental conditions used by various research groups for recording of infrared thermal images.
| Researchers [Ref.] | Year | Study | Experimental conditions |
|
|---|---|---|---|---|
| Ambient room temperature (°C) | Acclimation time (min) | |||
| Bagavathiappan et al. [16] | 2010 | Diabetic neuropathy | 25 | 5 |
| Bouzida et al. [5] | 2009 | Thermoregulation | 24 ± 2 | 10 |
| Park et al. [49] | 2007 | Shoulder impingement syndrome | 19–21 | 15 |
| Sun et al. [107] | 2006 | Diabetic at-risk feet | 21 ± 1 | 15–20 |
| Hosaki et al. [33] | 2002 | Peripheral circulation in subjects with diabetes mellitus | 20 | 15 |
| Gratt and Anbar [47] | 1998 | Facial telethermography | 21–23 | 15 |
| Armstrong et al. [26] | 1997 | High risk diabetic foot | 21 ± 2 | 15 |
| Branemark et al. [127] | 1967 | Diabetes mellitus subjects | 18–20 | 15–20 |
3. Emissivity of human skin
Emissivity of human skin is reported to be almost constant and its value is 0.98 ± 0.01 for wavelength range of 2–14 μm [4], [13]. Steketee reported that the emissivity of black, white or burnt skin is the same and it is independent of the nature of the experiments, i.e. in vivo or in vitro [13]. It has also been reported that application of cosmetics may cause skin emissivity to change [76]. Clark reported that surface curvature plays a role in the value of surface emissivity [77]. His findings were in accordance with the results of Watmough et al. that, the errors in surface temperature measurement are small for viewing angles up to 45°. According to Watmough et al., the emissivity of a surface at a wavelength λ and viewing angle is given by the following equation [78]
| (3) |
where and nλ is the refractive index of the material. For medical applications, surface curvature is not a problem except for female breast imaging. In such cases, silvered mirrors, aluminized mylar mirrors or copper mirrors have been used as front surface mirrors with necessary correction factors [76].
4. Instrumentation: infrared camera and detectors
IRT experiments require an infrared camera, a tripod, a display device and an image processing unit. Nowadays display and image processing are done digitally using a personal computer and dedicated software packages.
Since from its inception, the infrared cameras have undergone three generations of advancements [14]. Development and basic working principles of various infrared detectors and sensors are described in detail by Zhang et al. [79] and Jones [80]. The first generation cameras used a single element detector, and two scanning mirrors to produce images. They suffered from white out (i.e. saturation due to high intensity) problems. Two scanning mirrors along with a large linear array or small 2-D array as detectors and time delay integration algorithm for image enhancement were used in the second generation cameras. Third generation cameras are without mirrors and had large focal plane array (FPA) detectors and on-chip image processing, thereby increasing the reliability and sensitivity of such systems [14]. Thermal detectors are classified into two categories: cooled and uncooled. Modern developments in solid state systems have paved the way for production of newer types of detectors which have better accuracy and resolution. Currently, thermal sensitivity of the uncooled cameras is about 0.05 °C compared to 0.01 °C of the cooled ones [14]. These cameras have many advantages, viz. high spatial and temperature resolutions, compactness and portability. Besides, these cameras are light weight, manufactured by silicon wafer technology and are cheap compared to the cooled infrared cameras [81], [82], [83]. Such modern digital uncooled infrared cameras improved medical thermal imaging immensely. Ring reported that FPA based cameras have spatial resolution less than 2 mm over a range of distances and fields of view (200 × 200 mm to 500 × 500 mm at a distance of 1 m) [84]. Cameras used by a few research-groups for medical IRT experiments are tabulated in Table 3 .
Table 3.
Infrared cameras used for different studies by various research groups for medical thermography experiments.
| Researchers [Ref.] | Year | Study | Camera used |
|---|---|---|---|
| Bagavathiappan et al. [16], [32] | 2010, 2009 | Diabetic neuropathy and vascular disorder | AGEMA Thermovision 550 |
| Bouzida et al. [5] | 2009 | Thermoregulation | FLIR Phoenix Model |
| Park et al. [49] | 2007 | Shoulder impingement syndrome | IRIS 5000 (Medicore, Seoul, Korea) |
| Brioschi et al. [104] | 2007 | 3D MRI and IR image fusion | Agema Thermovision 470 and ThermaCAM P65HS (FLIR Systems) |
| Sun et al. [107] | 2006 | Diabetic at-risk feet | Spectrum 9000 MB; Bio vision technologies, Inc. Taipei, Taiwan |
| Deng and Liu [35] | 2005 | Effect of induced evaporation on thermal diagnostics of tumors | HR-II Medical Infrared Imaging System, Institute of Optics and Electronics of North China |
| Hosaki et al. [33] | 2002 | Peripheral circulation in subjects with diabetes mellitus | Infrared ray thermo tracer 6T66 (NEC-Sanei Co. Japan) |
| Lo [63] | 2002 | Acupuncture | Meditherm 2000 |
| Shevelev [45] | 1998 | Functional imaging of brain | AGA Thermovision 780 M |
| Armstrong et al. [26] | 1997 | High risk diabetic foot | Exergen DT 1001 infrared skin temperature probe |
| Carlo [48] | 1995 | Clinical and experimental dermatology | AGA Thermovision 680 |
| Gulyaev et al. [95] | 1995 | Thermoregulation and effect of psychological factors on skin temperature | AGA Thermovision 780 & 880; Infracom-93 & TV-03 (Russia) |
| Thompson et al. [34] | 1978 | Microwave heating enhanced thermal detection of tumors | AGA Thermovision 1680 |
5. Image processing, data analysis and numerical modeling
In a review article in 2002, Jones and Plassmann, discussed about the importance of image processing techniques in IRT [85]. Nowadays images acquired by a camera are directly fed to a digital computer, where the images are post processed. The need to form a common database of normal thermal images of all possible parts of a human body has been identified [86]. Ring et al. have discussed the technical challenges for constructing a digital medical IR image database [87]. Fujimasa et al. developed an internet based image database [88]. Ring et al. have developed an Anglo-Polish reference database of medical thermal images [89]. For comparison of multiple thermal images Vardasca has developed an interpolation based comparison methods of various regions of interest (ROI) in multiple thermal images where the ROIs are semi automatically aligned [90]. Data acquisition software plays an important role in IRT. Plassmann and Ring have developed Bath thermal imaging software (BTHERM), which can acquire, store and manipulate images from both older and modern digital cameras [91]. A modern version of the software, called CTHERM, has also been developed by Plassmann and Murawski, which runs on a modern PC [92]. Modern high-end softwares like Altair and Matlab are much faster and available with more options for automatic image processing. Image acquisition may be standardized with the use of software masks (automated or manual), which provide an outline of the regions of interest. A series of such automated masks were developed at the University of Glamorgan [6].
Thermal waves attenuate exponentially in a medium and hence, the thermal signatures of the abnormalities are often subtle [93]. Thermal images also suffer from a comparatively low signal to noise ratio (SNR). Hence image processing is of prime importance in the field of IRT. Various filters (in both time and frequency domains) and algorithms are used for minimizing noise, reducing blurring and edge preservation in thermal images [94]. Gulyaev et al. suggested four fundamental numerical operations on the thermograms to increase accuracy of the data extracted from them [95]. These four operations are, (i) subtraction of background in each frame of interest, (ii) construction of temperature time profile at chosen point or regions, (iii) spatio-temporal projections of image sequences and (iv) calculation of time derivative of temperature data. Fourier analysis is another very useful image processing technique, which enables isolating signals of a particular frequency. Anbar developed dynamic area telethermography (DAT), where FFT is performed over a large number of consecutive infrared images acquired at 15–150 ms time intervals, to determine the amplitudes of the various frequency components. Frequencies in the range 8–815 mHz are ascribed to neuronal controlling effects whereas those above 815 mHz to hemodynamic effects [96], [97]. Diakides and Bronzino described the recent advancements in the image processing techniques relevant to the field of medical infrared imaging [98]. Another aspect of medical image processing is asymmetry analysis, where temperature differences between the diseased and contralateral healthy body parts are analyzed. This technique is particularly useful in female breast imaging. Kuruganti and Qi have shown that higher order statistics (e.g. variance, skewness and kurtosis) and joint entropy are the most effective measures of asymmetry [99]. Qi et al. developed an automatic asymmetry analysis approach based on Hough transform aided image segmentation and pattern classification [100]. The latest development in medical image processing is introduction of hitherto strictly military oriented automatic target recognition (ATR) algorithm [101], [102]. Introduction of this highly sophisticated and accurate technique is expected to result in a paradigm shift in infrared image based computer aided diagnosis (CAD) [14]. Artificial neural network (ANN) and fuzzy logic will play an important role in the development of this CAD technology [103]. Brioschi et al. developed a method for fusion of 2D infrared images, which lack information about local anatomy, with 3D magnetic resonance imaging (MRI) for superior diagnosis [104], [105], [106]. Temperature data, derived from the thermograms, are in general presented in the form of mean ± S.D. (standard deviation). These deviations are due to unavoidable fluctuations in experimental conditions. Hence statistical analyses are preferred for reducing experimental variations and correlating the temperature data with other clinical data. Most common statistical approaches are analysis of variance (ANOVA), hypothesis testing (like Fischer’s exact test, Student’s t test, etc.), χ 2 test and correlation analysis [26], [49], [107]. In general various software packages, like SPSS and SAS are used for data analysis.
Blood circulation is the principle mechanism of heat transfer in human body. Heat emanating onto the skin surface and surrounding blood flow can be described by the following equation, which is known as Pennes bio-heat equation [108].
| (4) |
Here k is the thermal conductivity of tissue material, qm is the volumetric metabolic rate of the tissue, cbwb is the product of the specific heat capacity and the mass flow rate of blood per unit volume of tissue, T is the unknown tissue temperature and Ta is the arterial temperature. Based on this bio-heat equation, various numerical models have been developed. Apart from basic understanding of the problem, such numerical models, in principle, serve two purposes, viz. to predict skin temperature on the basis of internal heat generation and solving the inverse bio-heat equation to estimate temperature of internal organs by observing skin temperature. Such numerical modeling also helps in optimization of the experimental parameters. Deng and Liu, based on predictions from a similar numerical model, concluded that induced evaporation is an effective method to improve the sensitivity of IRT images [35]. In Fig. 3 , typical IR images of the right hand of a normal subject, before and after 1 min of mild cold stimulation, are shown. Veins could be clearly visualized after cold stimulation, as it increases the sensitivity of thermal images and renders subtle thermal signatures to be clearly discernible.
Fig. 3.
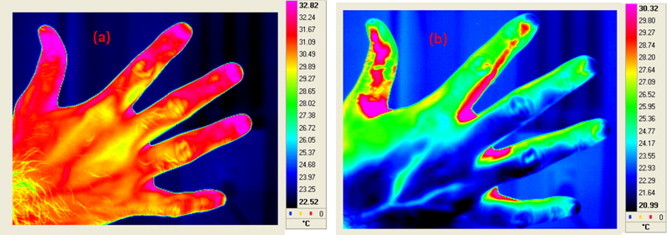
Typical thermal images of right hand of a normal subject (a) before cold stimulation and (b) 1 min after mild cold stimulation. Cold stimulation was applied by placing the hand on ice surface for 30 s. Application of such cold stimulations increases the sensitivity of the thermal images. Veins are clearly visible in the thermal image recorded after cold stimulation.
6. IRT in medical science
As abnormal thermal patterns are easily recognizable by IRT, an early diagnosis is possible from these thermal images. Thermographic findings are in general compared with other clinical findings to assess for possible correlations. Though the technique is nonspecific and sometimes depends heavily on background and surrounding environment, there are a number of reasons for which IRT has found wide acceptance among the medical community. First of all, IRT is a remote, non-contact and non-invasive technique. It is fast, and simultaneous large area monitoring is possible. Interpretations from pseudo color coded thermograms are easier and faster. Moreover, this technique records only the natural radiation emanating from the skin surfaces and has no harmful radiation effects. So, it is suitable for prolonged and repeated use. Finally, IRT is a real time technique, which enables monitoring of dynamical variations of temperature. Due to these advantages, thermography has been established as an effective alternative diagnosis tool. Table 4 shows the contralateral temperature difference (between left and right sides) for a few body parts in normal subjects [4], [109].
Table 4.
Contralateral (left vs. right) temperature differences of various body segments in normal human subjects [4], [109].
| Body segment | Mean temperature difference (°C) |
|---|---|
| Forehead | 0.12 |
| Cheek | 0.18 |
| Chest | 0.14 |
| Abdomen | 0.18 |
| Neck (posterior) | 0.15 |
| Lumbar (back) | 0.25 |
| Trunk average | 0.17 |
| Arm (biceps) | 0.13 |
| Palm (medial) | 0.23 |
| Thigh (anterior) | 0.11 |
| Thigh (posterior) | 0.15 |
| Foot (dorsal) | 0.30 |
| Finger-tips average | 0.38 |
| Toe-tips average | 0.50 |
6.1. Thermoregulation study
Metabolism and flexing of muscles during exercise are the principal sources of heat in body core [4]. Thereafter, the heat is transferred from the core towards the outer periphery of the body by blood flow through blood vessels. Blood gains heat from the core of the body and loses heat at the peripheral parts, especially skin. This monitoring process is called thermoregulation. Dynamics of surface temperature distribution is governed by a number of factors, viz. blood flow in the surface layer, heat conduction from deeper blood vessels and sweat evaporation from surface [95]. Thermography is an effective tool for monitoring thermoregulation processes. Gulyaev et al. observed that, in majority of healthy subjects, temperature of the hands, feet and facial regions increases after immobilization [95]. This is because immobilization is generally followed by relaxation and blood redistribution, which causes the surface skin temperature to increase. They further observed spontaneous oscillations, due to changes in sympathetic system and blood flow, in the temperature profiles of hands and feet. Oscillations having period less than 4 min are related to capillaries whereas those with higher periods are due to arterio-venous anastomose. Vainer in his monograph on cutaneous perspiration, used short wave (about 3 μm) infrared radiation to study sweating procedure [110]. He found that low temperature region surrounding the secretory duct of each individual sweat gland is axisymmetric. He studied kinetics of excretory function of individual cutaneous glands, local sweating induced by excitation of central nervous system and avalanche (abrupt) sweating due to metabolic and external overheating. An insightful discussion correlating sweating and thermoregulatory mechanism is also presented by him. Bouzida et al. studied thermoregulatory mechanism by two approaches, viz. blood flow modulation and cold stress [5]. In the first approach, blood pressure is modulated, within the systolic and diastolic values, by using a suitable mechanical arrangement. This modulation creates a periodical variation of blood volume in the blood vessels, which is manifested as a periodic change in temperature. Based on frequency analysis, these oscillations were categorized into three groups, viz. very low frequency (0.01–0.04 Hz) due to frequency of breathing and parasympathetic control, low frequency (0.04–0.15 Hz) due to myogenic mechanism and high frequency (0.15–0.30 Hz) due to thermoregulation. In the second approach, a cold stress was applied by placing the left hand on a cold metal surface and temperature dynamics on both hands were observed using IRT. It was observed that, after a long steady state period of 85 s the temperature on the stimulated hand decreased while the temperature on the other hand increased. This phenomenon is attributed to the fact that thermoregulatory mechanism responds in such a way that the core temperature remains undisturbed. Using IRT, Kargel monitored local heating in ear-skull regions of human subjects while using different hand-held mobile phones [111]. They observed that, while in operation, mobile phones with higher specific absorption rate (SAR) value caused higher temperature rise. It has also been reported that maximum temperature increase is at the end of talking phase and its value increases with the duration of talking period [112]. Fig. 4 shows typical facial thermal images of a subject using hand-held mobile phone. Fig. 4a shows the thermal image after 1 min of talking and Fig. 4b shows the thermal image after 15 min of talking. The encircled region shows an increase in temperature of 4.59 °C after 15 min of talk.
Fig. 4.
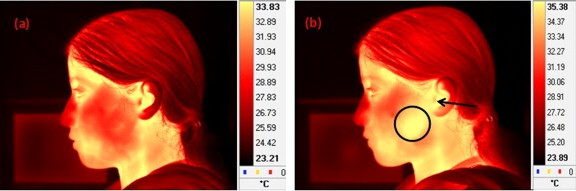
Typical thermal images of a subject talking on a hand-held mobile phone; (a) after 1 min of talking and (b) after 15 min of talking. After 15 min of talking the temperature of the encircled region increased from 30.56 to 35.15 °C, whereas the temperature of the ear region (indicated by an arrow) increased from 33.35 to 34.82 °C.
6.2. Breast cancer detection
Breast cancer is the most commonly diagnosed cancer in female subjects accounting for about 30% cancers [113]. During 2003–2007, average age for death due to breast cancer was 68 years. Approximately 0.0%, 0.9%, 6.0%, 15.0%, 20.8%, 19.7%, 22.6% and 15.1% deaths occurred between the age groups of under 20, 20–34, 35–44, 45–54, 55–64, 65–74, 75–84 and above 85 years respectively [114]. It has been reported that 0% diagnosis was possible under age of 20 years, whereas 1.9%, 10.2%, 22.6%, 24.4%, 19.7%, 15.5% and 5.6% diagnosis were possible within the age groups of 20–34, 34–44, 45–54, 55–64, 65–74, 75–84 and above 85 years respectively [114]. Studies show that, early detection can lead to 85% survival chance compared to 10% for late detection [115]. Therefore, early detection is the key factor for successful breast cancer treatments. In 1982, US Food and Drug Administration (FDA) approved IRT as an adjunctive tool for diagnosis of breast cancer. Kennedy et al., in a recent review, presented a comparative study of IRT and other imaging techniques for breast screening and concluded that IRT provides additional functional information on the thermal and vascular condition of the tissues [116]. Ng presented an excellent review of IRT as a non-invasive breast tumor detection modality, where he described the basic methodology, standard practices, image capture and image analysis in detail [117]. He described that, abnormal breast thermogram indicate significant biological risk. Tumors generally have an increased blood supply and an increased metabolic rate which leads to localized high temperature spots over such areas, rendering them to be visualized by IRT. Apart from passive breast imaging, cold stimulation based imaging procedures are also in practice [36]. Blood vessels, produced by cancerous tumors are simple endothelial tubes devoid of a muscular layer. Such blood vessels fail to constrict in response to sympathetic stimulus like a sudden cold stress and show a hyperthermic pattern due to vasodilatation. Deng and Liu showed that, induced evaporation enhances thermographic contrast in case of tumors underneath the skin [35]. They used water and 75% medical ethanol solution as evaporant, which was sprayed over the skin surface and then images were acquired. Their study shows an improved diagnostic accuracy especially in the early stages of deeply embedded tumors. Spitalier et al. screened 61,000 women using thermography over a period of 10 years and found that, thermography was the earliest indicator of breast cancer in 60% cases [118]. It has been confirmed that abnormal patterns in the infrared images are the highest risk indicators of breast cancer development in future [119]. Gamagami studied angiogenesis by IRT and reported that in 15% cases IRT could detect cancers which were not discernible by mammography [120]. He had also shown that, hypervascularity and hyperthermia were visible in 86% cases of nonpalpable breast cancers. Head et al. reported that, growth rate related prognostic indicators are strongly associated with the thermograms [121]. Thermovascular activities in breast are directly related to prognosis and aggressiveness of the tumor. It has been reported that, hot cancers (most active cancer cells) show a poorer prognosis with 24% survival rate in 3 years, whereas for cooler cancers prognosis is much better with 80% survival rate [36]. Aweda et al. has used IRT for cancer management and reported that, mean oxygen consumption and mean metabolic heat production rate in controls are higher than in breast, head and neck, cervical and other types of cancer [38].
Apart from IRT many other techniques are available for breast imaging, like mammography, MRI, CT, ultrasound, etc. Mammography is the most popular technique, but suffers from a few inherent problems, like exposure to X-ray radiation, relatively higher cost, problem in detecting tumors of smaller sizes and low sensitivity for firm breasts of younger women. IRT does not suffer from such problems and hence, it is a novel tool for investigation of breast cancer. Arora et al. observed that, IRT is an effective alternative diagnosis tool, especially in female subjects with dense breast parenchyma [122].
A typical case study, which demonstrates the effectiveness of IRT as an early indicator of breast cancer, is discussed below [123]. A female subject reported a lump in the right breast, mammography report of which was negative. Fig. 5 shows the thermograms of the left and right breasts respectively [123]. From Fig. 5b, it can be clearly seen that the lump region (encircled) is at an elevated temperature with respect to the surrounding normal tissues. Later biopsy confirmed the lump as a cancer. Kateb et al. used intraoperative thermal imaging on a 76 years old female subject suffering from metastatic intracortical melanoma [124]. The IR images of the tumor and the surrounding normal cortex regions show that, the former is at a higher temperature compared to the later.
Fig. 5.
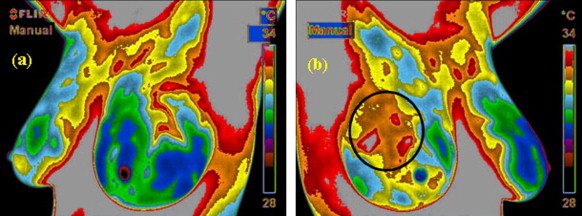
Typical thermal images of a female subject suffering from breast cancer [123]; (a) left breast thermogram and (b) right breast thermogram. The encircled region in the right breast thermogram shows higher temperature with respect to the surrounding normal regions. Later biopsy confirmed existence of cancer in the right breast.
6.3. Diagnosis of diabetic neuropathy and vascular disorder
About 50% of diabetes subjects are hospitalized due to foot complications which are the most common problems with diabetes mellitus subjects [125]. Principal causes of such foot complications are decreased blood supply (vascular disorder) and loss of sensation (neuropathy). An excellent review on role of IRT in foot complication due to diabetes is presented by Bharara et al. [28]. Both vascular disorder and diabetic neuropathy cause changes in skin surface temperature, which makes IRT a suitable tool for diagnosing diabetic neuropathy or vascular disorders. Jiang et al. analyzed metabolic parameters of diabetic subjects based on IRT [126]. Branemark et al. studied a number of diabetes subjects and found that, all of them had abnormal temperature patterns in feet and hands, like reduced temperature on the toes, metatarsal regions and fingers [127]. Sun et al. studied the relationship between plantar skin temperature and sympathetic dysfunction in diabetic at-risk feet [107]. They found that, diabetes at-risk subjects have significantly higher mean foot temperature (30.2 ± 1.3 °C) compared to the normal subjects (26.8 ± 1.8 °C). Their studies indicated that, thermoregulatory sweating disorder signified early sympathetic damages in diabetic feet, which can be detected in the initial stages using IRT. Bagavathiappan et al. studied several randomly chosen type 2 diabetes subjects without feet problems [16]. They established that, subjects with vibratory perception threshold (VPT) values greater than 20, show a higher mean foot temperature (MFT) band. Neuropathic subjects have higher MFT compared to the non-neuropathic ones and the MFT values show a positive correlation with the right and left great toe VPT values. Fig. 6 shows the MFT values as a function of mean VPT values. There are 28 subjects with VPT value less than 20 and MFT values within a temperature band of 27–30 °C, whereas there are 33 subjects with diabetic neuropathy (VPT values greater than 20), whose MFT values were within a temperature band of 30–37 °C. Fig. 7 shows the thermal images of the lower extremities of two diabetic subjects. The subject in Fig. 7a is a 44 year old neuropathic male, whereas the subject in Fig. 7b is a 67 year old non-neuropathic female. The average foot temperature in the encircled regions is 34.1 and 29.3 °C for the two cases respectively. Armstrong et al. compared skin temperatures of subjects with asymptomatic peripheral sensory neuropathy, neuropathic ulcers and Charcots’s anthropathy, using contralateral limb as a control [26]. They reported significant differences in skin temperature between the affected foot and its contralateral part for subjects with Charcot’s anthropathy and neuropathic ulcers, whereas there was no such temperature difference observed for subjects with asymptomatic peripheral sensory neuropathy.
Fig. 6.
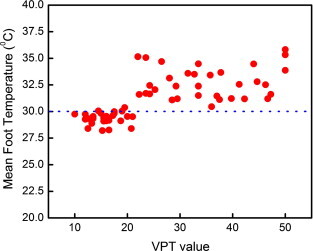
Mean foot temperature (MFT) of diabetic subjects as a function of their VPT values [16]. For non-neuropathic subjects with VPT values less than 20, MFT values are within 27–30 °C, whereas for neuropathic subjects with VPT values greater than 20, MFT values are within a temperature band 30–37 °C.
Fig. 7.
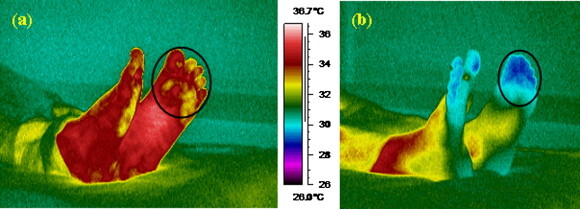
Typical thermal images of plantar region for two diabetic subjects [16]; (a) 44 year old neuropathic male subject with HbA1c value of 9.6% and (b) 67 year old non-neuropathic female subject with HbA1c value of 6.6%. Average temperature of the encircled regions in case of neuropathic and non-neuropathic subjects is 34.1 and 29.1 °C.
In the earlier stages of arteriosclerosis obliterans (ASO), peripheral circulation is one of the complications of diabetes mellitus subjects. Hosaki et al. investigated peripheral circulation quantitatively by IRT in diabetes mellitus subjects [33]. They observed that, temperature gradients indicating abnormal blood flow in the affected regions are correlated with clinical findings. Bagavathiappan et al. investigated diabetes mellitus subjects with vascular disorder and found that, temperature of the affected regions is higher than that of the unaffected regions [32], [128], [129]. This abnormal temperature rise is attributed to slow blood circulation in the affected regions [129]. Fig. 8 a shows the thermal image of left lower limb of a 28 year old male subject suffering from pain and varicosity of the long saphenous system of the left lower limb for 1 year. Clinical examinations of the limb confirmed the existence of dilated tortuous veins in the dorsal aspect of the foot. From the thermal image, it can be clearly seen that the distal portion (indicated by an arrow) of the foot is at a lower temperature, due to slow blood circulation and varicosity induced inadequate venous drainage [32]. Fig. 8b shows the temperature plot along the straight line shown in Fig. 8a. Temperature of the encircled region, as shown in Fig. 8a, is 0.7–1.0 °C higher compared to the surrounding regions. This abnormal temperature is attributed to the presence of varicose veins with mild inflammation [32].
Fig. 8.
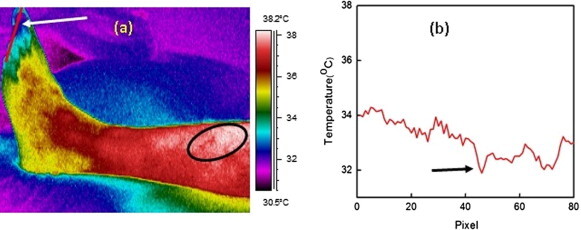
(a) Thermal image of left lower limb of a 28 year old male diabetic subject suffering from vascular disorder [32]. The distal portion (indicated by an arrow) is at a lower temperature due to slow blood circulation and varicosity induced inadequate venous drainage. The encircled region is at 0.7–1 °C higher temperature with respect to the surrounding region. This elevated temperature is attributed to the presence of varicose veins, with probable mild inflammation. (b) Temperature profile along the line shown in Fig. 8a. The lowest temperature is indicated with an arrow.
6.4. Fever screening
Nguyen et al. studied the effectiveness of infrared thermal imaging for mass screening of fever, where thermograms of the neck and facial regions were recorded [130]. They observed that, sensitivity of the thermal imaging methodology was similar to that of self-reported fever cases and concluded that IRT is an effective tool for fast and non-contact mass screening of fever. Chamberlain et al. used infrared emission based thermometer for normal ear temperature determination in various age groups [131]. The outbreak of pandemics like severe acute respiratory syndromes (SARS) and avian influenza has paved the way for effective utilization of IRT based techniques for mass screening of fever [42], [43], [44], [132], [133]. Recently IRT was used successfully for mass screening of fever in subjects with SARS, a highly infectious disease caused by coronavirus [134]. Chiang et al. also reported similar results [135]. Screening of potential infected subjects is a primary requirement for prevention of mass spreading of SARS. Ng studied the effectiveness of IRT in mass screening of fever. He concluded that elevated body temperature is one of the most common syndromes of many infectious diseases, including SARS and hence IRT is a powerful tool for initial mass screening of subjects during public health crisis [136]. Nishiura and Kamiya used IRT for entry screening of passengers at Narita international airport in Japan during influenza (H1N1) pandemic during 2009 [137]. Bitar et al. described the effectiveness and potential use of IRT for fever screening during epidemics and presented an elaborate literature review on the topic [41]. Ring et al. observed that, the highest at-risk group in case of a pandemic fever is the children and performed IRT based studies for detection of fever in children [138]. They reported that, IRT can be considered as a potential tool for fever screening and found that, the temperature of the axilla (measured by conventional thermometer) and that of the inner canthi of the eyes (measured by IRT) were highly correlated. The studies further indicated that temperature above 37.5 °C, with ± 0.5 °C tolerance for the measurement system, must be considered as possible indication of fever instead of 38 °C as reported earlier. SARS, influenza, swine flu, tuberculosis, etc. are perceived as global threat and initial mass screening of fever is the most effective way to control the spread of these pandemic diseases. Hence, joint working group has been setup by International Organization for Standardization (ISO) and the International Electrochemical Commission (IEC) for development of international standards for deployment of thermography systems, selection of thermal imaging systems, human temperature measurement and procedural recommendations [42], [139], [140], [141]. The ISO (ISO/TR 13154:2009) and SPRING (TR 15-1: requirements and test methods and TR 15-2: users’ implementation guidelines) standards recommend strict operational protocols and guidelines for reliable and reproducible use of IRT based techniques for mass screening of fever [142], [143], [144].
6.5. Dental diagnosis
IRT has been used widely in dentistry [145]. Gratt et al. in 1996 developed a new classification system using thermograms for subjects with chronic orofacial pain [146]. The thermograms were classified as normal, hot and cold when selected anatomic area ΔT values (right vs. left side temperature difference) were 0–0.25 °C, greater than 0.35 °C and lesser than 0.35 °C respectively. They reported that, hot thermograms have the clinical diagnosis of sympathetically maintained pain, peripheral nerve mediated pain, temporomandibular joint (TMJ) arthropathy or maxillary sinusitis whereas the cold thermograms have the clinical diagnosis of peripheral nerve mediated pain or sympathetically independent pain. Normal thermograms included subjects with clinical diagnosis of cracked tooth syndrome, trigeminal neuralgia, pretrigeminal neuralgia or psychogenic facial pain. This new methodology was found to be accurate in 92% cases. It has been shown that asymptomatic TMJ subjects have symmetrical thermal patterns with mean ΔT values of 0.1 °C; whereas subjects suffering from TMJ pain were found to have asymmetrical thermal patterns with increased temperature over the affected TMJ region with mean ΔT values of 0.4 °C [147], [148]. Canavan et al. studied a group of mild-to-moderate temporomandibular joint disorder (TMD) subjects and found that ΔT values are correlated with the level of pain in the subjects [149]. Gratt et al. reported that, IRT of chin is an effective method to diagnose inferior alveolar nerve (IAN) deficit [150]. They reported that, subjects with IAN deficit have a mean ΔT value of 0.5 °C whereas subjects with no IAN deficit have symmetrical thermal patterns, which can be attributed to the blockage of vascular neuronal vasoconstrictive messages [151].
In spite of its many advantages, electro-thermal debonding (ETD), which is a popular technique for debonding of orthodontic brackets, may cause thermal damage to the dental pulpal tissue. Cummings et al. performed in vitro study, using IRT, on extracted human premolar teeth and found that, during ETD, pulpal temperature increases from 16.8 to 45.6 °C and thereby posing serious damage to the pulpal tissues [152]. Using IRT, Carson et al. studied the heat distribution pattern during high speed cavity preparation using both air–water spray and air spray and they found that, mean temperature increase in the two processes are 2.8 and 3.7 °C respectively [153]. Watanabe et al. investigated generation and spreading of heat during drilling of dental bone, using IRT [154]. Benington et al. also used IRT for monitoring changes in bone temperature during drilling process for implant site preparation [155]. Madura et al. used in vitro IRT for studying thermal influence of Nd:YAG laser on a tooth root during sterilization process [156]. Experiments were performed on an extracted single rooted human tooth. They studied the influence of heat transmission, tissue thickness and irradiation time on the temperature rise of the tooth. Based on the above studies it can be concluded that, IRT can be successfully used for temperature monitoring of the dental tissue and optimization of sterilization process. Other applications of infrared thermography in dental sciences include evaluation of craniomandibular disorders [157], detection of carotid occlusal disease [158], quantification of the effects of post-surgical inflammation [159], [160].
6.6. Dermatological applications
Skin diseases, in general, cause inflammation which in turn causes abnormal temperature pattern on skin surface. Hence, IRT may be considered as a suitable technique for studying skin diseases. IRT has been used for diagnosis of leprosy subjects and it has been reported that, cooler areas (like ear and nasal rim region) are heavily affected [161], [162]. Vargas et al. developed a normalized thermography methodology, where they used dimensionless average temperature (i.e. ratio of measured average temperature to a reference temperature), for leprosy diagnosis on a 50 year old male subject with hepatitis-C history of 20 years [163]. They monitored the subject for 587 days and found that, using thermal images effectiveness of leprosy treatment is detectable in 87 days whereas repigmentation is visually detectable only after 182 days. Benko et al. studied the thermal effects of exposure to beta radiation using IRT [69]. They observed that, the average temperature of the exposed region increases immediately after absorption of beta dose.
Thomas et al. had highlighted the use of IRT in laser based skin treatment especially in cases of vascular lesions and depilation, where IRT was used for optimization of laser parameters [164]. Mason et al. used IRT for assessment of burn injury depth and concluded that thermographic findings are far more accurate than clinical findings [165]. Cole et al. also reported similar results and concluded that, IRT might be helpful for selecting subject for early surgery [166]. Schnell and Zaspel used IRT for cooling management of extensive burns [167]. Mercer et al. have used IRT for monitoring the improvement of wound healing by water-filtered infrared-A (WIRA) in human subjects with chronic venous stasis ulcers [168]. Weerd et al. used IRT in autologous breast reconstruction with a deep inferior epigastric perforator flap[169]. They described that, this technique can be used for indirect monitoring of skin blood perfusion, pre-operative planning and post-operative monitoring. Recently Flores-Sahagun et al. used IRT for diagnosis and analysis of basal cell carcinoma, which is the most common skin cancer malignancy [170]. They proposed a method of conjugated gradients and concluded that IRT is an effective tool for such applications. Costello et al. have used IRT for assessing decrease in skin temperature in human subjects following cryotherapy, which is therapeutic use of cold in various clinical settings [66].
6.7. Blood pressure monitoring
Arterial blood pressure and the corresponding thermograms, in two different groups of hypertensive subjects, one treated with a combination of atenolol (β 1 receptor antagonist) plus chlorthalidone and the other treated with labetalol (mixed α/β adrenergic antagonist) plus chlorthalidone were monitored by Cesaris et al. [171]. Using IRT, hypothermia was observed on the hands of the subjects in both the groups before treatment. After 1 month of treatment, no changes in peripheral vascular flow could be observed in the former group, whereas significant improvements in vascular flow were observed in the second group.
6.8. Diagnosis of rheumatic diseases
IRT has been successfully used in the diagnosis and assessment of recovery after treatment in Raynaud’s phenomena [52], [172], [173], [174], gout [175] and arthritis [176], [177]. Arnold et al. reported that, IRT is an excellent technique for measurement of skin temperature over different joints [178]. Ring demonstrated that, the subjects suffering from rheumatoid arthritis, juvenile arthritis, osteoarthrosis, gout, etc. show abnormal temperature distributions over joints [179]. Collins et al. developed a thermographic index based methodology for quantification of joint inflammation in human subjects [180]. Ring et al. have demonstrated the use of IRT to quantify the effects of non-steroidal anti-inflammatory drugs (aspirin, indomethacin and benorylate) in subjects with rheumatoid arthritis and gout [177]. Based on their studies it has been concluded that, IRT is a suitable tool for assessment of the response to the anti-inflammatory treatment. Paterson et al. used IRT for assessment of rheumatoid inflammation in the knee joint, while using anti-inflammatory steroid therapy [181]. Frize et al. used IRT for diagnosis of rheumatoid arthritis in human subjects and found that, metacarpal phalangeal joints of the index, middle fingers and knee are the most suitable locations for IRT based studies [182]. Wu et al. reported that, local skin temperature near the coccyx region decreases significantly after conservative therapy in subjects suffering from coccygodynia [183]. Their studies concluded that IRT is as an effective tool for assessment of pain intensity after treatment of coccygodynia. Park et al. highlighted the effectiveness of infrared thermal imaging in subjects with shoulder impingement syndrome [49]. Thermographic results were compared with other clinical findings and this study confirmed that, the decreased range of motion and hypothermic temperature patterns are correlated. Shoulder immobility causes localized muscle atrophy, which in turn induces apoptosis in the endothelial cells of the muscle capillaries, which eventually leads to a decreased blood flow in the capillary resulting in hypothermic patterns [184]. Vecchio et al. reported that most of the subjects with unilateral frozen shoulder present anomalous temperature distribution [185]. Jeracitano et al. found that, subjects with adhesive capsulitis show an abnormal temperature pattern which indicate sympathetic dysfunction in the subserving pain from the affected shoulder [186]. Thomas et al. investigated unilateral and bilateral cases of tennis elbow using IRT and observed that in 94% unilateral and 100% bilateral cases, hot spots could be detected [187].
6.9. Diagnosis of dry eye syndrome and ocular diseases
Using IRT, Morgan et al. recorded thermograms of ocular surfaces of dry eye subjects and controls [188]. It was found that, mean ocular surface temperature is greater in the dry eye subjects (32.38 ± 0.69 °C) compared to the controls (31.94 ± 0.54 °C). Tan et al. have reviewed different methodologies, like manual, semi-automatic and fully automatic methods, for studying ocular surface temperature by IRT [3], [189]. Chang et al. used IRT for diagnosis of inflammatory state of subjects with Graves’ ophthalmopathy [190]. Temperature at different regions such as lateral orbit (reference point), upper and lower eyelids, caruncle, medial and lateral conjunctiva and cornea was measured and it was observed that, for subjects suffering from Graves’ ophthalmopathy, temperature differences between the reference point and other regions are significantly higher compared to the corresponding temperature differences in the controls. It has also been found that, IRT is useful in studying follow-up effects of methylprednisolone pulse therapy. Brunsmann et al. used IRT to evaluate thermal load during laser corneal refractive surgery [191]. Ng et al. proposed that, enhanced eye temperature could be a possible indication of fever [192]. A typical thermal image of a normal eye is shown in Fig. 9 . It can be seen from Fig. 9b that, the corneal temperature distribution is symmetric in normal subjects and the coolest point of the cornea is not at the geometrical center of the cornea but slightly shifted from the center. This can be attributed to the flow of tear fluid which can cause a decrease in temperature of the cornea and presence of upper eyelid [3].
Fig. 9.
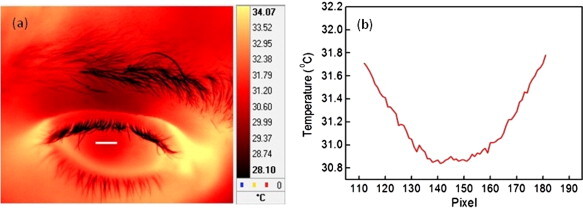
(a) Thermal image of left eye of a normal subject, where the cornea region is clearly discernible. Cornea appears to be at a lower temperature compared to the surrounding region. (b) Temperature profile along the horizontal line shown in Fig. 9a. The line profile shows that, the temperature distribution across cornea is symmetric in normal subjects and the coolest spot is little shifted from the geometrical center of the cornea. This may be attributed to the flow of tear fluid, which causes a decrease in temperature of the cornea.
6.10. Diagnosis of liver diseases
Mansfield et al. used IRT for detecting liver metastases, which cause abnormal temperature patterns on the skin surface [55]. Knobel et al. used IRT to measure body temperature of neonates housed in incubators to examine relationship between body temperature and necrotizing enterocolitis (NEC) in premature infants [193]. It was observed that, mean abdominal-thoracic temperature differential is greater in the premature infants suffering from NEC. Milonov et al. used thermography with electrothermometry in subjects with parasitic liver diseases [54]. In this study, unilocular hydatid disease (unilocular echinococcosis, caused by Echinococcus granulosus) and multilocular hydatid disease (multilocular echinococcosis caused by Echinococcus multilocularis) were detected. Their studies show that, IRT is a useful tool for detecting suppurating cysts. Bhatia et al. investigated infants and children with acute and chronic liver diseases using IRT and found that, for 96% subjects, thermograms of the abdominal regions are abnormal [194].
6.11. Treatment of kidney
Studies show that, IRT enables real-time visualization of flow distribution of hemofilter [195]. Kopsa et al. concluded that, thermographic investigation can be a complementary test in kidney transplantation subjects for diagnosis of pathological intrarenal or perirenal disorders and also for evaluating graft function [58]. Oosterlinck and De reported that, IRT can be used to detect different arterial areas in kidney and may be helpful in performing avascular plane nephrotomies with minimum bleeding and renal parenchyma loss [196].
6.12. Heart operation
Manginas et al. studied the feasibility of thermography in subjects with coronary artery disease (CAD) and in subjects after heart transplantation (Tx) [59]. They performed IRT experiments in 16 subjects with CAD, 19 heart transplanted subjects and 6 subjects without structural heart diseases (control). They compared the left and right ventricular temperature and found that, CAD subjects have a significantly higher temperature difference (0.19 ± 0.11 °C) compared to the Tx subjects (0.10 ± 0.06 °C) and the controls (0.07 ± 0.04 °C). It has also been reported that, thermography can detect earliest signs of atherosclerosis and thereby can act as an early indicator of heart attack [197]. In numerous heat operation cases IRT has been used as an additional viewing technique [198]. Madjid et al. used intracoronary thermography for detection of high risk vulnerable plaques [199].
6.13. Gynecology
Thermography has been extensively used in the field of gynecology also [60], [61]. Birnbaum and Kliot commented that, gynecology may be the most potential field for application of thermography, as during pregnancy the internal female genitalia undergoes significant changes in size and vascularity and increase in uterine volume during pregnancy leads to increase in the number and size of blood vessels [62]. Menczer and Eskin performed IRT experiments on female subjects, where temperature was measured at the level of the nipples and at a fixed level above and below the nipples for 4 weeks prior to delivery and on the first four postpartum days [200]. It was reported that, subjects complaining about postpartum pains have significantly higher temperature compared to the subjects without postpartum pain. They commented that, postpartum pain is mainly caused by venous and lymphatic engorgement or filling of the acini with milk and both processes increase vascularity directly or indirectly causing an increase in the temperature, which renders IRT as an effective tool for diagnosis of postpartum pain. Ng et al. studied erectile dysfunction (ED) in subjects using IRT and reported that, subjects with psychogenic ED showed higher surface temperature compared to organic ED subjects [201].
6.14. Personality testing and brain imaging
Gulyaev et al. observed that, thermographic patterns are influenced by the subject’s personality and psychological state of mind [95]. They observed that, temperature distributions depend on the level of stress, concentration and psychological activities. Shevelev, in his monograph on functional brain imaging, described a new methodology for thermal imaging of brain cortex, called thermoencephaloscopy (TES) [45]. He discussed the principal mechanisms behind TES process as neural activity, local metabolism and local cerebral blood flow, which produced detectable variations in temperature. This technique revealed activated (heated) and deactivated (cooled) zones of the cerebral cortex. He observed that, this technique is able to detect sequences of activation in the specific cortical zones. Studies indicate that, brain tumors of glial origins are at 0.5–2.0 °C higher temperature compared to the surrounding normal tissues [202].
7. Conclusions
With the advent of newer generation infrared detectors, infrared thermal imaging is becoming a more accurate alternate medical diagnostic tool for abnormal temperature pattern measurements. Besides, better temperature sensitivity, spatial resolution and non-contact nature, IRT is an absolutely harmless imaging methodology. Thermal images can be stored digitally and post-processed using various software packages to obtain insight into the thermal pattern. Interpretation of pseudo-color coded thermograms is comparatively easier and faster. Studies so far indicate that, IRT can be successfully used for diagnosis of breast cancer, diabetes, dentistry, diabetic neuropathy, etc. In coming years use of IRT in medical field is likely to surge.
References
- 1.Houdas Y., Ring E.F.J. Plenum Press; New York: 1982. Human Body Temperature. [Google Scholar]
- 2.Ring E.F.J. The historical development of temperature measurement in medicine. Infrared Physics & Technology. 2007;49:297–301. [Google Scholar]
- 3.Tan J.H., Ng E.Y.K., Acharya U.R., Chee C. Infrared thermography on ocular surface temperature: a review. Infrared Physics & Technology. 2009;52:97–108. [Google Scholar]
- 4.Jones B.F. A reappraisal of the use of infrared thermal image analysis in medicine. IEEE Transactions on Medical Imaging. 1998;17:1019–1027. doi: 10.1109/42.746635. [DOI] [PubMed] [Google Scholar]
- 5.Bouzida N., Bendada A., Maldague X.P. Visualization of body thermoregulation by infrared imaging. Journal of Thermal Biology. 2009;34:120–126. [Google Scholar]
- 6.Ring F. Thermal imaging today and its relevance to diabetes. Journal of Diabetes Science and Technology. 2010;4:857–862. doi: 10.1177/193229681000400414. [DOI] [PMC free article] [PubMed] [Google Scholar]
- 7.Martine G. Millar; London: 1740. Essays Medical and Philosophical. [Google Scholar]
- 8.Wunderlich C., Woodman W. vol. 71. The New Sydenham Society; London, England: 1871. (On the Temperature in Diseases, a Manual of Medical Thermometry). [Google Scholar]
- 9.J.D. Hardy, The radiation of heat from the human body. I–IV, Journal of Clinical Investigation 13 (1934) 593–620 & 817–883.
- 10.Hardy J.D., Muschenheim C. The radiation of heat from the human body. V. Journal of Clinical Investigation. 1936;15:1–8. doi: 10.1172/JCI100746. [DOI] [PMC free article] [PubMed] [Google Scholar]
- 11.Maldague X. first ed. John Wiley and Sons; New York: 2001. Theory and Practice of Infrared Technology for Nondestructive Testing. [Google Scholar]
- 12.Modest M.F. second ed. Academic Press; California: 2003. Radiative Heat Transfer. [Google Scholar]
- 13.Steketee J. Spectral emissivity of the skin and pericardium. Physics in Medicine & Biology. 1973;18:686–694. doi: 10.1088/0031-9155/18/5/307. [DOI] [PubMed] [Google Scholar]
- 14.H. Qi, N.A. Diakides, Infrared Thermal Imaging. <http://aicip.ece.utk.edu/publication/06thermography.pdf>.
- 15.Mansfield J.R., Sowa M.G., Payette J.R., Abdulrauf B., Stranc M.F., Mantsch H.H. Tissue viability by multispectral near infrared imaging: a fuzzy C-means clustering analysis. IEEE Transactions on Medical Imaging. 1998;17:1011–1018. doi: 10.1109/42.746634. [DOI] [PubMed] [Google Scholar]
- 16.Bagavathiappan S., Philip J., Jayakumar T., Raj B., Rao P.N.S., Varalakshmi M., Mohan V. Correlation between plantar foot temperature and diabetic neuropathy by using an infrared thermal imaging technique. Journal of Diabetes Science and Technology. 2010;4:1386–1392. doi: 10.1177/193229681000400613. [DOI] [PMC free article] [PubMed] [Google Scholar]
- 17.A Historical Perspective of Thermography, Omega. <http://www.omega.com/literature/transactions/volume1/historical3.html>.
- 18.Lahiri B.B., Bagavathiappan S., Reshmi P.R., Philip J., Jayakumar T., Raj B. Quantification of defects in composites and rubber materials using active thermography. Infrared Physics & Technology. 2012;55:191–199. doi: 10.1016/j.infrared.2012.03.007. [DOI] [PMC free article] [PubMed] [Google Scholar]
- 19.Barnes R.B. Thermography of the Human body. Science. 1963;140:870–877. doi: 10.1126/science.140.3569.870. [DOI] [PubMed] [Google Scholar]
- 20.Sherman R.A., Wideman A.L., Karstetter K.W. Comparative effectiveness of videothermography, contact thermography, and infrared beam thermography for scanning relative skin temperature. Journal of Rehabilitation Research and Development. 1996;33:377–386. [PubMed] [Google Scholar]
- 21.Fauci M.A., Breiter R., Cabanski W., Fick W., Koch R., Ziegler J., Gunapala S.D. Medical infrared imaging–differentiating facts from friction, and the impact of high precision quantum well infrared photodetector camera systems, and other factors, in its reemergence. Infrared Physics & Technology. 2001;42:334–344. [Google Scholar]
- 22.Jiang L.J., Ng E.Y., Yeo A.C., Wu S., Pan F., Yau W.Y., Chen J.H., Yang Y. A perspective on medical infrared imaging. Journal of Medical Engineering & Technology. 2005;29:257–267. doi: 10.1080/03091900512331333158. [DOI] [PubMed] [Google Scholar]
- 23.Ring E.F.J., Jung A., Zuber J. New opportunities for infrared thermography in medicine. Acta Bio-Optika et Informatica Medica. 2009;15:28–30. [Google Scholar]
- 24.Jung A., Zuber J., Ring F. MedPress; Warszawa: 2003. A Case Book of Infrared Imaging in Clinical Medicine. [Google Scholar]
- 25.Ammer K., Ring E.F.J. Uhlen-Verlag; Vienna: 1995. The Thermal Image in Medicine and Biology. [Google Scholar]
- 26.Armstrong D.G., Lavery L.A., Liswood P.J., Todd W.F., Tredwell J.A. Infrared dermal thermometry for the high-risk diabetic foot. Physical Therapy. 1997;77:169–175. doi: 10.1093/ptj/77.2.169. [DOI] [PubMed] [Google Scholar]
- 27.Bharara M., Cobb J.E., Claremont D.J. Thermography and thermometry in the assessment of diabetic neuropathic foot: a case for furthering the role of thermal techniques. International Journal of Lower Extremity Wounds. 2006;5:250–260. doi: 10.1177/1534734606293481. [DOI] [PubMed] [Google Scholar]
- 28.Bharara M., Schoess J., Armstrong D.G. Coming events cast their shadows before: detecting inflammation in the acute diabetic foot and the foot in remission. Diabetes/Metabolism Research and Reviews. 2012;28(Suppl. 1):15–20. doi: 10.1002/dmrr.2231. [DOI] [PubMed] [Google Scholar]
- 29.Benbow S.J., Chan A.W., Bowsher D.R., Williams G., Macfarlane I.A. The prediction of diabetic neuropathic plantar foot ulceration by liquid-crystal contact thermography. Diabetes Care. 1994;17:835–839. doi: 10.2337/diacare.17.8.835. [DOI] [PubMed] [Google Scholar]
- 30.Fushimi H., Inoue T., Nishikawa M., Matsuyama Y., Kitagawa J. A new index of autonomic neuropathy in diabetes mellitus: heat stimulated thermographic patterns. Diabetes Research and Clinical Practice. 1985;1:103–107. doi: 10.1016/s0168-8227(85)80035-8. [DOI] [PubMed] [Google Scholar]
- 31.Lavery L.A., Higgins K.R., Lanctot D.R., Constantinides G.P., Zamorano R.G., Athanasiou K.A., Armstrong D.G., Agrawal C.M. Preventing diabetic foot ulcer recurrence in high-risk patients. Diabetes Care. 2007;30:14–20. doi: 10.2337/dc06-1600. [DOI] [PubMed] [Google Scholar]
- 32.Bagavathiappan S., Saravanan T., Philip J., Jayakumar T., Raj B., Karunanithi R., Panicker T., Korath M.P., Jagadeesan K. Infrared thermal imaging for detection of peripheral vascular disorders. Journal of Medical Physics. 2009;34:43–47. doi: 10.4103/0971-6203.48720. [DOI] [PMC free article] [PubMed] [Google Scholar]
- 33.Hosaki Y., Mitsunobu F., Ashida K., Tsugeno H., Okamoto M., Nishida N., Takata S., Yokoi T., Tanizaki Y., Ochi K., Tsuji T. Non-invasive study for peripheral circulation in patients with diabetes mellitus. Annual reports of Misasa Medical Branch. 2002;72:31–37. [Google Scholar]
- 34.J.E. Thompson, T.L. Simpson, J.B. Caulfield, Thermographic tumor detection enhancement using microwave heating, IEEE Transactions on Microwave Theory and Techniques, MTT-26 (1978).
- 35.Z.S. Deng, J. Liu, Enhancement of thermal diagnostics on tumors underneath the skin by induced evaporation, in: Proc. 27th Annual Conference of IEEE Engineering in Medicine and Biology, Sanghai, China, 2005. [DOI] [PubMed]
- 36.W.C. Amalu, W.B. Hobbins, J.F. Head, R.L. Elliot, Infrared imaging of the breast – an overview, in: J.D. Bronzino (Ed.), Biomedical Engineering Handbook, third ed., Medical Devices and Systems, CRC Press, 2006, pp. 20.
- 37.Kosus N., Kosus A., Duran M., Simavli S., Turhan N. Comparison of standard mammography with digital mammography and digital infrared thermal imaging for breast cancer screening. Journal of the Turkish-German Gynecological Association. 2010;11:152–157. doi: 10.5152/jtgga.2010.24. [DOI] [PMC free article] [PubMed] [Google Scholar]
- 38.Aweda M.A., Ketiku K.K., Ajekigbe A.T., Edi A.A. Potential role of thermography in cancer management. Archives of Applied Science Research. 2010;2:300–312. [Google Scholar]
- 39.Wishart G.C., Campisi M., Boswell M., Chapman D., Shackleton V., Iddles S., Hallett A., Britton P.D. The accuracy of digital infrared imaging for breast cancer detection in women undergoing breast biopsy. European Journal of Surgical Oncology. 2010;36:535–540. doi: 10.1016/j.ejso.2010.04.003. [DOI] [PubMed] [Google Scholar]
- 40.Ng E.Y.K., Kee E.C. Advanced integrated technique in breast cancer thermography. Journal of Medical Engineering & Technology. 2008;32:103–114. doi: 10.1080/03091900600562040. [DOI] [PubMed] [Google Scholar]
- 41.Bitar D., Goubar A., Desenclos J.C. International travels and fever screening during epidemics: a literature review on the effectiveness and potential use of non-contact infrared thermometers. Eurosurveillance. 2009;14:1–5. [PubMed] [Google Scholar]
- 42.F. Ring, J. Mercer, Thermal Imaging for fever screening, ISO Focus, February (2007) 33–35.
- 43.Ring F. Pandemic: thermography for fever screening of airport passengers. Thermology International. 2007;17:67. [Google Scholar]
- 44.Ng E.Y.K., Kaw G., Chang W.M. Analysis of IR thermal imager for mass blind fever screening. Microvascular Research. 2004;68:104–109. doi: 10.1016/j.mvr.2004.05.003. [DOI] [PubMed] [Google Scholar]
- 45.Shevelev I.A. Functional imaging of the brain by infrared radiation (Thermoencephaloscopy) Progress in Neurobiology. 1998;56:269–305. doi: 10.1016/s0301-0082(98)00038-0. [DOI] [PubMed] [Google Scholar]
- 46.Fikackova H., Ekberg E. Can infrared thermography be a diagnostic tool for arthralgia of the temporomandibular joint? Oral Surgery, Oral Medicine, Oral Pathology, Oral Radiology and Endodontics. 2004;98:643–650. doi: 10.1016/j.tripleo.2004.02.080. [DOI] [PubMed] [Google Scholar]
- 47.Gratt B., Anbar M. Thermology and facial telethermography: Part II. Current and future clinical applications in dentistry. Dentomaxillofacial Radiology. 1998;27:68–74. doi: 10.1038/sj/dmfr/4600324. [DOI] [PubMed] [Google Scholar]
- 48.Carlo A.D. Thermography and the possibilities for its applications in clinical and experimental dermatology. Clinics in Dermatology. 1995;13:329–336. doi: 10.1016/0738-081x(95)00073-o. [DOI] [PubMed] [Google Scholar]
- 49.Park J., Hyun J.K., Seo J. The effectiveness of digital infrared thermographic imaging in patients with shoulder impingement syndrome. Journal of Shoulder and Elbow Surgery. 2007;16:548–554. doi: 10.1016/j.jse.2006.11.010. [DOI] [PubMed] [Google Scholar]
- 50.Will R.K., Ring E.F.J., Clarke A.K., Maddison P.I. Infrared thermography, what is its place in rheumatology in the 1990’s. British Journal of Rheumatology. 1992;31:337–344. doi: 10.1093/rheumatology/31.5.337. [DOI] [PubMed] [Google Scholar]
- 51.Cosh J.A., Ring E.F.J. Thermography and rheumatology. Rheumatology. 1970;10:342–348. doi: 10.1093/rheumatology/10.7.342. [DOI] [PubMed] [Google Scholar]
- 52.Cherkas L.F., Carter L., Spector T.D., Howell K.J., Black C.M., MacGregor A.J. Use of thermographic criteria to identify Raynaud’s phenomenon in a population setting. Journal of Rheumatology. 2003;30:720–722. [PubMed] [Google Scholar]
- 53.Zelichowska B., Rozycki R., Tlustochowicz M., Kujawa A., Kalicki B., Murawski P. The usefulness of the thermography in the dry eye syndrome. Klinika Oczna. 2005;107:483–487. [PubMed] [Google Scholar]
- 54.Milonov O.B., Lebedeva O.D., Pomelova L.A. The use of echography and thermography in patients with parasitic liver diseases. Sovetskaia Meditsina. 1980;4:62–67. [PubMed] [Google Scholar]
- 55.Mansfield C.M., Farrell C., Asbell S.O. The use of thermography in the detection of metastatic liver disease. Radiology. 1970;95:696–698. doi: 10.1148/95.3.696. [DOI] [PubMed] [Google Scholar]
- 56.Brooks J.P., Perry W.B., Putnam A.T., Karulf R.E. Thermal imaging in the detection of bowel ischemia. Diseases of the Colon and Rectum. 2000;43:1319–1321. doi: 10.1007/BF02237446. [DOI] [PubMed] [Google Scholar]
- 57.Kopsa H., Czech W., Schmidt P., Zazgornik J., Pils P., Balcke P. Diagnostic relevance of contact thermography in renal transplantation (author’s translation) Medizinische Klinik. 1979;74:1067–1070. [PubMed] [Google Scholar]
- 58.Kopsa H., Czech W., Schmidt P., Zazgornik J., Pils P., Balcke P. Use of thermography in kidney transplantation: two year follow up study in 75 cases. Proceedings of the European Dialysis and Transplant Association. 1979;16:383–387. [PubMed] [Google Scholar]
- 59.Manginas A., Andreanides E., Leontiadis E., Sfyrakis P., Maounis T., Degiannis D., Alivizatos P., Cokkinos D. Right ventricular endocardial thermography in transplanted and coronary artery disease patients: first human application. Journal of Invasive Cardiology. 2010;22:400–404. [PubMed] [Google Scholar]
- 60.Gershon-Cohen, Haberman-Brueschke Obstetric and gynecologic thermography. Obstetrics and Gynecology. 1965;26:842–847. [PubMed] [Google Scholar]
- 61.C. Loriaux, Role of thermography in gynecology, Journal de Radiologie d Electrologie et de Medecine Nucleaire 56 (Suppl.) (1975) 57–58. [PubMed]
- 62.Birnbaum S.J., Kliot D. Thermography-obstetrical applications. Annals of the New York Academy of Sciences. 1964;121:209–222. doi: 10.1111/j.1749-6632.1964.tb13697.x. [DOI] [PubMed] [Google Scholar]
- 63.Lo S.-y. Meridians in acupuncture and infrared imaging. Medical Hypotheses. 2002;58:72–76. doi: 10.1054/mehy.2001.1453. [DOI] [PubMed] [Google Scholar]
- 64.R. Rossi, E.G. Lluesma, Infrared thermography and acupuncture of the lobe of the outer ear in patients with facial pain, in: A.E. Rozlosnik, R.B. Dinwiddie (Eds.), Thermosense XXIII, Proceedings 2001, pp. 652–658.
- 65.Ernst M., Lee M.H.M. Sympathetic vasomotor changes induced by manual and electrical acupuncture of the hoku point visualized by thermography. Pain. 1985;21:25–33. doi: 10.1016/0304-3959(85)90073-9. [DOI] [PubMed] [Google Scholar]
- 66.Costello J.T., McInerney C.D., Bleakley C.M., Selfe J., Donnelly A.E. The use of thermal imaging in assessing skin temperature following cryotherapy: a review. Journal of Thermal Biology. 2012;37:103–110. [Google Scholar]
- 67.Cattaneo C., Giancamillo A.D., Campari O., Martrille L., Jouineau C. Infrared tympanic thermography as a substitute for a probe in the evaluation of ear temperature for post-mortem interval determination: a pilot study. Journal of Forensic and Legal Medicine. 2009;16:215–217. doi: 10.1016/j.jflm.2008.07.005. [DOI] [PubMed] [Google Scholar]
- 68.Al-Alousi L.M., Anderson R.A., Worster D.M., Land D.D. Multiple-probe thermography for estimating the postmortem interval: I. continuous monitoring and data analysis of brain, liver, rectal and environmental temperatures in 117 forensic cases. Journal of Forensic Science. 2001;46:317–322. [PubMed] [Google Scholar]
- 69.I. Benko, G.J. Koteles, G. Nemeth, Thermal Imaging of the effects of beta-irradiation on human body surfaces, in: QIRT 1996, Pisa, 1997.
- 70.K. Ammer, Published Papers on Thermology or Temperature Measurement Between 1989 and 2003. <http://www.lla.if.sc.usp.br/art/public1989-2003.pdf>.
- 71.Ammer K. Thermology on the internet – an update. Thermology International. 2009;19:15–28. [Google Scholar]
- 72.Bertelsmann F.W., Heismann J.J., Weber E.J., Veen E.A.v.d., Schouten J.A. Thermal discrimination thresholds in normal subjects and in patients with diabetic neuropathy. Journal of Neurology Neurosurgery and Psychiatry. 1985;48:686–690. doi: 10.1136/jnnp.48.7.686. [DOI] [PMC free article] [PubMed] [Google Scholar]
- 73.Anbar M., Gratt B., Hong D. Thermology and facial telethermography. Part I: history and technical review. Dentomaxillofacial Radiology. 1998;27:61–67. doi: 10.1038/sj/dmfr/4600314. [DOI] [PubMed] [Google Scholar]
- 74.R.P. Clark, M.L.d. Calcina-Goff, International standardization in medical thermography, in: 18th Int. Conf. IEEE Engineering in Medicine and Biology Society, Amsterdam, The Netherlands, 1996.
- 75.Ring E.F.J., Ammer K. The technique of infrared imaging in medicine. Thermology International. 2000;7:7–14. [Google Scholar]
- 76.Webb S. first ed. Institute of Physics Publishing; Bristol: 1988. The Physics of Medical Imaging. [Google Scholar]
- 77.Clark J.A. Effects of surface emissivity and viewing angle on errors in thermography. ACTA Thermographica. 1976;1:138–141. [Google Scholar]
- 78.Watmough D.J., Fowler P.W., Oliver R. The thermal scanning of a curved isothermal surface. Physics in Medicine & Biology. 1970;15:1–8. doi: 10.1088/0031-9155/15/1/301. [DOI] [PubMed] [Google Scholar]
- 79.Zhang Z.M., Tsai B.K., Machin G. Academic Press; Oxford: 2010. Radiometric Temperature Measurements. [Google Scholar]
- 80.Jones D.P. Momentum Press; New York: 2010. Biomedical Sensors. [Google Scholar]
- 81.Diakides N.A. New developments in low cost infrared imaging system. European Journal on Thermology. 1997;7:213–215. [Google Scholar]
- 82.R. Balcerak, J.P. Jenkins, N.A. Diakides, Uncooled focal plane arrays, in: Proc. 18th International Conference of IEEE Engineering in Medicine and Biology Society, Amsterdam, Netherlands, 1996.
- 83.T. White, C. Marshall, N. Butler, Uncooled infrared sensor with digital focal plane array for medical applications, in: Proc. 18th International Conference of IEEE Engineering in Medicine and Biology Society, Amsterdam, Netherlands, 1996.
- 84.Ring E.F.J. High resolution infrared imaging. European Journal on Thermology. 1998;8:121. [Google Scholar]
- 85.Jones B., Plassmann P. Digital infrared thermal imaging of human skin. IEEE Engineering in Medicine and Biology Magazine. 2002;21:41–48. doi: 10.1109/memb.2002.1175137. [DOI] [PubMed] [Google Scholar]
- 86.Jones C., Ring E., Plassmann P., Ammer K., Wiecek B. Standardization of infrared imaging: a reference atlas for clinical thermography-initial results. Thermology International. 2005;15:157–158. [Google Scholar]
- 87.E.F.J. Ring, K. Ammer, B. Wiecek, P. Plassmann, Technical challenges for the construction of a medical IR digital image database, in: J.P. Chatard, P.N.J. Dennis (Eds.), Proc. SPIE, Detectors and Associated Signal Processing II, 2005, pp. 191–198.
- 88.I. Fujimasa, I. Saito, T. Chinzei, Far infrared medical image database on the world wide web, in: Proc. 19th Int. Conf. IEEE/EMBS, Chicago, IL, 1997, pp. 652–653.
- 89.E.F.J. Ring, K. Ammer, A. Jung, P. Murawski, B. Wiecek, J. Zuber, P. Plassmann, C.D. Jones, Standardization of thermal imaging. The Anglo-Polish reference database, in: 10th Congress of the European Association of Thermology, Zakopane, Poland, 2006.
- 90.Vardasca R. In: Proceedings of the 3rd Research Student Workshop. Plassmann P., Roach P., editors. University of Glamorgan, The Research Office; 2008. Template based alignment and interpolation methods comparison of region of interest in thermal images; pp. 21–24. [Google Scholar]
- 91.Plassmann P., Ring E.F.J. An open system for the acquisition and evaluation of medical thermological images. European Journal on Thermology. 1997;7:216–220. [Google Scholar]
- 92.P. Plassmann, P. Murawski, CTHERM for standardized thermography, in: 9th European Congress of Medical Thermology, Krakow, Poland, 2003.
- 93.Rajic N. Principal component thermography for flaw contrast enhancement and flaw depth characterisation in composite structures. Composite Structures. 2002;58:521–528. [Google Scholar]
- 94.Snyder W.E., Qi H., Head L.E., Wang C.X. Increasing the effective resolution of thermal infrared images. IEEE Engineering in Medicine and Biology Magazine. 2000;19:63–70. doi: 10.1109/51.844382. [DOI] [PubMed] [Google Scholar]
- 95.Gulyaev Y.V., Markov A.G., Koreneva L.G., Zakharav P.V. Dynamical infrared thermography in humans. IEEE Engineering in Medicine and Biology Magazine. 1995;14:766–771. [Google Scholar]
- 96.Anbar M. CRC Press; Boca Raton, FL: 1994. Quantitative Dynamic Telethermometry in Medical Diagnosis and Management. [Google Scholar]
- 97.M. Anbar, L. Milescu, M.W. Grenn, K. Zamani, M.T. Marina, Study of Skin hemodynamics with fast dynamic area telethermometry (DAT), in: Proc 19th Int. Conf. IEEE/EMBS, Chicago, IL, 1997, pp. 644–648.
- 98.N.A. Diakides, J.D. Bronzino, Medical Infrared Imaging, CRC Press, 2007.
- 99.P.T. Kuruganti, H. Qi, Asymmetry analysis in breast cancer detection using thermal infrared images, in: Proc. of the 2nd Joint EMBS-BMES Conference, 2002, pp. 1129–1130.
- 100.H. Qi, J. Head, Asymmetry analysis using automatic segmentation and classification for breast cancer detection in thermograms, in: Proc. 23rd Annual International Conference of the IEEE EMBS, Turkey, 2001, pp. 2866–2869.
- 101.Irvine J.M. Targeting breast cancer detection with military technology. IEEE Engineering in Medicine and Biology Magazine. 2002;21:36–40. doi: 10.1109/memb.2002.1175136. [DOI] [PubMed] [Google Scholar]
- 102.Paul J.L., Lupo J.C. From tanks to tumors. IEEE Engineering in Medicine and Biology Magazine. 2002;21:34–35. doi: 10.1109/memb.2002.1175135. [DOI] [PubMed] [Google Scholar]
- 103.Tan T.Z., Quek C., Ng G.S., Ng E.Y.K. A novel cognitive interpretation of breast cancer thermography with complementary learning fuzzy neural memory structure. Expert Systems with Applications. 2007;33:652–666. doi: 10.1016/j.eswa.2006.06.012. [DOI] [PMC free article] [PubMed] [Google Scholar]
- 104.M.L. Brioschi, I. Sanches, F. Traple, 3D MRI/IR imaging fusion: a new medically useful computer tool, in: Inframation Proceedings, Las Vegas, 2007.
- 105.Brioschi M.L., Colman D., Neto H.M. Fusing IR and magnetic resonance (MR) image. Journal of Korean Medical Thermology. 2002;2:57–58. [Google Scholar]
- 106.M.L. Brioschi, J.V. Vargas, O. Malafaia, Review of recent developments in thermographic applications in health care, in: Inframation 2004 Proceedings, Las Vegas, 2004.
- 107.Sun P., Lin H., Jao S.E., Ku Y., Chan R., Cheng C. Relationship of skin temperature to sympathetic dysfunction in diabetic at-risk feet. Diabetes Research and Clinical Practice. 2006;73:41–46. doi: 10.1016/j.diabres.2005.12.012. [DOI] [PubMed] [Google Scholar]
- 108.Pennes H.H. Analysis of tissue and arterial blood temperatures in the resting human forearm. Journal of Applied Physiology. 1948;1:93–122. doi: 10.1152/jappl.1948.1.2.93. [DOI] [PubMed] [Google Scholar]
- 109.Uematsu S. Symmetry of skin temperature comparing one side of the body to other. Thermology. 1986;1:4–7. [Google Scholar]
- 110.Vainer B.G. FPA-based infrared thermography as applied to the study of cutaneous perspiration and stimulated vascular response in humans. Physics in Medicine & Biology. 2005;50:R63–R94. doi: 10.1088/0031-9155/50/23/R01. [DOI] [PubMed] [Google Scholar]
- 111.Kargel C. Infrared thermal imaging to measure local temperature rises caused by handheld mobile phones. IEEE Transactions on Instrumentation and Measurement. 2005;54:1513–1519. [Google Scholar]
- 112.Taurisano M.D., Vorst A.V. Experimental thermographic analysis of thermal effects induced on a human head exposed to 900-MHz fields of mobile phones. IEEE Transactions on Microwave Theory and Techniques. 2000;48:2022–2032. [Google Scholar]
- 113.American Cancer Society: Cancer facts and Figures. <www.cancer.org/docroot/STT/stt_0.asp>.
- 114.National Cancer Institute: SEER Stat Fact Sheets: Breasts. <www.seer.cancer.gov/statfacts/html/breast.html>.
- 115.Ng E.Y.K., Sudarshan N.M. Numerical computation as a tool to aid thermographic Interpretation. Journal of Medical Engineering & Technology. 2001;25:53–60. doi: 10.1080/03091900110043621. [DOI] [PubMed] [Google Scholar]
- 116.Kennedy D., Lee T., Seely D. A comparative review of thermography as a breast screening technique. Integrative Cancer Therapies. 2009;8:9–16. doi: 10.1177/1534735408326171. [DOI] [PubMed] [Google Scholar]
- 117.Ng E.Y.K. A review of thermography as promising non-invasive detection modality for breast tumor. International Journal of Thermal Sciences. 2009;48:849–859. [Google Scholar]
- 118.Spitalier H., Giraud D. Does infrared thermography truly have a role in present-day breast cancer management? Biomedical Thermology. 1982:269–278. [PubMed] [Google Scholar]
- 119.J.W.K. Louis, M. Gautherie, Long term assessment of breast cancer risk by thermal imaging, Biomedical Thermology (1982) 279–301. [PubMed]
- 120.Gamagami P. Blackwell Science; United Kingdom: 1986. Atlas of Mammography: New Early Signs in Breast Cancer. [Google Scholar]
- 121.J.F. Head, F. Wang, R.L. Elliot, Breast thermography is a noninvasive prognostic procedure that predicts tumor growth rate in breast cancer patients, Annals of the New York Academy of Sciences 698 (1993) 153–158. [DOI] [PubMed]
- 122.Arora N., Martins D., Ruggerio D., Tousimis E., Swistel A.J., Osborne M.P., Simmons R.M. Effectiveness of a noninvasive digital infrared thermal imaging system in the detection of breast cancer. The American Journal of Surgery. 2008;196:523–526. doi: 10.1016/j.amjsurg.2008.06.015. [DOI] [PubMed] [Google Scholar]
- 123.Breast Thermography, in: W.C. Amalu (Ed.), Redwood City, California 94063, 2011. <http://www.breastthermography.com/case_studies.htm>.
- 124.Kateb B., Yamamoto V., Yu C., Grundfest W., Gruen J.P. Infrared thermal imaging: a review of the literature and case report. NeuroImage. 2009;47:T154–T162. doi: 10.1016/j.neuroimage.2009.03.043. [DOI] [PubMed] [Google Scholar]
- 125.Sims D., Cavanagh P., Ulbrecht J. Risk factors in the diabetic foot. Recognition and management. Physical Therapy. 1988;68:1887–1902. doi: 10.1093/ptj/68.12.1887. [DOI] [PubMed] [Google Scholar]
- 126.G. Jiang, Z. Shang, M. Zhang, Metabolism parameter analysis of diabetics based on the thermography, in: Proceeding of the 24th Annual Conference and the Annual Fall Meeting of the Biomedical Engineering Society EMBS/BMES Conference, 2002, pp. 2226–2227.
- 127.Branemark P., Fagerberg S., Langer L., Soderbergh J.S. Infrared thermography in diabetes mellitus. Diabetologia. 1967;3:529–532. doi: 10.1007/BF01213572. [DOI] [PubMed] [Google Scholar]
- 128.Bagavathiappan S., Philip J., Jayakumar T., Raj B. Infrared thermal imaging for medical diagnosis. Medical Equipment & Automation. 2009:65–67. doi: 10.4103/0971-6203.48720. [DOI] [PMC free article] [PubMed] [Google Scholar]
- 129.Bagavathiappan S., Saravanan T., Philip J., Jayakumar T., Raj B., Karunanithi R., Panicker T.M., Korath P., Jagadeesan K. Investigation of peripheral vascular disorders using thermal imaging. The British Journal of Diabetes and Vascular Disease. 2008;8:102–104. [Google Scholar]
- 130.Nguyen A.V., Cohen N.J., Lipman H., Brown C.M., Molinari N.A., Jackson W.L., Kirking H., Szymanowski P., Wilson T.W., Salhi B.A., Roberts R.R., Strykar D.W., Fishbein D.B. Comparison of 3 infrared thermal detection systems and self-report for mass fever screening. Emerging Infectious Diseases. 2010;16:1710–1717. doi: 10.3201/eid1611.100703. [DOI] [PMC free article] [PubMed] [Google Scholar]
- 131.Chamberlain J.M., Terndrup T.E., Alexander D.T., Silverstone F.A., Wolf-Klein G., O’Doonell R., Grandner J. Determination of normal ear temperature with an infrared emission detection thermometer. Annals of Emergency Medicine. 1995;25:15–20. doi: 10.1016/s0196-0644(95)70349-7. [DOI] [PubMed] [Google Scholar]
- 132.Ohta J. Case study: influenza pandemic countermeasures utilizing infrared thermography. NEC Technical Journal. 2010;5:65–69. [Google Scholar]
- 133.Ohta J., Hamada E. Detection of body surface temperature by infrared thermography for prevention of influenza pandemic. NEC Technical Journal. 2009;62:88–92. [Google Scholar]
- 134.Chiu W., Lin P., Chiou H.Y., Lee W.S., Lee C.N., Yang Y.Y., Lee H.M., Hsieh M.S., Hu C., Ho Y.S., Deng W.P., Hsu C.Y. Infrared thermography to mass-screen suspected SARS patients with fever. Asia-Pacific Journal of Public Health. 2005;17:26–28. doi: 10.1177/101053950501700107. [DOI] [PubMed] [Google Scholar]
- 135.Chiang M.-F., Lin P.-W., Lin L.-F., Chiou H.-Y., Chien C.-W., Chu S.-F., Chiu W.-T. Mass screening of suspected febrile patients with remote-sensing infrared thermography: alarm temperature and optimal distance. Journal of the Formosan Medical Association. 2008;107:937–944. doi: 10.1016/S0929-6646(09)60017-6. [DOI] [PMC free article] [PubMed] [Google Scholar]
- 136.Ng E.Y.K. Is thermal scanner losing its bite in mass screening of fever due to SARS? Medical Physics. 2005;32:93–97. doi: 10.1118/1.1819532. [DOI] [PMC free article] [PubMed] [Google Scholar]
- 137.H. Nishiura, K. Kamiya, Fever screening during the influenza (H1N1-2009) pandemic at Narita International Airport, Japan, BMC Infectious Diseases, 111–121 (2011). [DOI] [PMC free article] [PubMed]
- 138.E.F.J. Ring, A. Jung, J. Zuber, P. Rutowski, B. Kalicki, U. Bajwa, Detecting fever in polish children by infrared thermography, in: 9th International Conference on Quantitative Infrared Thermography, Krakow, Poland, 2008.
- 139.D.D. Pascoe, E.F. Ring, J.B. Mercer, J. Snell, D. Osborn, J. Hedley-Whyte, International standards for pandemic screening using infrared thermography, in: R.C. Molthen, J.B. Weaver (Eds.), Medical Imaging 2010: Biomedical Applications in Molecular, Structural, and Functional Imaging, SPIE, 2010, pp. 76261Z-76261–76261Z-76268.
- 140.Mercer J.B., Ring E.F.J. Fever screening and infrared thermal imaging: concerns and guidelines. Thermology International. 2009;19:67–69. [Google Scholar]
- 141.Ring E.F.J., Mcevoy H., Jung A., Zuber J., Machin G. New standards for devices used for the measurement of human body temperature. Journal of Medical Engineering & Technology. 2010;34:249–253. doi: 10.3109/03091901003663836. [DOI] [PubMed] [Google Scholar]
- 142.Standards Technical reference for Thermal Imagers for Human Temperature Screening Part 2: Users’ Implementation Guidelines, SPRING, Singapore, TR 15–2 (2004).
- 143.Standards Technical Reference for Thermal Imagers for Human Temperature Screening Part 1: Requirements and Test Methods, SPRING, Singapore, TR 15–1 (2003).
- 144.ISO/TR 13154:2009. <http://www.iso.org/iso/catalogue_detail?csnumber=51236>.
- 145.Weinstein S. Standards for neuromuscular thermographic examination. Modern Medicine: Supplement. 1986;1:5–7. [Google Scholar]
- 146.Gratt B., Graff-Radford S., Shetty V., Solberg W., Sickles E. A six year clinical assessment of electronic facial thermography. Dentomaxillofacial Radiology. 1996;25:247–255. doi: 10.1259/dmfr.25.5.9161178. [DOI] [PubMed] [Google Scholar]
- 147.Gratt B., Sickles E. Electronic facial thermography: an analysis of asymptomatic adult subjects. Journal of Orofacial Pain. 1995;9:255–265. [PubMed] [Google Scholar]
- 148.Gratt B., Sickle E., Ross J., Wexler, Gornbein Thermographic assessment of craniomandibular disorders: diagnostic interpretation versus temperature measurement analysis. Journal of Orofacial Pain. 1994;8:278–288. [PubMed] [Google Scholar]
- 149.Canavan D., Gratt B. Electronic thermography for the assessment of mild and moderate temporomandibular joint dysfunction. Oral Surgery, Oral Medicine, Oral Pathology. 1995;79:778–786. doi: 10.1016/s1079-2104(05)80316-6. [DOI] [PubMed] [Google Scholar]
- 150.Gratt B., Shetty V., Dent M., Saiar M., Sickles E. Electronic thermography for the assessment of inferior alveolar nerve deficit. Oral Surgery, Oral Medicine, Oral Pathology. 1995;80:153–160. doi: 10.1016/s1079-2104(05)80194-5. [DOI] [PubMed] [Google Scholar]
- 151.Gratt B., Sickles E., Shetty V. Thermography for the clinical assessment of inferior alveolar nerve deficit: a pilot study. Journal of Orofacial Pain. 1994;8:369–374. [PubMed] [Google Scholar]
- 152.Cummings M., Biagioni P., Lamey P., Burden D. Thermal image analysis of electrothermal debonding of ceramic brackets: an in-vitro study. European Journal of Orthodontics. 1999;21:111–118. doi: 10.1093/ejo/21.2.111. [DOI] [PubMed] [Google Scholar]
- 153.Carson J., Rider T., Nash D. A thermographic study of heat distribution during ultra-high speed cavity preparation. Journal of Dental Research. 1979;58:1681–1684. doi: 10.1177/00220345790580070401. [DOI] [PubMed] [Google Scholar]
- 154.Watanabe F., Tawada Y., Komatsu S., Hata Y. Heat distribution in bone during preparation of implant sites: heat analysis by real time thermography. International Journal of Oral and Maxillofacial Implants. 1992;7:212–219. [PubMed] [Google Scholar]
- 155.Benington I.C., Biagioni P.A., Crossey P.J., Hussey D.L., Sheridan S., Lamey P.J. Temperature changes in bovine mandibular bone during implant site preparation: an assessment using infra-red thermography. Journal of Dentistry. 1996;24:263–267. doi: 10.1016/0300-5712(95)00072-0. [DOI] [PubMed] [Google Scholar]
- 156.Madura H., Dabrowski M., Dulski R., Zmuda S., Zaborowski P. Thermographic method for evaluation of thermal influence of Nd:YAG laser on a tooth root during sterilization process. Infrared Physics & Technology. 2004;46:167–171. [Google Scholar]
- 157.Biagioni P., Longmore R., McGimpsey J., Lamey P. Infrared thermography: its role in dental research with particular reference to craniomandibular disorders. Dentomaxillofacial Radiology. 1996;25:119–124. doi: 10.1259/dmfr.25.3.9084259. [DOI] [PubMed] [Google Scholar]
- 158.Friedlander A., Gratt B. Panoramic dental radiography and thermography as an aid in detecting patients at risk for stroke. Journal of Oral and Maxillofacial Surgery. 1994;52:1257–1262. doi: 10.1016/0278-2391(94)90047-7. [DOI] [PubMed] [Google Scholar]
- 159.Biagioni P., McGimpsey J., Lamey P. Electronic infrared thermography as a dental research technique. British Dental Journal. 1996;180:226–230. doi: 10.1038/sj.bdj.4809033. [DOI] [PubMed] [Google Scholar]
- 160.Venta I., Hyrkas T., Paakkari I., Ylipaavalniemi P. Thermographic imaging of postoperative inflammation modified by anti-inflammatory pretreatment. Journal of Oral and Maxillofacial Surgery. 2001;59:145–148. doi: 10.1053/joms.2001.20483. [DOI] [PubMed] [Google Scholar]
- 161.Hastings R., Brand P., Mansfield R., Ebner J. Bacterial density in the skin in lepromatous leprosy as related to temperature. Leprosy Review. 1968;39:71–74. doi: 10.5935/0305-7518.19680013. [DOI] [PubMed] [Google Scholar]
- 162.Sabin T., Ebner J. Patterns of sensory loss in lepromatous leprosy. International Journal of Leprosy and Other Mycobacterial Diseases. 1969;37:239–248. [PubMed] [Google Scholar]
- 163.Vargas J.V.C., Brioschi M.L., Dias F.G., Parolin M.B., Mulinari-Brenner F.A., Ordonez J.C., Colman D. Normalized Methodology for medical infrared imaging. Infrared Physics & Technology. 2009;52:42–47. [Google Scholar]
- 164.R.A. Thomas, K.E. Donne, M. Clement, M.N. Kiernan, Optimized laser application in dermatology using infrared thermography, in: Proc. of Thermosense, vol. XXIV, 2002, pp. 424–435.
- 165.Mason B.R., Graff A.J., Pegg S.P. Colour thermography in the diagnosis of the depth of burn injury. Burns. 1981;7:197–202. [Google Scholar]
- 166.Cole R.P., Jones S.G., Shakespeare P.G. Thermographic assessment of hand burns. Burns. 1990;16:60–63. doi: 10.1016/0305-4179(90)90208-e. [DOI] [PubMed] [Google Scholar]
- 167.Schnell H.M., Zaspel J.G. Cooling extensive burns: sprayed coolants can improve initial cooling management – a thermography-based study. Burns. 2008;34:505–508. doi: 10.1016/j.burns.2007.06.012. [DOI] [PubMed] [Google Scholar]
- 168.Mercer J.B., Nielsen S.P., Hoffmann G. Improvement of wound healing by water-filtered infrared-A (wIRA) in patients with chronic venous stasis ulcers of the lower legs including evaluation using infrared thermography. German Medical Science. 2008;6:1–26. [PMC free article] [PubMed] [Google Scholar]
- 169.Weerd L.D., Mercer J.B., Weum S. Dynamic infrared thermography. Clinics in Plastic Surgery. 2011;38:277–292. doi: 10.1016/j.cps.2011.03.013. [DOI] [PubMed] [Google Scholar]
- 170.Flores-Sahagun J.H., Vargas J.V.C., Mulinari-Brenner F.A. Analysis and diagnosis of basal cell carcinoma (CCC) via infrared imaging. Infrared Physics & Technology. 2011;54:367–378. [Google Scholar]
- 171.Cesaris R.D., Grimaldi A., Balestrazzi M., Ranieri G., Chirappa R., Avantaggianto F. Changes in blood pressure and thermographic values resulting from use of a beta-blocker plus diuretic and of an alpha-beta-blocker plus diuretic. Drugs Under Experimental and Clinical Research. 1985;11:725–729. [PubMed] [Google Scholar]
- 172.Ring E.F.J., Aarts N.J.M., Black C.M., Bosiger P. Raynaud’s phenomenon: assessment by thermography (EAT Report) Thermology. 1988;3:69–73. [Google Scholar]
- 173.Hirschl M., Katzenschlager R., Francesconi C., Kundi M. Low level laser therapy in primary Raynaud’s phenomenon – results of a placebo controlled, double blind intervention study. Journal of Rheumatology. 2004;31:2408–2412. [PubMed] [Google Scholar]
- 174.Chikura B., Moore T., Manning J., Vail A., Herrick A.L. Thumb involvement in Raynaud’s phenomenon as an indicator of underlying connective tissue disease. Journal of Rheumatology. 2010;37:783–786. doi: 10.3899/jrheum.091117. [DOI] [PubMed] [Google Scholar]
- 175.Schiavenato M., Thiele R.G. Thermography detects subclinical inflammation in chronic tophaceous gout. Journal of Rheumatology. 2012;39:182–183. doi: 10.3899/jrheum.110581. [DOI] [PubMed] [Google Scholar]
- 176.McHugh N.J., Elvins D.M., Ring E.F.J. Elevated Anticardiolipin Antib Odies in a patient with vibration white-finger, valvular heart disease and psoriatic arthritis. Clinical Rheumatology. 1993;12:70–73. doi: 10.1007/BF02231562. [DOI] [PubMed] [Google Scholar]
- 177.Ring E.F.J., Collins A.J., Bacon P.A., Cosh J.A. Quantitation of thermography in arthritis using multi-isothermal analysis II. Effect of nonsteroidal anti-inflammatory therapy on the thermographic index. Annals of the Rheumatic Diseases. 1974;33:353–356. doi: 10.1136/ard.33.4.353. [DOI] [PMC free article] [PubMed] [Google Scholar]
- 178.Arnold M.H., Preston S.J.L., Beller E.M., Buchanan W.W. Infra-red surface thermography. Evaluation of a new radiometry instrument for measuring skin temperature over joints. Clinical Rheumatology. 1989;8:225–230. doi: 10.1007/BF02030078. [DOI] [PubMed] [Google Scholar]
- 179.Ring E. Thermography and rheumatic diseases. Bibliotheca Radiologica. 1975;6:97–106. [PubMed] [Google Scholar]
- 180.Collins A., Ring E., Cosh J., Bacon P. Quantitation of thermography in arthritis using multi-isothermal analysis. I. The thermographic index. Annals of the Rheumatic Diseases. 1974;33:113–115. doi: 10.1136/ard.33.2.113. [DOI] [PMC free article] [PubMed] [Google Scholar]
- 181.Paterson J., Watson W.S., Teasdale E., Evans A.L., Newman P., James W.B., Pitkeathly D.A. Assessment of rheumatoid inflammation in the knee joint. Annals of the Rheumatic Diseases. 1978;37:48–52. doi: 10.1136/ard.37.1.48. [DOI] [PMC free article] [PubMed] [Google Scholar]
- 182.M. Frize, C. Adea, P. Payeur, G.D. Primio, J. Karsh, A. Ogungbemile, Detection of rheumatoid arthritis using infrared imaging, in: Proc. of SPIE, 7962 (2011) 9620M-9621–79620M-79611.
- 183.Wu C.L., Yu K.L., Chuang H.Y., Huang M.H., Chen T.W., Chen C.H. The application of infrared thermography in the assessment of patients with coccygodynia before and after manual therapy combined with diathermy. Journal of Manipulative and Physiological Therapeutics. 2009;32:287–293. doi: 10.1016/j.jmpt.2009.03.002. [DOI] [PubMed] [Google Scholar]
- 184.Fujino H., Kohzuki H., Takeda I., Kiyooka T., Miyasaka T., Mohri S. Regression of capillary network in atrophied soleus muscle induced by hindlimb unweighting. Journal of Applied Physiology. 2005;98:1407–1413. doi: 10.1152/japplphysiol.00961.2004. [DOI] [PubMed] [Google Scholar]
- 185.Vecchio P.C., Adebajo A.O., Chard M.D., Thomas P.P., Hazleman B.L. Thermography of frozen shoulder and rotator cuff tendinitis. Clinical Rheumatology. 1992;11:382–384. doi: 10.1007/BF02207197. [DOI] [PubMed] [Google Scholar]
- 186.Jeracitano D., Cooper R., Lyon L., Jayson M. Abnormal temperature control suggesting sympathetic dysfunction in the shoulder skin of patients with frozen shoulder. British Journal of Rheumatology. 1992;31:539–542. doi: 10.1093/rheumatology/31.8.539. [DOI] [PubMed] [Google Scholar]
- 187.Thomas D., Siahamis G., Marion M., Boyle C. Computerised infrared thermography and isotopic bone scanning in tennis elbow. Annals of the Rheumatic Diseases. 1992;51:103–107. doi: 10.1136/ard.51.1.103. [DOI] [PMC free article] [PubMed] [Google Scholar]
- 188.Morgan P., Tullo A., Efron N. Infrared thermography of the tear film in dry eye. Eye (London) 1995;9:615–618. doi: 10.1038/eye.1995.149. [DOI] [PubMed] [Google Scholar]
- 189.Tan J.H., Ng E.Y.K., Acharya U.R., Chee C. Study of normal ocular thermogram using textural parameters. Infrared Physics & Technology. 2010;53:120–126. [Google Scholar]
- 190.Chang T.C., Hsiao Y.L., Liao S.L. Application of digital infrared thermal imaging in determining inflammatory state and follow-up effect of methylprednisolone pulse therapy in patients with Graves’ ophthalmopathy. Graefe’s Archive for Clinical and Experimental Ophthalmology. 2008;246:45–49. doi: 10.1007/s00417-007-0643-0. [DOI] [PubMed] [Google Scholar]
- 191.Brunsmann U., Sauer U., Arba-Mosquera S., Magnago T., Triefenbach N. Evaluation of thermal load during laser corneal refractive surgery using infrared thermography. Infrared Physics & Technology. 2010;53:342–347. [Google Scholar]
- 192.Ng D.K., Chan C.H., Lee R.S., Leung L.C. Non-contact infrared thermometry temperature measurement for screening fever in children. Annals of Tropical Paediatrics. 2005;25:267–275. doi: 10.1179/146532805X72412. [DOI] [PubMed] [Google Scholar]
- 193.Knobel R.B., Guenther B.D., Rice H.E. Thermoregulation and thermography in neonatal physiology and disease. Biological Research for Nursing. 2011;13:274–282. doi: 10.1177/1099800411403467. [DOI] [PMC free article] [PubMed] [Google Scholar]
- 194.Bhatia M., Poley J.R., Haberman J.D., Boon D.J. Abdominal Thermography in infantile and childhood liver diseases. Southern Medical Journal. 1976;69:1045–1048. doi: 10.1097/00007611-197608000-00029. [DOI] [PubMed] [Google Scholar]
- 195.Unger J.K., Lemke A.J., Siestrup C.G. Thermography as potential real-time technique to assess changes in flow distribution in hemofiltration. Kidney International. 2006;69:520–525. doi: 10.1038/sj.ki.5000143. [DOI] [PubMed] [Google Scholar]
- 196.Oosterlinck W., De W.S. Avascular nephrotomy by means of thermography. European Urology. 1981;7:25–26. doi: 10.1159/000473166. [DOI] [PubMed] [Google Scholar]
- 197.Montana Thermography Centre: The Heart’s Thermoscape. <http://www.thermographyofmontana.com/other/2.php?t=prevent_Heart+Disease+%26+Stroke>.
- 198.Grand A.M.D., Frangioni J.V. An operational near-infrared fluorescence imaging system prototype for large animal surgery. Technology in Cancer Research and Treatment. 2003;2:553–562. doi: 10.1177/153303460300200607. [DOI] [PubMed] [Google Scholar]
- 199.Madjid M., Willerson J.T., Casscells S.W. Intracoronary thermography for detection of high-risk vulnerable plaques. Journal of the American College of Cardiology. 2006;47:C80–C85. doi: 10.1016/j.jacc.2005.11.050. [DOI] [PubMed] [Google Scholar]
- 200.J. Menczer, B.A. Eskin, Evaluation of postpartum breast engorgement by thermography, Obstetrics and Gynecology 33 (1969). [PubMed]
- 201.Ng W.K., Ng Y.K., Tan Y.K. Qualitative study of sexual functioning in couples with erectile dysfunction: prospective evaluation of the thermographic diagnostic system. Journal of Reproductive Medicine. 2009;54:698–705. [PubMed] [Google Scholar]
- 202.Gorbach A.M., Heiss J.D., Kopylev L., Oldfield E.H. Intraoperative infrared imaging of brain tumors. Journal of Neurosurgery. 2004;101:960–969. doi: 10.3171/jns.2004.101.6.0960. [DOI] [PMC free article] [PubMed] [Google Scholar]