To the Editor
Advances in high-throughput genomics have reshaped the cancer research landscape. Complete characterization of genomic, epigenomic and transcriptomic changes of tumors, combined with clinical characterization, will help predict pathological behavior and effective treatments. However, comprehensive analysis of the cancer genome remains a daunting challenge. We must visualize, integrate, compare and analyze large cancer genomics datasets. Ultimately, these data and the resulting conclusions must be presented to the scientific and medical communities in a coherent, integrated system for display and analysis informed by current knowledge about human genome biology and variation.
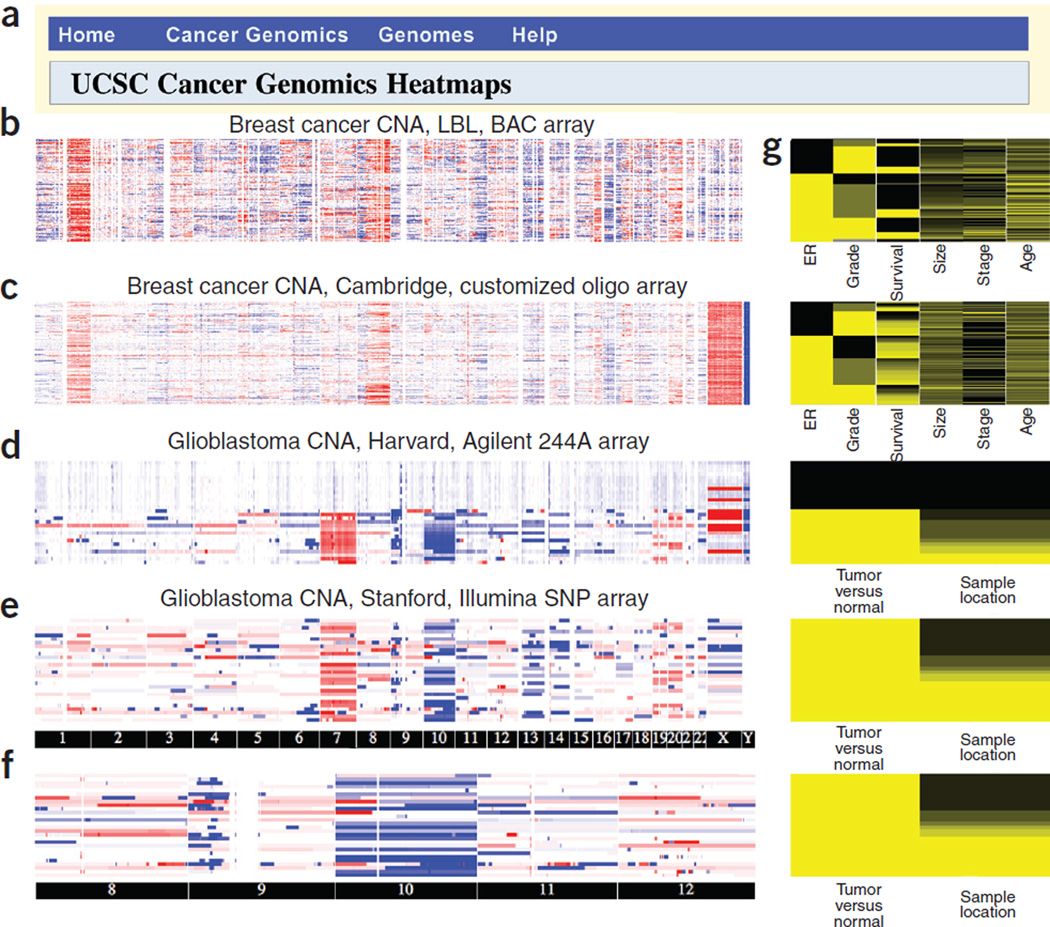
We developed the University of California Santa Cruz (UCSC) Cancer Genomics Browser to extend and complement the UCSC Genome Browser1, 2 by facilitating an integrative, interactive and versatile display, and comprehensive analysis of cancer genomic and clinical data (http://genome-cancer.ucsc.edu/; Supplementary Notes, Supplementary Methods and Supplementary Tutorial online). This browser displays whole-genome and pathway-oriented views of genome-wide experimental measurements for individual and sets of samples as genome heatmaps (Fig. 1 and Supplementary Figs. 1 and 2 online). Clinical features are numerically coded and displayed in separate heatmaps (Fig. 1g). Investigators can order, filter, aggregate and display data by data values, chromosomal coordinates, clinical features, curated biological pathways or user-defined gene sets (Supplementary Table 1 and Supplementary Figs. 1–4 online). Statistical analyses can be performed and displayed graphically through the browser (Supplementary Figs. 1, 3 and 5 online). An expanding body of publicly available cancer genomics studies is available at our public site (Supplementary Table 2 online). Secure access is available at separate private sites to protect patient privacy and limit access to unpublished data. Investigators can use the public browser or install it at their own site and upload data for local display (Supplementary Notes).
Figure 1.
The functionality of UCSC Cancer Genomics Browser. (a) Browser gateway menu. (b–e) Screenshots of four whole genome–oriented views of copy number abnormality (CNA) data from a cohort of Californian individuals with breast cancer assessed using bacteria artificial chromosome (BAC) array comparative genomic hybridization1 (b), a cohort of European individuals with breast cancer using an Agilent oligo array2 (c) and a disjoint cohort of individuals with glioblastoma made available through the Cancer Genome Atlas consortium and assayed on an Agilent 244A CGH array (d) and Illumina 550K SNP array3 (e). Experiments were performed separately at Lawrence Berkeley National Laboratory (LBL), University of Cambridge, Harvard University and Stanford University (displayed at top of each panel). (f) Zoomed-in view of the data from e on chromosome 8–12. (g) Clinical heatmap. Data from blood-derived samples were considered as control and given clinical feature ‘normal’.
We used the browser to visualize whole-genome copy number abnormality (CNA) data and selected clinical features of samples from two tumor types, glioblastoma and breast carcinoma (Fig. 1). The genome heatmaps revealed that the two tumor types exhibit coherent but distinct global patterns of CNA3–5 (Fig. 1b–e and Supplementary Fig. 1). Breast cancer tumors had characteristic amplifications on chromosomes 1q and 8; glioblastomas had amplifications on 7 and deletions on chromosomes 9p, 10, 13 and 14. To explore detailed patterns in a particular genomic region, the genome heatmap allows users to zoom and pan (Fig. 1f), and ultimately enter the UCSC Genome Browser1, 2 to examine data from individual samples in small regions (Supplementary Fig. 1f). Use of browser utilities (including the pathway sorter and feature sorter) highlights biological insights, as illustrated in a comparison of gene expression classifiers for outcome prediction for individuals with breast cancer (Supplementary Notes and Supplementary Figs. 5–7 online) and reanalysis of data from The Cancer Genome Atlas in the context of biological pathways (Supplementary Notes and Supplementary Fig. 8 online).
As an extension of the Genome Browser5, the Cancer Genomics Browser aims to effectively visualize and analyze cancer genomic and clinical data, providing a platform to present these data in an integrated system for cancer researchers and the broader scientific community. The utility of this browser is not limited to cancer-related data. As genome-wide high-throughput data become more available, we expect such tools to be increasingly important in disease research.
Supplementary Material
Footnotes
Note: Supplementary information is available on the Nature Methods website.
Contributor Information
David Haussler, Email: haussler@soe.ucsc.edu.
Ting Wang, Email: tingwang@soe.ucsc.edu.
References
- 1.Karolchik D, et al. Nucleic Acids Res. 2008;36:D773–D779. doi: 10.1093/nar/gkm966. [DOI] [PMC free article] [PubMed] [Google Scholar]
- 2.Kent WJ, et al. Genome Res. 2002;12:996–1006. doi: 10.1101/gr.229102. [DOI] [PMC free article] [PubMed] [Google Scholar]
- 3.Chin K, et al. Cancer Cell. 2006;10:529–541. doi: 10.1016/j.ccr.2006.10.009. [DOI] [PubMed] [Google Scholar]
- 4.Chin SF, et al. Genome Biol. 2007;8:R215:1–R215:17. doi: 10.1186/gb-2007-8-10-r215. [DOI] [PMC free article] [PubMed] [Google Scholar]
- 5.TCGA Research Network. Nature. 2008;455:1061–1068. [Google Scholar]
Associated Data
This section collects any data citations, data availability statements, or supplementary materials included in this article.


