Abstract
Near-infrared (NIR) fluorophores show superior in vivo imaging properties than visible-light fluorophores because of the increased light penetration in tissue and lower autofluorescence of these wavelengths. We have recently reported that new NIR cyanine dyes containing a novel C4′-O-alkyl linker exhibit greater chemical stability and excellent optical properties relative to existing C4′-O-aryl variants. In this study, we synthesized two NIR cyanine dyes with the same core structure and charge but different indolenine substituents: FNIR-Z-759 bearing a combination of two sulfonates and two quaternary ammonium cations, and FNIR-G-765 bearing a combination of two sulfonates and two guanidines, resulting in zwitterionic charge with distinct cationic moieties. In this study, we compare the in vitro and in vivo optical imaging properties of monoclonal antibody (mAb) conjugates of FNIR-Z-759 and FNIR-G-765 with panitumumab (pan) at antibody-to-dye ratios of 1:2 or 1:5. One-to-five conjugation of pan-to-FNIR-G-765 was not successful due to aggregate formation during the conjugation reaction. Conjugates of both dyes to pan (2:1) demonstrated similar quenching capacity, stability, and brightness in target cells in vitro. However, FNIR-Z-759 conjugates showed significantly lower accumulation in the mouse liver, resulting in higher tumor-to-liver ratio. Thus, FNIR-Z-759 conjugates appear to have superior in vivo imaging characteristics compared with FNIR-G-765 conjugates, especially in the abdominal region. Moreover, from a chemistry point of view, mAb conjugation with FNIR-Z-759 has an advantage over FNIR-G-765, because it does not form aggregates at high dye-to-mAb ratio. These results suggest that zwitterionic cyanine dyes are a superior class of fluorophores for conjugating with mAbs for fluorescence imaging applications due to improving target-to-background contrast in vivo. However, zwitterionic cyanine dyes should be designed carefully, as small changes to the structure can alter in vivo pharmacokinetics of mAb-dye conjugates.
Keywords: near-infrared fluorophore, zwitterionic cyanine, in vivo imaging, monoclonal antibodies, antibody conjugate
TOC image
Small changes on zwitterionic Cy7-based cyanine dyes to the chemical structure can alter in vivo pharmacokinetics of mAb-dye conjugates.

Introduction
The development and clinical translation of near-infrared (NIR) imaging modalities is an emerging field.1 Fluorescence-guided surgical interventions (FGS), which use NIR optical beacons to help define tumor margins, are being applied regularly in clinical settings.2–5 Monoclonal antibody (mAb) conjugates of NIR fluorophores, particularly heptamethine cyanines, are attractive imaging agents for FGS due to their excellent pharmacological and optical properties and targeting of tumor antigens.6,7 However, many existing cyanine-based dyes suffer from poor chemical stability and low quantum efficiency. When conjugating with mAbs, cyanine dyes often alter the pharmacokinetics of the parental mAb. Additionally, catabolites containing cyanine dyes are not quickly excreted from the body, resulting in low target-to-background ratios in in vivo imaging.8
Identifying organic fluorophores in the NIR range with optimal structures is an emerging goal for in vivo optical imaging. We recently reported a new approach to synthesize NIR cyanines through a variant of the Smiles rearrangement.8,9 The resulting molecules have excellent chemical stability and useful in vivo imaging properties. An important characteristic still in need of optimization is the identity and distribution of charged functional groups around the core chromophoric element. Prior work has found that altering these peripheral substituents on heptamethine cyanines can have a marked effect on in vivo biodistribution and tumor imaging.10–12 Specifically, we and others have shown that installation of trimethyl-ammonium substituents in place of conventional sulfonate functional groups, which forms a zwitterionic vs. net negatively charged structure, respectively, can dramatically enhance tumor contrast. As relatively few studies in this area have been reported, a thorough investigation of key structure-activity-relationships (SAR) that afford such improvements is needed.
Building on the promising results seen with zwitterionic variants, we report the synthesis and analysis of the first guanidine-substituted heptamethine cyanine, FNIR-G-765. Guanidine functional groups have been used extensively in various biological contexts but have never been explored as a charged group to improve the biocompatibility of NIR fluorophores.
In this study, we compare the in vitro and in vivo characteristics of mAb conjugates of the previously reported trimethyl-ammonium derivative (FNIR-Z-759)11 and the newly developed guanidine-substituted dye (FNIR-G-765).
Materials and methods
General methods
All chemicals were of reagent grade or better, purchased from Sigma-Aldrich (St. Louis, MO, USA) or Fisher Scientific (Newark, DE, USA), and used as received. Panitumumab, a fully humanized IgG2 mAb directed against EGFR, was purchased from Amgen (Thousand Oaks, CA, USA).
General Materials and Methods
4-hydrazinylbenzenesulfonic acid was obtained from Tokyo Chemical Industry Co and used as received. All other reagents were obtained from Sigma-Aldrich and used as received. Flash chromatography was performed on an Analogix Intelliflash Workstation with C18aq columns (Teledyne Isco Inc). Liquid chromatography-mass spectrometry (LC-MS) was performed on an Agilent 1200 Series instrument equipped with a multi-wavelength detector and a LC/MSD TrapXCT Agilent Technologies system. An Eclipse Plus C18 column (4.6 × 50 mm; 5 μm) was used and runs were monitored at 254, 650, and 750 nm. Solvent A was 0.05% (v/v) TFA in water, Solvent B was 0.05% (v/v) TFA in acetonitrile, and a linear gradient of 0% to 95% B over 8 min and further maintained at 95% B for 4 min at a flow rate of 0.5 mL/min was used. 1H-NMR spectra were recorded with a Varian spectrometer at 400 MHz. Chemical shifts are reported in parts per million (δ) and are referenced to the deuterated solvent signals. Absorbance measurements were performed on a Shimadzu UV-2550 spectrophotometer operated by UV Probe 2.32 software. Fluorescence measurements were carried out using a PTI QuantaMaster steady-state spectrofluorimeter operated by FelixGX 4.2.2 software, with 5 nm excitation and emission slit widths, 0.1 s integration rate, and enabled emission correction.
Chemical Synthesis
2
Compound 1 (1.42 g, 5.96 mmol), 3-bromopropylamine hydrobromide (3.66 g, 16.7 mmol), and anhydrous toluene (20 mL) were added to a pressure flask. The suspension was purged with argon and heated at 130 °C for 4 days. The reaction mixture was cooled to room temperature and toluene was decanted. The remaining red residue was dissolved in water and purified by reverse phase flash chromatography (0 to 30% MeCN/water). The solvents were removed under reduced pressure to afford the final product (0.88 g, 2.96 mmol, 50% yield) as a yellow solid. 1H-NMR (400 MHz, D2O): 1.47 (s, 6H), 2.20 (m, 2H), 3.08 (t, 2H, J = 8 Hz), 4.47 (t, 2H, J = 8 Hz), 7.76 (d, 1H, J = 9 Hz), 7.88 (dd, 1H, J = 8, 2 Hz), 7.99 (s, 1H). ESI positive m/z: calc: 297.4; found: 297.2 [M]+.
3
Compound 2 (0.481 g, 1.6 mmol) and amino(imino)methanesulfonic acid (2.02 g, 16 mmol) were dissolved in water (25 mL). The solution was stirred at room temperature and the pH adjusted to 9 with triethylamine. The starting material was consumed within 15 minutes. The reaction mixture was lyophilized, dissolved in water, and purified by reverse phase flash chromatography (0 to 30% MeCN with 0.05% (v/v) TFA/water with 0.05% (v/v) TFA). The product (0.525 g, 1.55 mmol, 97% yield) was obtained as an off-white solid. 1H-NMR (400 MHz, DMSO-d6 (98%)/D2O (1.6%)/TFA (0.4%)): 1.51 (s, 6H), 2.05 (m, 2H), 2.51 (s, 3H), 3.28 (t, 2H, J = 7 Hz), 4.43 (t, 2H, J = 8 Hz), 7.59 (m, 2H), 7.80 (m, 1H), 7.94 (m, 1H). ESI positive m/z: calc: 339.4; found: 339.3 [M]+.
5
Compound 3 (50 mg, 0.147 mmol) and (E)-2-chloro-3-(hydroxymethylene)cyclohex-1-ene-1-carbaldehyde 4 (13 mg, 0.075 mmol) were dissolved in DMSO (5 mL) and ethanol (5 mL). The reaction was stirred at room temperature for 4 days. The reaction mixture was concentrated and the residue redissolved in DMSO (1.5 mL). Diethyl ether (200 mL) was added to the solution, and the resulting solid collected to yield 5 (52 mg, 87% yield, 85% purity) as a green solid, which was used for the next step without further purification. 1H-NMR (400 MHz, DMSO-d6 (98.3%)/D2O (1.7%)): 1.65 (s, 12H), 1.82 (m, 2H), 1.92 (m, 4H), 2.67 (m, 4H), 3.19 (t, 4H, J = 7 Hz), 4.19 (t, 4H, J = 7 Hz), 6.27 (d, 2H, J = 14 Hz), 7.29 (m, 2H), 7.42 (m, 4H), 7.61 (d, 2H, J = 7 Hz), 7.81 (t, 2H, J = 6 Hz), 8.24 (d, 2H, J = 14 Hz). ESI positive m/z: calc: 814.3; found: 814.3 [M]+. λmax 806 nm (DMSO).
7
Compound 5 (52 mg, 0.064 mmol) and N-methylethanolamine (0.1 mL, 94 mg, 1.25 mmol) were added to a round bottom flask. The flask was purged with argon and DMSO (2.3 mL) was added. The reaction mixture was heated at 60 °C for 45 minutes. The reaction was cooled to room temperature and diethyl ether (200 mL) was added. The resulting precipitate (41 mg, 75% yield) was collected as a dark blue solid, which was used in the next step without further purification. ESI positive m/z: calc: 853.1; found: 853.3 [M]+. The precipitate (38 mg, 0.045 mmol) was dissolved in DMSO (0.5 mL) followed by the addition of water (38 mL) and TFA (1 mL). The reaction mixture was heated at 35 °C overnight. The reaction mixture was cooled to room temperature and filtered. The solvents were removed under reduced pressure to afford intermediate 6 as a green solid (19 mg, 50% yield). ESI positive m/z: calc: 853.1; found: 853.4 [M]+. 6 (15 mg, 0.018 mmol) and glutaric anhydride (45 mg, 0.395 mmol) were dissolved in DMSO (2.5 mL). The reaction mixture was heated at 35 °C overnight. The reaction was cooled to room temperature and directly injected onto a C18aq column (0 to 30% MeCN with 0.05% (v/v) TFA/water with 0.05% (v/v) TFA). Product fractions were combined and concentrated to afford 7 as a green solid (10 mg, 0.01mmol, 28% yield). 1H-NMR (400 MHz, DMSO-d6 (98.3%)/D2O (1.7%)): 1.61 (s, 4H), 1.64 (s, 8H), 1.75 (m, 4H), 1.90 (m, 4H), 2.21 (t, 1H, J = 7 Hz), 2.30 (t, 2H, J = 7), 2.43 (t, 1H, J = 7), 2.51 (m, 4H), 3.03 (s, 1H), 3.14 (s, 2H), 3.21 (t, 4H, J = 7 Hz), 3.85 (m, 2H), 4.00 (m, 2H), 4.14 (t, 4H, J = 7 Hz), 6.10 (d, 2H, J = 14), 7.23 (m, 2H), 7.37 (m, 4H), 7.58 (m, 2H), 7.82 (m, 1H), 7.95 (m, 2H). ESI positive m/z: calc: 967.2; found: 967.4 [M]+.
FNIR-G-765
To a solution of compound 7 (5.8 mg, 0.0060) mmol) and N,N,N′,N’-tetramethyl-O-(N-succinimidyl)uronium tetrafluoroborate (3.6 mg, 0.012 mmol) in anhydrous DMSO under argon was added N,N-diisopropylethylamine (2 μL, 0.012 mmol). The deep green solution was stirred at 22 °C for 30 minutes, after which time LC/MS analysis indicated complete consumption of 8. The reaction was precipitated into 10 mL of diethyl ether, centrifuged, and the supernatant decanted. The green pellet was triturated successively with 10 mL of ethyl acetate and 10 mL of diethyl ether. The pellet was dried under high vacuum (< 1 Torr) and isolated as a dark green solid (5.3 mg, 78% yield). MS (ESI) m/z 1064.4 calculated for C50H67N10O12S2, m/z 1064.4 (M+), 532.6 (M+H)+/2.
Determination of molar absorption coefficients and quantum yields
Molar absorption coefficients (ε) and quantum yields (Φf) for unconjugated FNIR-Z-759 and FNIR-G-765 and 1:2 antibody conjugates were measured as previously described in 50 mM PBS (pH 7.2).13 Fluorophore brightness is defined as the product of ε and Φf.
Synthesis of FNIR-Z-759 and FNIR-G-765-conjugated panitumumab
For conjugation 1:2 (2 dye molecules per antibody), pan (1 mg, 6.8 nmol) was incubated with FNIR-Z-759 or FNIR-G-765 (30.8 nmol) in 0.1 M Na2HPO4 (pH 8.5) at room temperature for 1 h. For conjugation 1:5 (5 dye molecules per antibody), pan (1 mg, 6.8 nmol) was incubated with FNIR-Z-759 or FNIR-G-765 (68 nmol) in 0.1 M Na2HPO4 (pH 8.5) at room temperature for 1 h. The resulting mixture was purified with a Sephadex G25 column (PD-10; GE Healthcare, Piscataway, NJ, USA). The protein concentration was determined with the Coomassie Plus protein assay kit (Thermo Fisher Scientific Inc., Rockford, IL, USA) by measuring absorption at 595 nm (8453 Value System; Agilent Technologies, Santa Clara, CA, USA). The concentration of dye was measured by absorption at 765 nm or 759 nm to confirm the number of fluorophore molecules conjugated to each mAb. Absorption and emission curves were measured in 1:1 MeOH/PBS (pH 7.4) for 2:1 conjugates at an effective dye concentration of 1 μM, with excitation at 765 nm or 759 nm. SDS-PAGE was performed as a quality control for each conjugate. Fluorescent bands were measured with a Pearl Imager (LI-COR Biosciences) using a 800 nm emission channel. We abbreviate FNIR-Z-759 or FNIR-G-765 conjugated to pan as pan-FNIR-Z-759 (1:2), pan-FNIR-G-765 (1:2), pan-FNIR-Z-759 (1:5), and pan-FNIR-G-765 (1:5). We used diluted pan (2 μg) as a non-conjugated control for SDS-PAGE.
Determination of in vitro quenching capacity
The quenching capacity of each conjugate was investigated by denaturation with 1% SDS.9 Briefly, the conjugates were incubated with 1% (v/v) SDS in phosphate-buffered saline (PBS, pH 7.4) for 15 min at room temperature. As a control, the samples were incubated in PBS without SDS. The change in fluorescence intensity of FNIR-Z-759 or FNIR-G-765 was investigated with a Pearl Imager using an 800 nm emission channel. Regions of interest (ROIs) were placed on the fluorescence images with reference to white light images to measure the fluorescence intensities of the solutions. Pearl software was used for calculating ROI signal data.
Cell culture
EGFR-expressing MDA-MB-468 cells (breast cancer cell line) were used as the receptor-positive cell line. Balb/3T3 cells transfected with RFP were used as the receptor-negative cell line. Briefly, Balb/3T3 cells were transfected with RFP (EF1α)- lentiviral particles (AMSBIO, Cambridge, MA, USA) and high, stable RFP expression was confirmed after 10 passages in the absence of a selection agent. Both cell lines were grown in RPMI 1640 (Life Technologies, Gaithersburg, MD, USA) supplemented with 10% fetal bovine serum and 1% penicillin/streptomycin (Life Technologies), in tissue culture flasks, and in a humidified incubator at 37 °C and an atmosphere of 95% air and 5% carbon dioxide.
Flow Cytometry
In vitro fluorescence on cells was measured using a flow cytometer (FACS Calibur, BD BioSciences, San Jose, CA, USA) and analyzed with CellQuest software (BD BioSciences). Cells (1 × 10⁵) were incubated with each conjugate (10 μg/mL) or free dye (0.5 μM) for 1 h at 4 °C. To validate the specific binding of the conjugated antibody, excess antibody (50 μg) was used to block 0.5 μg of conjugates.14,15
Fluorescence microscopy
To detect the antigen specific localization of each conjugate, fluorescence microscopy was performed with a confocal laser scanning microscope (LSM5 meta, Carl Zeiss, Jena, Germany). Ten thousand cells were seeded on coverglass-bottomed dishes and incubated for 24 h. Each mAb-dye conjugate or free dye was then added to the culture medium at 10 μg/mL or 0.5 μM, respectively, and incubated at 4 °C (on ice) for 1 h. The media containing conjugates or dyes was changed to new media (containing no conjugates/dyes) and cells observed after a 6 h incubation at 37 °C.
Alternatively, cells were incubated for 1 h with each conjugate or free dye and the presence of a fluorescence signal confirmed. Cells were then washed with medium, new medium (containing no conjugates/dyes) added, and incubated for 3 days, at which time cells were observed by microscopy. Image analysis was performed with ZEN software (Carl Zeiss).
Animal and tumor models
All in vivo procedures were conducted in compliance with the Guide for the Care and Use of Laboratory Animal Resources (1996), US National Research Council, and approved by the local Animal Care and Use Committee. Six- to eight-week-old female homozygote athymic nude mice were purchased from Charles River (NCI-Frederick). During procedures, mice were anesthetized with isoflurane.
Six million MDA-MB-468 cells were injected subcutaneously in the right dorsum. The experiments were performed at 14 days after cell injection. Tumors reaching approximately 8 mm in length were selected for the study. To avoid auto-fluorescence in the intestine, mice were fed with white food from 7 days after cell injection.
In vivo fluorescence imaging
In vivo fluorescence images were obtained with a Pearl Imager (LI-COR Bioscience) after intravenous injection of 50 μg of each conjugate or free dye. Mice were imaged side-by-side in the same view field at 1 h, 3 h, 6 h, 1 day, 2 days, 3 days, 4 days, and 7 days post-injection. Equal sized regions of interest (ROIs) were manually drawn on each tumor and fluorescence intensity at 800 nm was measured. When comparing fluorescence, Pearl Cam software (LI-COR Biosciences) was used for calculating the average fluorescence intensity of each tumor ROI. ROIs were also placed in the adjacent non-tumor region (e.g. a symmetrical region to the left of the tumor) and fluorescence measured as before. Tumor-to-background ratio (TBR) was calculated using following formula: TBR = ((mean tumor intensity) − (mean background intensity))/((mean non-tumor intensity) − (mean background intensity)). Tumor-to-liver ratio (TLR) was calculated using following formula: TLR = ((mean tumor intensity) − (mean background intensity))/((mean liver intensity) − (mean background intensity)).
Statistical Analysis
Data are expressed as the mean ± S.E.M. from a minimum of three experiments, unless otherwise indicated. Statistical analyses were carried out using GraphPad Prism (La Jolla, CA, USA).
Results
Synthesis of FNIR-G-765 dye and characterization of FNIR-Z-759 and FNIR-G-765 dye and dye-mAb conjugates
The synthesis of the NHS ester of FNIR-G-765 was carried out using a variation of the previously published Smiles rearrangement strategy (Scheme 1).8 The key indolenine subunit was accessed from primary amine 2, which was generated through a modification of the known procedure.16 The corresponding guanidine 3 was formed with amino(imino)methanesulfonic acid under aqueous conditions. The C4′-chloro heptamethine cyanine 5 was formed via the conventional bis-Knoevenagel strategy with 4 and 3.17 Compound 5 reacts with N-methylethanolamine to provide the C4′-N-linked heptamethine cyanine. After some investigation, we found that the optimal approach to elaborate this compound entailed conversion to O-linked intermediate 6 with TFA in aqueous DMSO. Intermediate 6 reacted with glutaric anhydride to provide carboxylic acid 7. NHS ester formation with N,N,N′,N′-tetramethyl-O-(N-succinimidyl) uronium tetrafluoroborate (TSTU) provided FNIR-G-765 in 78% yield.
Scheme 1.
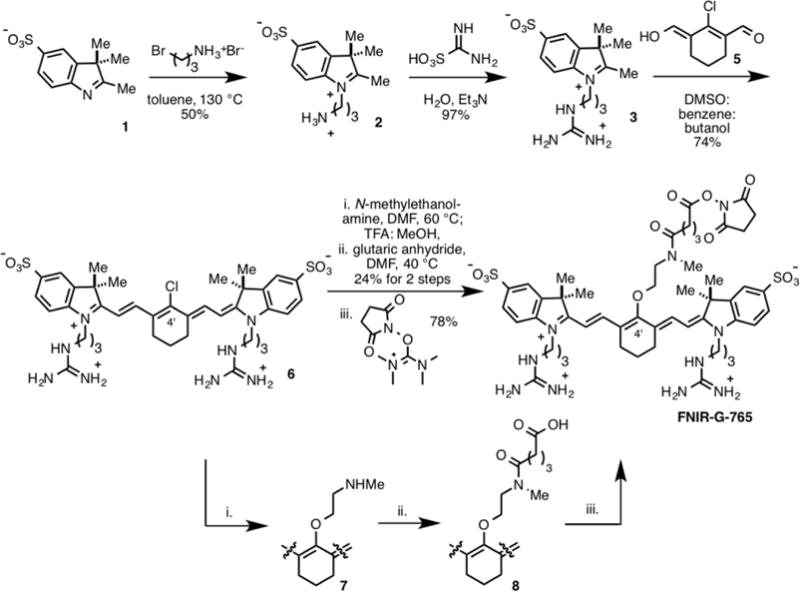
Synthesis of FNIR-G-765
FNIR-G-765 exhibits a slight bathochromic shift in its absorption and emission maxima compared to FNIR-Z-759 (Table 1). Measurement of the molar absorption coefficients and quantum yields reveals that FNIR-Z-759 is approximately 2-fold brighter than FNIR-G-765 in both aqueous and organic solvent. Spectral characteristics for both fluorophores are similar (Fig. 1) and characteristic of C4′-O-linked heptamethine cyanines.8,9 These results are in line with observations from our laboratory and elsewhere that modification of the indolenine substituents has, at most, minimal impact on photophysical properties.18
Table 1.
Optical properties of FNIR-Z-759, and FNIR-G-765.
| 50 mM PBS (pH 7.2) | λabs(nm) | λem(mn) | ε (M−1 cm−1) | Φf | Brightnessa | Relative Brightnessb |
|---|---|---|---|---|---|---|
| FNIR-Z-759 | 759 | 778 | 191835 | 0.079 | 15155 | 9.7 |
| FNIR-G-765 | 765 | 787 | 149623 | 0.042 | 6284 | 4.0 |
| MeOH | λabs(nm) | λem(nm) | ε (M−1 cm−1) | Φf | Brightnessa | Relative Brightnessb |
| FNIR-Z-759 | 763 | 786 | 229000 | 0.32 | 73280 | 4.6 |
| FNIR-G-765 | 766 | 788 | 181487 | 0.22 | 39927 | 2.5 |
Brightness is defined as ε × Φf.
Relative to the brightness of ICG.
Figure 1. Schematic representation of FNIR-Z-759 and FNIR-G-765 and conjugates to panitumumab. Absorbance and emission curves for 2 μM FNIR-G-765 (A) and FNIR-Z-759 (B) in 50 mM PBS (pH 7.2).
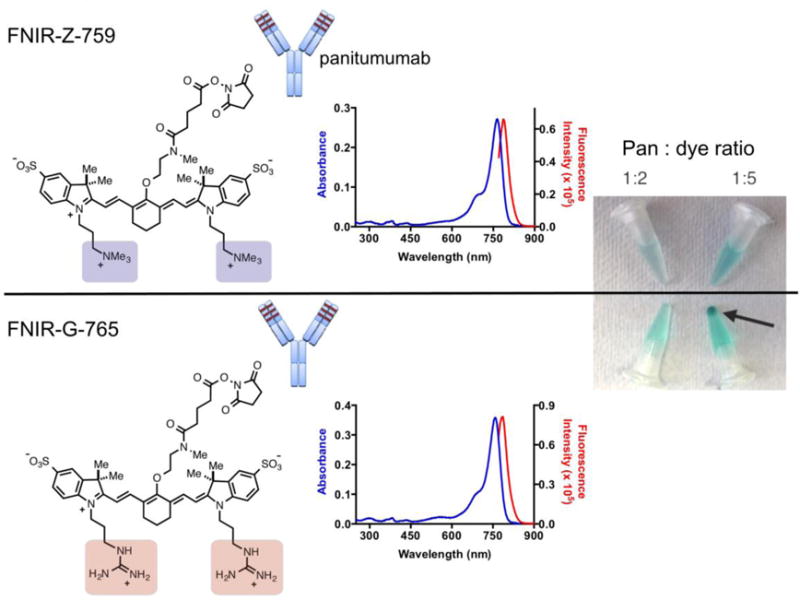
For emission, dyes were excited at their respective absorption maxima. FNIR-Z-759 and FNIR-G-765 were conjugated to pan with an antibody-to-dye ratio of 1:2 or 1:5. Conjugates at 1 day after the conjugation reaction. Pan-FNIR-G-765 (1:5) resulted in aggregation (arrow indicates the aggregate).
FNIR-Z-759 and FNIR-G-765 were conjugated to pan at a ratio of 2:1 or 5:1 dye-to-antibody (Fig. 1). Conjugation at ratio of 5:1 FNIR-G-765 dye-to-antibody failed due to aggregation (Fig. 1). The maximum ratio of conjugation to pan with FNIR-G-765 is around 3.2. By adding 1% SDS to dye-conjugated antibodies, the following dequenching capacities were observed: 2.90- and 4.22-fold for pan-FNIR-Z-759 (1:2) and pan-FNIR-G-765 (1:2), respectively (Fig. S1B and C). The supernatant of the aggregated conjugation (5:1) and 2:1 conjugations were evaluated with SDS-PAGE (Fig. S1D and E). As observed, the fractions of covalently bound dyes to pan were 83.4, 87.1, 70.4, and 71.6% for pan-FNIR-Z-759 (1:2), pan-FNIR-G-765 (1:2), pan-FNIR-Z-759 (1:5), and supernatant of pan-FNIR-G-765 (1:5), respectively (Fig. S1D). The fluorescence intensity of the band was higher in pan-FNIR-G-765 (1:2) than in pan-FNIR-Z-759 (1:2). By contrast, the quantum yields of pan-FNIR-Z-759 (1:2) and pan-FNIR-G-765 (1:2) in pH 7.2 buffer were measured to be 0.098 and 0.067, respectively. The absorbance and emission spectra indicated Förster resonance energy transfer (FLET)-based quenching of the conjugates. The relative absorption and emission intensities for the mAb-dye conjugates of FNIR-Z-759 and FNIR-G-765 are in agreement with the differences in molar absorptivity and quantum yield measured for the free dyes (Fig. S2 vs. Table 1). The fluorescence emission of the 1:5 conjugates is approximately 1.5-fold less intense than the corresponding 1:2 conjugates in both cases, likely owing to quenching at the higher fluorophore loading. Collectively, these data suggest that FNIR-Z-759 has superior conjugation ability compared to FNIR-G-765, since conjugation of pan-FNIR-G-765 (1:5) failed due to aggregation.
In vitro characterization and observation of FNIR-Z-759 and FNIR-G-765 conjugates
To evaluate the binding specificity and fluorescence intensity of dye alone, or dye-mAb conjugates, flow cytometry was performed using MDA-MB-468 cells. With the same concentration of each dye, or dye-mAb conjugate, and incubation time, similar binding was observed with FNIR-Z-759 and FNIR-G-765 (Fig. 2A). The binding of both conjugates to MDA-MB-468 was completely blocked by the addition of excess mAb, suggesting specific binding (Fig. 2A). Incubation of free dye alone indicates that FNIR-G-765 binds more non-specifically than FNIR-Z-759. Serial fluorescence microscopy of MDA-MB-468 and 3T3-RFP cells was performed after incubation for 1 hour at 4 °C (on ice) with each conjugate (Fig. 2B). All conjugates demonstrated cell surface labeling of EGFR-positive MDA-MB-468 cells. 3T3-RFP (EGFR-negative) cells showed no detectable fluorescence with the antibody-dye conjugates, indicating that fluorescence was dependent on antibody-receptor interaction (Fig. 2B). After replacement of the medium and a further 6-hour incubation, each conjugate was internalized into the cell. Non-specific binding interactions with FNIR-Z-759 or FNIR-G-765 alone were not seen. Collectively, these results suggest that both FNIR-Z-759 and FNIR-G-765 conjugates are highly specific for target-expressing cells and have similar fluorescence properties in cell culture.
Figure 2. In vitro characterization and observation of FNIR-Z-759 and FNIR-G-765 conjugates in cell culture.
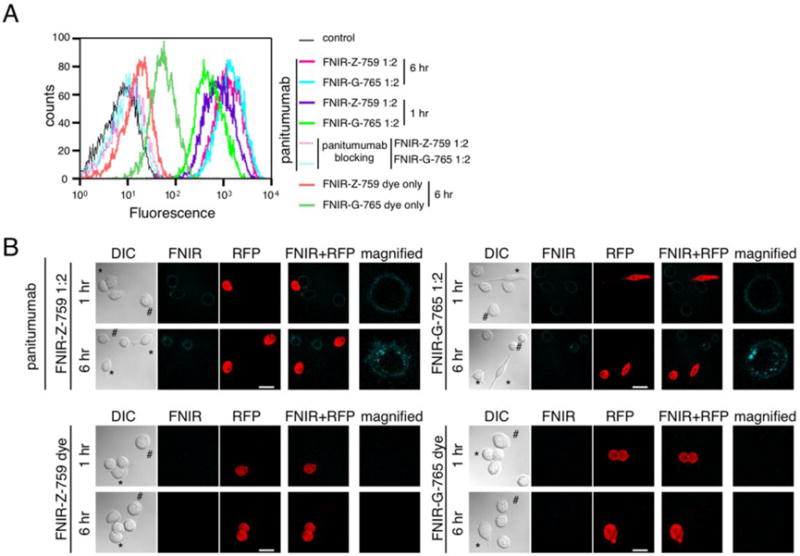
(A) Fluorescence of EGFR-expressing MDA-MB-468 cells incubated with each free dye or conjugate, evaluated by flow cytometry. (B) Microscopic observation of MDA-MB-468 cells incubated on ice for 1 h with each free dye (second panel) or conjugate (first panel). After 1 h incubation on ice, the media with conjugates was exchanged and cells were observed after 6 h incubation (lower row of each panel). Non-EGFR-expressing 3T3-RFP cells (*) were used as receptor-negative controls. Scale bar = 25 μm.
In vitro stability of antibody-dye conjugates
To assess the stability of the antibody-dye conjugates after endocytosis, cells were incubated with the conjugate for 1 hour and microscopy performed 3 days later (Fig. 3A). The fluorescence of both FNIR-Z-759 and FNIR-G-765 was preserved at day 3 (Fig. 3B). Non-specific binding of free FNIR-Z-759 or FNIR-G-765 was not observed. These results elucidated that both FNIR-Z-759 and FNIR-G-765 conjugates possess similar stability after cellular internalization.
Figure 3. Stability of fluorescence in vitro.
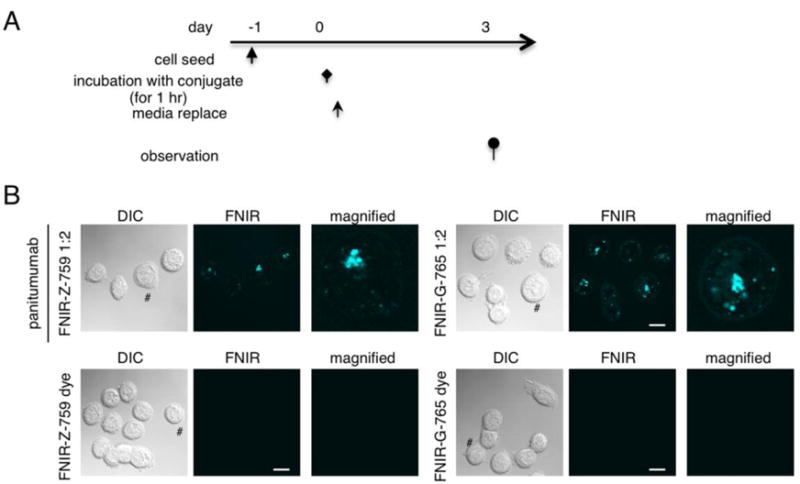
(A) Regimen for the evaluation of fluorescence stability in cell culture. (B) Microscopic observation of MDA-MB-468 cells along the regimen. Both FNIR-Z-759 and FNIR-G-765 were still fluorescent at the time of observation.
Rapid urinary excretion of free dye in vivo
To probe for differences in free dye excretion in vivo between FNIR-Z-759 and FNIR-G-765, in vivo imaging was performed following intravenous injection of each dye (Fig. 4A). Under a controlled dose, kidney excretion of FNIR-Z-759 was faster than FNIR-G-765 (Fig. 4A). Neither free FNIR-G-765 nor free FNIR-Z-759 dye accumulated in the tumor, while both the dye-mAb conjugates did (Fig. 4B). These data suggest that FNIR-Z-759 dye has more rapid renal clearance than FNIR-G-765.
Figure 4. In vivo serial fluorescence images of free dyes and accumulation of the conjugates in the tumor.
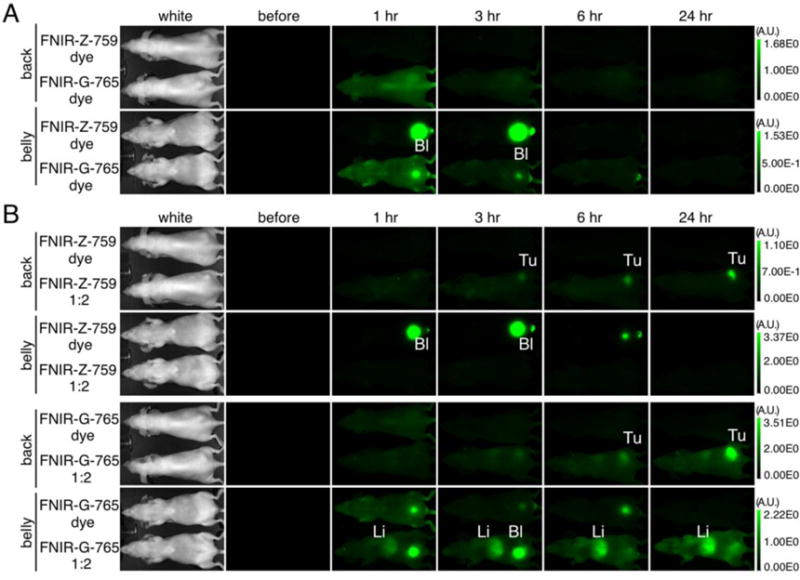
(A) In vivo serial fluorescence images of MDA-MB-468 tumor bearing mice (right dorsum) injected with each free dye. Both were excreted into the urine immediately after injection, with FNIR-Z-759 dye showing more rapid clearance (n = 5, each dye). Bl: bladder (B) Accumulation of each dye-mAb conjugate within the tumor. Free dye did not show meaningful tumor accumulation compared to each conjugate. Tu: tumor, Li: Liver. In all images, scale bars to the right indicate relative fluorescence intensity.
Comparison of the biodistribution and tumor accumulation of pan-FNIR-G-765 and pan-FNIR-Z-759 conjugates
To demonstrate whether FNIR-Z-759 and FNIR-G-765 have different pharmacokinetic profiles, in vivo imaging was performed. Pan-FNIR-Z-759 (1:2) showed both lower background and hepatic fluorescence than pan-FNIR-G-765 (1:2) (Fig. 5A). These in vivo imaging results were confirmed with ex vivo analysis at 6 hours post-injection (Fig. 5B). Ex vivo analysis at 6 h post-injection revealed that the FNIR-Z-759 conjugate accumulated within the tumor with a higher tumor-to-liver ratio than the FNIR-G-765 conjugate (Fig. 5C). Collectively, these data suggest that pan-FNIR-Z-759 has superior in vivo imaging characteristics, due to lower background fluorescence and lower liver uptake. The rapid renal clearance of FNIR-Z-759 conjugates could be exploited for targeting tumors in the abdomen, such as hepatic and bowel tumors.
Figure 5. In vivo serial fluorescence images of each conjugate and ex vivo analysis.
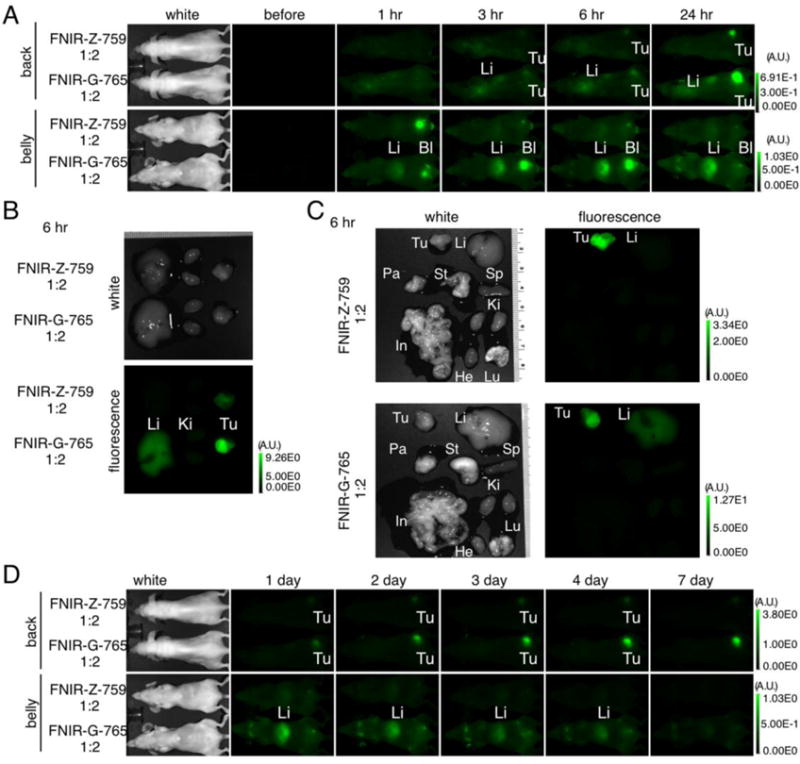
(A) In vivo serial fluorescence images (short term) of MDA-MB-468 tumor bearing mice (right dorsum) injected with each conjugate. All mice were imaged side-by-side under the same view field for the purpose of comparing each conjugate. (B) Ex vivo fluorescence images of the liver, kidney, and MDA-MB-468 tumor obtained at 6 h post-injection. Ki: kidney, Li: liver, Tu: tumor. (C) Ex vivo fluorescence images of various organs and MDA-MB-468 tumor obtained at 6 h post-injection. Pa: pancreas, St: stomach, Sp: spleen, In: intestine, Lu: lung, He: heart. (D) In vivo serial fluorescence images (long term) of MDA-MB-468 tumor bearing mice (right dorsum) injected with each conjugate. All mice were imaged side-by-side under the same view field for the purpose of comparing each conjugate. In all images, scale bars to the right indicate relative fluorescence intensity.
To compare the long-term pharmacokinetics of FNIR-Z-759 and FNIR-G-765 conjugates, in vivo imaging was conducted over 7 days. Conjugates with 1:2 mAb-dye ratios had similar tumor fluorescence, however, the FNIR-Z-759 conjugates had lower background fluorescence (Fig. 5D). These data suggest that FNIR-Z-759 conjugates are more advantageous than FNIR-G-765 conjugates for in vivo imaging.
Comparative evaluation of tumor-to-background ratio (TBR) and tumor-to-liver ratio (TLR)
To quantitatively evaluate fluorescence intensities in tumor-bearing mice for pan-FNIR-Z-759 (1:2) and pan-FNIR-G-765 (1:2), TBR and TLR were assessed (n = 5 mice per conjugate) (Fig. 6). TBR until 6 hours post-injection was similar between pan-FNIR-Z-759 (1:2) and pan-FNIR-G-765 (1:2). Pan-FNIR-Z-759 (1:2) showed 2-fold higher TLR than pan-FNIR-G-765 (1:2) at 6 hours, and this superiority persisted until 7 days. These data suggested that FNIR-Z-759 conjugates were catabolized in the kidney rather than in the liver, while FNIR-G-765 conjugates were mainly hepatically cleared. These data also suggest that FNIR-Z-759 has superior tumor imaging characteristics compared to FNIR-G-765 because, while both conjugates demonstrate comparable fluorescence in the tumor, only FNIR-Z-759 conjugates demonstrated lower background and hepatic fluorescence, leading to improve TLR.
Figure 6. Tumor-to-background ratio (TBR) and tumor-to-liver ratio (TLR).

Tumor-to-background ratio (TBR) and tumor-to-liver ratio (TLR) of each conjugate injected into the right dorsum of MDA-MB-468 tumor bearing mice (n = 5, each conjugate).
Discussion
We have compared the properties of two different mAb-cyanine dye conjugates, pan-FNIR-Z-759 and pan-FNIR-G-765, at antibody-to-dye ratios of 1:2 and 1:5. mAb conjugates of these two chemically similar fluorophores exhibited significant differences in both in conjugation chemistry and in vivo pharmacokinetics. Two NIR fluorophores with the same core structure and zwitterionic charge, yet with different cationic charged moieties, led to significant alterations in both conjugation chemistry and in vivo pharmacokinetics of dye-mAb conjugates. Therefore, distinct charged moieties can induce a profound effect on in vivo characteristics of NIR heptamethine cyanine dyes, which is exemplified here. The conjugation reaction at higher dye-mAb ratio of FNIR-G-765 formed aggregates, suggesting that conjugation reaction of FNIR-G-765 to mAbs is not optimal. FNIR-Z-759 (1:2) showed higher TLR than FNIR-G-765 (1:2) up to 7 days post-injection, indicating that catabolites of FNIR-Z-759 conjugates are quickly cleared by the kidneys in contrast to those of FNIR-G-765, which are partially cleared by the liver (Fig. 4). Taken together, these data suggest that FNIR-Z-759 conjugates have superior in vivo fluorescence imaging properties compared to FNIR-G-765 conjugates, largely imparted by the higher TLR. Moreover, from the conjugation chemistry perspective, FNIR-Z-759 conjugates are less prone to aggregation than FNIR-G-765 conjugates.
An ideal fluorescent probe has a high molar absorption coefficient, a high quantum yield, minimal non-specific binding to peptides or proteins, rapid excretion, and minimal changes in the in vivo biodistribution of targeting ligands after conjugation.19 Conventional mAbs show slower blood clearance and higher accumulation in the liver, thus dye-mAb conjugates tend to accumulate in the liver.20 In order to minimize the hepatic accumulation, catabolites of dyes should be designed to excrete into urine. Considering the case of FGS for abdominal lesions, low liver accumulation is desirable. FNIR-Z-759 conjugates have these ideal characteristics. These studies imply that appending quaternary ammonium salts to cyanine dyes, which are conjugated to antibodies increase the hydrophilicity of an antibody relative to guanidine containing cyanine dyes.
An alternative method of fluorescent cancer-specific imaging to dye-mAb conjugates is tumor-specific, genetically transfectable optical reporter using viral vectors that will show high specificity to visualize cancer21,22. In future, we might have to compare optimal dye-mAb conjugates with such vector system head-to-head. Additionally, in this study, we used flank tumor models for simply comparing two dye-mAb conjugates. In the future, to mimic more complicated situation in the clinical FGS, we should examine two dye-mAb conjugates with more complicated models with using tumor-specific optical genetic reporter vectors to illuminate tumors.23,24
While optical imaging generally visualizes only surface tissue, it allows high-resolution, dynamic, real-time imaging of targeted lesions without the need for ionizing radiation.25 Lowering the background with zwitterionic dyes improves TBR and, subsequently, the sensitivity of the scan. The de-quenching is occurred during the degradation pathway in tumor cells after binding to the target molecule, therefore, de-quenching could also contribute to improve TBR. Moreover, exclusive clearance through the kidney renders this zwitterionic NIR dye particularly suitable for abdominal surgery or bowel endoscopy. Thus, it is quite plausible that mAb-FNIR-Z-759 conjugates could be readily adapted for clinical use, further aided by the simple and inexpensive nature of optical imaging.
In fluorescent images shown in this study, FNIR-G-765 showed higher fluorescent signal than FNIR-Z-759 due to the filter setting that is favorable for FNIR-G-765. Therefore, fluorescent images could only show the contrast between organs and tumors, yet did not show the brightness of fluorescent probes.
Conclusions
In conclusion, a novel NIR fluorescent probe with a zwitterionic net charge, FNIR-Z-759, which can be easily synthesized in high yield, showed favorable characteristics both in conjugation chemistry and in in vivo imaging characteristics compared to an identical dye with different cationic moieties (FNIR-G-765). These studies show that minor alterations in the chemical structure of a fluorophore can have dramatic effects on both conjugation chemistry and in in vivo pharmacokinetics, leading to improved TBR and TLR. Ongoing efforts are focused on optimizing the structure of zwitterionic cyanine dyes, which are appropriate for in vivo imaging applications.
Supplementary Material
Acknowledgments
This research was supported by the Intramural Research Program of the National Institutes of Health, National Cancer Institute, Center for Cancer Research.
Footnotes
Conflicts of interest
None declared.
Author Contributions
K.S. mainly designed and conducted experiments, made the study concept, performed analysis and wrote the manuscript; A.P.G. performed chemical synthesis and characterized optical properties for free dyes and conjugates and wrote the manuscript; MSM and R.R.N. performed chemical synthesis; T.N. and Y.N. performed analysis; V.C. performed chemical synthesis; O.V. advised on the synthesis; R.E.S. advised on the synthesis and the manuscript; P.L.C. wrote the manuscript and supervised the project; M.J.S designed experiments and wrote the manuscript; and H.K. planned the project, designed experiments, wrote the manuscript, and supervised the entire project.
Disclosure Statement
None declared
References
- 1.Weissleder R. Nat Biotechnol. 2001;19:316–317. doi: 10.1038/86684. [DOI] [PubMed] [Google Scholar]
- 2.Mondal SB, Gao S, Zhu N, Liang R, Gruev V, Achilefu S. Real-time Fluorescence Image-Guided Oncologic Surgery. 1st. Vol. 124. Elsevier Inc; 2014. [DOI] [PMC free article] [PubMed] [Google Scholar]
- 3.Rosenthal EL, Warram JM, de Boer E, Basilion JP, Biel MA, Bogyo M, Bouvet M, Brigman BE, Colson YL, DeMeester SR, Gurtner GC, Ishizawa T, Jacobs PM, Keereweer S, Liao JC, Nguyen QT, Olson JM, Paulsen KD, Rieves D, Sumer BD, Tweedle MF, Vahrmeijer AL, Weichert JP, Wilson BC, Zenn MR, Zinn KR, van Dam GM. J Nucl Med. 2016;57:144–150. doi: 10.2967/jnumed.115.158915. [DOI] [PMC free article] [PubMed] [Google Scholar]
- 4.Weissleder R, Pittet MJ. Nature. 2008;452:580–589. doi: 10.1038/nature06917. [DOI] [PMC free article] [PubMed] [Google Scholar]
- 5.Frangioni JV. Curr Opin Chem Biol. 2003;7:626–634. doi: 10.1016/j.cbpa.2003.08.007. [DOI] [PubMed] [Google Scholar]
- 6.Chi C, Du Y, Ye J, Kou D, Qiu J, Wang J, Tian J. Theranostics. 2014;4:1072–1084. doi: 10.7150/thno.9899. [DOI] [PMC free article] [PubMed] [Google Scholar]
- 7.Kaur S, Venktaraman G, Jain M, Senapati S, Garg PK, Batra SK. Cancer Lett. 2012;315:97–111. doi: 10.1016/j.canlet.2011.10.017. [DOI] [PMC free article] [PubMed] [Google Scholar]
- 8.Nani RR, Shaum JB, Gorka AP, Schnermann MJ. Org Lett. 2015;17:302–305. doi: 10.1021/ol503398f. [DOI] [PMC free article] [PubMed] [Google Scholar]
- 9.Sato K, Nagaya T, Nakamura Y, Harada T, Nani RR, Shaum JB, Gorka AP, Kim I, Paik CH, Choyke PL, Schnermann MJ, Kobayashi H. Mol Pharm. 2015;12:3303–3311. doi: 10.1021/acs.molpharmaceut.5b00472. [DOI] [PMC free article] [PubMed] [Google Scholar]
- 10.Choi HS, Gibbs SL, Lee JH, Kim SH, Ashitate Y, Liu F, Hyun H, Park G, Xie Y, Bae S, Henary M, Frangioni JV. Nat Biotechnol. 2013;31:148–53. doi: 10.1038/nbt.2468. [DOI] [PMC free article] [PubMed] [Google Scholar]
- 11.Sato K, Gorka AP, Nagaya T, Michie MS, Nani RR, Nakamura Y, Coble VL, Vasalatiy OV, Swenson RE, Choyke PL, Schnermann MJ, Kobayashi H. Bioconjug Chem. 2015 doi: 10.1021/acs.bioconjchem.5b00492. acs.bioconjchem.5b00492. [DOI] [PMC free article] [PubMed] [Google Scholar]
- 12.Choi HS, Nasr K, Alyabyev S, Feith D, Lee JH, Kim SH, Ashitate Y, Hyun H, Patonay G, Strekowski L, Henary M, Frangioni JV. Angew Chemie – Int Ed. 2011;50:6258–6263. doi: 10.1002/anie.201102459. [DOI] [PMC free article] [PubMed] [Google Scholar]
- 13.Gorka AP, Nani RR, Zhu J, Mackem S, Schnermann MJ. J Am Chem Soc. 2014;136:14153–9. doi: 10.1021/ja5065203. [DOI] [PMC free article] [PubMed] [Google Scholar]
- 14.Sato K, Nagaya T, Mitsunaga M, Choyke PL, Kobayashi H. Cancer Lett. 2015;365:112–121. doi: 10.1016/j.canlet.2015.05.018. [DOI] [PMC free article] [PubMed] [Google Scholar]
- 15.Sato K, Watanabe R, Hanaoka H, Harada T, Nakajima T, Kim I, Paik CH, Choyke PL, Kobayashi H. Mol Oncol. 2014;8:620–632. doi: 10.1016/j.molonc.2014.01.006. [DOI] [PMC free article] [PubMed] [Google Scholar]
- 16.Toutchkine A, Nguyen DV, Hahn KM. Bioconjug Chem. 2007;18:1344–8. doi: 10.1021/bc060376n. [DOI] [PMC free article] [PubMed] [Google Scholar]
- 17.Mishra A, Behera RK, Behera PK, Mishra BK, Behera GB. Chem Rev. 2000;100:1973–2011. doi: 10.1021/cr990402t. [DOI] [PubMed] [Google Scholar]
- 18.Gorka AP, Nani RR, Schnermann MJ. Org Biomol Chem. 2015;13:7584–7598. doi: 10.1039/c5ob00788g. [DOI] [PMC free article] [PubMed] [Google Scholar]
- 19.Kobayashi H, Longmire MR, Ogawa M, Choyke PL. Chem Soc Rev. 2011;40:4626–4648. doi: 10.1039/c1cs15077d. [DOI] [PMC free article] [PubMed] [Google Scholar]
- 20.Cohen R, Stammes Ma, de Roos IH, Stigter-van Walsum M, Visser GW, van Dongen GA. EJNMMI Res. 2011;1:31. doi: 10.1186/2191-219X-1-31. [DOI] [PMC free article] [PubMed] [Google Scholar]
Associated Data
This section collects any data citations, data availability statements, or supplementary materials included in this article.


