Abstract
In order to provide the most effective therapy for cancer, it is important to be able to diagnose whether a patient’s cancer will respond to a proposed treatment. Methylation profiling could contain information from which such predictions could be made. Currently, hypothesis testing is used to determine whether possible biomarkers for cancer progression produce statistically significant results. However, this approach requires the identification of individual genes, or sets of genes, as candidate hypotheses, and with the increasing size of modern microarrays, this task is becoming progressively harder. Exhaustive testing of small sets of genes is computationally infeasible, and so hypothesis generation depends either on the use of established biological knowledge or on heuristic methods. As an alternative machine learning, methods can be used to identify groups of genes that are acting together within sets of cancer data and associate their behaviors with cancer progression. These methods have the advantage of being multivariate and unbiased but unfortunately also rapidly become computationally infeasible as the number of gene probes and datasets increases. To address this problem, we have investigated a way of utilizing prior knowledge to segment microarray datasets in such a way that machine learning can be used to identify candidate sets of genes for hypothesis testing. A methylation dataset is divided into subsets, where each subset contains only the probes that relate to a known gene pathway. Each of these pathway subsets is used independently for classification. The classification method is AdaBoost with decision trees as weak classifiers. Since each pathway subset contains a relatively small number of gene probes, it is possible to train and test its classification accuracy quickly and determine whether it has valuable diagnostic information. Finally, genes from successful pathway subsets can be combined to create a classifier of high accuracy.
Keywords: machine learning, methylation profiling, cancer progression
Introduction
Recent worldwide cancer statistics, provided by GLOBOCAN 2012,1 have shown that ~14.1 million people suffered from cancer in 2012. The number is expected to rise to 24 million in 20 years time.2 Some advances have been made in the identification of genes related to the cancer etiology. All these have led to the expansion of our understanding of the genetic mechanisms that are driving cancer progression. However, our knowledge is still very limited, and further research is needed in this field.
Recent improvements in molecular biology technology have allowed the measurement and profiling of DNA methylation sites in large genomic samples.3 DNA methylation is an epigenetic mark that can provide information about environmental exposures.4 Methylation occurs when a methyl group is added to a cytosine residue to convert it to 5-methylcytosine. It occurs at CpG sites, which are places on the linear sequence of the bases of the DNA that have a cytosine and guanine separated by only one phosphate. Methylation of sites that are in the promoters of genes can affect their expression and lead to their silencing, a feature found in a number of human cancers.5 Methylation is believed to be closely related to gene expression,6,7 and DNA methylation sites have been increasingly found to be related to the processes of cancer.8,9 Methylation biomarkers have also been associated with the response of a patient to particular treatment of cancer as shown in some clinical studies.10,11
Machine learning has been widely used on biological data with increasing success.12–15 Methylation data, however, have only recently been analyzed using machine learning.16–18 Due to the high dimensionality of the methylation dataset, direct use of many machine learning methods is computationally intractable. The computational complexity of principal components analysis (PCA) – the simplest and most fundamental method in multivariate data analysis – is at least n × n × D. Current methylation data may have in excess of 400,000 probes (n) and perhaps 100 patient cases (D). The very large number of probes means that even PCA cannot be computed in practice. On our data sets attempts to compute PCA features directly took several hours without yielding any result. Moreover, when the dimensionality of a dataset grows, there is an increasing difficulty in proving any result statistically significant, due to the sparsity of the meaningful data in the dataset in question. To overcome this, we put forward a new feature selection approach in which methylation data are combined with prior knowledge obtained from biological pathways. Prior knowledge has been used before for the classification of cancer phenotypes from microarray gene expression data,19,20 pathway information,21–26 or GO terms.27–30 Little has been done in terms of predicting response to cancer treatment using methylation data and prior knowledge. For our experiments, we used pathway information from the ConsensusPath database (2015 release).31–34 The ConsensusPath database integrates different types of information, including protein interactions, genetic interactions signaling, metabolism, gene regulation, and drug target interactions in humans. These are taken from a number of databases, including Reactome, KEGG, HumanCyc, PID, and BioCarta. Pathways contain between 100 and 3000 genes in total and, therefore, can be analyzed using multivariate machine learning methods. It is feasible to analyze all the pathways in the consensus database in a short time. In our experiments, it took around 45 minutes to run the algorithm on all pathways on a single computer. The intuition behind our approach is that pathways represent sets of genes that are known to interact with each other in some way. We hypothesize that there is a better chance of finding a set of genes that may act together as a biomarker by searching pathway sets rather than searching random samples of genes. We do not expect to identify all the genes that could act as biomarkers for a particular disease. However, whenever we find a pathway set of genes with good predictive results we can analyze each gene individually to find out what contribution it makes as a biomarker and consequently build up a larger set of predictor genes. Eventually, the results may contribute to a better understanding of the mechanisms of cancer.
Materials and Methods
Overview
Our method is illustrated in Figure 1. Complete methylation datasets are divided into subsets each containing exactly those genes that belong to a known pathway. Using the information in the ConsensusPath database,31–34 it creates 3213 subsets mostly between 100 and 3000 genes each. Individual genes may appear in more than one pathway, and hence in more than one subset. As the number of genes on the pathways is relatively small, machine learning methods can be applied to them quickly using modest computing resources. Each subset is used individually to build a classifier for predicting response to treatment. We chose to use AdaBoost, with decision trees as weak classifiers, since boosting techniques can reduce the bias in supervised learning by being less susceptible to overfitting compared with other learning algorithms.35 The prediction accuracies of the resulting classifiers were tested for significance using z-scores and P values. We used randomly drawn sets of genes for these statistical tests. Our null hypothesis is that the genes belonging to the particular pathway under test are the better predictors of progression than a randomly selected set of genes. Finally, the most successful pathway sets were used to determine a single set of genes that can accurately classify the dataset. The genes with the highest Gini importance from each pathway set were selected. These genes were then added to a combined set. Several different thresholds for selecting the genes were investigated to find the combined set with best overall prediction accuracy.
Figure 1.
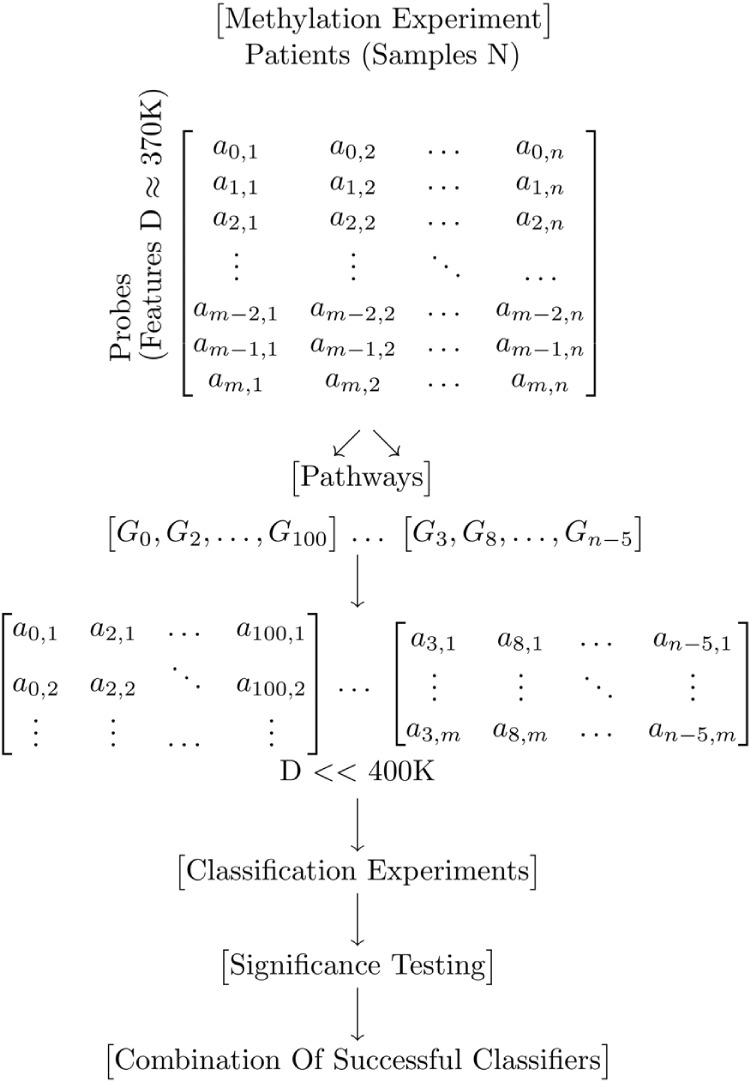
Pathway algorithm: in the first step the original methylation dataset is split into several smaller subsets in which all the genes of one subset belong to one pathway in the ConsensusPath database. AdaBoost is applied on the subsets to build classifiers for disease progression. The classification accuracy of each subset was calculated using stratified cross-validation to account for unbalanced classes. Randomly picked subsets of the probes in the original dataset were created so that the pathway sets with the highest accuracies could be tested for significance using z-scores and P values.
Notes: 1http://globocan.iarc.fr/Default.aspx.6https://www.etriks.org/.
The analysis was done using the Python programming language. The sklearn package was used for the machine learning algorithms. The rpy2 package was used for calling R code to map the methylation probes to pathways.
Datasets
Two datasets were used in this study. The first was the Cancer Genome Atlas (TCGA) methylation brain lower grade glioma (LGG) dataset (http://cancergenome.nih.gov/). In this, there are 370,203 probes and in total 531 samples. However, for many of these samples, there is no information about the therapy outcome. In addition, some of the labels were not specific as to whether the patient has responded to treatment or not. Therefore, we chose to restrict our research to samples with the labels: complete remission/response and progressive disease. We used 82 samples, 57 of which were not responsive to treatment (progressive disease), while 25 were cases of complete remission. The samples that did not have any information as to the progression of the disease were excluded from the analysis.
The second dataset was an as yet unpublished study of chronic myelogenous leukemia (CML) with 429,231 probes and 91 samples. The data supplied for this research was fully anonymized. In this set, 60 samples were responsive to CML treatment, while 31 samples were not. Other datasets from TCGA were unsuitable for analysis because of the problem of imbalance. The number of cases of non-responding patients was very small (only one or two samples), resulting in the classifier overfitting.
In this study, the relation between the different probe locations relative to each gene (island, shore, and shelf) was not investigated. Our objective was simply to identify sets of genes that can influence response. In the methylation data, there are many probes related to each individual gene. A mapping between genes and probes was provided with the CML data. Two different methods to find an aggregate response for each gene were investigated.
The corresponding CpG with the highest methylation value was chosen.
All the probes associated with the gene were used in the classifier.
Both methods identified the same sets of genes since probes that match to the same gene are correlated36 and decision trees use correlated features interchangeably. If the tree becomes repetitive, it gets pruned,37 so using all the probes can be much faster.
Theoretical Background
AdaBoost with decision trees as the weak classifiers
AdaBoost was used to make the classification of progression or nonprogression in our experiments. It is an ensemble method that combines a number of weak classifiers to provide accurate results. Each weak classifier can be thought of as an individual hypothesis about the data. New data are classified by aggregating the weak classifiers’ predictions. For ensemble methods to work as accurately as possible, the weak classifiers need to be diverse. Diversity means that they make different errors in the classification process.38 Normally, on successive training runs, the selection of the training data is adjusted to accommodate the most difficult cases.39 The classifiers are then combined using a method of aggregation such as voting to get a final strong classifier. The AdaBoost-SAMME algorithm40 was used. It is a multiclass version of the original algorithm, and decision trees were used as the weak classifiers. A decision tree takes input tuples of the form: (X, Y) = (x1, x2, …, xk, Y) and creates rules based on (x1, x2, …, xk), so that the target Y can be classified correctly. The tree is constructed by splitting the inputs recursively (recursive partitioning), and it ends when the subset at a node has items with the same label or when the accuracy, measured by the Gini impurity, can no longer be improved. The Gini impurity measures how often a random data point can be classified incorrectly if it was assigned to a random class based on the distribution of class labels of the whole set.
The Classification And Regression Tree41 algorithm was used in the decision trees, since it works with both categorical and numerical target variables. It creates the tree with the features that give the biggest information gain at each node. Unlike other ensemble methods, AdaBoost does not have complicated parameter settings. The only thing that needs to be chosen is the classifier (in this case decision trees) and the number of boosting rounds. We used ensemble methods since the size of the pathway set is variable. With ensemble methods, the size of the dataset does not matter since a number of classifiers are created and a majority vote is taken on them. Even if the size of the data is not sufficient (which can lead to overfiting), the majority vote on the classifiers will average out their predictions.38 The sklearn implementation for AdaBoost42 was used in the experiments.
Logistic regression
Control experiments were carried out using logistic regression, in order to compare the performance of our new method with the current state of the art. Logistic regression is widely used in biomedical data analysis. It calculates the logit transformation of the probability of the presence of the characteristic of interest. This is the relationship between a binary categorical dependent variable and one or more independent variables (in this case continuous).
| (1) |
where P is the probability of presence of the characteristic of interest.
Stratified cross-validation
Cross-validation43 is a statistical method for calculating the accuracy of a model by assessing how well it generalizes over an independent dataset. It partitions the data into two groups, the training group and the validation group. The model is created using the training group and validated over the validation group. To reduce the variance, this process takes place in more than one round using different groups for training and validation. We have used stratified k-fold cross-validation, where the training and validation groups are selected so that the mean response values are approximately equal in all the folds. Since the classification is binary, each fold contains the same number of the two types of class labels.
z-score and P values
The z-score is a measurement of a sample’s relationship with a population mean. Using the standard normal distribution, it normalizes a group of data such that the mean is 0 and the standard deviation is 1. The z-score represents the distance between a sample’s raw score and the population’s mean in units of the standard deviation in the normalized distribution. The z-score is shown in equation 2, where µ is the mean and σ is the standard deviation.
| (2) |
The z-score is related to the P value. It is a measure of the probability that a sample does not belong to the population. Very high z-scores are associated with very small P values and are found in the tails of the normal distribution. Small P values indicate that it is very unlikely that the observed pattern belongs to that distribution (null hypothesis). To check the significance of the P value, a confidence interval must be chosen. The 95% confidence interval consists of all values less than 1.96 standard errors away from the sample value. The obtained P value must be less than 0.05. Similarly, the 99% confidence interval consists of all values less than 2.58 standard errors away from the sample value, and the P value should be less than 0.01.
In order to provide a baseline for significance testing, several random gene subsets were created. These were used to test the results obtained by our method against the null hypothesis that the same results could be obtained by a random selection of genes. The class distribution was the same in all random sets since the samples were left intact. The number of genes was different in every set, but each random sample was drawn following distribution of the number of genes in the pathway sets. This was to ensure a fair comparison.
Results
Initially, as a control experiment, the complete datasets for LGG and CML were analyzed using conventional machine learning methods without pathway segmentation. PCA44 was used for linear dimensionality reduction and manifold Isomap45 for nonlinear dimensionality reduction. It was not possible to obtain any results without using a dimensionality reduction method. The number of samples is far less than the number of features, and therefore, the covariance matrix will be singular and poorly estimated. Sample-by-sample affinity matrices, which contain similarity values for each sample pair, were used since gene-by-gene matrices were very large and even after several hours of computation did not yield any result. The affinity matrices were constructed using the covariances of the samples, and the dimensionality was equal to the number of samples. The results we obtained were not sufficiently accurate to make predictions as shown in Table 1, where the accuracy can be seen to be only slightly higher than the random (0.5) level. The receiver operating characteristic (ROC) curves are shown in Figure 2 for LGG and in Figure 3 for CML. The proximity of these two curves to the diagonal line, where the true positive results equal the true negative results, illustrates the lack of accuracy in these experiments. In the remainder of our experiments, the analysis was carried out on the raw data. PCA and Isomap were not used.
Table 1.
Accuracies obtained using the complete datasets with linear (PCA) and nonlinear (Isomap) forms of dimensionality reduction and AdaBoost.
| DATASET | ACCURACY | VARIANCE |
|---|---|---|
| CML with PCA | 0.6044 | 0.0222 |
| CML with Isomap | 0.5155 | 0.0159 |
| LGG with PCA | 0.7083 | 0.0177 |
| LGG with Isomap | 0.6347 | 0.0289 |
Note: The results are not significant.
Figure 2.
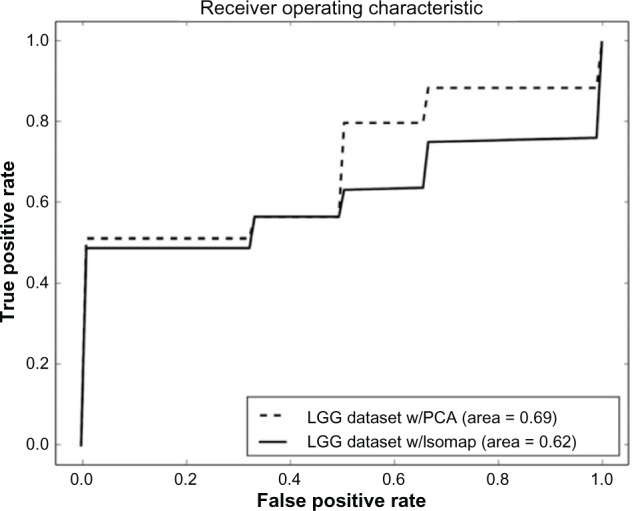
ROC curve for the prediction of disease progression using the complete LGG dataset.
Figure 3.
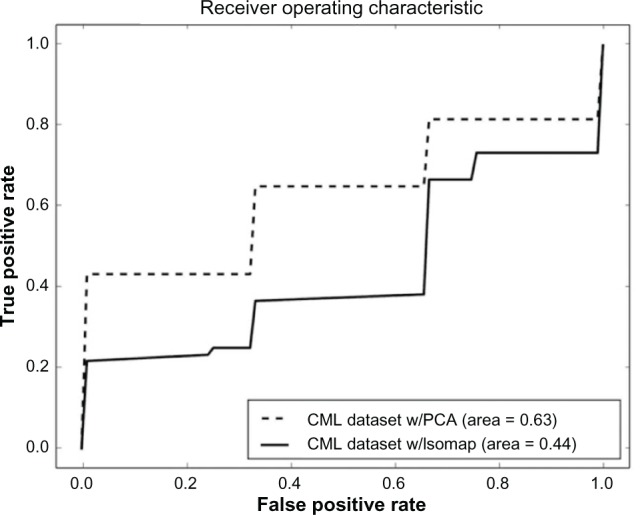
ROC curve for the prediction of disease progression using the complete CML dataset.
Analysis of the LGG dataset
Classification for LGG treatment response was performed on all pathway sets with a number of genes greater than 100. Gene sets with less than 100 genes were discarded because of observed overfitting caused by insufficient information in the dataset for generalization. Four pathway sets that gave accuracy between 0.88 and 0.90 were discovered. The accuracy, shown in Table 2, was estimated using 10-fold stratified cross-validation. The P values show that a null hypothesis that the results could be obtained by a random selection of genes can be rejected, and we can conclude that the results are significant within the 99% confidence interval. Figure 4 shows the ROC curves for the four most successful pathway sets. Dimensionality reduction on those pathways worsens the results as shown in Supplementary File 1.
Table 2.
Best performing pathway sets for LGG and their accuracies and variances using 10-K stratified cross-validation.
| PATHWAY | ACCURACY | VARIANCE | z-SCORE | P-VALUE |
|---|---|---|---|---|
| A | 0.904 | 0.0191 | 3.9713 | 0.000036 |
| B | 0.891 | 0.0163 | 3.68249905 | 0.000116 |
| C | 0.890 | 0.0070 | 3.65034371 | 0.000131 |
| D | 0.879 | 0.0056 | 3.39268741 | 0.000346 |
Abbreviations: Pathway A, pantothenate and CoA biosynthesis; pathway B, transcription factor creb; pathway C, pyrimidine metabolism; pathway D, IL2.
Figure 4.
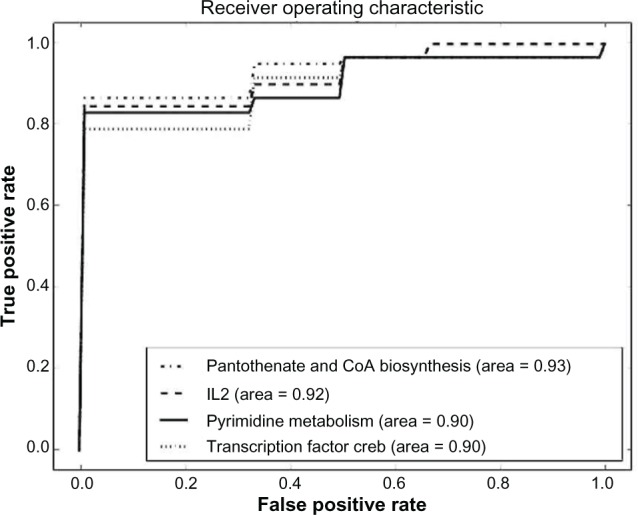
ROC curves for the four pathway sets with the highest accuracy on the LGG dataset.
For comparison, Figures 5 and 6 show the ROC curves for two other pathway sets that do not perform so well when compared with the successful pantothenate and CoA biosynthesis set. The accuracies for the same pathway sets found when logistic regression is applied instead of AdaBoost are given in Table 3. These results are not significant. The AdaBoost method performs better because the decision trees split the dataset several times instead of just once and because boosting methods tend to remove bias from the results.
Figure 5.
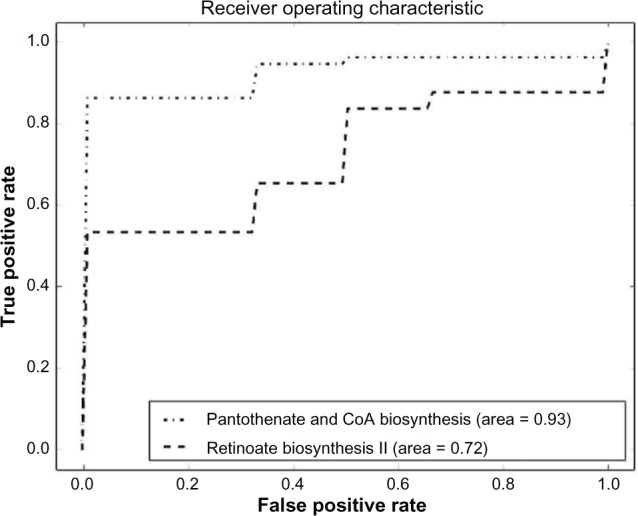
Comparison between pantothenate and CoA biosynthesis and retinoate biosynthesis II pathway sets.
Figure 6.
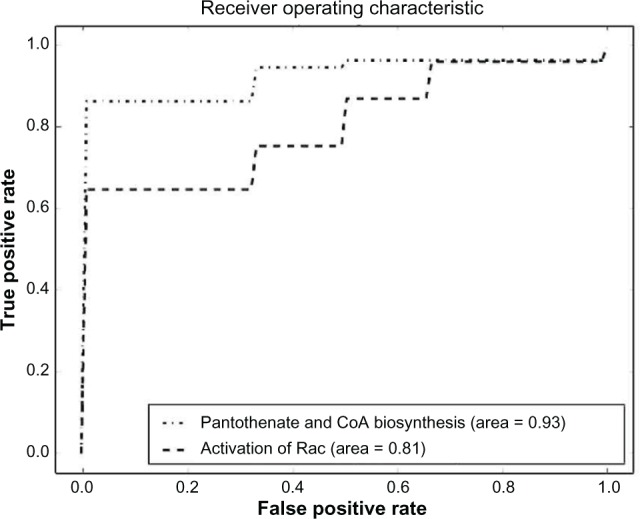
Comparison between pantothenate and CoA biosynthesis and activation of Rac pathway sets.
Table 3.
Accuracy results for logistic regression on the best LGG pathway sets.
| PATHWAY | LOGISTIC REGRESSION |
|---|---|
| A | 0.708 |
| B | 0.697 |
| C | 0.650 |
| D | 0.674 |
Note: The pathways are the same as in Table 2.
Each gene was removed, in turn, from the best four pathway sets to determine its contribution to the accuracy. After removal, the classification accuracy was recalculated using stratified cross-validation as described previously. Some genes have more effect than others and removing them affects the accuracy negatively. This is shown in Supplementary File 2.
Graphs of the highest scoring pathway compared against random gene sets are included in Supplementary File 3. For validation purposes, 980 random gene sets were generated, having comparable sizes to the sets corresponding to the pathway subsets and allowing multiple runs of the significance tests. In 10 different runs, the accuracies of these random sets vary between 0.4 and 0.71, and the variance ranges between 0.018 and 0.0287. The accuracy range can be seen to be far lower than that of the best pathway sets (Table 2) and the variance is either equal to or much greater than the variance displayed by the pathway sets. These results show that the genes belonging to the pathway sets used in our method do play an important role in classifying cancer.
Gene set combination, LGG data
A set of genes with better discriminative properties was found by combining several successful pathway sets. This was done by observing closely how AdaBoost builds the decision classifiers. The features (genes) that were important when building the decision trees were retained, and the remainder was filtered out. An important feature for a decision tree is one for which the weights are higher. This indicates how well the nodes of the decision tree are partitioned by that feature. The importance of a feature is related to its height in the tree with the root being the most important. This principle is also known as the Gini importance.
Several classifiers with different combinations of threshold values were constructed, and the combination with the highest accuracy score was picked. The algorithm is shown in Figure 7. AccuracyThreshold had values between 0.7 and 0.9 and GiniImportanceThreshold had different values ranging from 0.003 to 0.5. Table 4 shows the resulting set of genes that can classify progression with an accuracy of 99%. Genes that have been previously associated with gliomas appear in bold. We also obtained the P value of this set, which is 0.00140625, showing that it is significant in the 99% confidence interval.
Figure 7.
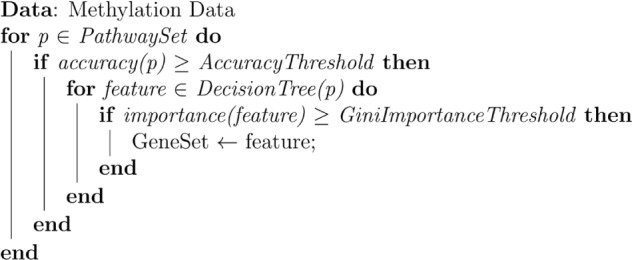
The gene selection algorithm based on accuracy thresholds and how important each feature is when constructing the decision tree.
Table 4.
The most discriminant genes for the LGG dataset.
| SYMBOL | FUNCTIONAL ANNOTATION |
|---|---|
| DDOST | Dolichyl-Diphosphooligosaccharide |
| PRKAR2B | protein kinase, cAMP-dependent |
| PDPK1 | 3-phosphoinositide dependent protein kinase 1 |
| PIK3CD | phosphatidylinositol-4,5-bisphosphate 3-kinase |
| CDC16 | cell division cycle 16 |
| OAT | ornithine aminotransferase |
| KRAS | Kirsten Rat Sarcoma Viral Oncogene Homolog |
| NTRK1 | neurotrophic tyrosine kinase, receptor, type 1 |
| NF1 | neurofibromin 1 |
| BTRC | beta-transducin repeat containing E3 ubiquitin protein ligase |
| PIK3R3 | phosphoinositide-3-kinase, regulatory subunit 3 (gamma) |
| KCNMB4 | potassium large conductance calcium-activated channel, Mβ4 |
| IFNGR1 | interferon gamma receptor 1 |
| SC5DL | sterol-C5-desaturase |
| ATF2 | activating transcription factor 2 |
| GABRB2 | gamma-aminobutyric acid (GABA) A receptor, beta 2 |
| STX1A | syntaxin 1 A (brain) |
| GPX4 | glutathione peroxidase 4 |
| GAB2 | GRB2-associated binding protein 2 |
| EIF2AK1 | eukaryotic translation initiation factor 2-alpha kinase 1 |
| SOS1 | son of sevenless homolog 1 (Drosophila) |
| EXOC6 | exocyst complex component 6 |
| IRS1 | insulin receptor substrate 1 |
| ANK1 | ankyrin 1, erythrocytic 2 |
| IL6R | interleukin 6 receptor |
| NRCAM | neuronal cell adhesion molecule |
| SLC22A2 | solute carrier family 22 (organic cation transporter), member 2 |
| PPCDC | phosphopantothenoylcysteine decarboxylase |
| UPB1 | ureidopropionase, beta |
| PTK2B | protein tyrosine kinase 2 beta |
| ITGA2 | integrin, alpha 2 (CD49B, alpha 2 subunit of VLA-2 receptor) |
| STAT3 | signal transducer and activator of transcription 3 |
| SLCO4A1 | solute carrier organic anion transporter family, member 4A1 |
| SLCO2A1 | solute carrier organic anion transporter family, member 2A1 |
Analysis of the CML dataset
The pathway sets with the highest scores for the CML dataset are shown in Table 5. The P values show that the result is significant in the 99% confidence interval. All the pathway sets were tested for their accuracy in predicting CML progression. There were two pathway sets that obtained an accuracy of 0.9888. These were the regulation of KIT signaling (Fig. 8) and signaling events mediated by stem cell factor receptor (c-Kit) pathways, which had an identical ROC curve. Dimensionality reduction applied to these both linear and nonlinear once again worsens the results as shown in Supplementary File 1. The ROC curves for these two pathways are plotted in Figure 8. Examples of other pathway sets that do not perform so well are shown in Figures 9–11.
Table 5.
Best performing pathway sets for CML and their accuracies and variances after 10-K stratified cross-validation.
| PATHWAY | ACCURACY | VARIANCE | z-SCORE | P-VALUE |
|---|---|---|---|---|
| A | 0.9888 | 0.0011 | 6.44028444 | <0.00001 |
| B | 0.9888 | 0.0011 | 6.44028444 | <0.00001 |
| C | 0.8244 | 0.0176 | 2.11346295 | 0.0176 |
Abbreviations: Pathway A, regulation of KIT signaling; pathway B, signaling events mediated by stem cell factor receptor (c-Kit); pathway C, superpathway of D-myo-inositol(1,4,5)-trisphosphate metabolism.
Figure 8.
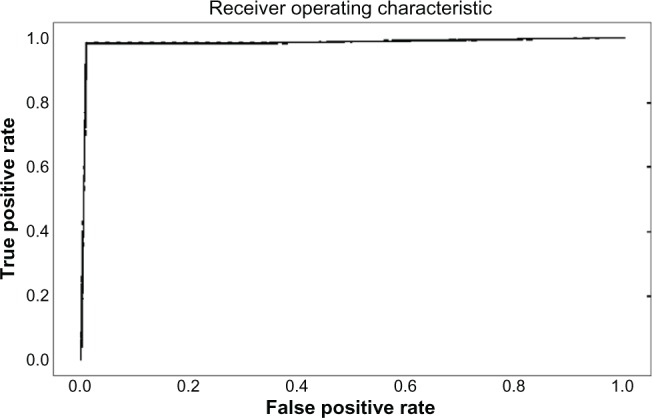
ROC curve for the regulation of KIT signaling pathway set.
Figure 9.
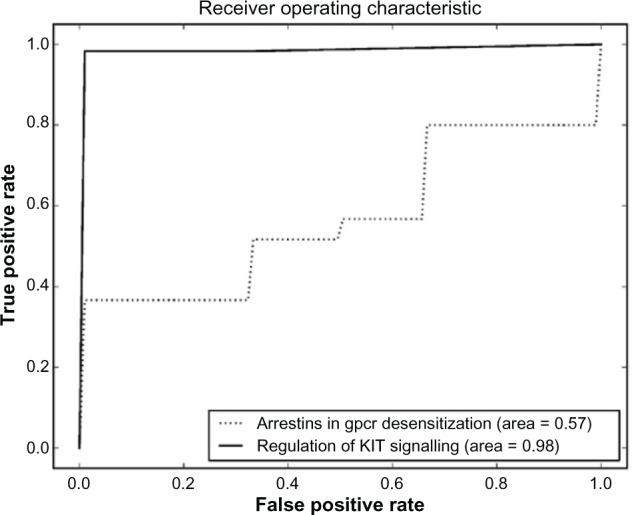
Comparison between regulation of KIT signaling and arrestins in gpcr desensitization pathway sets.
Figure 10.
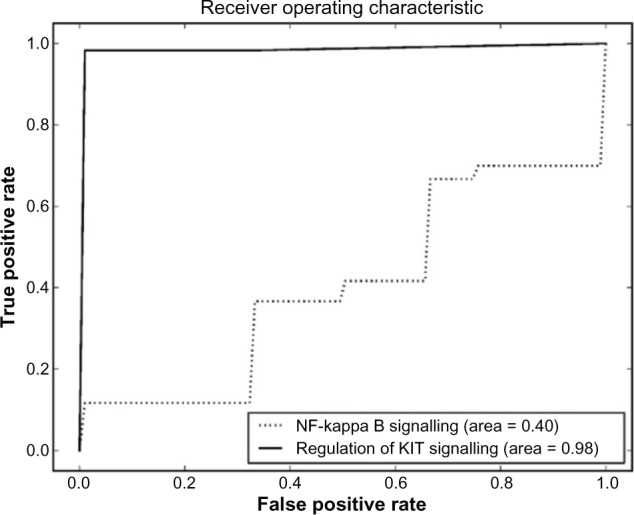
Comparison between regulation of KIT signaling and NF-kappa B signaling – Homo sapiens pathway sets.
Figure 11.
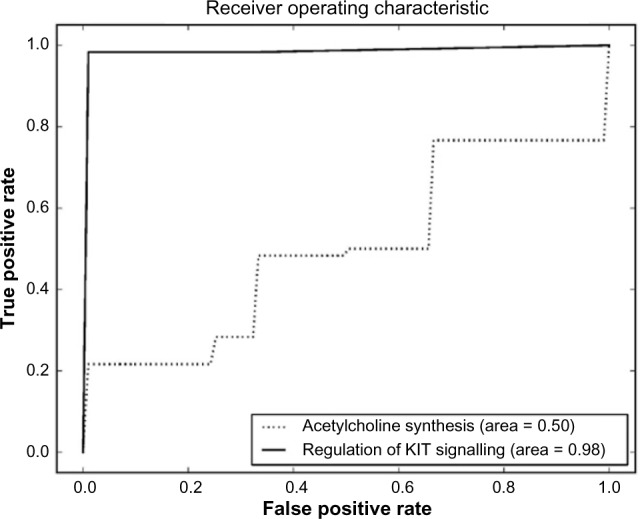
Comparison between regulation of KIT signaling and acetylcholine synthesis pathway sets.
A control experiment was carried out to compare the use of logistic regression with AdaBoost. Is this correct? The results for prediction accuracy are shown in Table 6. In all cases, logistic regression gave less accurate results. As described previously, individual genes were removed from the pathways to determine their effect on the accuracy. Some genes have more effect than others, and removing them affects the accuracy negatively. This is shown in Supplementary File 2.
Table 6.
Accuracy results for logistic regression applied to CML pathway sets.
| PATHWAY | LOGISTIC REGRESSION |
|---|---|
| A | 0.703 |
| B | 0.693 |
| C | 0.682 |
Note: The pathways are defined in Table 5.
Comparing the accuracy of all the random sets (shown in Supplementary File 3), after 10 different runs, we see that the accuracies vary between 0.4 and 0.7. Their variance is either equal to or much greater than the variance of the pathway sets. The variance of the two pathways is 0.0011, while for the random sets variance is between 0.0165 and 0.0260. The random pathways were used in order to calculate the z-score of the accuracy and the P values of the random sets compared to the two highest scoring pathways.
Gene SH2B3
Even though the purpose of this study was not to identify single genes, a single gene was found to have a significant effect. In the AdaBoost classifier models for the data, the probe that most of the modeling was based on was CpG cg00056489, which translates to gene SH2B3 or SH2B adaptor protein 3. Removing this gene only out of the pathway set reduced the classification accuracy to random (≈0.5) from the original 0.99 accuracy.
Gene set combination, CML data
Other genes in the whole dataset that have an important impact on the classification are shown in Table 7. They were found by the same method used in the LGG data analysis. These genes can classify response to treatment with an accuracy of 0.94.
Table 7.
The most discriminative genes for the CML data.
| GENE NAME | FUNCTIONAL ANNOTATION |
|---|---|
| INPP5A | Polyphosphate-5-phosphatase, 40kda |
| INPP5B | Inositol polyphosphate-5-phosphatase, 75kda |
| IMPAD1 | Inositol monophosphatase domain containing 1 |
| INPP1 | Inositol polyphosphate-1-phosphatase |
| INPP5J | Inositol polyphosphate-5-phosphatase j |
| ITPKB | Inositol 1,4,5-trisphosphate 3-kinase b |
| SH2B3 | Sh2b adaptor protein 3 |
| SYNJ2 | Synaptojanin 2 |
Discussion
Four pathway sets were found that can classify progression and response to treatment for brain glioma accurately. All of them have previously been associated with gliomas and brain cancer. Pantothenate and CoA biosynthesis is related to brain neurodegeneration and iron accumulation in the brain.46 Studies have shown that the ratio between iron and zinc affects the malignancy of the tumor.47 Interleukin 2 was first used in the treatment of glioma in 1986 as a part of immunotherapy treatments.48 Moreover, pyrimidine metabolism in human gliomas is increased by comparison to normal brain.49 The last pathway is related to the transcription factor creb. Transcription factor creb is shown to be overexpressed in gliomas,50 and it is related to their proliferation.51 In addition, a pathway set that had an accuracy of 0.85 is worth noting. This is the renal cell carcinoma pathway. It was shown that renal cell carcinoma is one of the most common sources of brain metastases.52 From the optimal set of genes that was found, response can be predicted very accurately (0.99). Some of the genes in the set have already been associated with gliomas.
For CML, we identified gene SH2B3 to be statistically related with the response to treatment. SH2B adapter protein 3 is a protein that in humans is encoded by the SH2B3 gene.53,54 Its role is to be involved in a range of signaling activities by growth factor and cytokine receptors. It is a member of the family of tyrosine kinase adapter proteins,1 the high-affinity cell surface receptors for many polypeptide growth factors, cytokines, and hormones,55 which are shown to be involved with the progression of many types of cancer. The possibility of manipulating receptor tyrosine kinase signaling in order to prevent cancer or enhance cancer therapy was explored previously.56 It is a key protein for the negative regulator of cytokine signaling and plays a critical role in hematopoiesis. Hematopoietic cells commonly related with leukemia.57,58 Moreover, SH2B3 has already been identified as a predisposition gene to acute lymphoblastic leukemia.59
From the set of genes that was found to predict response very accurately (0.94), inositol polyphosphate-5-phosphatase has already been associated with leukemia.60 In addition, it is associated with SH2 since it encodes a protein in that domain. The protein is related to hematopoietic cells, and its movement from the cytosol to the plasma membrane is mediated by tyrosine phosphorylation.61 Synaptojanin was also found in the set, which belongs to the inositol-polyphosphate 5-phosphatase family that has previously been associated with hairy cell leukemia, a chronic mature B-cell leukemia characterized by malignant B cells that have typical hairy protrusions.62
Conclusion
We have devised a way of analyzing big microarray datasets by segmenting them using pathway information. Since the number of genes in a pathway is small, and therefore the corresponding number microarray gene probes in a dataset is small, it is possible to apply modern machine learning methods, which are computationally infeasible with complete datasets, to any pathway subset. Our hypothesis is that we are more likely to find genes that are acting together in cancer among the genes belonging to a known pathway than in a randomly drawn set of genes. We have tested this hypothesis statistically and found that it is correct in two very large datasets.
Our work is primarily addressing the problems of applying machine learning to very large datasets. In this respect, we are aiming to develop methods that will assist biologists in their research. The aim of our work was not to produce a better list of biomarkers but to develop and validate a method of searching large dimensional datasets for information. The fact that some but not all of the genes identified in our studies have already been associated with the mechanisms of cancer is an encouraging validation of our approach.
Our results demonstrate the feasibility of the proposed method. For both the datasets analyzed, we could identify lists of genes that show a statistical association with response to treatment. Further experimentation, analysis, and clinical significance testing must be performed to determine whether these results can be used to define an effective biomarker for prediction of the progress of LGG and CML, and this can be done following current clinical practice.
Many further experiments with this technique could be carried out. We have used pathway data as our main source of prior knowledge, but there are other possibilities. Another possible source of information is the Molecular Signatures Database, which contains gene sets frequently used in gene set enrichment experiments. Our work does have common ground with gene set enrichment analysis, but a key difference is that rather than statistically associating a gene set with a phenotype, we are aiming to identify a set of genes providing accurate prediction of outcome. Our studies in this article have focused on methylation data since it has a very large number of probes. However, our method is completely general and could be used on any microarray experiments in the future.
Although our results are encouraging, further work could be carried out to validate the method more thoroughly. However, there are problems associated with this. Our method carries out a guided search for a set of genes that will provide good predictions of the prognosis of individual cancers. This means that we need labeled data for experimentation, and the results, based on cross-validation, apply primarily to the datasets used. Most publicly available microarray sets have a small number of samples, meaning that proper validation requires testing a large number of these datasets. Currently, this is not possible due to the high human time cost in finding and curating the data for experiments. However, the European eTRIKS project6 is currently addressing the question of sharable, standardized biomedical data, and will shortly provide a platform on which our method could be tested automatically on very large volumes of data. We believe that many interesting discoveries will result from these tests.
Supplementary Material
Supplementary File 1. Dimensionality reduction applied on the identified pathways. Dimensionality reduction worsens the results.
Supplementary File 2. Comparing the accuracy of the full pathway sets with partial ones (some percentage of the genes was removed). The accuracy depends on which genes are removed.
Supplementary File 3. Comparing the accuracy of the pathway sets with random sets of genes.
Footnotes
ACADEMIC EDITOR: J. T. Efird, Editor in Chief
PEER REVIEW: Four peer reviewers contributed to the peer review report. Reviewers’ reports totaled 2,147 words, excluding any confidential comments to the academic editor.
Funding: Authors disclose no external funding sources.
COMPETING INTERESTS: Authors disclose no potential conflicts of interest.
Paper subject to independent expert blind peer review. All editorial decisions made by independent academic editor. Upon submission manuscript was subject to anti-plagiarism scanning. Prior to publication all authors have given signed confirmation of agreement to article publication and compliance with all applicable ethical and legal requirements, including the accuracy of author and contributor information, disclosure of competing interests and funding sources, compliance with ethical requirements relating to human and animal study participants, and compliance with any copyright requirements of third parties. This journal is a member of the Committee on Publication Ethics (COPE).
Author Contributions
Conceived and designed the experiments: ZMH, DFG. Analyzed the data: ZMH. Wrote the first draft of the manuscript: ZMH. Contributed to the writing of the manuscript: DFG. Agree with manuscript results and conclusions: ZMH, DFG. Jointly developed the structure and arguments for the paper: ZMH, DFG. Made critical revisions and approved final version: ZMH, DFG. Both authors reviewed and approved of the final manuscript.
REFERENCES
- 1.Ahmed Z, Smith BJ, Kotani K, Wilden P, Pillay TS. Aps, an adapter protein with a ph and sh2 domain, is a substrate for the insulin receptor kinase. Biochem J. 1999;341(pt 3):665–8. [PMC free article] [PubMed] [Google Scholar]
- 2.Ferlay J, Soerjomataram I, Dikshit R, et al. Cancer incidence and mortality worldwide: sources, methods and major patterns in globocan 2012. Int J Cancer. 2015;136(5):E359–86. doi: 10.1002/ijc.29210. [DOI] [PubMed] [Google Scholar]
- 3.Schumacher A, Kapranov P, Kaminsky Z, et al. Microarray-based DNA methylation profiling: technology and applications. Nucleic Acids Res. 2006;34(2):528–42. doi: 10.1093/nar/gkj461. [DOI] [PMC free article] [PubMed] [Google Scholar]
- 4.Lyn Walker C, Ho SM. Developmental reprogramming of cancer susceptibility. Nat Rev Cancer. 2012;12(7):479–86. doi: 10.1038/nrc3220. [DOI] [PMC free article] [PubMed] [Google Scholar]
- 5.Jones PA, Laird PW. Cancer epigenetics comes of age. Nat Genet. 1999;21(2):163–7. doi: 10.1038/5947. [DOI] [PubMed] [Google Scholar]
- 6.Aran D, Sabato S, Hellman A. DNA methylation of distal regulatory sites characterizes dysregulation of cancer genes. Genome Biol. 2013;14(3):R21. doi: 10.1186/gb-2013-14-3-r21. [DOI] [PMC free article] [PubMed] [Google Scholar]
- 7.Bock C. Analysing and interpreting DNA methylation data. Nat Rev Genet. 2012;13(10):705–19. doi: 10.1038/nrg3273. [DOI] [PubMed] [Google Scholar]
- 8.Laura B. Epigenomics: the new tool in studying complex diseases. Nat Educ. 2008;1(1):178. [Google Scholar]
- 9.Levenson VV, Melnikov AA. DNA methylation as clinically useful biomarkers-light at the end of the tunnel. Pharmaceuticals. 2012;5(1):94–113. doi: 10.3390/ph5010094. [DOI] [PMC free article] [PubMed] [Google Scholar]
- 10.Baylin SB. DNA methylation and gene silencing in cancer. Nat Clin Pract Oncol. 2005;2(Suppl 1):S411. doi: 10.1038/ncponc0354. [DOI] [PubMed] [Google Scholar]
- 11.Maier S, Dahlstroem C, Haefliger C, Plum A, Piepenbrock C. Identifying DNA methylation biomarkers of cancer drug response. Am J Pharmacogenomics. 2005;5(4):223–32. doi: 10.2165/00129785-200505040-00003. [DOI] [PubMed] [Google Scholar]
- 12.Glaab E, Bacardit J, Garibaldi JM, Krasnogor N. Using rule-based machine learning for candidate disease gene prioritization and sample classification of cancer gene expression data. PLoS One. 2012;7(7):1–18. doi: 10.1371/journal.pone.0039932. [DOI] [PMC free article] [PubMed] [Google Scholar]
- 13.Liu Q, Sung AH, Chen Z, et al. Gene selection and classification for cancer microarray data based on machine learning and similarity measures. BMC Genomics. 2011;12(5):1–12. doi: 10.1186/1471-2164-12-S5-S1. [DOI] [PMC free article] [PubMed] [Google Scholar]
- 14.Liu Q, Sung AH, Chen Z, Liu J, Huang X, Deng Y. Feature selection and classification of maqc-ii breast cancer and multiple myeloma microarray gene expression data. PLoS One. 2009;4(12):e8250. doi: 10.1371/journal.pone.0008250. [DOI] [PMC free article] [PubMed] [Google Scholar]
- 15.Osareh A, Shadgar B. Machine learning techniques to diagnose breast cancer; 2010 5th International Symposium on Health Informatics and Bioinformatics (HIBIT); 2010. pp. 114–20. [Google Scholar]
- 16.Ruan J, Jahid MJ, Gu F, et al. Network-Based Classification of Recurrent Endometrial Cancers Using High-Throughput DNA Methylation Data. 2012:418–25. [Google Scholar]
- 17.Ruan J, Jahid J, Gu F, et al. Network-based classification of recurrent endo metrial cancers using high-throughput DNA methylation data; BCB ’12 Proceedings of the ACM Conference on Bioinformatics, Computational Biology and Biomedicine; New York, NY: ACM; 2012. pp. 418–25. [Google Scholar]
- 18.Wilhelm T. Phenotype prediction based on genome-wide DNA methylation data. BMC Bioinformatics. 2014;15:193. doi: 10.1186/1471-2105-15-193. [DOI] [PMC free article] [PubMed] [Google Scholar]
- 19.Brown MPS, Noble Grundy W, Lin D, et al. Knowledge-based analysis of microarray gene expression data by using support vector machines. Proc Natl Acad Sci U S A. 2000;97(1):262–7. doi: 10.1073/pnas.97.1.262. [DOI] [PMC free article] [PubMed] [Google Scholar]
- 20.Guan P, Huang D, He M, Zhou B. Lung cancer gene expression database analysis incorporating prior knowledge with support vector machine-based classification method. J Exp Clin Cancer Res. 2009;28(1):103. doi: 10.1186/1756-9966-28-103. [DOI] [PMC free article] [PubMed] [Google Scholar]
- 21.Glaab E. Using prior knowledge from cellular pathways and molecular networks for diagnostic specimen classification. Brief Bioinform. 2016;17(3):440–52. doi: 10.1093/bib/bbv044. [DOI] [PMC free article] [PubMed] [Google Scholar]
- 22.Hira ZM, Trigeorgis G, Gillies DF. An algorithm for finding biologically significant features in microarray data based on a priori manifold learning. PLoS ONE. 2014;9(3):e90562. doi: 10.1371/journal.pone.0090562. [DOI] [PMC free article] [PubMed] [Google Scholar]
- 23.Lee E, Chuang HY, Kim JW, Ideker T, Lee D. Inferring pathway activity toward precise disease classification. PLoS Comput Biol. 2008;4(11):e1000217. doi: 10.1371/journal.pcbi.1000217. [DOI] [PMC free article] [PubMed] [Google Scholar]
- 24.Liu W, Li C, Xu Y, et al. Topologically inferring risk-active pathways toward precise cancer classification by directed random walk. Bioinformatics. 2013;29(17):2169–77. doi: 10.1093/bioinformatics/btt373. [DOI] [PubMed] [Google Scholar]
- 25.Luque-Baena RM, Urda D, Gonzalo Claros M, Franco L, Jerez JM. Robust gene signatures from microarray data using genetic algorithms enriched with biological pathway keywords. J Biomed Inform. 2014;49:32–44. doi: 10.1016/j.jbi.2014.01.006. [DOI] [PubMed] [Google Scholar]
- 26.Sokolov A, Carlin DE, Paull EO, Baertsch R, Stuart JM. Pathway-based genomics prediction using generalized elastic net. PLoS Comput Biol. 2016;12(3):1–23. doi: 10.1371/journal.pcbi.1004790. [DOI] [PMC free article] [PubMed] [Google Scholar]
- 27.Chen X, Wang L. Integrating biological knowledge with gene expression profiles for survival prediction of cancer. J Comput Biol. 2009;16(2):265–78. doi: 10.1089/cmb.2008.12TT. [DOI] [PMC free article] [PubMed] [Google Scholar]
- 28.Chen Y, Xu D. Global protein function annotation through mining genome-scale data in yeast Saccharomyces cerevisiae. Nucleic Acids Res. 2004;32(21):6414–24. doi: 10.1093/nar/gkh978. [DOI] [PMC free article] [PubMed] [Google Scholar]
- 29.Cheng J, Cline M, Martin J, et al. A knowledge-based clustering algorithm driven by gene ontology. J Biopharm Stat. 2004;14(3):687–700. doi: 10.1081/bip-200025659. [DOI] [PubMed] [Google Scholar]
- 30.Kustra R, Zagdanski A. Data-fusion in clustering microarray data: balancing discovery and interpretability. IEEE/ACM Trans Comput Biol Bioinform. 2010;7(1):50–63. doi: 10.1109/TCBB.2007.70267. [DOI] [PubMed] [Google Scholar]
- 31.Kamburov A, Pentchev K, Galicka H, Wierling C, Lehrach H, Herwig R. Consensuspathdb: toward a more complete picture of cell biology. Nucleic Acids Res. 2011;39(Suppl 1):D712–7. doi: 10.1093/nar/gkq1156. [DOI] [PMC free article] [PubMed] [Google Scholar]
- 32.Kamburov A, Stelzl U, Lehrach H, Herwig R. The consensuspathdb interaction database: 2013 update. Nucleic Acids Res. 2013;41(D1):D793–800. doi: 10.1093/nar/gks1055. [DOI] [PMC free article] [PubMed] [Google Scholar]
- 33.Kamburov A, Wierling C, Lehrach H, Herwig R. Consensuspathdba database for integrating human functional interaction networks. Nucleic Acids Res. 2009;37(Suppl 1):D623–8. doi: 10.1093/nar/gkn698. [DOI] [PMC free article] [PubMed] [Google Scholar]
- 34.Pentchev K, Ono K, Herwig R, Ideker T, Kamburov A. Evidence mining and novelty assessment of proteinprotein interactions with the consensuspathdb plugin for cytoscape. Bioinformatics. 2010;26(21):2796–7. doi: 10.1093/bioinformatics/btq522. [DOI] [PMC free article] [PubMed] [Google Scholar]
- 35.Kearns M. Thoughts on Hypothesis Boosting. 1998. https://www.cis.upenn.edu/~mkearns/papers/boostnote.pdf.
- 36.Stalteri M, Harrison A. Interpretation of multiple probe sets mapping to the same gene in affymetrix genechips. BMC Bioinformatics. 2007;8(1):13. doi: 10.1186/1471-2105-8-13. [DOI] [PMC free article] [PubMed] [Google Scholar]
- 37.Tolosi L, Lengauer T. Classification with correlated features: unreliability of feature ranking and solutions. Bioinformatics. 2011;27(14):1986–94. doi: 10.1093/bioinformatics/btr300. [DOI] [PubMed] [Google Scholar]
- 38.Dietterich TG. Ensemble methods in machine learning; Proceedings of the First International Workshop on Multiple Classifier Systems, MCS ’00; London, UK: Springer-Verlag; 2000. pp. 1–15. [Google Scholar]
- 39.Freund Y, Schapire RE. A decision-theoretic generalization of on-line learning and an application to boosting. J Comput Syst Sci. 1997;55(1):119–39. [Google Scholar]
- 40.Hastie T, Rosset S, Zhu J, Zou H. Multi-class AdaBoost. Stat Interface. 2009;2(3):349–60. [Google Scholar]
- 41.Breiman L, Friedman J, Olshen R, Stone C. Classification and Regression Trees. Monterey, CA: Wadsworth and Brooks; 1984. [Google Scholar]
- 42.Pedregosa F, Varoquaux G, Gramfort A, et al. Scikit-learn: machine learning in python. J Machine Learning Res. 2011;12:2825–30. [Google Scholar]
- 43.Geisser S. Predictive Inference: An Introduction. New York, NY: Chapman & Hall; 1993. [Google Scholar]
- 44.Pearson K. On lines and planes of closest fit to systems of points in space. Philos Mag. 1901;2(6):559–72. [Google Scholar]
- 45.Tenenbaum JB, de Silva V, Langford JC. A global geometric framework for nonlinear dimensionality reduction. Science. 2000;290(5500):2319–23. doi: 10.1126/science.290.5500.2319. [DOI] [PubMed] [Google Scholar]
- 46.Mcneill A, Chinnery PF. Chapter 9 – neurodegeneration with brain iron accumulation. In: Weiner WJ, Tolosa E, editors. Hyperkinetic Movement Disorders, Volume 100 of Handbook of Clinical Neurology. Elsevier; 2011. pp. 161–72. [DOI] [PubMed] [Google Scholar]
- 47.Wandzilak A, Czyzycki M, Wrobel P, et al. The oxidation states and chemical environments of iron and zinc as potential indicators of brain tumour malignancy grade – preliminary results. Metallomics. 2013;5:1547–53. doi: 10.1039/c3mt00158j. [DOI] [PubMed] [Google Scholar]
- 48.Okada H, Kohanbash G, Zhu X, et al. Immunotherapeutic approaches for glioma. Crit Rev Trade Immunol. 2009;29(1):1–42. doi: 10.1615/critrevimmunol.v29.i1.10. [DOI] [PMC free article] [PubMed] [Google Scholar]
- 49.Delattre JY, Vega F, Poisson M, et al. Purine and pyrimidine metabolism in human gliomas: relation to chromosomal aberrations. Br J Cancer Nat. 1994;70:212–8. doi: 10.1038/bjc.1994.282. [DOI] [PMC free article] [PubMed] [Google Scholar]
- 50.Tan X, Wang S, Zhu L, et al. Camp response element-binding protein promotes gliomagenesis by modulating the expression of oncogenic microrna-23a. Proc Natl Acad Sci U S A. 2012;109(39):15805–10. doi: 10.1073/pnas.1207787109. [DOI] [PMC free article] [PubMed] [Google Scholar]
- 51.Daniel P, Filiz G, Brown DV, et al. Selective creb-dependent cyclin expression mediated by the pi3k and mapk pathways supports glioma cell proliferation. Oncogenesis. 2014;3:e108. doi: 10.1038/oncsis.2014.21. [DOI] [PMC free article] [PubMed] [Google Scholar]
- 52.Remon J, Lianes P, Martnez S. Brain metastases from renal cell carcinoma. Should we change the current standard? Cancer Treat Rev. 2012;38(4):249–57. doi: 10.1016/j.ctrv.2011.06.008. [DOI] [PubMed] [Google Scholar]
- 53.Hendricks-Taylor LR, Motto DG, Zhang J, Siraganian RP, Koretzky GA. Slp-76 is a substrate of the high affinity ige receptor-stimulated protein tyrosine kinases in rat basophilic leukemia cells. J Biol Chem. 1997;272(2):1363–7. doi: 10.1074/jbc.272.2.1363. [DOI] [PubMed] [Google Scholar]
- 54.Motto DG, Musci MA, Ross SE, Koretzky GA. Tyrosine phosphorylation of grb2-associated proteins correlates with phospholipase c gamma 1 activation in t cells. Mol Cell Biol. 1996;16(6):2823–9. doi: 10.1128/mcb.16.6.2823. [DOI] [PMC free article] [PubMed] [Google Scholar]
- 55.Robinson DR, Wu YM, Lin SF. The protein tyro-sine kinase family of the human genome. Oncogene. 2000;19(49):5548–57. doi: 10.1038/sj.onc.1203957. [DOI] [PubMed] [Google Scholar]
- 56.Zwick E, Bange J, Ullrich A. Receptor tyrosine kinase signalling as a target for cancer intervention strategies. Endocr Relat Cancer. 2001;8(3):161–73. doi: 10.1677/erc.0.0080161. [DOI] [PubMed] [Google Scholar]
- 57.National Cancer Institute . What You Need to Know about Leukemia. 2013. [Google Scholar]
- 58.Sachs L. The control of hematopoiesis and leukemia: from basic biology to the clinic. Proc Natl Acad Sci U S A. 1996;93(10):4742–9. doi: 10.1073/pnas.93.10.4742. [DOI] [PMC free article] [PubMed] [Google Scholar]
- 59.Willman CL. Sh2b3: a new leukemia predisposition gene. Blood. 2013;122(14):2293–5. doi: 10.1182/blood-2013-08-519843. [DOI] [PMC free article] [PubMed] [Google Scholar]
- 60.Mengubas K, Jabbar SA, Nye KE, Wilkes S, Hoffbrand AV, Wickremasinghe RG. Inactivation of calcium ion-regulating inositol polyphosphate second messengers is impaired in subpopulations of human leukemia cells. Leukemia. 1994;8(10):1718–25. [PubMed] [Google Scholar]
- 61.Liu Q, Shalaby F, Jones J, Bouchard D, Dumont DJ. The sh2-containing inositol polyphosphate 5-phosphatase, ship, is expressed during hematopoiesis and spermatogenesis. Blood. 1998;91(8):2753–9. [PubMed] [Google Scholar]
- 62.Spaenij-Dekking EHA, Van Delft J, Van Der Meijden E, et al. Synaptojanin 2 is recognized by HLA class ii-restricted hairy cell leukemia-specific t cells. Leukemia. 2003;17(12):2467–73. doi: 10.1038/sj.leu.2403174. [DOI] [PubMed] [Google Scholar]
Associated Data
This section collects any data citations, data availability statements, or supplementary materials included in this article.
Supplementary Materials
Supplementary File 1. Dimensionality reduction applied on the identified pathways. Dimensionality reduction worsens the results.
Supplementary File 2. Comparing the accuracy of the full pathway sets with partial ones (some percentage of the genes was removed). The accuracy depends on which genes are removed.
Supplementary File 3. Comparing the accuracy of the pathway sets with random sets of genes.


