

Summary
Germline mutations in BRAF cause cardio-facio-cutaneous syndrome (CFCS), whereby 40% of patients develop hypertrophic cardiomyopathy (HCM). As the role of the RAS/MAPK pathway in HCM pathogenesis is unclear, we generated a human induced pluripotent stem cell (hiPSC) model for CFCS from three patients with activating BRAF mutations. By cell sorting for SIRPα and CD90, we generated a method to examine hiPSC-derived cell type-specific phenotypes and cellular interactions underpinning HCM. BRAF-mutant SIRPα+/CD90− cardiomyocytes displayed cellular hypertrophy, pro-hypertrophic gene expression, and intrinsic calcium-handling defects. BRAF-mutant SIRPα−/CD90+ cells, which were fibroblast-like, exhibited a pro-fibrotic phenotype and partially modulated cardiomyocyte hypertrophy through transforming growth factor β (TGFβ) paracrine signaling. Inhibition of TGFβ or RAS/MAPK signaling rescued the hypertrophic phenotype. Thus, cell autonomous and non-autonomous defects underlie HCM due to BRAF mutations. TGFβ inhibition may be a useful therapeutic option for patients with HCM due to RASopathies or other etiologies.
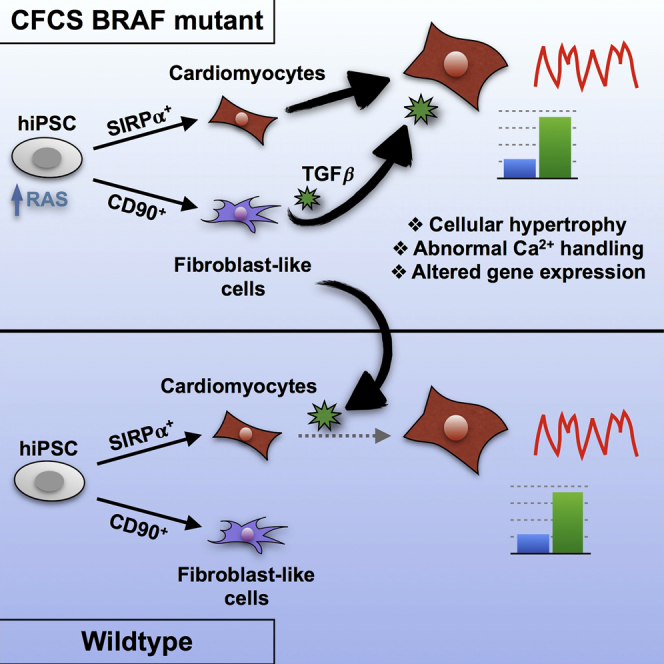
Graphical Abstract
Highlights
-
•
Cardiomyocytes and fibroblast-like cells can be purified separately from EBs
-
•
BRAF-mutant cardiomyocytes display hypertrophy and intrinsic Ca2+-handling defects
-
•
BRAF-mutant fibroblast-like cells influence cardiomyocyte hypertrophy through TGFβ
-
•
The hypertrophic phenotype can be rescued by TGFβ or RAS/MAPK inhibition
To better understand the role of RAS/MAPK signaling in the pathogenesis of hypertrophic cardiomyopathy (HCM), Gelb and colleagues purified cardiomyocytes and fibroblast-like cells from hiPSCs derived from patients with BRAF mutations causing RASopathy-associated HCM. While mutant cardiomyocytes were pro-hypertrophic with altered Ca2+ handling, mutant fibroblast-like cells critically modulated cardiomyocyte hypertrophy through increased TGFβ signaling.
Introduction
The RASopathies are developmental disorders caused by mutations in the RAS/MAPK pathway, characterized by pleomorphic developmental defects including facial dysmorphism, short stature, neurocognitive delay, and cardiac defects. One of the commonest cardiac manifestations is hypertrophic cardiomyopathy (HCM) (Tartaglia and Gelb, 2010).
HCM is defined as thickening of the myocardium that occurs in the absence of an underlying insult, usually resulting from mutations in various genes encoding sarcomeric components. Histologically, there is cardiomyocyte (CM) enlargement and increased fibrosis. HCM is molecularly characterized by upregulation of a fetal gene program including increased expression of atrial natriuretic peptide (ANP) and brain natriuretic peptide (BNP), often with dysregulated calcium handling (Konno et al., 2010). About 70% of patients with HCM develop obstruction, while other complications include arrhythmias, heart failure, and sudden cardiac death (Harris et al., 2006).
The role of RAS/MAPK signaling in cardiac hypertrophy remains unclear. Cardiac-restricted overexpression of Mek1 caused compensated hypertrophy with increased cardiac function (Bueno et al., 2000). In addition, Erk1−/−Erk2+/− mice were not protected from pressure overload or agonist stimulation (Purcell et al., 2007). However, oncogenic Hras over-expression led to pathological hypertrophy with fibrosis and calcium-handling defects (Hunter et al., 1995, Zheng et al., 2004), and dominant-negative Raf1 overexpression prevented pressure overload-induced cardiac hypertrophy (Harris et al., 2004). Some suggest that the pathological effects of RAS and RAF signaling may not be exclusively mediated by downstream MAPK signaling but rather by cross-activation of other pathways (Heineke and Molkentin, 2006).
Mice expressing the RASopathy Raf1L613V allele developed HCM, rescued by MEK inhibition (Wu et al., 2011). However, mice with activating BRAF mutations did not exhibit pathological cardiac remodeling (Andreadi et al., 2012, Urosevic et al., 2011). Thus, the pathogenesis of HCM in cardio-facio-cutaneous syndrome (CFCS), whereby 75% of cases have germline BRAF mutations (Rodriguez-Viciana et al., 2006) and 40% develop HCM (Armour and Allanson, 2008), is unclear. To study this, we generated an hiPSC model of CFCS and developed a method to examine hiPSC-derived cell type-specific phenotypes and cellular interactions underpinning HCM by cell sorting based on SIRPα and CD90 expression. We show that purified CMs derived from hiPSCs harboring the CFC-causing T599R or Q257R BRAF mutations display cellular hypertrophy and intrinsic calcium-handling defects. In addition, fibroblast-like cells (FLCs) derived from BRAF-mutant hiPSCs exhibit pro-fibrotic behavior and modulate the hypertrophic phenotype through paracrine transforming growth factor β (TGFβ) signaling. Both TGFβ and RAS/MAPK inhibition rescue the hypertrophic phenotype.
Results
Generation and Purification of Wild-Type and BRAF-Mutant iPSC-Derived CMs
hiPSCs were generated from dermal fibroblasts from three unrelated patients with CFCS. Patient 1 (BRAF1) harbored the known BRAF T599R mutation (Yoon et al., 2007), which alters the activation segment of the kinase domain and is kinase activating (Wan et al., 2004). Patients 2 and 3 (BRAF2, BRAF3) harbored BRAF Q257R mutations, the commonest CFCS mutation, which alters the cysteine-rich domain of the conserved region 1 (CR1) and is also kinase activating (Rodriguez-Viciana et al., 2006). Patients 1 and 2 displayed HCM while patient 3 did not. Wild-type (WT) hiPSC lines generated from three unrelated healthy individuals served as controls. DNA sequencing confirmed the heterozygous BRAF mutations in mutant hiPSC lines (Figure 1A). Mutant lines had normal karyotypes, and pluripotency was confirmed with immunofluorescence, gene expression, and tri-lineage differentiation assays (Figure S1).
Figure 1.

Differentiation and Purification of hiPSC-derived CMs
(A) Sequencing confirmed the heterozygous BRAF T599R (BRAF1) and the Q257R mutations (BRAF2, BRAF3) in hiPSCs. Red asterisks note the positions of the BRAF mutations.
(B) Cardiac differentiation protocol. hiPSCs were exposed to a series of cytokines to induce cardiogenesis. CMs were sorted for purification after day 25.
(C) Cell-sorting strategy to purify SIRPα+/CD90− cells and SIRPα−/CD90+ cells.
(D) Staining for cTNT demonstrated purification of >95% CMs after sorting for SIRPα+/CD90− cells.
See also Figures S1 and S2.
hiPSCs were differentiated along a cardiogenic lineage as 3D embryoid bodies (EBs) using a modification of an established protocol (Yang et al., 2008) (Figure 1B). In addition to three WT hiPSC lines, two clones from each mutant hiPSC line were used in subsequent experiments (Table S1). Spontaneous beating was observed between days 10 and 12 of differentiation. To detect potential molecular defects intrinsic to CMs and non-CMs, we purified these populations separately using flow cytometry based on their expression of SIRPα, a CM marker (Dubois et al., 2011), and CD90, a marker that labels the majority of non-CMs derived from PSCs (Dubois et al., 2011, Kisselbach et al., 2009). SIRPα+/CD90− cells were >95% CMs based on cardiac troponin T (cTNT; TNNT2) expression (Figures 1C and 1D). Expression of the cardiac-specific genes ANP, MYH6, and TNNT2 was restricted to the SIRPα+ cells. Re-cultured SIRPα+/CD90− cells formed synchronous monolayers that beat spontaneously and homogeneously expressed cTNT. While differentiation efficiency was variable among lines, no reproducible difference was observed between WT and BRAF-mutant lines (Figure S2).
BRAF-Mutant CMs Display a Cellular Hypertrophy Phenotype
To determine whether BRAF-mutant CMs displayed hypertrophy, we dissociated whole EBs and measured the cellular area of re-plated single cTNT+ cells. Across lines, BRAF-mutant CMs were on average more than three times larger than WT CMs (p < 0.0001) (Figure 2A). Using flow cytometry to analyze forward scatter (FSC) as a surrogate of 3D cellular size, BRAF-mutant CMs were also larger than WT CMs (Figure S3). Increased sarcomeric organization, a hallmark of cardiac hypertrophy (Aoki et al., 2000) demonstrated by a striated cTNT staining pattern, was apparent in BRAF-mutant CMs (58%) compared with WT (16%; p < 0.0001). The most pronounced sarcomere organization was observed in severely hypertrophied BRAF-mutant CMs (Figure 2B). Upregulation of a fetal gene program, classically observed in HCM (Kuwahara et al., 2003), was also noted in purified BRAF-mutant CMs, which displayed >5-fold and >6-fold increased expression of ANP and BNP, respectively, compared with WT (p < 0.0001), as well as a >8-fold increased β-myosin heavy chain (MYH7) to α-myosin heavy chain (MYH6) ratio (p = 0.078) (Figure 2C).
Figure 2.

BRAF-Mutant hiPSC-Derived CMs Display Cellular Hypertrophy
(A) Increased cellular area of cTNT+ BRAF-mutant CMs (n = 35–54 per line; three independent experiments each) compared with WT (n = 22–58 per line; three independent experiments each). Box-and-whisker plots show the median to the first and third quartiles and the minimum and maximum values. ∗∗∗∗p < 0.0001 for WT versus all individual BRAF lines. Scale bars, 200 μm.
(B and C) Data are presented as mean ± SEM for compiled WT versus BRAF cell lines along with compiled statistical significance results. To the right of the compiled data, data points representing results for individual patient lines are presented, as shown in the accompanying legend. Filled symbols indicate lines with identical mutation (Q257R). (B) Increased percentage of striated sarcomeres in cTNT+ BRAF-mutant CMs (n = 371) compared with WT (n = 579). Data represent three biological (WT1, 2, 3; BRAF1, 2, 3) and three technical replicates (compiled ∗∗∗∗p < 0.0001; WT versus BRAF1, 2, or 3 all p < 0.0001). Scale bars, 200 μm. (C) Increased expression of hypertrophy-associated genes and decreased PLN expression in BRAF-mutant CMs (n = 6) compared with WT (n = 5). Data represent three biological (WT1, 2, 3; BRAF1, 2, 3) and three technical replicates. For ANP expression, compiled ∗∗∗∗p < 0.0001; WT versus BRAF1 p = 0.0001, WT versus BRAF2 p = 0.6644 (not significant), WT versus BRAF3 p = 0.0001. For BNP expression, compiled ∗∗∗p < 0.001; WT versus BRAF1 p = 0.0001, WT versus BRAF2 p = 0.9969 (not significant), WT versus BRAF3 p = 0.0001. For MYH7/MYH6 expression, compiled ∗∗p = 0.0078; WT versus BRAF1 p = 0.0073, WT versus BRAF2 p = 0.9999 (not significant), WT versus BRAF3 p = 0.0005. For PLN expression, compiled ∗p = 0.016; WT versus BRAF1 p = 0.3780 (not significant), WT versus BRAF2 p = 0.0750 (not significant), WT versus BRAF3 p = 0.0210. See also Figure S3.
Purified BRAF-Mutant CMs Display Altered Calcium Handling
Dysregulation of calcium (Ca2+) handling has been observed in many HCM models (Molkentin, 2004), including an hiPSC model of familial HCM (Lan et al., 2013). In purified BRAF-mutant CMs, phospholamban (PLN) expression was significantly decreased (p = 0.016) (Figure 2C) with a trend toward increased SERCA2a expression (data not shown). To assess whether BRAF-mutant CMs had impaired Ca2+ handling, we analyzed Ca2+ transients in paced cells. Compared with WT, BRAF-mutant CMs displayed a significantly increased frequency of irregular transients (28% versus 6%, p < 0.0001), defined as an extra Ca2+ transient peak during the decay of the previous transient, indicating unstable Ca2+ release from the sarcoplasmic reticulum (SR). A small percentage of BRAF-mutant CMs also displayed discordance between the timing of electrical stimulation and resulting Ca2+ transient, further indicating underlying instability (Figure 3A).
Figure 3.

Purified BRAF-Mutant CMs Display Dysregulated Calcium Handling
Data are presented as mean ± SEM for compiled WT versus BRAF cell lines along with compiled statistical significance results and results for individual patient lines (see Figure 2 legend). Data represent three biological (WT1, 2, 3; BRAF1, 2, 3) and six technical replicates.
(A) Purified BRAF-mutant CMs (n = 123) displayed increased frequency of irregular Ca2+ transients compared with WT (n = 74) and a discordance between the timing of stimulation and the resulting Ca2+ transient. Compiled ∗∗∗∗p < 0.0001; WT versus BRAF1 p = 0.9908 (not significant), WT versus BRAF2 p = 0.0001, WT versus BRAF3 p = 0.0001.
(B) Increased Ca2+ transient amplitude in purified BRAF-mutant CMs (n = 123) compared with WT (n = 74). Compiled ∗∗∗∗p < 0.0001; WT versus BRAF1 p = 0.0453, WT versus BRAF2 p = 0.0006, WT versus BRAF3 p = 0.0001.
(C) Purified BRAF-mutant CMs (n = 41) possessed increased stored Ca2+ content compared with WT (n = 28) as assessed by exposure to caffeine. Compiled ∗∗∗p < 0.001; WT versus BRAF1 p = 0.0001, WT versus BRAF2 p = 0.774 (not significant), WT versus BRAF3 p = 0.0015.
Consistent with increased Ca2+ release observed in mouse hearts overexpressing SERCA2a (Baker et al., 1998), BRAF-mutant CMs also displayed increased Ca2+ release from the SR, as reflected by increased transient amplitude compared with WT (3.6 a.u. versus 2.6 a.u., p < 0.0001) (Figure 3B). Exposure to the ryanodine receptor activator caffeine revealed that BRAF-mutant CMs contained increased stored Ca2+ compared with WT (6.2 a.u. versus 4.5 a.u., p < 0.001) (Figure 3C), similar to observations during early cardiac hypertrophy (Delbridge et al., 1997, Sipido et al., 2000). Our results demonstrate that BRAF-mutant CMs possess intrinsic defects in Ca2+ handling, representative of early-stage HCM.
Multiple BRAF-Mutant Cell Types Display Activation of the RAS/MAPK Pathway
To assess RAS/MAPK pathway activation, we analyzed ERK activation basally and after stimulation with epidermal growth factor (EGF) or angiotensin II (AngII). ERK activation was sustained over time in BRAF-mutant hiPSCs compared with WT (Figure S5A). In contrast, ERK activation was not increased in BRAF-mutant CMs compared with WT CMs (Figure 4A).
Figure 4.

RAS/MAPK Pathway Activation in Purified hiPSC-Derived CMs and FLCs
Data are presented as mean ± SEM for compiled WT versus BRAF cell lines along with compiled statistical significance results for WT versus BRAF at each time point and results for individual patient lines (see Figure 2 legend). Data represent three biological (WT1, 2, 3; BRAF1, 2, 3) and two technical replicates. Cells were stimulated with AngII for 0 or 15 min.
(A) BRAF-mutant CMs (n = 8) did not have increased pERK activation compared with WT (n = 6). At 0 min: compiled p = 0.2944 (not significant [n.s.]); WT versus BRAF1 p = 0.9799, WT versus BRAF2 p = 0.2347, WT versus BRAF3 p = 0.7139 (all not significant). At 15 min: compiled p = 0.6633 (not significant); WT versus BRAF1 p = 0.9982, WT versus BRAF2 p = 0.7438, WT versus BRAF3 p = 0.9897 (all not significant).
(B) BRAF-mutant FLCs (n = 8) displayed increased activation of pERK compared with WT (n = 6). At 0 min: compiled ∗∗p = 0.0059; WT versus BRAF1 p = 0.0159, WT versus BRAF2 p = 0.0001, WT versus BRAF3 p = 0.1541 (not significant). At 15 min: compiled p = 0.1476 (not significant); WT versus BRAF1 p = 0.5359, WT versus BRAF2 p = 0.2032, WT versus BRAF3 p = 0.9781 (all not significant).
All values normalized to GAPDH. WT and BRAF lanes were run on the same gel but were non-contiguous. See also Figures S4 and S5.
The contribution of non-CMs as crucial to the hypertrophic response has been increasingly recognized (Fujiu and Nagai, 2014). To address whether BRAF-mutant non-CMs display activation of the RAS/MAPK pathway, we purified the SIRPα−/CD90+ population (Figure 1C). CD90 labeled the majority of non-CM cells across hiPSC lines (Figure S2C). To investigate the specific cell type to which the CD90+ cells are most closely related, we performed gene-expression profiling. CD90+ cells did not express markers of stem cells (REX1) or endothelial cells (CD31, CDH5), but robustly expressed three fibroblast markers (VIM, COL1A2, and DDR2), which were also expressed by human fetal SIRPα−/CD90+ cells (Figure S4A). Within cardiac tissue, fibroblasts exclusively express DDR2 (Camelliti et al., 2005). In addition, hiPSC-derived CD90+ cells displayed a spindle-shaped morphology similar to fibroblasts (Figure S4B). Thus, we henceforth refer to CD90+/SIRPα− cells as FLCs.
BRAF-mutant FLCs displayed increased ERK activation compared with WT FLCs, with significantly larger activation in the basal state (1.8 a.u. versus 0.9 a.u., p = 0.0059) (Figure 4B). Importantly, activation of AKT was not observed in BRAF-mutant CMs or FLCs (Figures S5B and S5C), distinct from AKT/mTOR involvement in a related RASopathy syndrome due to PTPN11 mutations (Marin et al., 2011), but similar to findings in mice with mutations in RAF isoforms (Wu et al., 2011).
BRAF-Mutant FLCs Are Pro-fibrotic and Influence the Hypertrophic Phenotype
To investigate whether activated BRAF-mutant FLCs were modulating the CM hypertrophic phenotype, we co-cultured purified WT CMs along with purified WT or BRAF-mutant FLC populations (Figure 5A). Strikingly, the cellular area of WT CMs doubled when co-cultured with BRAF-mutant FLCs compared with WT FLCs (p < 0.0001) (Figures 5B and 5C).
Figure 5.

BRAF-Mutant FLCs Influence the Hypertrophic Phenotype
(A) Schematic of co-culture experiment. WT CMs and WT and BRAF-mutant FLCs (Fib-like) were sorted from EBs and re-cultured together.
(B) Representative images of co-culture treatment groups stained with cTNT. Scale bars, 200 μm.
(C) Quantification of cellular area as depicted in (B). WT CMs became significantly larger upon co-culture with BRAF-mutant Fib-like cells (n = 67) compared with co-culture with WT Fib-like cells (n = 62) (∗∗∗∗p < 0.0001). Box-and-whisker plots show the median to the first and third quartiles and the minimum and maximum values. Data represent two biological (WT2, 3; BRAF1, 2) and three technical replicates.
(D) Increased proliferation rate of purified BRAF-mutant Fib-like cells (n = 3) compared with WT (n = 2) as demonstrated by increased staining for Ki67 by flow cytometry (∗p = 0.03). Data represent two (WT2, 3) or three (BRAF1, 2, 3) biological and two technical replicates. Data are presented as means ± SEM.
(E) Purified BRAF-mutant Fib-like cells expressed increased levels of fibrosis-associated genes compared with WT; TGFβ1 (BRAF n = 24, WT n = 18, ∗∗p = 0.002), POSTN (BRAF n = 15, WT n = 3, ∗p = 0.01), CTGF (BRAF n = 18, WT n = 12, ∗∗p = 0.002), COL1A2 (BRAF n = 24, WT n = 15, ∗∗p = 0.003), and ET-1 (BRAF n = 15, WT n = 8, p = 0.07, not significant). Data represent three biological (WT1, 2, 3; BRAF1, 2, 3) and three technical replicates. Data are presented as means ± SEM.
Next, we examined whether BRAF-mutant FLCs displayed behavior similar to activated fibroblasts in the setting of fibrosis. Compared with WT, BRAF-mutant FLCs were hyperproliferative (15% versus 7%, p = 0.03) (Figure 5D). BRAF-mutant FLCs also expressed significantly increased levels of fibrosis-associated genes, including TGFβ1 (p = 0.002), periostin (POSTN) (p = 0.01), connective tissue growth factor (CTGF) (p = 0.002), and collagen type I (COL1A2) (p = 0.003), and a trend toward increased expression of endothelin-1 (ET-1) (p = 0.07) (Figure 5E). Thus, the BRAF-mutant FLCs displayed a pro-fibrotic phenotype with upregulation of several TGFβ pathway members, suggesting a role for TGFβ signaling in mediating the hypertrophic response.
BRAF-Mutant FLCs Influence CM Hypertrophy through Paracrine TGFβ1 Secretion
To determine whether the effect of the BRAF-mutant FLCs on the hypertrophic phenotype was mediated by a paracrine effect, we cultured purified WT and BRAF-mutant CMs with conditioned media from purified WT and BRAF-mutant FLCs (Figure 6A). Remarkably, when WT CMs were exposed to BRAF-mutant FLC conditioned media, their cellular area nearly doubled (p < 0.0001) and was similar to that of BRAF-mutant CMs exposed to BRAF-mutant FLC conditioned media. Exposure to BRAF-mutant FLC conditioned media also resulted in significantly increased ANP expression in WT CMs (p = 0.03). When BRAF-mutant CMs were cultured with WT FLC conditioned media, their cellular area decreased by 30% (p = 0.008) (Figures 6B–6D). Thus, we concluded that BRAF-mutant FLCs were modulating CM hypertrophy through a paracrine mechanism.
Figure 6.

BRAF-Mutant FLCs Influence CM Hypertrophy through Paracrine TGFβ1 Secretion
(A) Schematic of conditioned media experiment. WT and BRAF-mutant CMs and FLCs (Fib-like) were sorted from EBs and re-cultured separately. After 4 days, CMs were exposed to Fib-like conditioned media.
(B) Representative images of treatment groups stained with cTNT. TGFβ-NA indicates pre-incubation of Fib-like conditioned media with a TGFβ neutralizing antibody prior to CM exposure. Scale bars, 200 μm.
(C) Quantification of cellular area as depicted in (B). WT CMs exposed to BRAF-mutant Fib-like conditioned media (n = 97) became significantly enlarged compared with exposure to WT Fib-like conditioned media (n = 91) (∗∗∗∗p < 0.0001). This effect was prevented by pre-incubation with TGFβ-NA (n = 92). Cellular hypertrophy in BRAF-mutant CMs (n = 86) was significantly reduced upon incubation with WT Fib-like conditioned media (n = 88) (∗∗p = 0.008), or pre-incubation of BRAF-mutant Fib-like conditioned media with TGFβ-NA (n = 134) (∗p = 0.01). Box-and-whisker plots show the median to the first and third quartiles and the minimum and maximum values. ns, not significant.
(D) WT CMs exposed to BRAF-mutant Fib-like conditioned media upregulated ANP (n = 3) compared with WT Fib-like conditioned media (n = 3) (∗p = 0.03). Data are presented as means ± SEM.
(E) BRAF-mutant CMs exposed to BRAF-mutant Fib-like conditioned media (n = 3) upregulated BNP expression (∗∗p = 0.001), which was rescued upon exposure to conditioned media with TGFβ-NA (n = 3) (∗∗p = 0.008), to levels similar to those in WT CMs exposed to WT Fib-like conditioned media (n = 3). Data represent three biological replicates (WT1, 2, 3; BRAF1, 2, 3) for conditioned media experiments, and two biological replicates (WT2, 3; BRAF1, 2) for TGFβ-NA experiments.
Three technical replicates were performed for all conditions. See also Figure S6.
TGFβ has been implicated in signaling between fibroblasts and CMs, mediating hypertrophic growth (Gray et al., 1998, Koitabashi et al., 2011). Using an ELISA, we found that the amounts of active and total TGFβ protein secreted by BRAF-mutant FLCs were increased compared with those from WT cells. No difference in TGFβ1 gene expression or secreted TGFβ protein level was observed between BRAF-mutant and WT CMs (Figures S6A–S6C).
To verify whether the paracrine effect of the BRAF-mutant FLCs was mediated by increased TGFβ secretion, we pre-incubated conditioned media with a pan-TGFβ neutralizing antibody (TGFβ-NA). TGFβ-NA-treated conditioned media from BRAF-mutant FLCs failed to produce a hypertrophic effect on WT or BRAF-mutant CMs (p = 0.01), and resulted in significantly decreased expression of BNP in BRAF-mutant CMs (p = 0.008) (Figures 6B, 6C, and 6E). Thus, we concluded that TGFβ signaling was necessary for the hypertrophy observed in the BRAF-mutant CMs.
To determine whether TGFβ signaling was sufficient for the induction of CM hypertrophy, we incubated CMs with recombinant human TGFβ (rhTGFβ). Upon exposure to rhTGFβ, the cellular area of BRAF-mutant and WT CMs significantly increased (p < 0.0001 and p = 0.03, respectively) (Figure S6D). Exposure of purified CMs to TGFβ-NA demonstrated no significant change in their cellular area, further implicating the source of increased TGFβ as derived from BRAF-mutant FLCs rather than BRAF-mutant CMs.
Together, our results reveal non-CM autonomous defects in BRAF-mutant FLCs, which contribute to the hypertrophic phenotype observed in BRAF-mutant CMs through increased TGFβ signaling.
Activation of the RAS/MAPK Pathway Induces the Hypertrophic Phenotype
To test whether MEK inhibition could ameliorate the hypertrophic phenotype in hiPSC-derived CMs, we exposed a mixed population of CMs and non-CMs to the MEK inhibitor U0126. While U0126 treatment had no effect on WT CM cellular area, the cellular area of BRAF-mutant CMs was reduced by 36% (p < 0.0001) to a size not significantly different from WT (Figure 7A), likely due to MEK inhibition affecting BRAF-mutant FLCs. In addition, treatment of purified BRAF-mutant CMs in the absence of FLCs with U0126 normalized their intrinsic Ca2+-handling defects, including decreasing the percentage of irregular transients and SR Ca2+ content to levels not significantly different from WT (Figures 7B and 7C).
Figure 7.

Inhibition of MEK Reverses the Hypertrophic Phenotype in BRAF-Mutant CMs
(A) Dissociated EBs were treated with the MEK inhibitor U0126 and cellular area of cTNT+ cells quantified. Exposure to U0126 (n = 130) significantly decreased the cellular area of BRAF-mutant CMs (n = 142) by 36% (∗∗∗∗p < 0.0001), but had no significant effect (ns) on the cellular area of WT CMs (n = 57). Box-and-whisker plots show the median to the first and third quartiles and the minimum and maximum values. Scale bars, 200 μm.
(B and C) Purified BRAF-mutant CMs exposed to U0126 displayed (B) decreased prevalence of irregular transients (n = 34) (∗∗∗∗p < 0.0001) and (C) decreased SR Ca2+ content (n = 12) (∗∗∗p < 0.001). Data are presented as means ± SEM. n.s., not significant. Data represent two (WT2, 3) and three (BRAF1, 2, 3) biological and four technical replicates.
See also Figure S7.
To document further that the CM hypertrophy was due to BRAF gain of function, we exposed purified WT and BRAF-mutant CMs to conditioned media from WT or BRAF-mutant FLCs that had or had not been treated with the BRAF inhibitor GDC-0879 (GDC). Both WT and BRAF-mutant CMs displayed significantly reduced cellular area after exposure to conditioned media taken from BRAF-mutant FLCs treated with GDC (p = 0.01 and p = 0.0006, respectively) (Figures S7A and S7B).
To demonstrate whether activated BRAF was sufficient to induce CM hypertrophy, we overexpressed BRAF T599R cDNA in WT hiPSCs (WT-T599R). The presence of mutant cDNA was confirmed by Sanger sequencing, and increased expression of BRAF was confirmed by qPCR (Figure S7C). Compared with conditioned media from WT FLCs expressing only an empty vector, exposure to conditioned media from WT-T599R FLCs induced significantly increased cellular area (p = 0.02) and expression of ANP and BNP in WT CMs. Expression of those genes reached levels similar to those observed with BRAF-mutant CMs exposed to BRAF-mutant FLC conditioned media (Figures S7D–S7F). The largest enlargement in cellular area was observed in WT-T599R CMs exposed to WT-T599R FLC conditioned media (p < 0.0001). These data suggest that overactivation of BRAF and the RAS/MAPK pathway can engender CM hypertrophy.
Discussion
In this study we have shown that activating BRAF mutations leading to increased RAS/MAPK pathway signaling induce a hypertrophic phenotype in hiPSC-derived CMs. While BRAF-mutant CMs display intrinsic defects in Ca2+ handling, several aspects of their phenotype require paracrine TGFβ secretion by activated, pro-fibrotic BRAF-mutant FLCs. Inhibition of TGFβ or RAS/MAPK signaling rescues the hypertrophic phenotype. Interestingly, while patient 3 did not show clinical evidence of HCM, we detected underlying defects indistinguishable from those in patients 1 and 2, both diagnosed with HCM. Similar subclinical pathology has been demonstrated in other hiPSC models of HCM (Lan et al., 2013). However, it is also possible that more complex factors active in 3D multi-organ systems such as hemodynamic load, which are inadequately modeled using the 2D hiPSC system, may play a role in disease progression. We recently generated a 3D human engineered cardiac tissue (hECT) model, in which BRAF-mutant hECTs displayed increased twitch force and contraction and relaxation rates, and a lower excitation threshold compared with WT (Cashman et al., 2016). In the future, these hECT models may be helpful for investigating more complex factors such as tissue perfusion, flow dynamics, and mechanical stress, to enable higher-fidelity physiologic measurements of muscle function.
Some aspects of the intrinsic CM phenotype we document have been associated with enhanced cellular maturation in culture, including organized sarcomeres and increased cellular area (Yang et al., 2014). However, matured stem cell-derived CMs develop into elongated rods with myofibrils arranged parallel to the long axis of the cell, and do not display the irregular, generalized increase in cellular area that we observed. In addition, immature derived CMs possess sophisticated excitation-contraction coupling and do not display increased Ca2+ transient amplitude, irregularity, or increased SR Ca2+ stores upon maturation (Lundy et al., 2013). Although genotype-specific influences on CM maturation may contribute to the CM phenotype, the HCM phenotype we observe in its totality cannot be attributed to them. In addition, the variations in cardiac differentiation efficiencies we document do not segregate WT and mutant populations and are unrelated to CM maturation, as SIRPα expression is detected in stem cell-derived CMs between days 7 and 8 of differentiation (Dubois et al., 2011).
Our data also reveal variability in behavior among hiPSC lines (Figures 2, 3, and 4), often attributed to variations that occur during re-programming (Toivonen et al., 2013) and to distinct genetic backgrounds. This variability cannot be attributed to a single cell line and is not replicated across distinct experiments. To strengthen our conclusions, we have utilized six independent patient samples and provided inhibitory and overexpression studies, which support our claims.
To date, hiPSC models for cardiac disease have utilized mixed cell populations (Lan et al., 2013, Zanella et al., 2014), obscuring possible contributions of neighboring cells to the disease phenotype. Here, we developed an effective dual-purification method to study cell interactions underpinning human HCM. By combining CM and non-CM markers, we increased hiPSC-derived CM purity from <70% (Dubois et al., 2011) to >95% while simultaneously purifying the non-CM fraction. While CD90 is a well-described marker for human fibroblasts (Kisselbach et al., 2009), it has also been shown to label stem cells, lymphocytes, neurons, and activated endothelial cells (Herrera-Molina et al., 2013). As CM differentiation protocols direct mesodermal lineage formation (Mummery et al., 2012), robust stem cell differentiation into many of these cell types is unlikely. The expression of multiple fibroblast- and fibrosis-associated genes in CD90+ cells supports their likely identity as FLCs.
The importance of the interaction between fibroblasts and CMs in cardiac hypertrophy has been previously demonstrated. In neonatal rat and mouse CMs, hypertrophy was dependent on exposure to fibroblasts or their conditioned media, and was mediated by fibroblast paracrine TGFβ1 release (Fredj et al., 2005, Gray et al., 1998). AngII induces a pro-fibrotic phenotype in fibroblasts, stimulating proliferation, collagen synthesis, and extracellular matrix proteins (Bouzegrhane and Thibault, 2002), mediated by upregulation and secretion of various factors including TGFβ (Kawano et al., 2000). In vivo, the hypertrophic response to AngII treatment or pressure overload was dependent on TGFβ signaling (Kuwahara et al., 2002, Schultz Jel et al., 2002). In these models, exogenous stimuli were utilized to induce cardiac hypertrophy, a phenomenon distinct from HCM. Here, we have shown in a human HCM model due to elevated RAS/MAPK signaling that paracrine TGFβ signaling from FLCs to CMs directly stimulates the hypertrophic response. Indeed, it has been shown that AngII stimulates TGFβ synthesis in cardiac fibroblasts through activation of the MAPK substrate ELK-1 in humans (Kawano et al., 2000). In a mouse model of familial HCM due to αMHC mutations, cardiac fibrosis was mediated by non-myocyte proliferation and TGFβ signaling (Teekakirikul et al., 2010). In this model, mutant CMs were shown to activate the non-myocyte population, which then contributed to fibrosis. The ability of activated fibroblasts to directly stimulate cardiac hypertrophy, in addition to their well-known role in fibrosis, may be conserved in other etiologies of HCM, although the mechanism of fibroblast activation may be different.
Inhibition of TGFβ abolished the ability of BRAF-mutant FLCs to induce CM hypertrophy, suggesting that TGFβ inhibition may provide therapeutic benefit to CFCS patients with HCM. Few pre-clinical and clinical studies have demonstrated therapeutic efficacy of TGFβ inhibition in HCM. In mice with sarcomeric mutations, TGFβ pathway inhibition prior to or after the onset of HCM normalized several pathological features, such as non-myocyte proliferation, pro-fibrotic gene expression (Teekakirikul et al., 2010), and interstitial fibrosis (Lim et al., 2001). In small clinical studies, patients with existing HCM treated with losartan exhibited improved diastolic function (Araujo et al., 2005), decreased ventricular mass, and reduced fibrosis (Shimada et al., 2013). These studies suggest a potential therapeutic role for TGFβ inhibition in HCM due to various etiologies. Our work also directly implicates activation of the RAS/MAPK pathway in HCM, as inhibition of MEK or BRAF rescued the hypertrophic phenotype while overexpression of activated BRAF induced CM hypertrophy. While there has been no clinical trial conducted to assess the effect of MEK inhibition on hypertrophy in RASopathy patients, MEK inhibition has been associated with an extensive side-effect profile in humans (Akinleye et al., 2013). More work is necessary to determine whether TGFβ inhibition would be preferable to MEK inhibition in the treatment of RASopathy-associated HCM, particularly in patients with well-established disease with significant fibrosis.
In summary, we have shown that activation of the RAS/MAPK pathway leads to CM hypertrophy driven by CM autonomous and non-autonomous defects. We describe a potential therapeutic benefit of TGFβ inhibition or RAS/MAPK inhibition for HCM in CFCS patients, for which no curative option exists. TGFβ inhibition may find therapeutic efficacy in patients with HCM of various etiologies.
Experimental Procedures
hiPSC Generation and Maintenance
BRAF1 dermal fibroblasts were obtained from an 18-year-old female with HCM. BRAF1 hiPSCs were generated using retroviral pMX-based vectors encoding human OCT3/4, SOX2, KLF4, and c-MYC as previously published (Carvajal-Vergara et al., 2010) with modifications. Retrovirus was added to fibroblasts 24 and 48 hr after plating. After day 4 the medium was changed every 2 days, and hESC-like colonies were isolated after 30 days. BRAF2 and BRAF3 dermal fibroblasts were obtained from a 13-year-old female with HCM and a 2-year-old male without evidence of HCM, respectively. BRAF2 and BRAF3 hiPSC lines were generated using episomal-based vectors as previously described (Okita et al., 2011), with modifications. One microgram of each plasmid pCXLE-hOCT3/4-shp53-F, pCXLE-hSK, pCXLE-hUL, and pCXLE-EGFP (Addgene) was mixed with Resuspension Buffer R (Life Technologies) and added to fibroblasts. Cells were electroporated using the Neon Transfection System (Life Technologies), re-plated, and placed at 37°C. After 5 days, fibroblasts were plated on MEFs and maintained in hiPSC medium. Clones were chosen based on morphology and growth. Pluripotency was verified by immunofluorescence, gene expression, southern blot, and teratoma formation or in vitro tri-lineage differentiation assays. Fully characterized retrovirally generated WT hiPSC lines were separately provided.
Human Fetal Heart and Immortalized Dermal Skin Fibroblast Samples
All samples were obtained according to the ethical guidelines provided by the institutional review board. Human fetal heart was dissociated in 1 mg/mL collagenase B (Roche) for 3 hr at 37°C and the centrifuged pellet resuspended in PBS + 0.1% BSA. Human dermal fibroblasts were immortalized using hTERT lentivirus with 6 μg/mL polybrene. After 2 days, cells were selected with 10 μg/mL blasticidin. Drug-resistant colonies were maintained in 10 μg/mL blasticidin and expanded for further use.
Southern Blot and Karyotyping
Two micrograms of gDNA from retrovirally generated hiPSCs was digested with BglII, separated on a 0.8% agarose gel, transferred to a positively charged nylon membrane, and hybridized with DIG-labeled human OCT4, SOX2, KLF4, and MYC cDNA probes. Membranes were washed, blocked, and incubated with anti-DIG-AP Fab fragments (Roche). Probe-target hybrids were incubated with chemiluminescent CDP-Star substrates (Roche) and detected by exposure to X-ray film. For karyotyping, hiPSCs were plated on Matrigel-coated glass coverslip dishes (MatTek), and karyotyping was performed as previously described (Carvajal-Vergara et al., 2010).
In Vitro Three-Germ-Layer Differentiation
hiPSCs generated with episomal vectors were differentiated into three germ layers in vitro using the d-Stem Tri-lineage Differentiation Kit (MicroStem) according to the manufacturer's instructions. hiPSCs were plated on matrix-coated 96-well plates, and day-1 medium was added after 24 hr. Cells were maintained for 3 days (mesoderm) or 6 days (endoderm, ectoderm) at 37°C before fixation. hiPSCs were stained with provided primary antibodies Brachyury (mesoderm), Sox17 (endoderm), or Sox1 (ectoderm) and corresponding Alexa Fluor secondary antibody.
Teratomas
Animal procedures were performed in accordance with the Icahn School of Medicine at Mount Sinai's Institutional Animal Care and Use Committee. Cells (1–2 × 10⁶) were injected subcutaneously into the right hind leg of immunocompromised NOD-SCID mice (The Jackson Laboratory). Six to ten weeks after injection teratomas were excised, fixed in formalin, embedded in paraffin, sectioned, and stained with H&E by the Histology Service Core Facility at the Icahn School of Medicine at Mount Sinai. Histological evaluation was performed using a Nikon TE2000-U microscope and ACT-1 software.
Mutation Analysis and Sequencing
hiPSC gDNA was purified using the DNeasy Blood & Tissue Kit (Qiagen). PCR amplification of exons 6 and 15 was performed using primers listed in Table S2. Bioedit Sequence Alignment Editor version 7.0.5.3 was used for sequencing analysis.
hiPSC Differentiation
hiPSCs were differentiated as previously described (Carvajal-Vergara et al., 2010) with the following modifications. hiPSCs were cultured on Matrigel-coated plates for 2 days for feeder depletion. For generation of EBs, hiPSCs were dissociated with 1 mg/mL collagenase B (Roche) for 15 min. Cell clumps were centrifuged at 200 × g for 2 min, and resuspended to clusters of 50–100 cells in differentiation medium containing StemPro 34 (Life Technologies), 2 mM L-glutamine (Life Technologies), 4 × 10⁻⁴ M monothioglycerol (Sigma), 50 μg/mL ascorbic acid (Sigma), and 150 μg/mL transferrin (Roche). EBs were maintained in 6-well ultra-low attachment plates (Corning) at 37°C in 5% CO2, 5% O2, and 90% N2. Differentiation medium was supplemented with 10 ng/mL BMP4 (R&D Systems) (day 0), 10 ng/mL BMP4 (R&D Systems) and 15 ng/mL Activin A (Peprotech) (day 1), and 1.5 μM IWR-1 (Sigma) (day 4). After day 8, the medium was changed every 5 days to medium without supplements. EBs were prepared for cell sorting on day 25 of differentiation.
Flow Cytometry
EBs were dissociated in 1 mg/mL collagenase B (Roche) overnight at 37°C. CMs were stained with 1:500 anti-human SIRPα-PE/Cy7 (BioLegend #323807) and 1:250 anti-human CD90-FITC (BD Pharmingen #555595) for 1 hr at 4°C in PBS + 10% FBS staining buffer. Gates were set using appropriate isotype control antibodies (Biolegend #400125, BD Pharmingen #MOPC-31C). Sorting was performed on an AriaII cell sorter (BD Biosciences). For determination of CM purity, dissociated single cells were fixed and stained with mouse-anti-human cTNT (Thermo Fisher Scientific #MA5-12960) conjugated to Alexa Fluor 488 in vitro using the Zenon Mouse IgG Labeling Kit (Life Technologies), according to the manufacturer's instructions. Cells were analyzed on an LSR-II flow cytometer (BD Biosciences). Data were analyzed using FlowJo software, Version 9.3.2.
Immunocytochemistry
Single cells were cultured on Matrigel-coated tissue culture plates (Falcon), fixed in 4% paraformaldehyde for 15 min at 25°C, and incubated with primary antibodies anti-human cTNT (1:100, Thermo Fisher #MA5-12960) and SSEA4 (1:25, Developmental Studies Hybridoma Bank #MC-813-70) in 0.01% Triton permeabilization buffer overnight at 4°C. Secondary antibodies were goat anti-mouse Alexa Fluor 488 or 594 (1:400, Life Technologies #A-11001, #A-11032). Cells were stained with DAPI (1:1,000) for 20 min at 25°C. Fluorescence was detected on the EVOS FL digital inverted fluorescent microscope (Life Technologies).
Cellular Size and Sarcomeric Organization
Single cells were analyzed 4 days after sorting. The 2D cellular area of CMs was determined using ImageJ software by manual outlining of single cTNT+ cells. The 3D cellular area was quantified using the mean fluorescence intensity of the FSC channel in SIRPα+/CD90− cells using FlowJo software, version 9.3.2. Sarcomeric organization was defined as the presence of a striated pattern of cTNT immunofluorescence in >50% of the cellular area, indicating the development of organized contractile filaments. Measurements were blinded and replicated by several independent observers.
Gene Expression
Total RNA was extracted using TRIzol (Life Technologies) and RNeasy Plus mini kit (Qiagen). Total RNA was reverse transcribed using oligo(dT) primers with the Superscript II Synthesis Kit (Life Technologies). qPCR was performed using Fast SYBR Green Master Mix (Applied Biosystems) according to the manufacturer's instructions. Expression levels were calculated using the ΔΔCt method and normalized to GAPDH. Real-time qPCR was performed on a StepOne Plus Real-Time PCR System (Applied Biosystems) and analyzed with the StepOne Software v2.2.2. Primers used in qPCR assays are listed in Table S2.
Calcium Transient Analysis
Ca2+ transients were recorded from CMs 7 days post sorting. Cells were loaded with the Ca2+ indicator fluo-3-AM (acetomethoxy form) at 10 μM for 30 min and de-esterified. Cells were superfused with Tyrode's solution containing 140 mM NaCl, 5.4 mM KCl, 10 mM HEPES, 1 mM NaH2PO4, 1 mM MgCl2, 2 mM CaCl2, and 5 mM glucose (pH 7.4). Fluorescence was recorded by a confocal microscope. CMs were paced to steady state at 1 Hz, and transients recorded at 37°C using the line-scan mode of the microscope. Irregularity was defined as the percentage of transients with extra peaks. For SR Ca2+ content, cells were exposed to 20 mM caffeine. Recordings were processed and analyzed using custom MATLAB scripts.
Immunoblotting
Single cells were plated on Matrigel-coated tissue-culture plates. hiPSCs were treated with 10 ng/mL EGF for 0, 5, 15, 30, or 60 min at 37°C, and purified CMs or FLCs were treated with 10 ng/mL AngII for 0 or 15 min at 37°C. Cells were lysed in RIPA buffer supplemented with protease and phosphatase inhibitors. Protein concentration was determined with a Pierce BCA Protein Assay Kit using a BSA standard (Thermo Scientific). Twenty micrograms of protein was separated on 4%–20% SDS-PAGE gels and transferred to polyvinylidene fluoride membranes. Blots were probed with antibodies to p-ERK1/2 T202/Y204 (#4370), ERK1/2 (#4695), pAKT S473 (#4060), AKT (#4691), and GAPDH (#5174) (all 1:2000, Cell Signaling Technology) overnight at 4°C. Blots were washed in PBS with Tween 20 and incubated with horseradish peroxidase-coupled secondary antibody for 1 hr at 25°C. Blots were developed using SuperSignal Extended Duration Chemiluminescent Substrate (Thermo Scientific).
TGFβ ELISA
Secretion of total and active TGFβ into conditioned medium was quantified using ELISA assays according to the manufacturer's instructions (BosterBio). rhTGFβ (R&D systems #240-B-002) was used for the standards. For active TGFβ levels, conditioned medium was incubated with 1 N HCl and 1.2 N NaOH/0.5 M HEPES. Samples and standards were added to TGFβ monoclonal antibody pre-coated 96-well plates and incubated for 90 min at 37°C. Biotinylated antibodies were added and incubated at 37°C for 1 hr. After washing with 0.01 M PBS, ABC working solution was added and incubated at 37°C for 30 min. After washing, TMB color developing agent was added and the plate incubated at 37°C in the dark for 30 min. TMB stop solution was added and the OD absorbance at 450 nm was recorded in a microplate reader (Promega).
Co-culture and Conditioned Media Studies
For co-culture studies, cells were mixed and re-plated on Matrigel-coated tissue-culture plates at a ratio of 60% FLCs/40% CMs in basic differentiation medium and fixed after 4 days. For conditioned media studies, 2.5 × 10⁴ purified CMs and 105 purified FLCs were re-plated separately on Matrigel-coated 24-well tissue-culture dishes in basic differentiation medium. GDC-0897 (SelleckChem) or DMSO at 10 μM was added to FLCs for 4 days. Conditioned medium was then collected from FLCs and added to CMs. Ten micrograms of TGFβ-NA (R&D Systems #MAB1835) was incubated with FLC conditioned medium for 90 min prior to CM exposure. U0126 (Promega) or DMSO at 5 μM was added directly to co-cultured cells. After an additional 4 days, CMs were fixed to analyze cell area and gene expression. Ca2+ transients were analyzed 5 days after U0126 treatment. For analysis of the direct effect of TGFβ on cell size, purified CMs were plated at 2.5 × 10⁴ cells per well and treated with either 1 ng/mL rhTGFβ or 10 ng/mL TGFβ-NA, and cell size was analyzed after 4 days.
Proliferation Analysis
Cells were resuspended in PBS at 106 cells/mL. One microliter of reconstituted LIVE/DEAD Fixable Blue stain (Life Technologies) was added to the cells at 25°C for 30 min in the dark. Cells were fixed and stained with 5 μL of Alexa Fluor 647 mouse anti-human Ki-67 (BD Pharmingen #561126) for 30 min at 25°C in the dark and analyzed on an LSR-II flow cytometer (BD Biosciences).
Lentiviral Overexpression
The pSIN-EF2-LIN28-PURO transfer plasmid (Addgene #16580) was used for lentiviral production. LIN28 coding region was removed by restriction enzyme digestion and replaced with BRAF T599R cDNA or nothing (empty vector). Packaging plasmid pCMV-dR8.2-dvpr (Addgene #8455) and envelope plasmid pCMV-VSV-G (Addgene #8454) were used for subsequent viral production. HEK293T cells were transfected with transfer, packaging, and envelope plasmids using the Superfect Transfection Reagent (Qiagen), and maintained at 37°C. At 48 and 72 hr post transfection, medium containing viral particles was collected and used for two rounds of infection of WT1 and WT2 iPSC lines. Clones were selected by puromycin resistance and verified for viral integration via PCR, Sanger sequencing, and qPCR for overexpression of BRAF.
Statistics
The t test was used for single comparisons. One-way ANOVA was used for multiple comparisons, with individual differences analyzed by Tukey's or Dunnett's post test. p Values <0.05 were considered statistically significant. The number of asterisks indicates the significance level: ∗p < 0.05, ∗∗p < 0.01, ∗∗∗p < 0.001, and ∗∗∗∗p < 0.0001. Data are presented as means ± SEM. Box-and-whisker plots show the median to the first and third quartiles and the minimum and maximum values.
Acknowledgments
We thank Sunita D'Souza and the Icahn School of Medicine at Mount Sinai Stem Cell Core Facility for their technical assistance and donation of WT hiPSC lines. We thank Deepak Srivastava for the donation of WT hiPSC lines. We thank Keren Messing-Guy for her assistance with subject recruitment, and Wandong Zhang, Erika Yeh, and Zhi Yong Wu for generating the BRAF2 and BRAF3 hiPSC lines. We thank Huaising Cindy Ko for technical assistance, and Nihir Patel and Allan Just for help with data visualization. This work was supported by grants from the Empire State Stem Cell Fund through New York State Department of Health (NYSTEM) (N08T-020) and the NIH (RO1 HL113499) to B.D.G., and the American Heart Association (12PRE12060254) to R.J. Additional funding was provided by the NIH (RO1 HL076230 to E.A.S, DP2 OD007449 to L.A.W., and 5RO1AR062165 to K.A.R.).
Published: August 25, 2016
Footnotes
Supplemental Information includes Supplemental Experimental Procedures, seven figures, and two tables and can be found with this article online at http://dx.doi.org/10.1016/j.stemcr.2016.07.018.
Supplemental Information
References
- Akinleye A., Furqan M., Mukhi N., Ravella P., Liu D. MEK and the inhibitors: from bench to bedside. J. Hematol. Oncol. 2013;6:27. doi: 10.1186/1756-8722-6-27. [DOI] [PMC free article] [PubMed] [Google Scholar]
- Andreadi C., Cheung L.K., Giblett S., Patel B., Jin H., Mercer K., Kamata T., Lee P., Williams A., McMahon M. The intermediate-activity (L597V)BRAF mutant acts as an epistatic modifier of oncogenic RAS by enhancing signaling through the RAF/MEK/ERK pathway. Genes Dev. 2012;26:1945–1958. doi: 10.1101/gad.193458.112. [DOI] [PMC free article] [PubMed] [Google Scholar]
- Aoki H., Sadoshima J., Izumo S. Myosin light chain kinase mediates sarcomere organization during cardiac hypertrophy in vitro. Nat. Med. 2000;6:183–188. doi: 10.1038/72287. [DOI] [PubMed] [Google Scholar]
- Araujo A.Q., Arteaga E., Ianni B.M., Buck P.C., Rabello R., Mady C. Effect of Losartan on left ventricular diastolic function in patients with nonobstructive hypertrophic cardiomyopathy. Am. J. Cardiol. 2005;96:1563–1567. doi: 10.1016/j.amjcard.2005.07.065. [DOI] [PubMed] [Google Scholar]
- Armour C.M., Allanson J.E. Further delineation of cardio-facio-cutaneous syndrome: clinical features of 38 individuals with proven mutations. J. Med. Genet. 2008;45:249–254. doi: 10.1136/jmg.2007.054460. [DOI] [PubMed] [Google Scholar]
- Baker D.L., Hashimoto K., Grupp I.L., Ji Y., Reed T., Loukianov E., Grupp G., Bhagwhat A., Hoit B., Walsh R. Targeted overexpression of the sarcoplasmic reticulum Ca2+-ATPase increases cardiac contractility in transgenic mouse hearts. Circ. Res. 1998;83:1205–1214. doi: 10.1161/01.res.83.12.1205. [DOI] [PubMed] [Google Scholar]
- Bouzegrhane F., Thibault G. Is angiotensin II a proliferative factor of cardiac fibroblasts? Cardiovasc. Res. 2002;53:304–312. doi: 10.1016/s0008-6363(01)00448-5. [DOI] [PubMed] [Google Scholar]
- Bueno O.F., De Windt L.J., Tymitz K.M., Witt S.A., Kimball T.R., Klevitsky R., Hewett T.E., Jones S.P., Lefer D.J., Peng C.F. The MEK1-ERK1/2 signaling pathway promotes compensated cardiac hypertrophy in transgenic mice. EMBO J. 2000;19:6341–6350. doi: 10.1093/emboj/19.23.6341. [DOI] [PMC free article] [PubMed] [Google Scholar]
- Camelliti P., Borg T.K., Kohl P. Structural and functional characterisation of cardiac fibroblasts. Cardiovasc. Res. 2005;65:40–51. doi: 10.1016/j.cardiores.2004.08.020. [DOI] [PubMed] [Google Scholar]
- Carvajal-Vergara X., Sevilla A., D'Souza S.L., Ang Y.S., Schaniel C., Lee D.F., Yang L., Kaplan A.D., Adler E.D., Rozov R. Patient-specific induced pluripotent stem-cell-derived models of LEOPARD syndrome. Nature. 2010;465:808–812. doi: 10.1038/nature09005. [DOI] [PMC free article] [PubMed] [Google Scholar]
- Cashman T.J., Josowitz R., Johnson B.V., Gelb B.D., Costa K.D. Human engineered cardiac tissues created using induced pluripotent stem cells reveal functional characteristics of BRAF-mediated hypertrophic cardiomyopathy. PLoS One. 2016;11:e0146697. doi: 10.1371/journal.pone.0146697. [DOI] [PMC free article] [PubMed] [Google Scholar]
- Delbridge L.M., Satoh H., Yuan W., Bassani J.W., Qi M., Ginsburg K.S., Samarel A.M., Bers D.M. Cardiac myocyte volume, Ca2+ fluxes, and sarcoplasmic reticulum loading in pressure-overload hypertrophy. Am. J. Physiol. 1997;272:H2425–H2435. doi: 10.1152/ajpheart.1997.272.5.H2425. [DOI] [PubMed] [Google Scholar]
- Dubois N.C., Craft A.M., Sharma P., Elliott D.A., Stanley E.G., Elefanty A.G., Gramolini A., Keller G. SIRPA is a specific cell-surface marker for isolating cardiomyocytes derived from human pluripotent stem cells. Nat. Biotechnol. 2011;29:1011–1018. doi: 10.1038/nbt.2005. [DOI] [PMC free article] [PubMed] [Google Scholar]
- Fredj S., Bescond J., Louault C., Potreau D. Interactions between cardiac cells enhance cardiomyocyte hypertrophy and increase fibroblast proliferation. J. Cell Physiol. 2005;202:891–899. doi: 10.1002/jcp.20197. [DOI] [PubMed] [Google Scholar]
- Fujiu K., Nagai R. Fibroblast-mediated pathways in cardiac hypertrophy. J. Mol. Cell Cardiol. 2014;70C:64–73. doi: 10.1016/j.yjmcc.2014.01.013. [DOI] [PubMed] [Google Scholar]
- Gray M.O., Long C.S., Kalinyak J.E., Li H.T., Karliner J.S. Angiotensin II stimulates cardiac myocyte hypertrophy via paracrine release of TGF-beta 1 and endothelin-1 from fibroblasts. Cardiovasc. Res. 1998;40:352–363. doi: 10.1016/s0008-6363(98)00121-7. [DOI] [PubMed] [Google Scholar]
- Harris I.S., Zhang S., Treskov I., Kovacs A., Weinheimer C., Muslin A.J. Raf-1 kinase is required for cardiac hypertrophy and cardiomyocyte survival in response to pressure overload. Circulation. 2004;110:718–723. doi: 10.1161/01.CIR.0000138190.50127.6A. [DOI] [PubMed] [Google Scholar]
- Harris K.M., Spirito P., Maron M.S., Zenovich A.G., Formisano F., Lesser J.R., Mackey-Bojack S., Manning W.J., Udelson J.E., Maron B.J. Prevalence, clinical profile, and significance of left ventricular remodeling in the end-stage phase of hypertrophic cardiomyopathy. Circulation. 2006;114:216–225. doi: 10.1161/CIRCULATIONAHA.105.583500. [DOI] [PubMed] [Google Scholar]
- Heineke J., Molkentin J.D. Regulation of cardiac hypertrophy by intracellular signalling pathways. Nat. Rev. Mol. Cell Biol. 2006;7:589–600. doi: 10.1038/nrm1983. [DOI] [PubMed] [Google Scholar]
- Herrera-Molina R., Valdivia A., Kong M., Alvarez A., Cardenas A., Quest A.F., Leyton L. Thy-1-interacting molecules and cellular signaling in cis and trans. Int. Rev. Cell Mol. Biol. 2013;305:163–216. doi: 10.1016/B978-0-12-407695-2.00004-4. [DOI] [PubMed] [Google Scholar]
- Hunter J.J., Tanaka N., Rockman H.A., Ross J., Jr., Chien K.R. Ventricular expression of a MLC-2v-ras fusion gene induces cardiac hypertrophy and selective diastolic dysfunction in transgenic mice. J. Biol. Chem. 1995;270:23173–23178. doi: 10.1074/jbc.270.39.23173. [DOI] [PubMed] [Google Scholar]
- Kawano H., Do Y.S., Kawano Y., Starnes V., Barr M., Law R.E., Hsueh W.A. Angiotensin II has multiple profibrotic effects in human cardiac fibroblasts. Circulation. 2000;101:1130–1137. doi: 10.1161/01.cir.101.10.1130. [DOI] [PubMed] [Google Scholar]
- Kisselbach L., Merges M., Bossie A., Boyd A. CD90 Expression on human primary cells and elimination of contaminating fibroblasts from cell cultures. Cytotechnology. 2009;59:31–44. doi: 10.1007/s10616-009-9190-3. [DOI] [PMC free article] [PubMed] [Google Scholar]
- Koitabashi N., Danner T., Zaiman A.L., Pinto Y.M., Rowell J., Mankowski J., Zhang D., Nakamura T., Takimoto E., Kass D.A. Pivotal role of cardiomyocyte TGF-beta signaling in the murine pathological response to sustained pressure overload. J. Clin. Invest. 2011;121:2301–2312. doi: 10.1172/JCI44824. [DOI] [PMC free article] [PubMed] [Google Scholar]
- Konno T., Chang S., Seidman J.G., Seidman C.E. Genetics of hypertrophic cardiomyopathy. Curr. Opin. Cardiol. 2010;25:205–209. doi: 10.1097/HCO.0b013e3283375698. [DOI] [PMC free article] [PubMed] [Google Scholar]
- Kuwahara F., Kai H., Tokuda K., Kai M., Takeshita A., Egashira K., Imaizumi T. Transforming growth factor-beta function blocking prevents myocardial fibrosis and diastolic dysfunction in pressure-overloaded rats. Circulation. 2002;106:130–135. doi: 10.1161/01.cir.0000020689.12472.e0. [DOI] [PubMed] [Google Scholar]
- Kuwahara K., Saito Y., Takano M., Arai Y., Yasuno S., Nakagawa Y., Takahashi N., Adachi Y., Takemura G., Horie M. NRSF regulates the fetal cardiac gene program and maintains normal cardiac structure and function. EMBO J. 2003;22:6310–6321. doi: 10.1093/emboj/cdg601. [DOI] [PMC free article] [PubMed] [Google Scholar]
- Lan F., Lee A.S., Liang P., Sanchez-Freire V., Nguyen P.K., Wang L., Han L., Yen M., Wang Y., Sun N. Abnormal calcium handling properties underlie familial hypertrophic cardiomyopathy pathology in patient-specific induced pluripotent stem cells. Cell Stem Cell. 2013;12:101–113. doi: 10.1016/j.stem.2012.10.010. [DOI] [PMC free article] [PubMed] [Google Scholar]
- Lim D.S., Lutucuta S., Bachireddy P., Youker K., Evans A., Entman M., Roberts R., Marian A.J. Angiotensin II blockade reverses myocardial fibrosis in a transgenic mouse model of human hypertrophic cardiomyopathy. Circulation. 2001;103:789–791. doi: 10.1161/01.cir.103.6.789. [DOI] [PMC free article] [PubMed] [Google Scholar]
- Lundy S.D., Zhu W.Z., Regnier M., Laflamme M.A. Structural and functional maturation of cardiomyocytes derived from human pluripotent stem cells. Stem Cells Dev. 2013;22:1991–2002. doi: 10.1089/scd.2012.0490. [DOI] [PMC free article] [PubMed] [Google Scholar]
- Marin T.M., Keith K., Davies B., Conner D.A., Guha P., Kalaitzidis D., Wu X., Lauriol J., Wang B., Bauer M. Rapamycin reverses hypertrophic cardiomyopathy in a mouse model of LEOPARD syndrome-associated PTPN11 mutation. J. Clin. Invest. 2011;121:1026–1043. doi: 10.1172/JCI44972. [DOI] [PMC free article] [PubMed] [Google Scholar]
- Molkentin J.D. Calcineurin-NFAT signaling regulates the cardiac hypertrophic response in coordination with the MAPKs. Cardiovasc. Res. 2004;63:467–475. doi: 10.1016/j.cardiores.2004.01.021. [DOI] [PubMed] [Google Scholar]
- Mummery C.L., Zhang J., Ng E.S., Elliott D.A., Elefanty A.G., Kamp T.J. Differentiation of human embryonic stem cells and induced pluripotent stem cells to cardiomyocytes: a methods overview. Circ. Res. 2012;111:344–358. doi: 10.1161/CIRCRESAHA.110.227512. [DOI] [PMC free article] [PubMed] [Google Scholar]
- Okita K., Matsumura Y., Sato Y., Okada A., Morizane A., Okamoto S., Hong H., Nakagawa M., Tanabe K., Tezuka K. A more efficient method to generate integration-free human iPS cells. Nat. Methods. 2011;8:409–412. doi: 10.1038/nmeth.1591. [DOI] [PubMed] [Google Scholar]
- Purcell N.H., Wilkins B.J., York A., Saba-El-Leil M.K., Meloche S., Robbins J., Molkentin J.D. Genetic inhibition of cardiac ERK1/2 promotes stress-induced apoptosis and heart failure but has no effect on hypertrophy in vivo. Proc. Natl. Acad. Sci. USA. 2007;104:14074–14079. doi: 10.1073/pnas.0610906104. [DOI] [PMC free article] [PubMed] [Google Scholar]
- Rodriguez-Viciana P., Tetsu O., Tidyman W.E., Estep A.L., Conger B.A., Cruz M.S., McCormick F., Rauen K.A. Germline mutations in genes within the MAPK pathway cause cardio-facio-cutaneous syndrome. Science. 2006;311:1287–1290. doi: 10.1126/science.1124642. [DOI] [PubMed] [Google Scholar]
- Schultz Jel J., Witt S.A., Glascock B.J., Nieman M.L., Reiser P.J., Nix S.L., Kimball T.R., Doetschman T. TGF-beta1 mediates the hypertrophic cardiomyocyte growth induced by angiotensin II. J. Clin. Invest. 2002;109:787–796. doi: 10.1172/JCI14190. [DOI] [PMC free article] [PubMed] [Google Scholar]
- Shimada Y.J., Passeri J.J., Baggish A.L., O'Callaghan C., Lowry P.A., Yannekis G., Abbara S., Ghoshhajra B.B., Rothman R.D., Ho C.Y. Effects of losartan on left ventricular hypertrophy and fibrosis in patients with nonobstructive hypertrophic cardiomyopathy. JACC Heart Fail. 2013;1:480–487. doi: 10.1016/j.jchf.2013.09.001. [DOI] [PMC free article] [PubMed] [Google Scholar]
- Sipido K.R., Volders P.G., de Groot S.H., Verdonck F., Van de Werf F., Wellens H.J., Vos M.A. Enhanced Ca(2+) release and Na/Ca exchange activity in hypertrophied canine ventricular myocytes: potential link between contractile adaptation and arrhythmogenesis. Circulation. 2000;102:2137–2144. doi: 10.1161/01.cir.102.17.2137. [DOI] [PubMed] [Google Scholar]
- Tartaglia M., Gelb B.D. Disorders of dysregulated signal traffic through the RAS-MAPK pathway: phenotypic spectrum and molecular mechanisms. Ann. N. Y. Acad. Sci. 2010;1214:99–121. doi: 10.1111/j.1749-6632.2010.05790.x. [DOI] [PMC free article] [PubMed] [Google Scholar]
- Teekakirikul P., Eminaga S., Toka O., Alcalai R., Wang L., Wakimoto H., Nayor M., Konno T., Gorham J.M., Wolf C.M. Cardiac fibrosis in mice with hypertrophic cardiomyopathy is mediated by non-myocyte proliferation and requires TGF-beta. J. Clin. Invest. 2010;120:3520–3529. doi: 10.1172/JCI42028. [DOI] [PMC free article] [PubMed] [Google Scholar]
- Toivonen S., Ojala M., Hyysalo A., Ilmarinen T., Rajala K., Pekkanen-Mattila M., Aanismaa R., Lundin K., Palgi J., Weltner J. Comparative analysis of targeted differentiation of human induced pluripotent stem cells (hiPSCs) and human embryonic stem cells reveals variability associated with incomplete transgene silencing in retrovirally derived hiPSC lines. Stem Cells Transl. Med. 2013;2:83–93. doi: 10.5966/sctm.2012-0047. [DOI] [PMC free article] [PubMed] [Google Scholar]
- Urosevic J., Sauzeau V., Soto-Montenegro M.L., Reig S., Desco M., Wright E.M., Canamero M., Mulero F., Ortega S., Bustelo X.R. Constitutive activation of B-Raf in the mouse germ line provides a model for human cardio-facio-cutaneous syndrome. Proc. Natl. Acad. Sci. USA. 2011;108:5015–5020. doi: 10.1073/pnas.1016933108. [DOI] [PMC free article] [PubMed] [Google Scholar]
- Wan P.T., Garnett M.J., Roe S.M., Lee S., Niculescu-Duvaz D., Good V.M., Jones C.M., Marshall C.J., Springer C.J., Barford D. Mechanism of activation of the RAF-ERK signaling pathway by oncogenic mutations of B-RAF. Cell. 2004;116:855–867. doi: 10.1016/s0092-8674(04)00215-6. [DOI] [PubMed] [Google Scholar]
- Wu X., Simpson J., Hong J.H., Kim K.H., Thavarajah N.K., Backx P.H., Neel B.G., Araki T. MEK-ERK pathway modulation ameliorates disease phenotypes in a mouse model of Noonan syndrome associated with the Raf1(L613V) mutation. J. Clin. Invest. 2011;121:1009–1025. doi: 10.1172/JCI44929. [DOI] [PMC free article] [PubMed] [Google Scholar]
- Yang L., Soonpaa M.H., Adler E.D., Roepke T.K., Kattman S.J., Kennedy M., Henckaerts E., Bonham K., Abbott G.W., Linden R.M. Human cardiovascular progenitor cells develop from a KDR+ embryonic-stem-cell-derived population. Nature. 2008;453:524–528. doi: 10.1038/nature06894. [DOI] [PubMed] [Google Scholar]
- Yang X., Pabon L., Murry C.E. Engineering adolescence: maturation of human pluripotent stem cell-derived cardiomyocytes. Circ. Res. 2014;114:511–523. doi: 10.1161/CIRCRESAHA.114.300558. [DOI] [PMC free article] [PubMed] [Google Scholar]
- Yoon G., Rosenberg J., Blaser S., Rauen K.A. Neurological complications of cardio-facio-cutaneous syndrome. Dev. Med. Child Neurol. 2007;49:894–899. doi: 10.1111/j.1469-8749.2007.00894.x. [DOI] [PubMed] [Google Scholar]
- Zanella F., Lyon R.C., Sheikh F. Modeling heart disease in a dish: from somatic cells to disease-relevant cardiomyocytes. Trends Cardiovasc. Med. 2014;24:32–44. doi: 10.1016/j.tcm.2013.06.002. [DOI] [PMC free article] [PubMed] [Google Scholar]
- Zheng M., Dilly K., Dos Santos Cruz J., Li M., Gu Y., Ursitti J.A., Chen J., Ross J., Jr., Chien K.R., Lederer J.W. Sarcoplasmic reticulum calcium defect in Ras-induced hypertrophic cardiomyopathy heart. Am. J. Physiol. Heart Circ. Physiol. 2004;286:H424–H433. doi: 10.1152/ajpheart.00110.2003. [DOI] [PubMed] [Google Scholar]
Associated Data
This section collects any data citations, data availability statements, or supplementary materials included in this article.