

Abstract
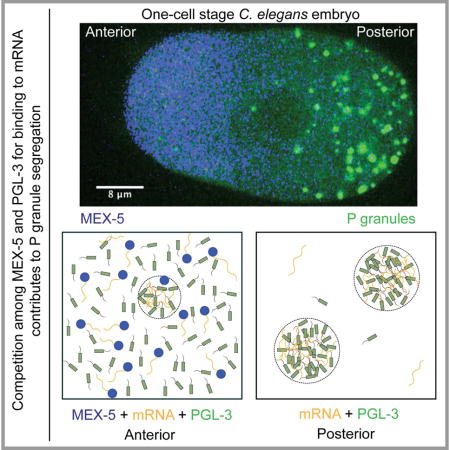
P granules are non-membrane-bound RNA-protein compartments that are involved in germline development in C. elegans. They are liquids that condense at one end of the embryo by localized phase separation, driven by gradients of polarity proteins such as the mRNA-binding protein MEX-5. To probe how polarity proteins regulate phase separation, we combined biochemistry and theoretical modeling. We reconstitute P granule-like droplets in vitro using a single protein PGL-3. By combining in vitro reconstitution with measurements of intracellular concentrations, we show that competition between PGL-3 and MEX-5 for mRNA can regulate the formation of PGL-3 droplets. Using theory we show that in a MEX-5 gradient, this mRNA competition mechanism can drive a gradient of P granule assembly with similar spatial and temporal characteristics to P granule assembly in vivo. We conclude that gradients of polarity proteins can position RNP granules during development, by using RNA competition to regulate local phase separation.
Graphical abstract
Introduction
One of the most intriguing questions in cell biology is how a cell communicates positional information to downstream components, and how it organizes biochemistry in time and space. An example of spatial organization of biochemistry is the asymmetric segregation of components into daughter cells during cell division. A cell first establishes spatial asymmetry by building polarity systems and then communicates this asymmetry to downstream components.
A classic example of polarity-driven segregation of downstream components is the segregation of P granules during the early cell divisions of C. elegans embryos (Brangwynne et al., 2009; Hird et al., 1996; Strome and Wood, 1982). P granules are believed to be equivalent to the nuage in Drosophila or germ granules in other animal cells (Voronina, 2013) and belong to a class of non-membrane-bound compartments that consist of many proteins and RNAs, such as nucleoli (Brangwynne et al., 2011), Cajal bodies (Strzelecka et al., 2010), stress granules (Wippich et al., 2013). Shortly after fertilization, they are distributed throughout the one-cell stage embryo, but then become concentrated at the posterior pole, where they are inherited by the P1 cell after cell division (Strome and Wood, 1982). The subsequent three P cell divisions are also asymmetric, giving rise at each division to a smaller P cell and a larger somatic cell. During each division, P granules segregate into the P cell (Hird et al., 1996), before eventually becoming incorporated in the future germ line, where they contribute to its integrity and function (Updike et al., 2014).
The one-cell stage C. elegans embryo drives P granule segregation through a well-studied polarity system. The embryo first establishes anterior-posterior information by segregating PAR proteins into two cortical domains consisting of PAR-6/PAR-3/PKC in the anterior domain, and PAR-2/LGL/PAR-1 in the posterior domain (Guo and Kemphues, 1996; Hoege and Hyman, 2013). Genetic perturbations suggest that signals from the PAR-1 protein, which is concentrated in the posterior cortical domain and the posterior cytoplasm, dictate the establishment of an anterior-posterior cytoplasmic concentration gradient of two closely related RNA-binding proteins MEX-5 and MEX-6 (Daniels et al., 2010; Griffin et al., 2011; Pagano et al., 2007; Schubert et al., 2000; Tenlen et al., 2008). These gradients are in turn required for segregation of P granules (Brangwynne et al., 2009; Daniels et al., 2010; Gallo et al., 2010; Griffin et al., 2011; Schubert et al., 2000; Tenlen et al., 2008). However, the molecular mechanisms by which MEX-5/6 gradient segregate P granules remains unclear.
A key break through in understanding the segregation of P granules was the discovery that P granules are liquid-like compartments that form by liquid-liquid demixing phase separation from the cytoplasm (Brangwynne et al., 2009). Because they are liquids, P granules have been proposed to segregate by a gradient of phase separation, such that they tend to demix from the cytoplasm at the posterior and mix at the anterior of the embryo (Brangwynne et al., 2009). However, consideration of the physics of phase separation of P granules in a MEX-5/6 gradient is also a more complex process than conventional phase separation (Bray, 1994), because phase separation is taking place in a concentration gradient. Theoretical considerations suggested that local concentrations of MEX-5/6 in the gradient regulate position-dependent phase separation of P granules (Brangwynne et al., 2009; Lee et al., 2013). Further, it is predicted that even weak gradients of the regulator MEX-5/6 can lead to segregation of P granules to the posterior of the embryo (Lee et al., 2013). However, the physical mechanism by which a MEX-5/6 gradient could influence phase separation of P granules remains unclear.
In biological systems, phase separation can be triggered by changing interaction energies among molecular components, for example by phosphorylation (Wang et al., 2014). Alternatively, phase separation can also be triggered by changes in composition that lead to formation of macromolecular complexes with distinct interaction energies. One example of compositional changes that can modulate phase separation of proteins is RNA, which by interacting with proteins, forms protein/RNA macromolecular complexes (Berry et al., 2015; Burke et al., 2015; Lin et al., 2015; Molliex et al., 2015; Schwartz et al., 2013; Wang et al., 2015; Zhang et al., 2015). Recent work on phase separation suggests that RNA is an important component of phase separated compartments: It can trigger their assembly and change their biophysics properties. The fact that MEX-5/6 contain zinc fingers, which mediate interaction with mRNA suggests that mRNA could in someway influence the polarity system.
In this paper, we combine in vitro reconstitution of P granules, in vivo measurements of protein and RNA concentration, and theory to explore the mechanisms by which MEX-5 regulates phase separation of P granules. We show that a single P granule protein, PGL-3, can phase separate to form non-membrane-bound liquid drops in vitro with biophysical properties similar to P granules in vivo. Long messenger RNA molecules bind to PGL-3 protein with low sequence specificity and promote phase separation of PGL-3 drops. MEX-5 can regulate PGL-3 drop formation by competing with PGL-3 for mRNA binding. Using measured values of intracellular concentrations of PGL-3, MEX-5 and mRNA, and their interaction parameters, we use theory to show that a competition mechanism between PGL-3 and MEX-5 for mRNA can account for the MEX-5 gradient-dependent P granule segregation observed in vivo.
Results
PGL-3 forms P granule-like drops in vitro
A recent study has shown that of 14 C. elegans P granule proteins expressed individually in the cytoplasm of mammalian cells (Hanazawa et al., 2011) only two proteins, PGL-1 and PGL-3, formed RNA-containing P granule-like structures. We expressed and purified PGL-3 and PGL-1 tagged to monomeric enhanced green fluorescent protein (mEGFP) from insect cells (Figure 1A). In physiological buffer, purified PGL-3-mEGFP phase separates into two phases: one containing PGL-3 at ~50 fold higher concentration compared to the bulk phase (Figure 1B). PGL-3 also phase separates in absence of the mEGFP tag (Figure S1D). The PGL-3-rich phase is spherical in shape (hereafter called ‘drops’) (Figure 1B), and drops of PGL-3 settle down by gravity indicating that they are denser compared to the surrounding bulk phase (Movie S1). In contrast to PGL-3, no phase separation of PGL-1 was seen in buffer containing physiological level of salt (data not shown).
Figure 1.
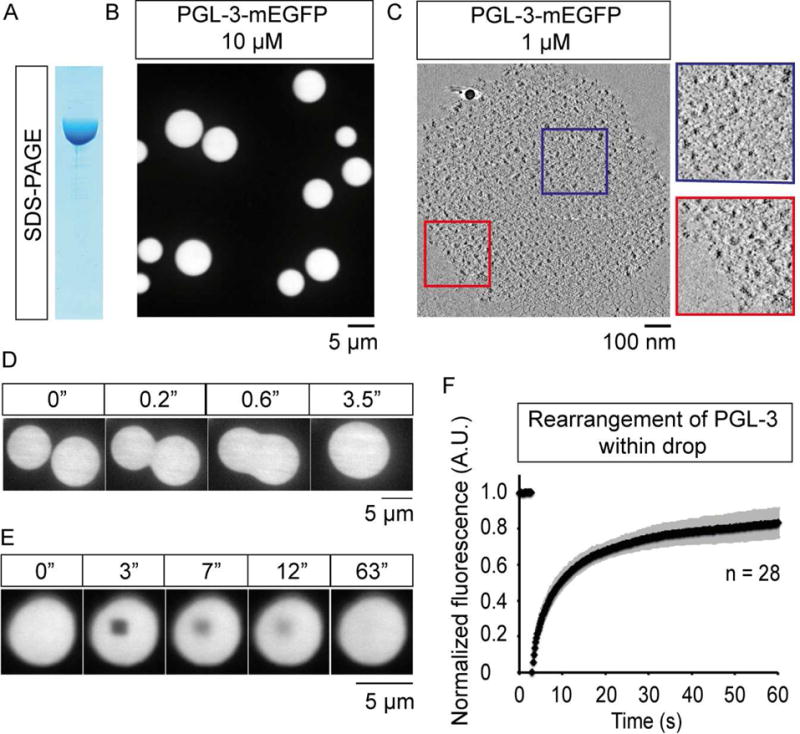
PGL-3 forms liquid-like drops in vitro.
(A) SDS-PAGE of PGL-3-mEGFP expressed and purified from insect cells.
(B) Maximum intensity projection of series of confocal z- slices shows PGL-3-mEGFP at 10 μM phase-separates into drops.
(C) Virtual slice from cryo-electron tomography, 5 nm thick, shows a drop of PGL-3-mEGFP (1 μM). Red and blue boxes show zoomed in view.
(D) Time-lapse single confocal plane micrographs show two PGL-3-mEGFP drops fuse with each other into a single drop within 3.5 s.
(E) Time-lapse single confocal plane micrographs show fluorescence recovery of PGL-3-mEGFP after an internal 1.44 μm × 1.44 μm area is photobleached at 3 s.
(F) Quantification of FRAP data presented in (E), n = 28, error bars represent 1 SD.
See also Figure S1, Movies S1–S2.
Five lines of evidence suggest PGL-3 drops are liquid-like. First, PGL-3 drops are spherical (Figure 1B). Second, PGL-3 drops fuse with each other to generate a larger spherical drop within a few seconds (Figure 1D). Third, PGL-3 molecules intermix rapidly within drops as assayed in fluorescence recovery after photobleaching (FRAP) experiments (Figure 1E–F). Fourth, cryo-electron tomograms show PGL-3 drops are amorphous (Figure 1C). Fifth, the ratio of surface tension and viscosity of PGL-3 drops is ~0.4 s/μm (Figure S1F), close to in vivo estimates for P granules (Brangwynne et al., 2009). Finally, FRAP experiments showed PGL-3 molecules rapidly exchange between drops and the surrounding bulk phase on the order of a few seconds. (Figure S1G–I, Movie S2). Therefore we conclude that PGL-3 can form liquid drops in vitro that are similar in properties to the P granules in vivo.
To test whether PGL-3 forms drops in vitro at concentrations of PGL-3 found in vivo, we measured the concentration of proteins in C. elegans embryonic extracts using label free mass spectrometry. The concentration of ~6000 proteins is shown in table S1 and the concentration of selected P granule proteins is shown in figure 2A. PGL-3 is present at 0.6 μM in these extracts and is among the top 20% most abundant proteins (Figure 2A). When measured in vitro, PGL-3 drops are rare below 0.5 μM and the number of drops and the extent of phase separation increases rapidly in the 0.5–10 μM range (Figures 3D, S1A, S1C). Therefore we conclude that at the in vivo concentration of PGL-3, it is poised close to the threshold for phase separation.
Figure 2.
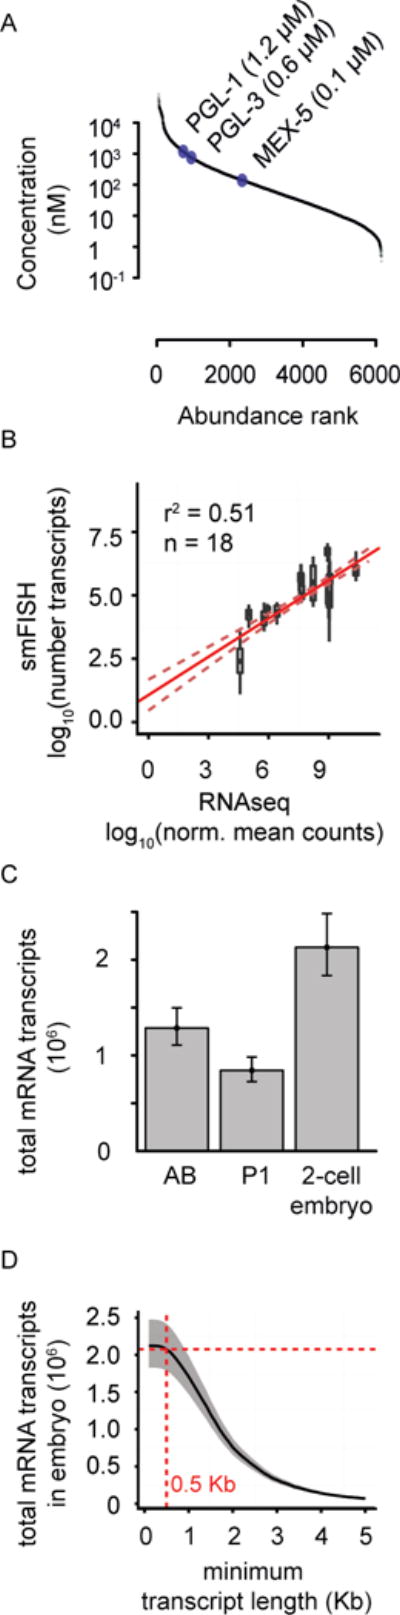
Measurements of intracellular protein and mRNA concentration in C. elegans embryo.
(A) Plot of the concentration and abundance of different proteins measured by mass spectrometry in C. elegans early-embryo extracts.
(B) Correlation plot of RNA-seq intensity values and corresponding smFISH single molecule counts using a dataset of 9 genes in both blastomeres (AB and P1 cells; 18 samples total) (Osborne Nishimura, PLoS Genetics 2015). Red line: Fit using linear regression analysis. Dotted red lines: 95% confidence interval.
(C) Estimates of total mRNA transcripts per blastomere (AB and P1 cells) and for the entire 2-cell embryo are shown. Error bars represent 95% confidence intervals.
(D) Cumulative frequency distribution for minimum lengths of mRNA transcripts in the 2-cell stage embryo (AB and P1 total). Grey shaded areas represent 95% confidence intervals. Red broken lines highlight the total number of mRNA transcripts predicted if only mRNA transcripts longer than 500 bases are included in the estimate.
See also Figure S2, Tables S1–S2.
Figure 3.
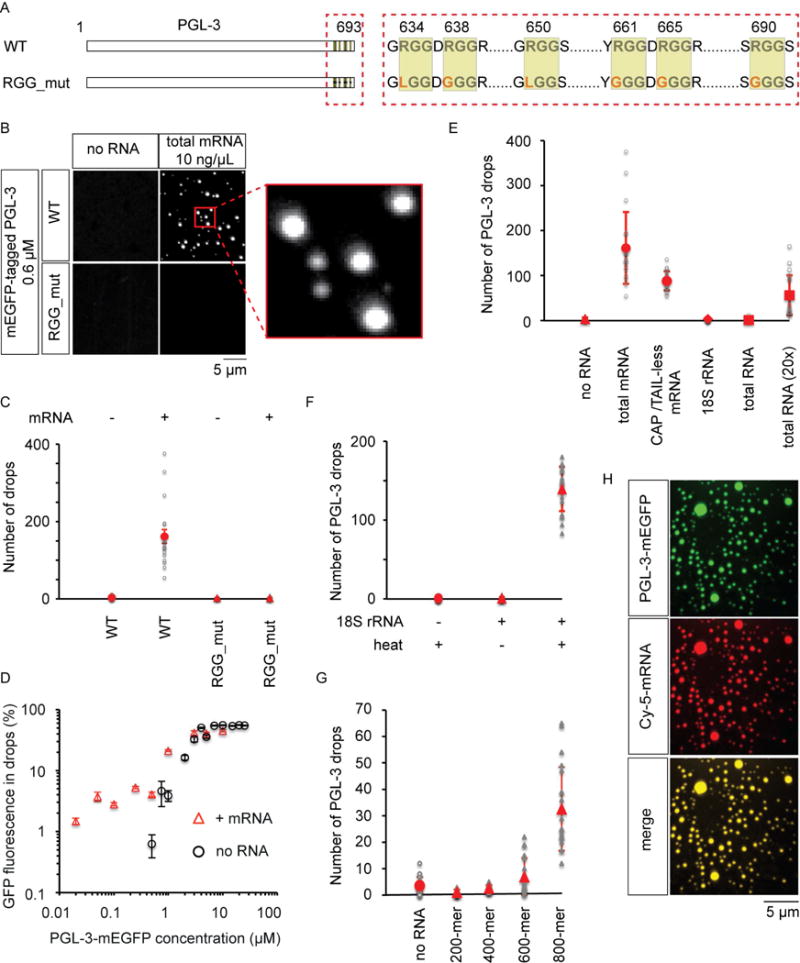
Messenger RNA promotes PGL-3 drop assembly depending on RGG repeats in PGL-3.
(A) Cartoon describing wild-type PGL-3 (WT) and the construct RGG_mut. RGG_mut: PGL-3 construct with arginine in all six RGG repeats (yellow boxes) mutated to either glycine or leucine.
(B) Maximum intensity projection of series of confocal z- slices show drop formation of mEGFP-tagged PGL-3 or RGG_mut (0.6 μM) in presence or absence of 10 ng/μL total C. elegans mRNA. Red box shows zoomed in view of drops.
(C) Quantification of data presented in (B). In each case, 20 observation volumes (41 μm × 41 μm × ~10 μm) were scored. Number of drops observed in each observation volume is represented as a grey circle, or triangle in the plot. The mean is shown in red. Error bars are 1 SEM.
(D) Plot of the fraction of total GFP fluorescence found in phase-separated drops as a function of total PGL-3-mEGFP concentration in presence or absence of 50 ng/μL mouse brain mRNA. For each concentration of PGL-3, drops in ≥12 observation volumes (41 μm × 41 μm × ~10 μm) were scored. Error bars represent 1 SEM among the observation volumes scored.
(E–G) Quantification of the number of PGL-3-mEGFP drops scored under different conditions. In each case, 20 observation volumes (E, G: 41 μm × 41 μm × ~10 μm; F: 71 μm × 71 μm × ~10 μm) were scored. Number of drops observed in each observation volume is represented as a grey triangle, circle, diamond, or square in the plot. The mean is shown in red. Error bars are 1 SD.
(E) Drop assembly on addition of different kinds of RNA to PGL-3-mEGFP (0.6 μM). Triangles: no RNA, circles: total C. elegans mRNA (10 ng/μL), or in vitro transcribed luciferase mRNA lacking 5′ cap and poly(A) tail (10 ng/μL), diamonds: in vitro transcribed 18S C. elegans rRNA (10 ng/μL), squares: total RNA from C. elegans (10 or 200 ng/μL).
(F) Drop assembly on addition of in vitro transcribed 18S rRNA pre-heated at 75 °C for 1 min to PGL-3-mEGFP (0.6 μM). Circles: no RNA (control buffer pre-heated), triangles: 18S rRNA (40 nM) with or without pre-heating.
(G) Drop assembly on addition of fragments of in vitro transcribed luciferase mRNA lacking 5′ cap and poly(A) tail to PGL-3-mEGFP (0.6 μM). Circles: no RNA, triangles: luciferase mRNA fragments 200, 400, 600 or 800 bases long (20 nM).
(H) Maximum intensity projection of series of confocal z- slices show colocalization of PGL-3-mEGFP (0.25 μM) and cyanine-5 labeled luciferase mRNA (3 ng/μL) in drops.
See also Figures S1, S3, S6.
mRNA facilitates drop formation by binding to PGL-3 via RGG repeats
Because P granules contain RNA in vivo (Schisa et al., 2001; Seydoux and Fire, 1994), we looked at the role of RNA in triggering PGL-3 phase separation in vitro. We found that total RNA purified from C. elegans (200 ng/μL) promoted PGL-3 drop assembly (Figures 3E, S3A). However, in vitro transcribed 18S rRNA did not promote assembly of PGL-3 drops over a broad range of concentrations (10–100 ng/μL) (Figures 3E, S3A,D). Heating the rRNA made it assembly competent (Figure 3F, S3C), which suggests that the complex structures of rRNA attenuate its ability to promote PGL-3 drops. In contrast, addition of total messenger RNA (mRNA) significantly increased both the number of PGL-3 drops and fraction of total PGL-3 that concentrated within these drops (Figure 3B–D, S1B). Therefore we conclude that mRNA rather than rRNA drives the formation of PGL-3 drops.
To confirm that mRNA must bind PGL-3 to promote assembly of drops, we mutated the RNA binding regions of PGL-3, and investigated their effects on drop assembly. PGL-3 contains a set of six C-terminal ‘RGG’ repeats (Figure 3A), which have been reported to interact with RNA (Thandapani et al., 2013). Total mRNA failed to promote assembly of drops at physiological protein concentrations of a PGL-3 construct where the arginines in all the six RGG repeats have been mutated to glycine or leucine (RGG_mut) (Figure 3B–C, S3E). Therefore P granule assembly is promoted by the presence of mRNA, and mRNA requires RGG repeats in PGL-3 in order to promote drop formation. Consistent with this result, mRNA concentrated within PGL-3 drops (Figure 3H).
To quantify the role of mRNA in droplet assembly, we took advantage of a recent study that used RNA-seq to measure the relative amounts of different mRNA in the 2-cell stage C. elegans embryos (AB and P1 cells) (Osborne Nishimura et al., 2015). To obtain an estimate of the absolute mRNA amounts, we calibrated the RNA-seq data using single molecule-resolution Fluorescence In Situ Hybridization (smFISH) of nine different probes in embryos (Figures 2B, S2A). We estimate with 95% confidence that at the two cell stage, an embryo contains around two million mRNA molecules, which gives a concentration of ~100 nM (Figure 2C, Table S2). Consistent with the estimated in vivo concentration of mRNA in C. elegans embryos, we found that physiological concentration of mRNA (100 nM, or 50 ng/μl assuming average length of mRNA is 1.5 Kb) can promote assembly of drops at physiological concentrations of PGL-3 (Figure 4A).
Figure 4.
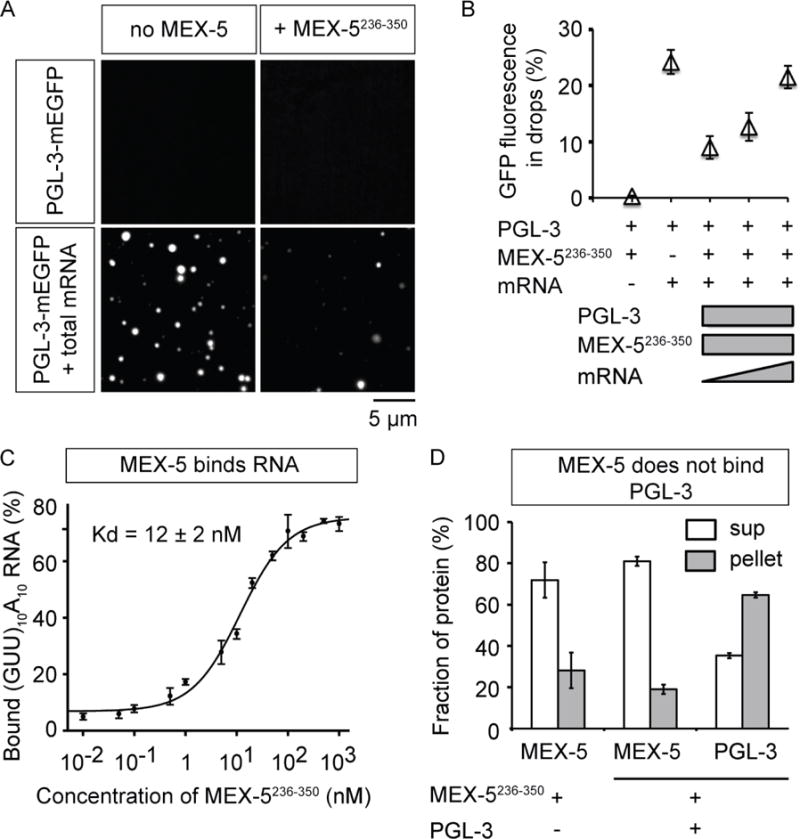
MEX-5 inhibits mRNA-dependent PGL-3 drop assembly.
(A) Maximum intensity projections of series of confocal z- slices show PGL-3-mEGFP (0.6 μM) in presence or absence of additives: 1) PGL-3 alone, 2) + 150 nM MBP-MEX-5 (236–350), 3) + 50 ng/μL mouse brain mRNA, 4) + 50 ng/μL mouse brain mRNA and 150 nM MBP-MEX-5 (236–350).
(B) Plot of the fraction of total GFP fluorescence found in phase-separated drops of PGL-3-mEGFP (0.6 μM) in presence of different additives: 1) + 150 nM MBP-MEX-5 (236–350), 2) + total mouse brain mRNA (50 ng/μL), and 3–5) + MBP-MEX-5 (236–350) (150 nM) and total mouse brain mRNA (50, 100, or 150 ng/μL). In each case, drops in ≥16 observation volumes (41 μm × 41 μm × ~10 μm) were scored. Error bars represent 1 SEM among the observation volumes scored.
(C) Binding of MBP-MEX-5 (236–350) to RNA in vitro in filter binding assay. Plot shows the amount of (GUU)10A10 RNA oligo bound to MBP-MEX-5 (236–350) as a function of protein concentration. Error bars represent 1 SEM.
(D) Binding of MBP-MEX-5 (236–350) to PGL-3-mEGFP in vitro in pull-down assay using beads coated with anti-PGL-3 antibody. Plot of the fraction of MBP-MEX-5 (236–350) or PGL-3-mEGFP present in supernatant and pellet. Control: MBP-MEX-5 (236–350) alone (1 μM), Experiment: MBP-MEX-5 (236–350) (1 μM) and PGL-3-mEGFP (1 μM). Error bars represent 1 SD among three independent experiments.
See also Figures S4, S6.
MEX-5 inhibits mRNA-dependent PGL-3 drop formation
In C. elegans embryos, gradients of MEX-5 have been shown to drive position-dependent phase separation of P granules, such that the higher the concentration of MEX-5, the lower the amount (volume fraction) of the P granule phase (Brangwynne et al., 2009). Since MEX-5 is known to bind mRNA (Pagano et al., 2007), we next looked at how MEX-5 influences mRNA-dependent PGL-3 drop formation. Despite extensive efforts, we were unable to purify full-length MEX-5 in a form that is not prone to aggregation, and therefore used a previously characterized MEX-5 fragment (residues 236–350) containing the two mRNA-binding zinc finger domains (Pagano et al., 2007). At physiological protein concentrations for both MEX-5 and PGL-3 (Figure 2A), we found that presence of MEX-5236–350 significantly inhibits mRNA-dependent assembly of PGL-3 drops over a broad range of mRNA concentrations (2–200 nM) (Figures 4A–B, S4A–B). Addition of MEX-5236–350 did not dissolve preformed drops containing PGL-3 and mRNA. This is most likely because, unlike in vivo in P granules (Sheth et al., 2010), the mRNA rapidly becomes trapped in an almost non-diffusive form in PGL-3 drops in vitro (data not shown). Presumably, proteins such as helicases (Hubstenberger et al., 2013; Jain et al., 2016) are required to avoid trapping mRNA in the P granules in vivo. We did not detect binding between PGL-3 and MEX-5236–350 in vitro (Figures 4D, S4C), nor has binding between PGL-3 and MEX-5 been detected in vivo (Chen et al., 2016). Consistent with the lack of binding between PGL-3 and MEX-5, MEX-5236–350 did not affect PGL-3 drop formation in absence of mRNA (Figure 4A). These data suggest that MEX-5 inhibits mRNA-dependent PGL-3 drop formation by binding to mRNA and depleting the pool of mRNA available to PGL-3 for drop assembly. Further consistent with this idea, addition of higher concentrations of mRNA rescued drop assembly from the inhibition of MEX-5236–350 in a dose-dependent manner, and restored drop assembly close to levels observed in absence of MEX-5236–350 at 300 nM mRNA (Figure 4B). Therefore, it is likely that the competition between MEX-5 and PGL-3 for binding to mRNA is the dominant mechanism how MEX-5 inhibits mRNA-dependent PGL-3 drop assembly.
PGL-3 drop formation depends on longer mRNA molecules and is largely sequence independent
To understand how MEX-5 competes with PGL-3 for binding to mRNA, we began by comparing the mRNA binding affinities of MEX-5 and PGL-3. Using a filter-binding assay, we found that MEX-5236–350 binds to mRNA with a dissociation constant of ~10 nM (Figure 4C), consistent with earlier reports (Pagano et al., 2007), and that PGL-3 binds to mRNA with a dissociation constant of ~230 nM, which is more than 20 fold weaker than MEX-5 binding to mRNA (Figure 5A). While MEX-5 and PGL-3 binds mRNA with significantly different affinities, both MEX-5 and PGL-3 can bind most mRNA transcripts in cells. More than 90% of C. elegans mRNA has binding sequences for MEX-5 (Pagano et al., 2007). Four lines of evidence show that PGL-3 can bind most C. elegans mRNA transcripts and assemble P granules. First, in experiments assaying the binding of PGL-3 to 10 different mRNA species in C. elegans extracts, the amount of mRNA that co-precipitated with PGL-3 correlates directly with the amount of mRNA present in the total C. elegans RNA pool (Figure 5B), suggesting that PGL-3 binds mRNA with low sequence specificity. Second, the presence of a 5′ cap and a 3′ polyA tail is not required for mRNA binding to PGL-3 (Figure 5A), nor for mRNA-dependent PGL-3 drop assembly (Figure 3E). Third, the ‘RGG’ repeats in PGL-3 required for mRNA-dependent drop assembly (Figure 3A–C) supports binding of PGL-3 to mRNA. A PGL-3 construct lacking the RGG repeat-containing region (PGL-3:ΔRGG) bound RNA more than 60 fold weaker than full-length PGL-3 both in vitro and in C. elegans extracts (Figures 5A, S5A–B). Fourth, mRNA molecules longer than 0.5 Kb assemble PGL-3 drops more efficiently compared to shorter mRNAs (Figures 3G, S3B), and 97% of the mRNAs in C. elegans embryos are longer than 0.5 Kb (Figure 2D). These data suggest that most of the cellular mRNA transcripts can bind to PGL-3 and support P granule assembly. On the other hand, MEX-5 can also bind most mRNA molecules in C. elegans embryo, but MEX-5 binds mRNA with more than 20 fold higher affinity than PGL-3.
Figure 5.
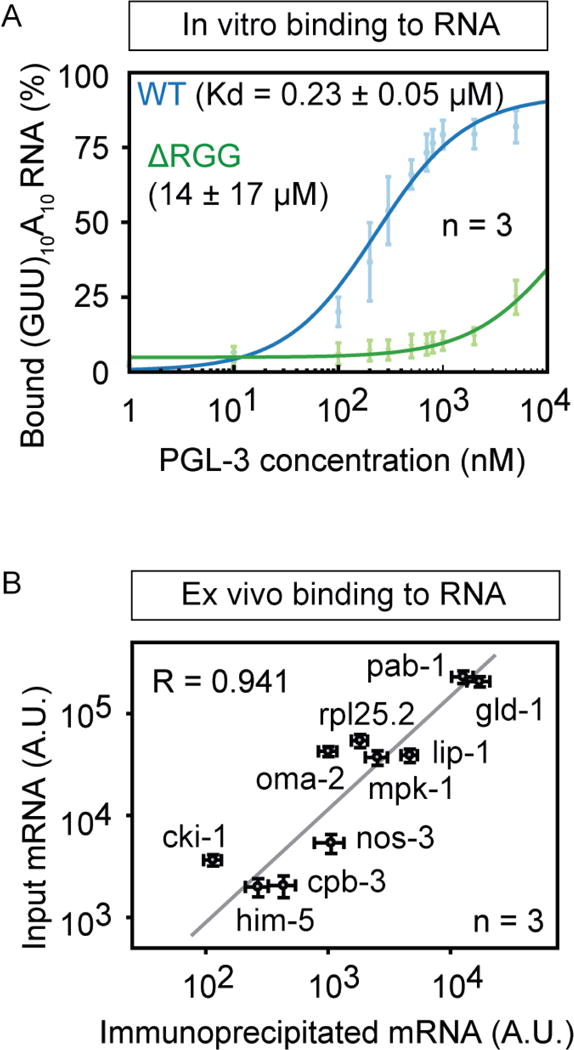
PGL-3 binds weakly to mRNA with low sequence specificity.
(A) Binding of PGL-3 to RNA in vitro in filter binding assay. Plot shows the amount of (GUU)10A10 RNA oligo bound to PGL-3-mEGFP (blue diamonds) or ΔRGG-mEGFP (green diamonds) as a function of protein concentration. Error bars represent 1 SEM. ΔRGG is a PGL-3 construct that lacks the C-terminal 60 residues in PGL-3 containing the RGG repeats.
(B) Binding of PGL-3 to RNA ex vivo assayed in co-immunoprecipitation of RNA with PGL-3-mEGFP from a pool of total RNA purified from C. elegans germline. Correlation plot of the amount of ten different mRNA species in input and the amount co-IPed with PGL-3-mEGFP. R is Pearson coefficient.
See also Figure S5.
Gradients of MEX-5 can drive localized assembly of PGL-3 drops
Our data show that competition between PGL-3 and MEX-5 for mRNA can regulate the formation of PGL-3 drops. However, they do not say whether competitive binding alone is sufficient to segregate PGL-3 drops once MEX-5 forms a gradient. This is because segregation is likely to result from a subtle interplay between diffusion kinetics of the different molecular species and their binding constants. Because these constants are known (see Table S3), we can use a theoretical approach to address this question.
We built a physical model based on the properties and interactions of PGL-3, mRNA and MEX-5. We first consider a simple phase separating system consisting of PGL-3, mRNA and water at prescribed concentrations (see methods section for details). PGL-3 can bind mRNA to form the complex PGL-3:mRNA by the reaction PGL-3+mRNA ↔ PGL-3:mRNA. The tendency of PGL-3 or PGL-3:mRNA to phase separate is characterized in our model by three interaction parameters that represent the energies of molecular interactions between PGL-3, PGL-3:mRNA, and water. The interaction parameters can be estimated by replotting the data from Figure 6B to show the dependence of the concentration difference inside and outside drops (ΔI) on the overall PGL-3 concentration (cPT) (Figure 6A, Movie S3). For PGL-3 and water in the absence of mRNA, we find that beyond a threshold value of total PGL-3 concentration of about 2 μM, the concentration difference inside and outside drops (ΔI) increases strongly and saturates at a plateau value for large overall PGL-3 concentration (cPT) (Figure 6A, blue horizontal line). This behavior is consistent with a liquid–liquid phase separation of a binary mixture. Addition of mRNA changes the behavior of the concentration difference inside and outside drops (ΔI) qualitatively. This concentration difference (ΔI) sharply increases at a lower threshold value of total PGL-3 concentration of about 200 nM, and then decreases when overall PGL-3 concentration (cPT) is further increased (Figure 6A, red line). We fit our model to the experimentally observed concentration difference inside and outside drops (ΔI) in the presence and absence of mRNA to obtain the three interaction parameters (see methods section). These values confirm that PGL-3:mRNA exhibits a significantly stronger tendency to demix from the solvent than PGL-3 alone. Further, these parameters suggest that PGL-3 and PGL-3:mRNA tend to colocalize, providing a mechanism by which PGL-3 drops concentrate mRNA in P granules.
Figure 6.
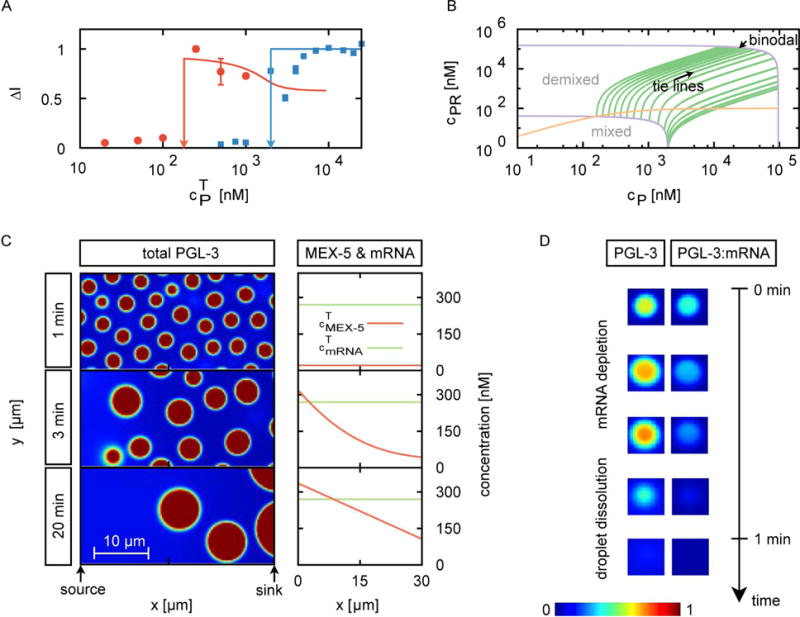
Theoretical model of PGL-3 phase separation, mRNA binding and interactions with MEX-5.
(A) Experimentally determined difference ΔI between concentrations of PGL-3 inside and outside of drops for different overall PGL-3 concentration (cPT) in the presence (red dots) or in the absence (blue squares) of 50 ng/μL mouse brain mRNA. This is a different representation of the data presented in Figure 3D. For details on measurement of ΔI, please see methods section. Solid lines are the corresponding fits obtained from our theoretical model. Vertical arrows indicate the threshold concentrations above which phase separated droplets form in presence of mRNA (cPR*) or in absence of mRNA (cP*). Error bars represent 1 SEM.
(B) Phase diagram calculated from our model for the ternary mixture consisting of PGL-3, PGL-3 bound to mRNA (PGL-3:mRNA) and water. As the total concentration of PGL-3 (cPT) is increased keeping the total concentration of mRNA constant (along the orange line in the phase diagram), mRNA binds to PGL-3 and the system equilibrates to certain concentrations of PGL-3 (cP) and PGL-3:mRNA (cPR). The binodal lines (purple) split the regions where the solution is mixed (no drops form) or demixed (drops form via phase separation). In absence of drops in the mixed region of the phase diagram, the system equilibrates to a unique concentration of PGL-3 (cP) and PGL-3:mRNA (cPR). In the drop-containing demixed region of the phase diagram, for a given total concentration of PGL-3 and mRNA, there are two distinct sets of values of cP and cPR corresponding to concentrations inside and outside of drops. The green lines connecting these two sets of concentration values are called ‘tie lines’. Using the tie lines, we can construct the behavior of ΔI as a function of cPT as shown in A (for more details see methods section and movie S3).
(C–D) Results from numerical calculations for the six-component system consisting of mRNA, PGL-3, PGL-3:mRNA, MEX-5, MEX-5:mRNA and water.
(C) Snapshots of the total PGL-3 concentration as a function of time and space (left) and plots at each time point of the concentration of total MEX-5 and total mRNA (averaged over the y-coordinate) as a function of position along x-axis (right).
(D) Representative time series show dissolution of a drop in a region of high MEX-5 concentration. mRNA is depleted from drops before the drop dissolves.
See also Figure S6, Movies S3–S5, Table S3.
How can we account for the different shapes of the curves with and without mRNA in figure 6A? In the absence of mRNA, as the PGL-3 concentration increases, a threshold is overcome where PGL-3 phase separation occurs. Above this threshold, drops form with a well-defined concentration difference between inside and outside. When we add mRNA, drops form at lower concentrations of PGL-3. Therefore we conclude that PGL-3 when bound to mRNA has a stronger tendency to phase separate than PGL-3 alone. This leads to a smaller PGL-3 threshold concentration and a larger concentration difference inside and outside drops (ΔI) above the threshold. As we further increase the concentration of PGL-3 while keeping the concentration of mRNA constant, the fraction of non-mRNA-bound PGL-3 increases and the droplet becomes more similar to the droplet in the absence of mRNA. This leads to a decrease in concentration difference inside and outside drops (ΔI). For further details see methods section.
In the C. elegans embryo, gradients of MEX-5 regulate the segregation of P granules to the posterior of the embryo, where MEX-5 concentration is low. We next addressed the question whether the competition between MEX-5 and PGL-3 for RNA could account for this P granule segregation in a MEX-5 gradient. To test this idea, we had to take into account the dynamics of MEX-5 bound to RNA (MEX-5:mRNA) and PGL-3 bound to RNA (PGL-3:mRNA). Therefore we extended our model and derived the dynamical equations for the six-component system consisting of mRNA, PGL-3, PGL-3:mRNA, MEX-5, MEX-5:mRNA and water (see methods section for details). These equations describe the diffusion of all six components, their interactions, binding affinities and the formation of droplets. We add the following MEX-5 binding processes: MEX-5+mRNA↔ MEX-5:mRNA and PGL-3:mRNA+MEX-5 ↔ PGL-3+MEX-5:mRNA. The corresponding binding constants were determined experimentally (see Table S3).
To study the impact of a MEX-5 gradient on the droplet dynamics, we solved the dynamic equations in two dimensions of the extended model numerically generating a MEX-5 gradient by localized sources and sinks. In our computations we start with a homogeneous state of constant and low MEX-5 concentration, from which droplets form containing PGL-3 and PGL-3:mRNA (Figure 6A top, 6C). These drops fuse with each other, and undergo Ostwald ripening. We next introduce a gradient of MEX-5, consistent with in vivo measurements in the C. elegans embryo (Griffin et al., 2011). For details see methods section. Our numerical results show that at physiological concentrations, and using the measured constants from table S3, a MEX-5 gradient can dissolve drops in regions where MEX-5 concentration is increased and segregates PGL-3-rich drops to regions of low MEX-5 concentrations (Figure 6C, Movie S4). Dissolution of drops at the MEX-5-rich side can occur within a time scale of minutes consistent with observations in the C. elegans embryo (Brangwynne et al., 2009). Interestingly, our calculations show that droplet dissolution is preceded by depletion of mRNA from drops and a concomitant local increase of MEX-5:mRNA concentration (Figure 6D, Movie S4). While depletion of mRNA from drops occurs slowly, drops dissolve quickly once mRNA is sufficiently depleted. Thus we conclude that a gradient of MEX-5 could indeed account for the positioning of P granules in the C. elegans embryo via mechanisms that rely on phase separation, diffusion processes and the local competition between MEX-5 and PGL-3 for mRNA binding.
Discussion
In this paper, we have studied the mechanism by which MEX-5 can regulate the formation of P granules in C. elegans embryos. The mechanism we propose is based on competition between MEX-5 and PGL-3 for binding to mRNA (Figure 7). In this model, MEX-5 influences the demixing of PGL-3 and mRNA by depleting the local free mRNA concentration. The critical requirement for this mechanism to work is that the complex of mRNA and PGL-3 (PGL-3:mRNA) must have a higher demixing tendency compared to PGL-3 alone.
Figure 7.
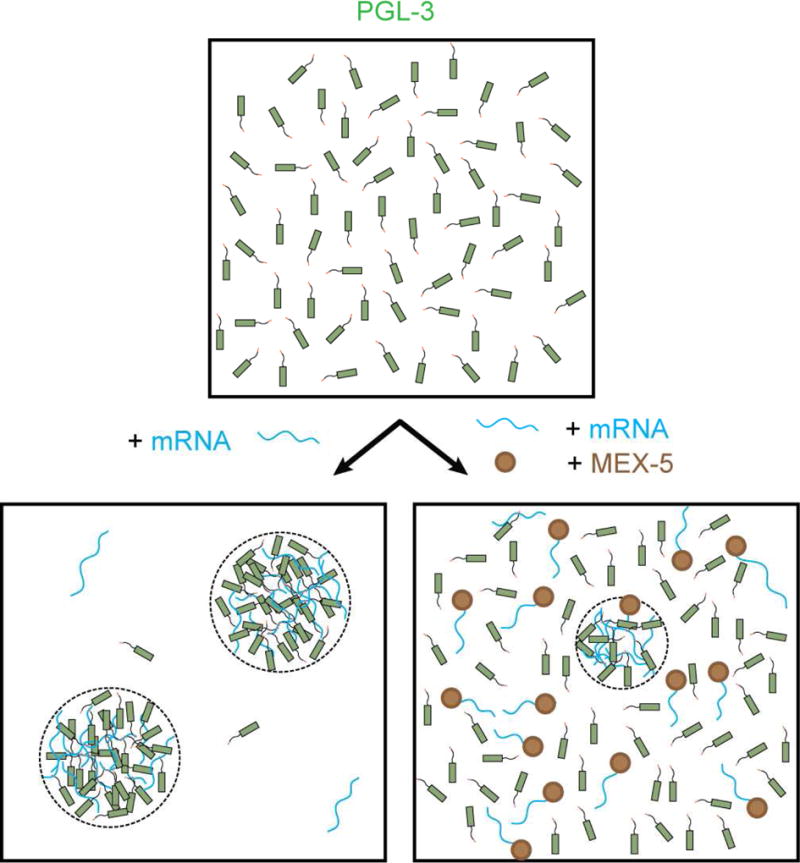
Model mechanism of inhibition of mRNA-dependent PGL-3 drop assembly by MEX-5. In absence of MEX-5, mRNA binds PGL-3 via the RGG repeats and increases the local concentration of PGL-3, leading to phase separation. Concentration of mRNA and PGL-3 is significantly higher in the drop phase compared to the surrounding bulk phase. In presence of MEX-5, mRNA binds preferably to MEX-5 in contrast to PGL-3 resulting in inhibition of drop assembly. mRNA molecules not bound to MEX-5 bind PGL-3 and assemble few drops. These drops may recruit few mRNA-MEX-5 complexes.
A number of models have previously been proposed for spatial organization of cellular components. One class invokes reaction diffusion processes, such as the formation of gradients of morphogens. Another example is the formation of a meiotic spindle. It is thought that a gradient of the GTPase Ran localizes nucleation of microtubules to the region of chromatin (Carazo-Salas et al., 1999). Our proposed mechanism for P granule segregation includes reaction diffusion but extends it to include phase separation. The reaction component is the formation of MEX-5 and PGL-3 bound to mRNA, while phase separation comes via formation of PGL-3:mRNA droplets. Combining reaction diffusion processes and phase separation provides a number of interesting features for a cell. For instance, it provides an amplification mechanism that turns a shallow gradient into switch-like behavior (Lee et al., 2013). Indeed our model predicts that P granule segregation is relatively insensitive to the steepness of the MEX-5 gradient, as long as this gradient can sufficiently redistribute the mRNA-bound form of PGL-3 with greater demixing tendency compared to PGL-3 alone, such that PGL-3:mRNA is depleted from the anterior and enriched in the posterior of the embryo. Therefore, this provides a system that is robust to perturbations of the MEX-5 gradient.
The proposed mechanism is consistent with key observations on MEX-5 biology. MEX-5 works together with another similar protein MEX-6 (Schubert et al., 2000). It is known that after RNAi of MEX-5/MEX-6, P granules form but do not segregate (Brangwynne et al., 2009; Gallo et al., 2010; Schubert et al., 2000). On the other hand, if MEX-5/6 is present but does not form a gradient, for instance in PAR-1 mutants, then P granules eventually disappear (Brangwynne et al., 2009; Gallo et al., 2010; Griffin et al., 2011; Tenlen et al., 2008).
Our model makes a set of testable predictions on our proposed competition mechanism. First, following polarity establishment, the mRNA bound form of PGL-3 should concentrate in the posterior of the embryo while the anterior should be enriched for PGL-3 not bound to mRNA. Second, if the concentrations of MEX-5 and MEX-6 are increased sufficiently, P granules should dissolve since MEX-5/6 will deplete the mRNA available for P granule assembly. Third, in embryos that lack MEX-6 but depend on a mutant form of MEX-5 that cannot bind to mRNA, P granules should not segregate to the posterior. Fourth, in embryos where due to some genetic perturbations the MEX-5 gradient is established before P granule formation, P granules should assemble first at the posterior of the embryo where MEX-5 concentration is low (see Movie S5).
A more subtle prediction is that if the concentration of PGL-3 is raised above a point where mRNA is no longer required for P granule assembly (~ 5 times the in vivo concentration of PGL-3), rapid P granule segregation seen in normal embryos will not take place (assuming that embryos do not compensate in other ways for increase in protein levels). However, under these conditions, P granules should eventually segregate. This is because, normally, the MEX-5/6 gradient creates a gradient of supersaturation along the anterior-posterior (AP) axis that leads to rapid dissolution of P granules at the negatively supersaturated anterior, and condensation of P granules at the positively supersaturated posterior (Brangwynne et al., 2009). But, when PGL-3 concentration is sufficiently high, there will exist a state of positive supersaturation throughout the length of the AP axis. This effect will prevent rapid dissolution of P granules at the anterior. Slower segregation of P granules will take place because the MEX-5/6 gradient is still in place, which will create a gradient of positive supersaturation along the AP axis. This means that Ostwald ripening should segregate P granules to the posterior, but this will be at a much slower rate than in wild-type embryos. For the same reasons, P granules should also require more and more time to segregate to the posterior as the concentration of mRNA in the embryo is gradually increased to a point where most MEX-5/6 is bound to mRNA.
The formation of a MEX-5 gradient has been suggested to result from phosphorylated and dephosphorylated species of MEX-5 with different diffusion coefficients (Daniels et al., 2010; Griffin et al., 2011; Tenlen et al., 2008). In the presence of phosphorylation gradient, this can lead to an overall MEX-5 concentration gradient. The phosphorylation gradient is thought to depend on the kinase PAR-1, which concentrates at the posterior cortex (Griffin et al., 2011; Tenlen et al., 2008). Because we have not studied the formation of the MEX-5 gradient in this paper, we have simplified the formation of a MEX-5 gradient by introducing a source and a sink. However studying the interplay between the physical and biochemical mechanisms of MEX-5 gradient formation and the phase separation of P granules will be a fascinating topic for future experiments and theory.
One obvious question is why segregation of P granules to the posterior of the embryo depends mainly on MEX-5/6 rather than the numerous other RNA binding proteins in the cell? We can distinguish two types of RNA-binding proteins, those that are distributed in gradients, and those that do not form a gradient. Following polarity establishment, MEX-5 and MEX-6 concentrate in the anterior. In turn, this gradient of MEX-5/6 distributes the RNA-binding proteins PIE-1, POS-1 and MEX-1 asymmetrically to form gradients with highest concentration in the posterior (Griffin, 2015). These posterior-enriched proteins are present at overall concentrations smaller or comparable to MEX-5/6 (Table S1), and the steepness of the gradient of posterior-enriched proteins is similar to that of MEX-5 (Griffin et al., 2011; Wu et al., 2015). Two lines of evidence explain why MEX-5/6 can dissolve P granules at the anterior, while PIE-1/POS-1/MEX-1 fails to inhibit P granule assembly at the posterior facilitating P granule segregation. First, MEX-5/6 most likely binds mRNA molecules with significantly higher affinity compared to PIE-1, POS-1, MEX-1 or PGL-3; MEX-5 and MEX-6 binds mRNA with >10 fold higher affinity compared to POS-1 (Farley et al., 2008; Pagano et al., 2007) and PGL-3 (this study). Second, MEX-5/6 and PGL-3 most likely binds many more mRNA molecules in cells compared to PIE-1, POS-1 or MEX-1. MEX-5 recognizes any 8-nucleotide long stretch with six to eight uridines (Pagano et al., 2007), and our study shows that PGL-3 can bind mRNA with low sequence specificity. On the other hand, the RNA sequence requirement for POS-1 binding is more stringent (Farley et al., 2008). Bioinformatic analysis suggests that while 3′ UTR of only 28% of C. elegans mRNA contain binding sequences for POS-1, >90% of C. elegans mRNA contain binding sequences for MEX-5 (Farley et al., 2008; Pagano et al., 2007). Therefore we propose that at the anterior, MEX-5 binds most cellular mRNA with significantly higher affinity compared to PGL-3 resulting in P granule dissolution. The posterior-enriched POS-1 cannot inhibit mRNA-dependent P granule assembly, because POS-1 can only bind to a small fraction of the mRNA, keeping most mRNA available to drive PGL-3 drop formation.
Many RNA-binding proteins in cells do not form an anterior-posterior concentration gradient. These non-gradient-forming RNA binding proteins may also compete with PGL-3 for some mRNA molecules required for P granule assembly. Therefore, the gradients of MEX-5/6 must drive P granule segregation within a background of non-gradient-forming RNA binding proteins. This background effectively provides a buffer for mRNA molecules. We speculate that P granule segregation is successful in spite of this buffer for mRNA molecules because the buffering capacity is low, or it is slow compared to the timescale of P granule segregation. Although we considered adding an mRNA buffer to our model, neither the binding rates and constants, nor the specificity of most of these RNA-binding proteins are known. Future work creating buffers with complex mixtures of RNA binding proteins will be required to resolve these questions.
The experiments in this paper are underpinned by measurement of in vivo concentrations of proteins and mRNAs. One important measurement is the amount of mRNA- too high and competition would be irrelevant. We estimated the amount of mRNA in the two-cell stage C. elegans embryos at ~2,000,000 transcripts from published transcriptome-level RNA-seq data (Osborne Nishimura et al., 2015). While we used smFISH-based linear regression to calibrate the published RNA-seq data, an independent study used an alternate approach of calibration using spike-in control RNA probes (Tintori et al., 2016). Our estimate of the amount of mRNA transcripts is close to the findings of this independent study. Further, our estimates are similar to measurements in other systems: 50,000 – 300,000 mRNA transcripts in a human lymphoblastoid cell line estimated using RNA-seq data calibrated using spike-in control RNA probes (Marinov et al., 2014); 505,000 mRNA transcripts in a mouse embryonic fibroblast estimated using microfluidics and SMRT-seq technology (Islam et al., 2011).
Our work has concentrated on phase separation of PGL-3 into liquid drops in vitro. PGL-3 drops have remarkably similar biophysical properties to P granules in vivo in spite of a simpler composition compared to P granules. However, the organization of P granules in vivo is likely to be more complicated than our in vitro system. Over forty proteins localize in P granules (Updike and Strome, 2010). We do not know why there is such varied molecular composition. However we can distinguish ‘scaffold’ proteins that assemble P granules from ‘clients’ that partition into the P granules transiently to mediate biochemical reactions. In addition to PGL-3, other proteins including PGL-1, GLH-1, DEPS-1, LAF-1 and the MEG proteins are known to be required in part for P granule assembly (Elbaum-Garfinkle et al., 2015; Hanazawa et al., 2011; Kawasaki et al., 1998; Spike et al., 2008; Updike and Strome, 2010; Updike et al., 2011; Wang et al., 2014). More work is required to understand the individual contributions of these different proteins to P granule segregation, but it is likely that they cooperate together to form P granules. For instance, the MEG proteins and the PGL proteins depend on each other for P granule assembly (Wang et al., 2014), and LAF-1 has been shown to assemble P granule-like drops in vitro (Elbaum-Garfinkle et al., 2015). We speculate that all of these proteins bind mRNA, and therefore the MEX-5-dependent competition mechanism we have identified could drive segregation of all these components into P granules at the posterior of the embryo.
Segregation of P granules in C. elegans embryos has long been a topic of fascination since 1982, when they were first identified by antibody staining (Strome and Wood, 1982). The observation that P granules were liquids in 2009 suggested that non-membrane-bound compartments could form by phase separation (Brangwynne et al., 2009). The subsequent discovery that many other compartments are liquid-like and form by phase separation (Brangwynne et al., 2011; Strzelecka et al., 2010; Wippich et al., 2013) suggests a picture of the cell cytoplasm as a complex chemically active emulsion. However the cytoplasm is likely to be more complicated than a conventional emulsion, because many liquid phases coexist in the same system. If there are many compartments, the droplets are far from global equilibrium, because they are chemical micro-reactors that localize specific sets of biochemical reactions. We have not invoked any active processes for formation of P granules because in vitro they form by conventional phase separation. We do not know if active processes contribute to their formation in vivo, but the remarkable similarities between the properties of P granules in vivo and PGL-3 drops in vitro suggest that conventional phase separation may dominate.
Our findings support the idea from other studies (Hanazawa et al., 2011; Li et al., 2012; Lin et al., 2015; Su et al., 2016), that many of the non-membrane-bound compartments in cells e.g. centrosomes, nucleoli, PML bodies, P bodies, P granules, stress granules are assembled by only one or a few key proteins. Many of these compartments have been shown to be regulated by RNA (Berry et al., 2015; Burke et al., 2015; Lin et al., 2015; Molliex et al., 2015; Zhang et al., 2015), suggesting that the interplay between RNA binding, and a few scaffold proteins is important for their regulation. Our experiments suggesting that competition for RNA between different proteins can be used to organize the distribution of non-membrane-bound compartments provides a powerful mechanism of spatially organizing the cytoplasm.
METHODS AND RESOURCES
CONTACT FOR REAGENT AND RESOURCE SHARING
Further information and requests for reagents may be directed to, and will be fulfilled by the corresponding author Anthony A. Hyman (hyman@mpi-cbg.de).
METHOD DETAILS
Protein expression and purification
PGL-3-6xHis-mEGFP, PGL-3 (1–633)-6xHis-mEGFP, PGL-3 (R634L, R638G, R650L, R661G, R665G, R690G)-6xHis-mEGFP were purified from insect cells using the baculovirus infection system. Insect cells were harvested ~72 hours after viral infection, and lysed using dounce homogenizer in 25 mM HEPES pH 7.5, 0.3 M KCl, 0.3 M L-Arginine, 10 mM Imidazole, 1 mM DTT containing protease inhibitors. The lysates were centrifuged at 12500 rpm in a JA-17 rotor (Beckman-Coulter), and Ni-NTA Agarose resin (Qiagen) was mixed with the supernatant to capture PGL-3 protein molecules. The resin was then washed with 25 mM HEPES pH 7.5, 0.3 M KCl, 20 mM Imidazole, 1 mM DTT. Finally, the PGL-3 molecules were eluted into 25 mM HEPES pH 7.5, 0.3 M KCl, 250 mM Imidazole, 1 mM DTT. PGL-3 constructs were purified further using anion-exchange chromatography. PD-10 desalting columns (GE Healthcare) were used to transfer the PGL-3 constructs into a low salt buffer QA (25 mM Tris pH 8.0, 50 mM KCl, 1 mM DTT containing protease inhibitors). Next, PGL-3 constructs in QA were loaded onto a HiTrap Q 1 ml anion-exchange column (GE Healthcare), and subjected to a linear salt gradient made by mixing the low salt buffer QA with a high salt buffer QB (25 mM Tris pH 8.0, 1 M KCl, 1 mM DTT). The fractions containing the PGL-3 constructs were pooled and purified further using size-exclusion chromatography with HiLoad 16/60 Superdex 200 column (GE Healthcare) in 25 mM HEPES pH 7.5, 0.3 M KCl, 1 mM DTT. Purified PGL-3 constructs were distributed into small aliquots, flash frozen in liquid nitrogen, and stored at −80 °C. Although the protein was stored a t high salt buffer, all assays were conducted under physiological conditions (25 mM HEPES pH 7.5, 150 mM KCl, 1 mM DTT). Unlike PGL-3-6xHis-mEGFP and PGL-3 (1–633)-6xHis-mEGFP, PGL-3 (R634L, R638G, R650L, R661G, R665G, R690G)-6xHis-mEGFP did not bind the HiTrap Q 1 ml anion-exchange column, and was purified from the flow through.
Untagged PGL-3 was purified by first cleaving off 6xHis and mEGFP tags from the C-terminus of PGL-3-mEGFP-6xHis protein using 6xHis-tagged TEV protease, followed by incubation with Ni-NTA Agarose resin to remove 6xHis-tagged mEGFP and TEV protease. Untagged PGL-3 was further purified via size-exclusion chromatography in HiLoad 16/60 Superdex 200 column (GE Healthcare) in 25 mM HEPES pH 7.5, 0.3 M KCl, 1 mM DTT.
MBP-tagged MEX-5 (236–350) was purified adapting the protocol described in Pagano et al. (Pagano et al., 2007). Briefly, the protein was expressed at exponential phase of growth in BL-21 (DE3) E. coli cells, and purified using a combination of amylose-affinity and anion-exchange chromatography. Care should be taken to use the protein as soon as possible after purification.
Preparation of RNA constructs used in the assays
Total RNA was prepared from unsynchronized C. elegans culture using TRIzol (Invitrogen) reagent following standard protocols. Total C. elegans mRNA was prepared using two rounds of selection of polyA+ RNA from total RNA using Poly(A)Purist Kit (Thermo Fisher Scientific). Mouse mRNA isolated from whole mouse brains were purchased from Clontech. Other rRNA and mRNA constructs were generated in standard in vitro transcription reactions.
In vitro assays on PGL-3 drop formation
In absence of RNA, PGL-3 drops were assembled by diluting the protein from a high salt-containing storage buffer (300 mM KCl) to a physiological buffer (150 mM KCl). RNA-dependent PGL-3 drop assembly occurred in < 1 min after addition of RNA. Drops of PGL-3 were generally imaged within 30–40 mins following drop assembly. All in vitro assays with PGL-3 and RNA were carried out in physiological buffer (25 mM HEPES pH 7.5, 150 mM KCl, 1 mM DTT).
Since mRNA promotes assembly of PGL-3 drops, we checked if the phase separation observed in PGL-3 protein is in fact a result of some RNA contaminant that may be associated in trace amounts with PGL-3 purified from insect cells. To address this, we treated a dilute solution of PGL-3 with < 1% protein in drops with the nuclease Benzonase. After Benzonase treatment, we concentrated the solution of PGL-3 and found PGL-3 phase separates into drops extensively (Supplementary figure S1E).
In experiments to reduce secondary/tertiary structures of 18S rRNA, the rRNA was incubated at 75 °C for 1 min, followed by addition of PGL-3-6xHis-mEGFP and imaging at room temperature.
To study the effect of MEX-5 on mRNA-dependent PGL-3 drop assembly, purified MBP-MEX-5 (236–350) was initially dialyzed into 25 mM HEPES pH 7.5, 150 mM KCl, 2 mM DTT, 0.1 mM ZnCl2. During the assay, mRNA was first incubated with 150 nM MBP-MEX-5 (236–350) for ~15 mins followed by the addition of 600 nM PGL-3-6xHis-mEGFP and imaging ~15 mins after addition of PGL-3. We found PGL-3 aggregates at ZnCl2 concentrations >5–10 μM. We therefore conducted the MEX-5 assays in 25 mM HEPES pH 7.5, 150 mM KCl, 2 mM DTT, 2 μM ZnCl2.
Cryo-electron tomography
Four μl of 1 μM of untagged PGL-3 or PGL-3-mEGFP were deposited on glow discharge Cupper Quantifoil grids (R2/1, Cu 200 mesh grid, Quantifoil Micro Tools) and allowed to settle for 30 s. Grids were plunge-frozen into liquid ethane/propane mixture at close to liquid nitrogen temperature using a Vitrobot® Mark 4 (FEI). Before plunging, 2 μl of 10 nm diameter gold beads were added to the grid surface and allowed to settle for 5 s. The blotting conditions were set to blot force 0, 4–4.5 s blot time and 2 s drain time. Grids were stored in liquid nitrogen until usage.
Cryo-electron microscope observations were performed on a Titan Krios operated at 300 kV (FEI). The Titan Krios was equipped with a field-emission gun, a Quantum post-column energy filter (Gatan), and a special heated phase plate holder (FEI). Data was recorded on a K2 Summit (Gatan) direct detector camera operated in dose fractionation mode. Tilt-series images were collected using SerialEM software. Tomography acquisition parameters were as follows: EFTEM magnification 42000×; tilt range was ±60°; tilt increment 2°; total dose ~60 electrons/Å2; pixel size 0.342 nm. Data was acquired at target defocus of −0.5 μm with a Volta phase plate.
Alignment of tilt-series projection images was performed with gold nanoparticles as fiducials with IMOD software. Final alignment of the tilt-series images was performed using the linear interpolation option in IMOD and a low pass filter (cut off, 0.35; sigma, 0.05). No CTF correction was performed. For tomographic reconstruction, the radial filter options were left at their default values (cut off, 0.35; fall off, 0.05).
Imaging and fluorescence recovery after photobleaching (FRAP) experiments
Phase separation properties of PGL-3 under various conditions were imaged within flow chambers created by attaching cover glass to glass slide with two double-sided tapes (~60 μm thick) positioned parallel to each other. In some cases, the surfaces of these flow chambers were coated with the lipid 1,2-Dioleoyl-sn-glycero-3-phosphocholine (DOPC) prior to application of PGL-3-containing solution. We imaged drops of PGL-3 that settled down by gravity on the lipid-coated surface of the cover glass. Coating with lipids served two purposes. First, it reduced the wetting of PGL-3 drops on the surface of the cover glass. Second, the internal dynamics in PGL-3 drops was preserved for longer after these drops contacted the cover glass surface. For most imaging and all FRAP experiments, we used spinning-disk confocal imaging system fitted with diode-pumped solid state LASERs (wavelength 488 nm and 640 nm), Olympus UplanSApochromat 100× 1.4 NA oil-immersion objective, Yokogawa CSU-X1 (5000 rpm) spinning-disk scan head, and Andor iXon DU-897 BV back illuminated EMCCD camera. Single confocal plane was imaged over time for all FRAP experiments. Some imaging experiments were conducted using wide-field microscopy setups.
Image analysis
All image analysis was conducted using the Fiji image-processing package (http://fiji.sc/Fiji). Three-dimensional segmentation of images to identify RNA-protein droplets were done using the ‘Squassh’ segmentation protocol (Rizk et al., 2014).
Drop fusion experiments
Controlled drop fusion experiments were conducted in a custom-built dual trap optical tweezer microscope (Jahnel et al., 2011) with two movable traps.
Filter binding assay to test binding between proteins and RNA
For the RNA-protein binding affinity measurements, 0.4 nM of radioactively-labeled (GUU)10A10 RNA was incubated with increasing amounts of PGL-3-mEGFP or PGL-3 (1–633)-mEGFP or MBP-MEX-5 (236–350) in 25 μl of binding buffer (25mM HEPES pH 7.4, 100 mM KCl, 1mM EDTA, 0.5 mM DTT, 10% glycerol, 0.01% NP-40, BSA 0.2 mg/ml) for 10 min at room temperature. The total reaction was applied to a nitrocellulose filter that was previously blocked with 0.5 mg/ml total yeast RNA in wash buffer (25 mM HEPES pH 7.4, 100 mM KCl, 1 mM EDTA). The bound material was washed with 5 ml ice-cold wash buffer and the residual radioactivity on the filter was measured by liquid scintillation counting. All values were corrected for background radioactivity, which was assessed by measuring the amount of radioactivity binding to the filters in the absence of the protein in question.
Immunoprecipitation to probe binding between PGL-3 and RNA
10μM of PGL-3-6xHis-mEGFP or PGL-3 (1–633)-6xHis-mEFGFP was incubated with 3 ng/μl of total RNA purified from C. elegans germline for 15 min at room temperature in 20 μl of Buffer A (25 mM HEPES pH 7.4, 150 mM KCl, 1 mM DTT, 2 mM MgCl2). Next, the volume was increased to 200 μl by addition of Buffer A containing 50 U/ml of Ribolock (Fermentas) and 0.05% of NP-40 (called Buffer A+). The immunoprecipitation was conducted with 2 μg of goat anti-GFP antibodies which have been coupled to 10 μl of Protein G Dynabeads (Life Technologies) for 3 h at 4°C with constant mixing. The beads were then washe d four times with 400 μl of Buffer A+, and treated with Proteinase K to liberate RNAs form the beads. The resulting supernatant was extracted with TRIzol (Invitrogen) following standard protocols. Isolated RNAs were reverse transcribed using Reverse Aid (Fermentas) and random hexamers. Quantitative PCR (qPCR) was conducted on a Mx3000P qPCR system (Stratagene) using the ABsolute QPCR SYBR Green mix (Thermo) and gene-specific primers.
Assay to test binding between MEX-5 and PGL-3
1 μM PGL-3-6xHis-mEGFP was incubated with 1 μM of MBP-MEX-5 (236–350) for 1 h at 4 °C in binding buffer (25 mM HEPES pH 7.5, 15 0 mM KCl, 1 mM DTT, 2 μM ZnCl2). Next, 150 μL of Dynabeads Protein G coated with anti-PGL-3 antibody pre-equilibrated in binding buffer was added to the mix and further incubated for ~16 h at 4 °C. Finally, the beads were pelleted by centrifug ation, and the fraction of proteins in the supernatant and pellet was probed using SDS-PAGE.
Measurement of in vivo protein concentration using mass spectrometry
Wild-type C. elegans N2 worms were grown on peptone plates, and embryos were harvested by bleaching, released overnight at 23 °C in S-Basal with cholesterol to hatch embryos into L1 larvae. These L1 larvae were grown into young adults on 14.5 cm peptone plates (100.000 L1/plate) for 2 days at 20 °C followed by 1 day at 16 °C, and embryos (enriched for 1–200 cell stage) were harvested from young adult worms by bleaching, frozen in liquid nitrogen, and stored at −80 °C. Three biological replicates of embryos were harvested and frozen for mass spectrometry. Frozen embryos were boiled in 4% SDS, 0.1 M Tris/HCl pH 8.0, then treated with a Dounce homogenizer and ultrasonicated (Bioruptor), and clarified by centrifugation. Proteins in the cleared lysate were reduced and alkylated by addition of 10 mM DTT followed by 60 mM IAA, and then acetone-precipitated. The lyophilized pellet was resuspended in 0.1 M TEAB, digested with LysC (1:25) for 4 h at 30 °C followed by trypsin (1:100) over night at 37 °C. 20 μg of peptides were fractionated into three fractions on SDB-RPS StageTips (Kulak et al., 2014) and measured on a Q Exactive mass spectrometer (Thermo Fisher). Raw files were analysed with MaxQuant and searched against the C. elegans whole proteome fasta database obtained from UniProt. Protein concentrations were then estimated as described in the “proteomic ruler” approach by scaling to a total cellular protein concentration of 200 g/l (Wiśniewski et al., 2014)
Estimation of total mRNA transcripts per cell
To estimate total mRNA transcripts per cell, we used a previously published set of mRNA transcripts whose abundances were assayed by both RNA-seq and by single molecule Fluorescence In Situ Hybridization (smFISH) in AB and P1 cells at the 2-cell stage of development (Osborne Nishimura et al., 2015). Briefly, we fit a linear model between the two measurements and used the resulting relationship to extrapolate the total number of absolute transcripts from the complete RNA-seq dataset.
Theoretical model
To address the question whether the ability of MEX-5 to bind mRNA could position PGL-3 droplets to regions of low MEX-5 we introduce a theoretical model of PGL-3 phase separation, mRNA binding and interactions with MEX-5.
The model is based on the assumption of local equilibrium, i.e. the existence of a local free energy density, and that the non-equilibrium dynamics of the system is properly described by Onsager non-equilibrium thermodynamics. In case of phase separation this means that gradients of first order of the chemical potential (derived from the free energy density) govern the dynamics of the system. Chemical reactions are described close to, or in equilibrium. This ensures a consistent physical description in the absence of spatial inhomogeneities and avoids further unknown kinetic coefficients in the theoretical description. In the absence of chemical reactions, global equilibrium of a finite, phase-separating system corresponds to a single droplet. This state develops in time by coalescence and Ostwald-ripening of droplets. In the presence of chemical reactions, there is an unknown number of stationary non-equilibrium states. However, due to the biological relevance, we will focus on the non-equilibrium dynamics of the system and discuss the global equilibrium states.
We describe our theoretical model below in four sections A–D. In section (A), we present the free energy density of the model used to describe phase separation of PGL-3 and PGL-3 bound to mRNA (in short: PGL-3:mRNA) from the solvent. We then discuss in section (B) the concept of a constrained path in the phase diagram which arises from the binding reaction of PGL-3 and MEX-5 to mRNA. This concept assumes that both, phase separation and chemical reactions are in equilibrium. Afterwards, we use our model to calculate the total fluorescence observed in droplets in the presence of mRNA and MEX-5 and find a qualitative agreement with in vitro measurements. In section (C) we discuss how this model can fit the experimentally measured concentration difference inside and outside of droplets, ΔI [intensity of luminescence/volume] as a function of the total concentration of PGL-3, and how to extract the corresponding interaction parameters from such fits. Moreover, we present evidence that the experimental system is close to phase separation equilibrium. In section (D) we derive the dynamical equations for phase separation and mRNA binding processes in presence of MEX-5, which only relies on the assumption of local equilibrium. Moreover, we discuss the boundary conditions and parameters used in the numerical computations and give more details on the Movies S4 and S5. We abbreviate PGL-3, PGL:mRNA and mRNA as P, PR and R. MEX-5 and MEX-5:mRNA are indicated as M and MR in the following.
A) Theoretical model of PGL-3 and PGL-3:mRNA phase separation
Phase separation occurs when molecular interactions between different components dominate entropic effects which tend to keep the systems in a mixed state. This competition can be captured by the Flory-Huggins model on a coarse grained level. For a fluid consisting of N different components, the homogenous Flory-Huggins free energy density is:
| (1) |
where ν is a solvent molecule volume and niν = νi the volume of a molecule of species i. The molecular interactions between component i and k are characterized by interaction parameters χij. The logarithmic contributions in Eq. (1) are related to the system’s mixing entropy. The internal energy for component is denoted as and is measured in multiples of kbT. In the free energy Eq. (1), there are N − 1 independent volume fractions ϕi since volume conservation enforces
| (2) |
In our specific example of the competition for mRNA, we have 6 components (N = 6): the components which are known to demix from the solvent (water) W, i.e. P and PR, and M, R and MR which are assumed to regulate demixing via binding processes. Since M and R (and the product MR) are not known to demix neither in vivo nor in vitro, we will approximate Eq. (1) and treat the regulating components as dilute, ϕi ≪ 1 for i ε {M, R, MR}, such that interactions with and between each regulating component are negligible, i.e.
| (3) |
Thus the contribution to the free energy density of the regulating components M, R and MR are
| (4) |
the corresponding volume fraction is ϕi = νici, where ci denotes the concentration of species i. Within the aforementioned approximation, the contribution to the free energy density by the demixing components R, PR and W is
| (5) |
The free energy density above describes demixing of P and/or PR from water W. In summary, we have approximated the free energy density Eq. (1) for N = 6 to
| (6) |
Please note that the approximated free energy density f for six components depends only on five independent volume fractions due to volume conservation, r.h.s. of Eq. (3).
B) Theory of PGL-3 phase separation and mRNA binding and comparison with experiments
In this section we discuss the case where phase separation and chemical reactions are in equilibrium. Moreover, let us first consider the situation where M and MR are absent and R is homogenous. For a given PGL-3 concentration the binding to mRNA,
| (7) |
defines a corresponding concentration of PGL-3:mRNA. At equilibrium, this relation can be represented as a specific path in the two-dimensional phase diagram and can be derived from μP + μR = μPR, where
| (8) |
denotes the chemical potential. Neglecting the impact of molecular interactions on the binding constants, one obtains
| (9) |
Since the amount of total mRNA concentration is constant, the specific path is given by
| (10) |
The specific path is shown in the phase diagram (Figure 6B). The binodal lines in the phase diagram can be computed by finding the convex hull to the free energy density Eq. (5) using qhull (www.qhull.org; Barber et al., 1996). From the binodal lines we then determine the tie lines which connect the concentrations inside and outside of the coexisting phases. Phases coexist when the chemical potentials are equal.
Now, let us also consider the impact of M and MR and use our model to qualitatively explain the in vitro measurements of the total fluorescence observed in droplets as a function of the total concentrations of PGL-3, mRNA and MEX-5 (Figure 4B). To this end, we introduce the binding process of MEX-5 to mRNA:
| (11) |
At chemical equilibrium the chemical potentials obey and again neglecting the impact of molecular interactions one obtains,
| (12) |
To address the impact of MEX-5 on phase separation of PGL-3 and PGL-3:mRNA, we can use relations (9) and (12) and the fact that the total concentrations of mRNA and MEX-5 are constant in the corresponding experimental study. Then we obtain a constrained path for PGL-3:mRNA in the presence of MEX-5,
| (13) |
where is the total MEX-5 concentration. Figure S6A shows the constrained paths (Eq. (13)) for the same concentration values of PGL-3, mRNA and MEX-5 used experimentally. In figure S6B we present the values obtained from our model for the total fluorescence inside of the drops for the same concentrations. Our model predicts a rise of the total fluorescence in drops when increasing the concentration of mRNA and keeping the concentrations of PGL-3 and MEX-5 constant. This result qualitatively coincides with the corresponding experimental study (Figure 4B).
C) Fit of the theory to experimental data
Here we discuss how our model of PGL-3 phase separation can be used to fit the experimentally measured concentration difference inside and outside of droplets, ΔI [intensity of luminescence/volume] as a function of the total concentration of PGL-3 (Figure 6A), and how to extract the corresponding interaction parameters from these fits.
In our model (Eq. (5)) PGL-3 and PGL-3:mRNA phase separates from the solvent, which we choose to have roughly the same molecular volume as water. In the absence of mRNA, cPR = 0, we define the intensity of luminescence concentration inside and outside of the droplets as follows
| (14) |
| (15) |
where I0 is a constant relating luminescence and concentration of PGL-3, and are concentrations inside and outside of the coexisting phases connected by a tie line at prescribed concentration . We can now define ΔI = Iin – Iout and fit this quantity to the experimental measurements. In the presence of mRNA, the difference in intensity concentration is
| (16) |
because in the experiments PGL-3 is labeled independent of its binding to mRNA.
For the fit to the experimentally determined ΔI (Figure 6A), we fixed certain parameters according to measurements (see Table S3 for a list of input parameters). As a result we obtain the interaction parameters from the fit shown in Table S3, which are quantitatively similar to demixing polymers in water (Mark, 2007; Rubinstein and Colby, 2003).
The theoretical procedure outlined above requires that the experimental in vitro system is close to phase separation equilibrium. Experimentally, we cannot consider arbitrarily large time scales due to limited protein stability. Strictly speaking, at the moment of data acquisition, the system has not yet reached phase separation equilibrium since there are still many droplets in the system. In general, it is expected that larger droplets are closer to their phase separation equilibrium. For the selected time point we find that the intensity difference ΔI changes only weakly with droplet volume (Figure S6C–D). In particular, ΔI increases roughly logarithmically. Thus, we conclude that the measured ΔI is quantitatively close to the expected equilibrium value.
Because P and PR have a molecular volume that is about a factor of ~2·104 larger than water, the interaction parameters are close to the minimal critical value, χc = 0.5 + n−1/2 + (2n)−1. However, by this relationship we can estimate the interaction parameters for the case of a solvent of roughly equal molecular volume, e.g. the protein environment in the cell. For large n, χc ≃ 0.5 + n−1/2. Reverting the scaling gives χPR,W ≈ 2.25 and χP,W ≈ 1.54 (Table S3). Please note that these absolute values only serve as rough estimates for the interaction parameters of P and PR in a cellular environment. In our later dynamical model (see next section), where we test whether the ability of MEX-5 to bind mRNA could position PGL-3 droplets to regions of low MEX-5, we use a ratio of these interaction parameters, i.e. χPR,W/χP,W, as input which is consistent with our fitting results. The absolute values of the interaction parameters mostly determine the threshold concentration above which phase separation occurs, while the inequality χPR,W > χP,W is an important qualitative precondition for the dissolution of PGL-3 droplets in regions of high MEX-5.
D) Dynamical equations including competition of PGL-3 and MEX-5 to bind RNA
We now present the dynamic equations of our model, in order to address the non-equilibrium dynamics of the system. In addition to the reactions (P + R ⇌ PR) and (M + R ⇌ MR), we also take into account the competition of PGL-3 and MEX-5 to bind RNA:
| (17) |
At local equilibrium the reaction above impose a relation between the corresponding chemical potentials: . This relation can be used to calculate the corresponding binding constant from the free energy density Eq. (6)
| (18) |
where we neglected the impact of molecular interactions on the binding constant KPRM.
Moreover, to obtain the dynamical equations, the free energy density f must be complemented by a contribution to the free energy from inhomogeneities of the concentration profile of components that take part in phase separation,
| (19) |
where κi denotes the coefficient characterizing this energetic penalty. This coefficient is related to the surface tension (Bray, 1994). The corresponding chemical potentials are . The chemical reactions break the conservation of volume by a source term Ji, while fluxes driven by gradients in obey a continuity equation. Thus the dynamical equation for species i reads
| (20) |
Here, γi denotes the mobility coefficient for the i-th component. In general this mobility depends on volume fraction. Since the regulating components in our model are assumed to diffuse without molecular interactions, the volume fraction dependence of these mobility coefficients is equal to the one obtained in the dilute limit, i.e. for i ={M, R, MR}. By this relationship the dynamical equations for the regulating species can be stated as:
| (21) |
where
| (22) |
denotes the corresponding diffusion constant. Equivalently, the equations above can be written in terms of concentrations by dividing through the respective molecular volume (ci= ϕi/νi).
For the demixing components P and PR, the volume fraction dependence of the mobilities are and . For i ∈ {P, PR} and k ∈ {PR, P} the dynamical equation for the demixing species i is:
| (23) |
where we abbreviated
| (24) |
The source term Ji for the regulating and demixing components can be derived if the system is locally close to equilibrium. As an illustration of the procedure we show the derivation for JR corresponding to component R. Splitting JR into gain (+) and loss (−) terms gives
| (25) |
where and are the gain(+), loss(−) terms for reaction pathways, Eq. (7) and Eq. (11), respectively. Compatibility with thermodynamics requires that
| (26) |
These relations allow to reduce for each reaction pathway the number of unknown kinetic coefficients λi from two to one and are consistent with equilibrium thermodynamics in the absence of spatial inhomogeneities. Writing the loss terms as
| (27) |
and using the known binding constants Eqs. (9), (12) and (18), one finds
| (28) |
Please note that in chemical equilibrium, each bracket is exactly zero, which consistently implies that the reaction source term vanishes. Analogously, one finds for the source terms corresponding to the remaining components:
| (29) |
We numerically solved the dynamical equations using an adaptive Runge-Kutta scheme of order 8/9, with tolerance 10–6. We employed XMDS2 (Dennis et al., 2013), where the Laplace operator is evaluated by a spectral method, while the chemical rates were evaluated directly. The parameters are chosen as shown in Table S3. Numerical calculations were performed in a rectangular geometry of 60μm length along the x-axis and 30 μm length along the y-coordinate. We use periodic boundary conditions for all concentration fields. The sink and source terms for MEX-5 are placed at x = 15 μm and x = 45 μm.
In the computations Movie S4 we start with a homogeneous state where all concentration fields are constant in space and in chemical equilibrium. We weakly perturb the P and PR field which suffices to trigger the formation of drops. These drops undergo Ostwald ripening and fusion with each other. After 10 s, we smoothly switch on the creation of the MEX-5 gradient over a time span of about 6 minutes.
In the computations Movie S5 we solve the dynamical equation Eqs. (23) in the absence of phase separation (neglecting all non-linearities except the ones in the chemical reactions). After reaching non-equilibrium stationary state of the system, we weakly perturb the P and PR spatially to ensure a random nucleation process. Then, we solve the full Eqs. (23) for 40 s. A front of nucleating droplets propagates from the position where MEX-5 concentration is lowest towards maximal MEX-5 concentration. The front speed decreases with time.
Supplementary Material
Highlights.
The protein PGL-3 can phase separate into P granule-like droplets in vitro.
Assembly of PGL-3 droplets at physiological concentration requires mRNA binding to PGL-3.
MEX-5 inhibits mRNA-dependent droplet assembly by competing with PGL-3 for binding mRNA.
Competition among MEX-5 and PGL-3 for mRNA can account for P granule segregation in vivo.
Acknowledgments
We thank members of the A.A.H. lab for helpful discussions; Barbara Borgonovo (Chromatography Facility, MPI-CBG), David Drechsel, Regis Lemaitre, and Martine Ruer (Protein Expression and Purification Facility, MPI-CBG) for help with protein expression and purification; Bert Nitzsche and Britta Schroth-Diez (Light Microscopy Facility, MPI-CBG) for help with light microscopy; Julia Jarrells (Microarray Facility, MPI-CBG) for help with RNA preparations; Patrick Keller (Antibody Facility, MPI-CBG) and Anne Schwager for help with producing anti-PGL-3 antibody; Pietro Incardona (Sbalzarini group, MPI-CBG) for help with image analysis; David Murray (Zerial group, MPI-CBG) for introduction to lipid coating of microscopy chambers; Dirk Walther (Mann group, MPI-Biochemistry) for help with mass spectrometry; Andres Diaz (Hyman group, MPI-CBG) for the micrograph in the graphical abstract. We are grateful to Stephan Grill for support with optical tweezer-based experiments; to Wolfgang Baumeister for support with cryo-EM experiments; to Matthias Mann for support with mass spectrometry. We gratefully acknowledge funding from the Alexander von Humboldt foundation (USA/1153678 STP to S.S.), EMBO (ALTF 608–2013 to S.S., and ALTF 1131–2011 to J.M.), Human Frontier Science Program (LT000685/2012-L to J.M.), and Max Planck Society. M.N. and C.R.E. are supported by the Deutsche Forschungsgemeinschaft (DFG EC369-2/3, EC369-3/1, and EC369-5/1); E.O-N is supported by a grant from NIH (5R01GM104050).
Footnotes
Publisher's Disclaimer: This is a PDF file of an unedited manuscript that has been accepted for publication. As a service to our customers we are providing this early version of the manuscript. The manuscript will undergo copyediting, typesetting, and review of the resulting proof before it is published in its final citable form. Please note that during the production process errors may be discovered which could affect the content, and all legal disclaimers that apply to the journal pertain.
DATA AND SOFTWARE AVAILABILITY
Data Resources
Estimates of concentration of >6000 proteins and mRNA in the early embryos of C. elegans are presented in Supplemental Tables S1 and S2.
Author Contributions
S.S., F.J. and A.A.H. conceived the project. S.S., M.N., C.H., M.Y.H., E.O-N, J.M., M.J. and L.J. conducted experiments. S.S., M.N., M.Y.H., E.O-N, J.M., M.J. analyzed data. A.P. cloned constructs for protein expression. C.A.W. and O.A-A. worked on the theoretical model and simulations. S.S., C.A.W, F.J. and A.A.H. wrote the manuscript with feedback from coauthors. C.R.E., F.J. and A.A.H. provided resources and supervision.
References
- Barber CB, Dobkin DP, Huhdanpaa H. The quickhull algorithm for convex hulls. ACM Transactions on Mathematical Software (TOMS) 1996;22:469–483. [Google Scholar]
- Berry J, Weber SC, Vaidya N, Haataja M, Brangwynne CP. RNA transcription modulates phase transition-driven nuclear body assembly. Proc Natl Acad Sci USA. 2015;112:E5237–E5245. doi: 10.1073/pnas.1509317112. [DOI] [PMC free article] [PubMed] [Google Scholar]
- Brangwynne CP, Eckmann CR, Courson DS, Rybarska A, Hoege C, Gharakhani J, Jülicher F, Hyman AA. Germline P granules are liquid droplets that localize by controlled dissolution/condensation. Science. 2009;324:1729–1732. doi: 10.1126/science.1172046. [DOI] [PubMed] [Google Scholar]
- Brangwynne CP, Mitchison TJ, Hyman AA. Active liquid-like behavior of nucleoli determines their size and shape in Xenopus laevis oocytes. Proc Natl Acad Sci USA. 2011;108:4334–4339. doi: 10.1073/pnas.1017150108. [DOI] [PMC free article] [PubMed] [Google Scholar]
- Bray AJ. Theory of phase-ordering kinetics. Advances in Physics. 1994;43:357–459. [Google Scholar]
- Burke KA, Janke AM, Rhine CL, Fawzi NL. Residue-by-Residue View of In Vitro FUS Granules that Bind the C-Terminal Domain of RNA Polymerase II. Mol Cell. 2015;60:231–241. doi: 10.1016/j.molcel.2015.09.006. [DOI] [PMC free article] [PubMed] [Google Scholar]
- Carazo-Salas RE, Guarguaglini G, Gruss OJ, Segref A, Karsenti E, Mattaj IW. Generation of GTP-bound Ran by RCC1 is required for chromatin-induced mitotic spindle formation. Nature. 1999;400:178–181. doi: 10.1038/22133. [DOI] [PubMed] [Google Scholar]
- Chen JX, Cipriani PG, Mecenas D, Polanowska J, Piano F, Gunsalus KC, Selbach M. In vivo interaction proteomics in C. elegans embryos provides new insights into P granule dynamics. Mol Cell Proteomics. 2016;15:1642–1657. doi: 10.1074/mcp.M115.053975. [DOI] [PMC free article] [PubMed] [Google Scholar]
- Daniels BR, Dobrowsky TM, Perkins EM, Sun SX, Wirtz D. MEX-5 enrichment in the C. elegans early embryo mediated by differential diffusion. Development. 2010;137:2579–2585. doi: 10.1242/dev.051326. [DOI] [PMC free article] [PubMed] [Google Scholar]
- Dennis GR, Hope JJ, Johnsson MT. XMDS2: Fast, scalable simulation of coupled stochastic partial differential equations. Computer Physics Communications. 2013;184:201–208. [Google Scholar]
- Dilão R, Muraro D. mRNA diffusion explains protein gradients in Drosophila early development. J Theor Biol. 2010;264:847–853. doi: 10.1016/j.jtbi.2010.03.012. [DOI] [PubMed] [Google Scholar]
- Elbaum-Garfinkle S, Kim Y, Szczepaniak K, Chen CCH, Eckmann CR, Myong S, Brangwynne CP. The disordered P granule protein LAF-1 drives phase separation into droplets with tunable viscosity and dynamics. Proc Natl Acad Sci USA. 2015;112:7189–7194. doi: 10.1073/pnas.1504822112. [DOI] [PMC free article] [PubMed] [Google Scholar]
- Farley BM, Pagano JM, Ryder SP. RNA target specificity of the embryonic cell fate determinant POS-1. Rna. 2008;14:2685–2697. doi: 10.1261/rna.1256708. [DOI] [PMC free article] [PubMed] [Google Scholar]
- Gallo CM, Wang JT, Motegi F, Seydoux G. Cytoplasmic partitioning of P granule components is not required to specify the germline in C. elegans. Science. 2010;330:1685–1689. doi: 10.1126/science.1193697. [DOI] [PMC free article] [PubMed] [Google Scholar]
- Griffin EE. Cytoplasmic localization and asymmetric division in the early embryo of Caenorhabditis elegans. Wiley Interdiscip Rev Dev Biol. 2015;4:267–282. doi: 10.1002/wdev.177. [DOI] [PubMed] [Google Scholar]
- Griffin EE, Odde DJ, Seydoux G. Regulation of the MEX-5 gradient by a spatially segregated kinase/phosphatase cycle. Cell. 2011;146:955–968. doi: 10.1016/j.cell.2011.08.012. [DOI] [PMC free article] [PubMed] [Google Scholar]
- Guo S, Kemphues KJ. Molecular genetics of asymmetric cleavage in the early Caenorhabditis elegans embryo. Curr Opin Genet Dev. 1996;6:408–415. doi: 10.1016/s0959-437x(96)80061-x. [DOI] [PubMed] [Google Scholar]
- Hanazawa M, Yonetani M, Sugimoto A. PGL proteins self associate and bind RNPs to mediate germ granule assembly in C. elegans. The Journal of Cell Biology. 2011;192:929–937. doi: 10.1083/jcb.201010106. [DOI] [PMC free article] [PubMed] [Google Scholar]
- Hird SN, Paulsen JE, Strome S. Segregation of germ granules in living Caenorhabditis elegans embryos: cell-type-specific mechanisms for cytoplasmic localisation. Development. 1996;122:1303–1312. doi: 10.1242/dev.122.4.1303. [DOI] [PubMed] [Google Scholar]
- Hoege C, Hyman AA. Principles of PAR polarity in Caenorhabditis elegans embryos. Nat Rev Mol Cell Biol. 2013;14:315–322. doi: 10.1038/nrm3558. [DOI] [PubMed] [Google Scholar]
- Hubstenberger A, Noble SL, Cameron C, Evans TC. Translation repressors, an RNA helicase, and developmental cues control RNP phase transitions during early development. Dev Cell. 2013;27:161–173. doi: 10.1016/j.devcel.2013.09.024. [DOI] [PMC free article] [PubMed] [Google Scholar]
- Islam S, Kjällquist U, Moliner A, Zajac P, Fan JB, Lönnerberg P, Linnarsson S. Characterization of the single-cell transcriptional landscape by highly multiplex RNA-seq. Genome Res. 2011;21:1160–1167. doi: 10.1101/gr.110882.110. [DOI] [PMC free article] [PubMed] [Google Scholar]
- Jahnel M, Behrndt M, Jannasch A, Schäffer E, Grill SW. Measuring the complete force field of an optical trap. Optics Letters. 2011;36:1–3. doi: 10.1364/OL.36.001260. [DOI] [PubMed] [Google Scholar]
- Jain S, Wheeler JR, Walters RW, Agrawal A, Barsic A, Parker R. ATPase-Modulated Stress Granules Contain a Diverse Proteome and Substructure. Cell. 2016;164:487–498. doi: 10.1016/j.cell.2015.12.038. [DOI] [PMC free article] [PubMed] [Google Scholar]
- Kawasaki I, Shim YH, Kirchner J, Kaminker J, Wood WB, Strome S. PGL-1, a predicted RNA-binding component of germ granules, is essential for fertility in C. elegans. Cell. 1998;94:635–645. doi: 10.1016/s0092-8674(00)81605-0. [DOI] [PubMed] [Google Scholar]
- Kulak NA, Pichler G, Paron I, Nagaraj N, Mann M. Minimal, encapsulated proteomic-sample processing applied to copy-number estimation in eukaryotic cells. Nat Methods. 2014;11:319–324. doi: 10.1038/nmeth.2834. [DOI] [PubMed] [Google Scholar]
- Lee CF, Brangwynne CP, Gharakhani J, Hyman AA, Jülicher F. Spatial organization of the cell cytoplasm by position-dependent phase separation. Phys Rev Lett. 2013;111:088101. doi: 10.1103/PhysRevLett.111.088101. [DOI] [PubMed] [Google Scholar]
- Li P, Banjade S, Cheng HC, Kim S, Chen B, Guo L, Llaguno M, Hollingsworth JV, King DS, Banani SF, et al. Phase transitions in the assembly of multivalent signalling proteins. Nature. 2012;483:336–340. doi: 10.1038/nature10879. [DOI] [PMC free article] [PubMed] [Google Scholar]
- Lin Y, Protter DSW, Rosen MK, Parker R. Formation and Maturation of Phase-Separated Liquid Droplets by RNA-Binding Proteins. Mol Cell. 2015;60:208–219. doi: 10.1016/j.molcel.2015.08.018. [DOI] [PMC free article] [PubMed] [Google Scholar]
- Marinov GK, Williams BA, McCue K, Schroth GP, Gertz J, Myers RM, Wold BJ. From single-cell to cell-pool transcriptomes: stochasticity in gene expression and RNA splicing. Genome Res. 2014;24:496–510. doi: 10.1101/gr.161034.113. [DOI] [PMC free article] [PubMed] [Google Scholar]
- Mark JE. Physical Properties of Polymers Handbook. New York: Springer-Verlag; 2007. [Google Scholar]
- Molliex A, Temirov J, Lee J, Coughlin M, Kanagaraj AP, Kim HJ, Mittag T, Taylor JP. Phase Separation by Low Complexity Domains Promotes Stress Granule Assembly and Drives Pathological Fibrillization. Cell. 2015;163:123–133. doi: 10.1016/j.cell.2015.09.015. [DOI] [PMC free article] [PubMed] [Google Scholar]
- Osborne Nishimura E, Zhang JC, Werts AD, Goldstein B, Lieb JD. Asymmetric transcript discovery by RNA-seq in C. elegans blastomeres identifies neg-1, a gene important for anterior morphogenesis. PLoS Genet. 2015;11:e1005117. doi: 10.1371/journal.pgen.1005117. [DOI] [PMC free article] [PubMed] [Google Scholar]
- Pagano JM, Farley BM, McCoig LM, Ryder SP. Molecular basis of RNA recognition by the embryonic polarity determinant MEX-5. J Biol Chem. 2007;282:8883–8894. doi: 10.1074/jbc.M700079200. [DOI] [PubMed] [Google Scholar]
- Rizk A, Paul G, Incardona P, Bugarski M, Mansouri M, Niemann A, Ziegler U, Berger P, Sbalzarini IF. Segmentation and quantification of subcellular structures in fluorescence microscopy images using Squassh. Nat Protoc. 2014;9:586–596. doi: 10.1038/nprot.2014.037. [DOI] [PubMed] [Google Scholar]
- Rubinstein M, Colby RH. Polymer Physics. Oxford University Press; 2003. [Google Scholar]
- Schisa JA, Pitt JN, Priess JR. Analysis of RNA associated with P granules in germ cells of C. elegans adults. Development. 2001;128:1287–1298. doi: 10.1242/dev.128.8.1287. [DOI] [PubMed] [Google Scholar]
- Schubert CM, Lin R, de Vries CJ, Plasterk RH, Priess JR. MEX-5 and MEX-6 function to establish soma/germline asymmetry in early C. elegans embryos. Mol Cell. 2000;5:671–682. doi: 10.1016/s1097-2765(00)80246-4. [DOI] [PubMed] [Google Scholar]
- Schwartz JC, Wang X, Podell ER, Cech TR. RNA seeds higher-order assembly of FUS protein. Cell Rep. 2013;5:918–925. doi: 10.1016/j.celrep.2013.11.017. [DOI] [PMC free article] [PubMed] [Google Scholar]
- Seydoux G, Fire A. Soma-germline asymmetry in the distributions of embryonic RNAs in Caenorhabditis elegans. Development. 1994;120:2823–2834. doi: 10.1242/dev.120.10.2823. [DOI] [PubMed] [Google Scholar]
- Sheth U, Pitt J, Dennis S, Priess JR. Perinuclear P granules are the principal sites of mRNA export in adult C. elegans germ cells. Development. 2010;137:1305–1314. doi: 10.1242/dev.044255. [DOI] [PMC free article] [PubMed] [Google Scholar]
- Spike CA, Bader J, Reinke V, Strome S. DEPS-1 promotes P-granule assembly and RNA interference in C. elegans germ cells. Development. 2008;135:983–993. doi: 10.1242/dev.015552. [DOI] [PMC free article] [PubMed] [Google Scholar]
- Strome S, Wood WB. Immunofluorescence visualization of germ-line-specific cytoplasmic granules in embryos, larvae, and adults of Caenorhabditis elegans. Proc Natl Acad Sci USA. 1982;79:1558–1562. doi: 10.1073/pnas.79.5.1558. [DOI] [PMC free article] [PubMed] [Google Scholar]
- Strzelecka M, Trowitzsch S, Weber G, Lührmann R, Oates AC, Neugebauer KM. Coilin-dependent snRNP assembly is essential for zebrafish embryogenesis. Nat Struct Mol Biol. 2010;17:403–409. doi: 10.1038/nsmb.1783. [DOI] [PubMed] [Google Scholar]
- Su X, Ditlev JA, Hui E, Xing W, Banjade S, Okrut J, King DS, Taunton J, Rosen MK, Vale RD. Phase separation of signaling molecules promotes T cell receptor signal transduction. Science. 2016;352:595–599. doi: 10.1126/science.aad9964. [DOI] [PMC free article] [PubMed] [Google Scholar]
- Tenlen JR, Molk JN, London N, Page BD, Priess JR. MEX-5 asymmetry in one-cell C. elegans embryos requires PAR-4- and PAR-1-dependent phosphorylation. Development. 2008;135:3665–3675. doi: 10.1242/dev.027060. [DOI] [PubMed] [Google Scholar]
- Thandapani P, O’Connor TR, Bailey TL, Richard S. Defining the RGG/RG motif. Mol Cell. 2013;50:613–623. doi: 10.1016/j.molcel.2013.05.021. [DOI] [PubMed] [Google Scholar]
- Tintori SC, Osborne Nishimura E, Golden P, Lieb JD, Goldstein B. A Transcriptional Lineage of the Early C. elegans Embryo. bioRxiv. 2016 doi: 10.1016/j.devcel.2016.07.025. doi: http://dx.doi.org/10.1101/047746. [DOI] [PMC free article] [PubMed]
- Updike D, Strome S. P granule assembly and function in Caenorhabditis elegans germ cells. J Androl. 2010;31:53–60. doi: 10.2164/jandrol.109.008292. [DOI] [PMC free article] [PubMed] [Google Scholar]
- Updike DL, Hachey SJ, Kreher J, Strome S. P granules extend the nuclear pore complex environment in the C. elegans germ line. The Journal of Cell Biology. 2011;192:939–948. doi: 10.1083/jcb.201010104. [DOI] [PMC free article] [PubMed] [Google Scholar]
- Updike DL, Knutson AK, Egelhofer TA, Campbell AC, Strome S. Germ-Granule Components Prevent Somatic Development in the C. elegans Germline. Current Biology. 2014;24:970–975. doi: 10.1016/j.cub.2014.03.015. [DOI] [PMC free article] [PubMed] [Google Scholar]
- Voronina E. The diverse functions of germline P-granules in Caenorhabditis elegans. Mol Reprod Dev. 2013;80:624–631. doi: 10.1002/mrd.22136. [DOI] [PubMed] [Google Scholar]
- Wang JT, Smith J, Chen BC, Schmidt H, Rasoloson D, Paix A, Lambrus BG, Calidas D, Betzig E, Seydoux G. Regulation of RNA granule dynamics by phosphorylation of serine-rich, intrinsically disordered proteins in C. elegans. Elife. 2014;3:449–23. doi: 10.7554/eLife.04591. [DOI] [PMC free article] [PubMed] [Google Scholar]
- Wang X, Schwartz JC, Cech TR. Nucleic acid-binding specificity of human FUS protein. Nucleic Acids Res. 2015;43:7535–7543. doi: 10.1093/nar/gkv679. [DOI] [PMC free article] [PubMed] [Google Scholar]
- Wippich F, Bodenmiller B, Trajkovska MG, Wanka S, Aebersold R, Pelkmans L. Dual specificity kinase DYRK3 couples stress granule condensation/dissolution to mTORC1 signaling. Cell. 2013;152:791–805. doi: 10.1016/j.cell.2013.01.033. [DOI] [PubMed] [Google Scholar]
- Wiśniewski JR, Hein MY, Cox J, Mann M. A “proteomic ruler” for protein copy number and concentration estimation without spike-in standards. Mol Cell Proteomics. 2014;13:3497–3506. doi: 10.1074/mcp.M113.037309. [DOI] [PMC free article] [PubMed] [Google Scholar]
- Wu Y, Zhang H, Griffin EE. Coupling between cytoplasmic concentration gradients through local control of protein mobility in the Caenorhabditis elegans zygote. Mol Biol Cell. 2015;26:2963–2970. doi: 10.1091/mbc.E15-05-0302. [DOI] [PMC free article] [PubMed] [Google Scholar]
- Zhang H, Elbaum-Garfinkle S, Langdon EM, Taylor N, Occhipinti P, Bridges AA, Brangwynne CP, Gladfelter AS. RNA Controls PolyQ Protein Phase Transitions. Mol Cell. 2015;60:220–230. doi: 10.1016/j.molcel.2015.09.017. [DOI] [PMC free article] [PubMed] [Google Scholar]
Associated Data
This section collects any data citations, data availability statements, or supplementary materials included in this article.