

Abstract
The discovery of therapies that modulate Pseudomonas aeruginosa virulence or that can eradicate chronic P. aeruginosa lung infections associated with cystic fibrosis (CF) will be advanced by an improved understanding of P. aeruginosa behavior in vivo. We demonstrate the use of multiplexed Nanostring technology to monitor relative abundances of P. aeruginosa transcripts across clinical isolates, in serial samples, and for the purposes of comparing microbial physiology in vitro and in vivo. The expression of 75 transcripts encoded by genes implicated in CF lung disease was measured in a variety of P. aeruginosa strains as well as RNA serial sputum samples from four P. aeruginosa-colonized subjects with CF collected over 6 months. We present data on reproducibility, the results from different methods of normalization, and demonstrate high concordance between transcript relative abundance data obtained by Nanostring or transcriptome sequencing (RNA-Seq) analysis. Furthermore, we address considerations regarding sequence variation between strains during probe design. Analysis of P. aeruginosa grown in vitro identified transcripts that correlated with the different phenotypes commonly observed in CF clinical isolates. P. aeruginosa transcript profiles in RNA from CF sputum indicated alginate production in vivo, and transcripts involved in quorum-sensing regulation were less abundant in sputum than strains grown in the laboratory. P. aeruginosa gene expression patterns from sputum clustered closely together relative to patterns for laboratory-grown cultures; in contrast, laboratory-grown P. aeruginosa showed much greater transcriptional variation with only loose clustering of strains with different phenotypes. The clustering within and between subjects was surprising in light of differences in inhaled antibiotic and respiratory symptoms, suggesting that the pathways represented by these 75 transcripts are stable in chronic CF P. aeruginosa lung infections.
INTRODUCTION
Several factors complicate the comparison of in vitro studies on Pseudomonas aeruginosa with infections in the cystic fibrosis (CF) lung. First, many different P. aeruginosa strains cause CF lung infections; thus, reliance on commonly used laboratory strains might limit our understanding of P. aeruginosa in CF (1–3). Second, laboratory or cell culture studies rarely incorporate coinfecting species and lack components of the lung environment, such as immune response factors, that shape P. aeruginosa phenotypes (4, 5). We know little about how these environmental stimuli influence P. aeruginosa (6–8). To complicate matters further, a single CF sputum sample contains mixtures of P. aeruginosa genotypes and phenotypes. A recent study has suggested that a mixture of strains influenced traits such as drug response in ways that were difficult to predict from the study of single strains (9). Clinical isolates of P. aeruginosa, even from the same respiratory sample, can have striking differences in phenotypes, including colony morphology, quorum-sensing regulation, and motility (9–13), and recent data highlight that there is gene expression diversity even among phenotypically similar strains (9). Given the significant limitations of the aforementioned laboratory approaches, novel methods for directly interrogating population-level microbial gene expression in the CF lung are needed to provide accurate information about the growth and virulence of P. aeruginosa in the CF airway.
While some of the P. aeruginosa phenotypes that evolve in the CF lung (6–8) are associated with negative clinical outcomes, it is not yet known whether variation in the respiratory health of individuals with CF and chronic P. aeruginosa lung infection is directly due to changes in pathogen state or the relative ratios of subpopulations with different phenotypes. Several studies have identified correlations among strain phenotypes in the laboratory to patient outcomes. In one study in children, certain morphological features of P. aeruginosa colonies were more common in cases where antibiotics failed to eradicate the organism (14). Mayer-Hamblett et al. (15) found that augmented pyoverdine production and attenuated protease production best distinguished infection stage (i.e., new-onset, intermittent, or chronic). This group of investigators also reported that mucoidy and reduced twitching motility were predictors of worse lung disease. Detection of either P. aeruginosa mucoid colony phenotype or LasR loss-of-function phenotype is associated with poor prognosis (8, 16–18). Thus, one explanation for varied patient health is changes in the dominant populations within the lung. Alternatively, other factors in the lung, such as changes in coinfecting bacteria, fungi, or viruses, or other changes in host status may influence host phenotype. Investigations of P. aeruginosa transcripts from clinical samples revealed that the expression of genes related to iron homeostasis (19), virulence (20, 21), and hypermutability (22) vary considerably among subjects, but the causes or consequences of these changes are not yet known. These questions represent a significant community-wide challenge.
Here, we report our novel application of Nanostring digital multiplexed gene expression technology (23) to serially quantify the expression levels of 75 P. aeruginosa mRNA transcripts associated with the activity of specific physiological pathways (i.e., biofilm production, quorum sensing, virulence, iron metabolism, and mucoidy) in expectorated sputum samples. Under laboratory conditions, the expression profiles of P. aeruginosa strains differed in ways that corresponded to phenotypic characteristics such as mucoidy. By analyzing sputum samples compared to P. aeruginosa strains grown in vitro, we found significant differences, including an altered transcript profile associated with alginate production, elevated levels of biofilm-associated transcripts and specific iron acquisition pathways, lower levels of quorum-sensing pathways, and increased expression of certain virulence-associated transcripts. Consistent with each subject being culture positive for mucoid P. aeruginosa, the in vivo profiles were more similar to mucoid P. aeruginosa than to P. aeruginosa strains with LasR− or classical phenotypes. There were no specific transcriptional changes associated with the inhaled antibiotic regimen used in the preceding month or in association with clinically meaningful changes in respiratory symptoms (24). The expression patterns in the sputum samples most closely clustered with each other, even across subjects with infections by different P. aeruginosa strains, leading us to propose the hypothesis that there is a common in vivo profile for the transcripts measured that transcends strain differences in this cohort (i.e., adults with CF who regularly expectorate sputum). This paper also includes several validation assays, including those that demonstrate reproducibility and concordance with data obtained by transcriptome sequencing (RNA-Seq) that may serve as a framework for future applications of this technology. Furthermore, we highlight the need for consideration of strain-to-strain variation and present an analysis of different methods used for normalization among samples, which is a particular consideration in the analysis of clinical samples where the amounts of pathogen RNA are not known.
MATERIALS AND METHODS
Patient recruitment and collection of sputum samples.
For the collection of serial sputum samples, four adult subjects from the New Hampshire CF Center with a history of at least one sputum culture positive for P. aeruginosa consented to participate in a protocol that was approved by the CPHS at Dartmouth College (CPHS 23645). All subjects provided a spontaneously expectorated sputum sample at each of six monthly outpatient visits. We also asked subjects to complete the teen/adult version of the CF Questionnaire-Revised (CFQ-R) at each monthly visit. The CFQ-R has been validated in the CF population as a way of assessing health-related quality of life (HRQOL) in 12 domains (physical, vitality, emotion, eating, treatment burden, health perspectives, social, body image, role, weight, respiratory, and digestive) (24). Scores in each domain range from 0 to 100, and higher scores signify better health. Each of the four subjects had P. aeruginosa-positive cultures throughout the 6-month study period. Isolates of P. aeruginosa were collected under protocol 20786.
Strains and growth conditions.
Detailed information on strains used in this study can be found in Table S1 in the supplemental material. P. aeruginosa strains were grown either in liquid LB-Lennox for 8 h at 37°C (FRD1, FRD1ΔalgU, CI224_M, CI224_nm, CI227, and CI228 strains) or as colony biofilms on tryptone agar for 24 h at 37°C (PAO1, PA14, DH1133, DH2415, PAO1ΔlasR, PA14ΔlasR, DH1132, DH2417, CFRL8, and CFRL11 strains). Data for the wild-type and ΔlasR strain pairs were also used in analyses published previously (25). Colony biofilms were inoculated from overnight cultures grown in LB medium at 37°C, and colonies were inoculated as 5-μl spots. Planktonic cultures were inoculated from overnight cultures grown on LB agar plates into 5 ml of LB medium for 10 h at 37°C. Cultures were then diluted 100× into 10 ml of prewarmed LB medium and incubated for 2.5 h at 37°C. The optical density at 600 nm (OD600) was measured, and cultures were adjusted to an initial OD600 of ∼0.001, grown in 25 ml of prewarmed LB at 37°C, and harvested for RNA isolation when they reached an OD600 of >1 (8 to 11 h, depending on the strain).
Isolation of total RNA.
Sputum samples were frozen and stored at −80°C until the time of RNA isolation. Samples were lyophilized in original specimen cups and lysed (5 times for 1 min each with 2 min on ice between rounds) using a mixture of 0.1-mm, 0.5-mm, and 1-mm beads in a Biospec mini-beadbeater 16 (Biospec Products, Bartlesville, OK). Samples were then resuspended in TRI Reagent (Zymo Research Corporation, Irvine, CA). RNA was extracted using Direct-zol RNA MiniPrep kits (Zymo Research Corporation, Irvine, CA) according to the manufacturer's instructions. The RNA from laboratory cultures was isolated as described above without the prior lyophilization step.
Nanostring analysis of P. aeruginosa transcripts.
We analyzed RNA using the Nanostring nCounter system (Nanostring Technologies, Seattle, WA) and methods described by Geiss et al. (26). We employed a custom-designed codeset containing 75 P. aeruginosa genes (see Table S2 in the supplemental material). The nucleotide sequences were provided to Nanostring Technologies, Inc., for codeset design and construction. Each reaction mixture contained 70 ng of RNA for P. aeruginosa from in vitro-grown cultures and 180 ng of RNA extracted from sputum in 5 μl, hybridization buffer, reporter probes, capture probes, as well as six positive and eight negative controls. RNA was hybridized with reporter and capture probes overnight at 65°C, and sample preparation ensued at the Nanostring preparation station. Finally, targets were counted on the nCounter using 255 fields of view per sample. Data were analyzed using nSolver Analysis Software, version 1.1 (Nanostring Technologies, Seattle, WA). Raw counts were normalized to the arithmetic mean of six spiked positive-control transcripts, and count values greater than two standard deviations above the average of the eight negative-control probes were considered above background.
RNA sequencing analysis.
RNA quality and quantity were assessed by a Fragment Analyzer (Advanced Analytical, Ankeny, IA) and Qubit (Invitrogen, Carlsbad, CA), respectively. Prior to library preparation, rRNA was removed using the Ribo-Zero rRNA removal kit for bacteria (Epicentre, Madison, WI). Directional RNA-seq libraries were prepared with the TruSeq stranded mRNA library preparation kit with unique TruSeq indexes. Samples were pooled and sequenced on an Illumina NextSeq500 instrument with the 2X75bp PE sequencing setting (mid-output flow cell). Raw reads were processed and normalized using the CLC Genomics Workbench platform (v8.5.1) using the default parameter setting installed by the manufacturer. All sequences were trimmed and mapped to the PAO1 (GenBank accession number NC_002516) reference genome from NCBI using the RNA-Seq analysis tool, and mapped reads were quantile normalized to control for any differences in library size.
Statistical analyses.
One method for the analysis of mRNA levels in total RNA isolated from either sputum or in vitro-grown P. aeruginosa cultures was via the normalization of transcript levels to the mean for rpoD, ppiD, and fbp (Fig. 1, left branch). For these analyses, the Mann-Whitney-Wilcoxon test was used to compare the transcripts in mucoid strains to those in nonmucoid strains. In addition, samples were compared using rank abundance values from 1 to 75 (there were 75 transcripts in the codeset), with 75 being the most abundant transcript in that sample. A Kruskal-Wallis test was used to determine differences between mucoid and nonmucoid strains or LasR-defective and LasR-intact strains. Heat map analysis was performed using the heatmap.2 function in the gplots package (v2.14.2) (27). We used the method of Bland and Altman (28) to examine the variability of differences in transcript rank abundance generated by RNA-Seq and Nanostring. The principal coordinate analysis (PCoA) was performed using the pco function with default Euclidean distance setting in the ecodist package (v 1.2.9) (29) in RStudio (v 0.98.994) running with R (v 3.1.1). For the analysis of different fliC type A and type B transcripts, the log2-transformed normalized reads were compared. To identify transcripts that differed between P. aeruginosa in sputum and mucoid P. aeruginosa strains grown in vitro, mixed-effect linear models of rank differences between in vitro-grown mucoid strains and repeated measures of sputum samples from the four samples were performed using a mixed-effect linear model (R package nlme, v 3.1.-128 [https://cran.r-project.org/web/packages/nlme/nlme.pdf]) in which patient was a random factor and mucoidy was modeled as a main effect.
FIG 1.

Analysis of transcript differences between mucoid and nonmucoid strains using the PAV2 Nanostring codeset. The scheme demonstrates the comparison of results obtained using two different normalization methods. (Left) In one analysis, raw counts were normalized to the mean levels of three housekeeping (HK) genes (ppiD, fbp, and rpoD). Statistical analyses of transcripts that differed between the mucoid and nonmucoid strains were performed on relative expression differences (P < 0.05 by Mann Whitney Wilcoxon test). The mean normalized counts for each transcript in each group, the fold difference between the means for the two groups, and the P value for the difference is shown. (Right) Raw counts were ranked in order of abundance from 1 (least abundant) to 75 (most abundant), and a Kruskal-Wallis test was used to determine which transcripts were significantly different between the mucoid and nonmucoid groups (P < 0.05). The difference in mean rank between the two groups is shown (Δ Rank). The housekeeping genes that were significantly different between the two groups are denoted by the superscript “a.”
Nucleotide sequence accession number.
The raw and processed RNA-Seq data have been deposited in the NCBI Gene Expression Omnibus under accession number GSE83773.
RESULTS
Identification of phenotypic differences among clinical P. aeruginosa strains by Nanostring RNA analysis.
We determined how P. aeruginosa gene expression profiles compared to strain colony phenotypes for clinical isolates grown in vitro and analyzed P. aeruginosa gene expression in sputum from individuals with CF. Thus, we developed a Nanostring codeset that monitors the expression of 75 transcripts associated with P. aeruginosa processes occurring in CF airway infections, including biofilm formation, alginate production, iron acquisition, quorum sensing, and virulence. Levels of each transcript were monitored using a set of two hybridizing probes complementary to each transcript of interest, with one probe enabling the capture of a transcript and the other containing a unique fluorescent bar code for transcript enumeration. The collection of probes used in this study is referred to as the PAV2 codeset.
To determine if data obtained using the PAV2 codeset could identify transcript level differences that correlate with different strain phenotypes, we analyzed RNA from 15 clinical isolates and two laboratory strains. These strains included seven strains with the classical P. aeruginosa colony phenotype (laboratory strains PAO1 and PA14 and five clinical isolates), four clinical isolates with the mucoid phenotype associated with alginate overproduction, and six strains with a LasR loss-of-function phenotype (including PA14ΔlasR and PAO1ΔlasR strains and four clinical isolates; see Table S1 in the supplemental material for strain sources). One strain (CI224_M) was included in both the mucoid and LasR loss-of-function categories, since it exhibited both phenotypic attributes. Cultures of each strain were grown as described in Materials and Methods and total RNA was extracted. Seventy nanograms of RNA was analyzed using the Nanostring technology, and the relative levels of each transcript were determined using the PAV2 codeset. We performed technical replicates for each of three P. aeruginosa strains: one with the classical phenotype (CI224_nm [DH2243]), one mucoid strain (CFRL8 [DH2529]), and one with the LasR-defective phenotype (CFRL11 [DH2531]). Pairwise analysis of technical replicates found very high concordance for transcripts in each strain (see Fig. S1A), and the transcript profiles were different between strains, as shown in a rank abundance heat map analysis of counts per transcript (see Fig. S1B), demonstrating high technical reproducibility.
To assess differences in transcript profiles between strains with classical, LasR-defective, and mucoid phenotypes, we used a Mann-Whitney-Wilcoxon test to identify transcripts that were significantly different (P < 0.05) between mucoid and nonmucoid groups. Specifically, we compared profiles for strains with mucoid phenotypes (FRD1, CI228, CI224_M, and CFRL8) to those for all of the nonmucoid strains (including those with the classical and LasR-defective strain phenotypes described above) using count values normalized to the average transcript counts of three housekeeping genes, fbp, rpoD, and ppiD. Consistent with the increased production of alginate in the mucoid strains, we found that levels of transcripts associated with alginate production, algD, algI, and algU, were higher in mucoid strains; algD and algI had the largest fold differences (P < 0.05 by Mann-Whitney-Wilcoxon Test) (Fig. 1, left arm). Levels of three transcripts, ivy (inhibitor of vertebrate lysozyme), plcR (cotranscribed with plcH, which encodes a phospholipase C), and fbp (fructose-1,6-bisphosphatase), were also significantly higher in the mucoid strains than the nonmucoid strains. Levels of three transcripts, norC (nitric-oxide reductase subunit C), flgD (flagellar basal-body rod modification protein), and rpoD (sigma factor), were significantly lower in the mucoid strains than nonmucoid strains. Because two of the nine genes that varied significantly between the mucoid and nonmucoid groups were the housekeeping transcripts used for normalization, we concluded that the transcripts we selected for normalization varied across samples, and we sought another method for transcript normalization. As an alternative approach to compare transcript levels between mucoid and nonmucoid strains, we employed a rank-abundance method that we applied without normalization to specific transcripts or to total signal. In the rank abundance analysis, the 75 transcripts were ranked in terms of their abundance, with rank 1 being the transcript with the lowest number of raw counts. The Kruskal-Wallis test was then used to determine which transcripts changed significantly across samples (P < 0.05). Again, transcripts associated with alginate production (algD, algI, and algU) were the most significantly different (Fig. 1, right arm, and 2A), confirming that rank abundance analysis detects transcript differences that correlate with strain phenotype. Analysis based on normalization to housekeeping genes also found ivy, norC, and flgG to be differentially expressed (Fig. 1, left arm), as was the case for genes associated with motility (flgD and flgK) and denitrification (nirS), consistent with the expectation of reduced flagellar motility and denitrification in mucoid strains based on prior publications (30, 31).
FIG 2.

Comparison of selected transcripts that differed between P. aeruginosa strains with different phenotypes. Rank abundance analyses show the most highly expressed genes in yellow and the least highly expressed genes in red, as shown in the legend. (A) Subset of genes involved in extracellular carbohydrate production that differed between mucoid and nonmucoid strains. (B) Subset of genes associated with quorum sensing in LasR-competent and LasR-deficient strains.
Quorum sensing is a regulatory system in which the accumulation of extracellular signaling molecules positively regulates the expression of many virulence-regulated transcripts in P. aeruginosa. Smith et al. (18) reported that loss-of-function mutations develop in quorum-sensing and other virulence genes as P. aeruginosa lung infection evolves in CF patients. As we did in the analysis of the mucoid strains described above, we compared strains with a LasR loss of function to strains with intact LasR signaling. Predictably, the LasR− clinical isolates had significantly lower levels of LasR-regulated targets (P < 0.05 by Kruskal-Wallis Test; see Table S3 in the supplemental material for data), including those involved in acyl-homoserine lactone production (lasI and rhlI), the quinolone signaling pathway (pqsA, pqsH, and pqsE), and the LasR-regulated elastase (lasB). The abundance of transcripts associated with production of quorum-sensing-regulated phenazines (phzA2, phzC, phzH, and phzM) and rhamnolipid (rhlA) was lower in LasR− clinical isolates (Fig. 2B). A number of transcripts were significantly higher in the LasR− strains in this in vitro analysis, and most of these transcripts are Anr regulated (see Table S3, sheets 1 and 2) (32). Increased levels of Anr-regulated transcripts in LasR− strains is consistent with the finding that the level of Anr regulon is higher in strains with QS deficiencies (25).
Comparison of transcript profiles determined by Nanostring and RNA-Seq.
To assess the ability of the PAV2 codeset to identify differences in relative transcript levels, we performed RNA-Seq on RNA isolated from two mucoid P. aeruginosa strains, FRD1 and CI224_M. We then created a subset of the RNA-Seq data set that included only the transcripts that were also present in the Nanostring PAV2 codeset (see Table S4 in the supplemental material) in order to compare the two data sets. We excluded exoU transcripts, which appeared to be absent from both strains (FRD1 and CI224_M), and fliC alleles because of their variation between the strains (discussed further in the next section). Because Nanostring probes were not designed to distinguish between two sets of highly similar paralogs (PA4210 [phzA1] and PA1899 [phzA2], with 98% identity over 87% of the length of the gene, and PA4212 [phzC1] and PA1901 [phzC2], with 99% identity over the length of the gene [see Table S2]), we summed the reads for phzA1 and phzA2 (reported as phzA) and phzC1 and phzC2 (reported as phzC) for the rank abundance analysis.
To visualize the similarity between RNA-Seq and the Nanostring analyses, we performed a rank abundance heat map analysis of counts per transcript (see Fig. S2A in the supplemental material). We first performed linear regression, which yielded coefficients of determination (R2) for correlations between RNA-Seq and Nanostring (see Fig. S2B). For FRD1 and CI224_M, R2 values were 0.83 and 0.77, respectively, which indicates a very good correlation between the results of the two methods. As pointed out by Zaki et al. (33), however, this approach may not be sufficient to assess agreement between two methods. Therefore, we also conducted Bland-Altman analyses to determine bias and agreement (see Fig. S2C). There was excellent concordance between the modalities, with only a few transcripts for each strain falling outside the 95% confidence interval for agreement and only one transcript (PA3327) was showing a consistent lack of concordance in both samples. This PA3327 Nanostring probe seems to be strongly underestimating the number of transcripts present in samples.
Nanostring analyses of clinical isolates must consider genome sequence variation.
Because the Nanostring transcript quantification method is predicated on hybridization, it is important to consider variation among target sequences when analyzing clinical isolates. One set of genes known to vary by sequence type includes those associated with flagellum biosynthesis. P. aeruginosa strains have one of two sets of flagellar alleles (type A and type B), and we included probes that would specifically recognize each type (fliC type A and type B). The probe that recognizes fliC type B hybridizes to fliC alleles in strains PAO1 and PA14 and had 100% identity to the fliC allele in 5 of the 12 P. aeruginosa genomes analyzed (PAO1, PA14, LESB58, DK2, and C3719) (Fig. 3A). The fliC type A probe corresponded to sequences that were 99 to 100% identical in the remaining seven P. aeruginosa genomes (PASC2, RP72, NCGM2.S1, M18, 39016, 2192, and PA7) (Fig. 3A). Previous studies had shown similar distributions of fliC alleles in clinical isolates (34, 35). As expected based on the sequence identity between the different fliC alleles and the allele-specific probes, only fliC type B transcripts were present above the background in PAO1, PA14, 2415, DH2417, CI227, CI228, FRD1, FRD1ΔalgU, and CFRL8 strains and only fliC type A transcripts were above background in CFRL8, CI224_M, CI224_nm, DH1133, DH1132, and CFRL11 strains (Fig. 3B). We showed that mucoidy was correlated with lower levels of flagellar gene expression (Fig. 1), and only the present or high-abundance fliC transcript showed decreased expression in mucoid strains relative to their nonmucoid comparator (FRD1 versus FRD1ΔalgU strain, CI228 versus CI227, and CI224_M versus CI224_nm). While the fliC transcripts provide an indication of strain type and can reflect transcriptional status of the flagellar operon, the other flagellar genes, flgD, flgG, and flgK, do not vary in sequence across strains (Fig. 3A) and thus provided a strain-independent measure of flagellar gene expression (Fig. 3B).
FIG 3.

Variation in genomic sequence and expression levels for motility-associated genes. (A) Across 12 P. aeruginosa strains, the fliC gene exists in 2 variants (type A and type B) that require separate Nanostring probes for detection due to the low sequence identity. Other flagellar genes, flgD, flgG, and flgK, are highly similar across different P. aeruginosa strains. (B) Rank abundance analyses of P. aeruginosa flagellar genes in clinical isolates and laboratory strains grown in vitro. The legend indicates the rank abundance of transcript, with 75 indicating the most abundant transcript.
Other genes within the P. aeruginosa genome show sequence variation among strains, but the pattern is less binary than that for fliC. Because the Nanostring method detects transcripts using probes that hybridize to 80- to 100-bp-long stretches, sequences with greater than 90% identity across the length of the probe should be detected when the analysis is performed according to the manufacturer's instructions. For 67 of the 75 probe sets included in the PAV2 codeset, there was 98% ± 1.5% sequence identity between the Nanostring probe and the corresponding genome sequence in 11 P. aeruginosa genomes. PA7 consistently showed less homology to probe sequences than the other P. aeruginosa genomes, although it had greater than 90% identity for all probes except for the phzM probe, which had only 87% identity over the length of the probe (36). For mucoidy and quorum-sensing-related transcripts shown in Fig. 2, the sequences corresponding to the probes were >95% identical across all sequenced P. aeruginosa genomes.
For the remaining eight transcript-specific probe sets in PAV2, there was either variability in the presence of the target gene among P. aeruginosa strains (e.g., exoU, a type III secreted effector present only in some P. aeruginosa strains) or there was significant sequence heterogeneity, with some sequences being less than 90% identical between strains in a Clustal Omega analysis (see Fig. S3 in the supplemental material). The variable loci were associated with type III secretion systems and effectors, type VI secretion systems and effectors, and pyoverdine siderophore biosynthesis. These structures vary among strains (37–40). This finding suggests that Nanostring analysis of some transcripts across different genotypes requires the inclusion of probes that target multiple alleles, as demonstrated here for fliC, and/or DNA sequence analysis to confirm the target sequence will hybridize to the probe.
Acquisition of P. aeruginosa from serial CF sputum samples and associated data on sputum microbiology and patient status.
We determined if there was variation in P. aeruginosa transcriptional profiles in P. aeruginosa RNA extracted directly from sputum and if there were correlations between transcript profiles and either health status or specific antibiotic therapies. Serial sputum samples and health-related quality-of-life data were collected from four P. aeruginosa-infected subjects at monthly intervals over the course of 6 months. The subjects included one male and three females with severe to moderate lung function impairment (Table 1). All of the sputum cultures detected P. aeruginosa, with some or all of the colonies from the sample having a mucoid phenotype. One of the subjects also cultured positive for methicillin-resistant Staphylococcus aureus (MRSA) and the other three had at least one sputum sample positive for Aspergillus fumigatus (Table 1). Total RNA was isolated from serial sputum samples collected monthly from each of four subjects over 6 months. Our final analysis included four to seven samples in each series. Missing samples within the series from subjects 10 and 13 were due either to the subject's inability to produce a sputum sample at that office visit or because only small quantities of poor-quality RNA were recovered from the sample.
TABLE 1.
Subject characteristics and culture resultsa
| Identifierb | Age (yr) | Gender | BMI | FEV1% | Inhaled antibiotic cycle (by month) |
|||||
|---|---|---|---|---|---|---|---|---|---|---|
| 1 | 2 | 3 | 4 | 5 | 6 | |||||
| 10 | 32 | F | 20.3 | 55 | P, mP, A | P, mP | P, mP | |||
| 13 | 27 | M | 21.0 | 78 | P, mP, A | P, A | ||||
| 16 | 24 | F | 22.7 | 66 | P, mP, MRSA | P, mP, MRSA | ||||
| 17 | 44 | F | 23.1 | 32 | P, mP, A | P, A | ||||
Abbreviations: F, female; M, male; BMI, body mass index; FEV1%, forced expiratory volume in 1 s, expressed as percent predicted; P, P. aeruginosa; mP, mucoid P. aeruginosa; MRSA, methicillin-resistant S. aureus; A, Aspergillus fumigatus.
Subjects 10, 13, and 17 were CFTRΔF508 heterozygous, and subject 16 was CFTRΔF508 homozygous.
Comparison of sputum-derived RNA and RNA from P. aeruginosa grown in vitro.
Studies published by us (21, 41, 42) and others (19, 43) have demonstrated the ability to measure microbial mRNAs in total RNA extracted directly from sputum. To better characterize the quality and amount of the P. aeruginosa RNA in total RNA from sputum, we compared the total counts for all 75 transcripts, mean number of counts per transcript, and the median counts per transcript for the 23 sputum-extracted RNAs and for the RNA extracted from the 17 in vitro-grown samples. First, we compared the total counts (the sum of counts for all 75 transcripts). For in vitro-grown P. aeruginosa samples, 70 ng of total RNA was analyzed by PAV2; for the analysis of total RNA from sputum, 180 ng of total RNA, which contained RNA from multiple sources, including the human host, was analyzed (see Table S5 in the supplemental material). We found that there was an average of 117,684 total counts per sample for the in vitro-grown P. aeruginosa samples and an average of 98,010 total counts per sample in the sputum samples. Based on the comparable levels of total PAV2 counts and the fact that approximately 2.5-fold more RNA was analyzed for the sputum samples, we concluded that P. aeruginosa RNA likely comprised approximately one-fourth to one-half of the total RNA from sputum. A similar relationship between the sputum and in vitro sample groups was also observed when we compared the averages of the mean counts per transcript per sample. PAV2 analysis of sputum RNAs found, on average, a mean of 1,569 counts per transcript (with 394 and 4,231 as the minimum and maximum mean counts per transcript, respectively); in vitro-grown samples had an average value of 1,348 mean counts per transcript, with a range between 463 and 2,907 mean counts per transcript for samples in this group (see Table S5 for mean and median count values for each sample).
Our data also indicated that both the in vitro and sputum RNAs contained transcripts detected at a range of levels. In PAV2 analysis of both in vitro and sputum RNAs, we found that the average of the median counts per transcript was 10-fold lower than the average maximum number of counts for a single transcript within that group. These large ranges of transcript counts within samples strongly supports the notion that RNA, rather than DNA, was being measured. (In DNA, all loci are present in single copy.) In general, the range of transcript abundances within the in vitro samples was greater than that in the sputum RNA samples.
Evidence for a common P. aeruginosa sputum profile independent of time and strain.
A heat map analysis of all 75 transcripts versus a collection of laboratory strains and clinical isolates revealed a striking similarity observed across sputum samples from the same subject and from sputum samples from across subjects (Fig. 4A; see also Fig. S5 in the supplemental material for transcript and sample labels). The concordance across sputum samples was particularly striking, especially when transcripts that likely vary at the DNA sequence level between strains were not considered (Fig. 4A, arrows). A PCoA of all in vitro and in vivo samples included in this study further illustrated the close clustering of sputum samples with each other and their distinct clustering away from clinical isolates grown in vitro (Fig. 4B). While it is not surprising that there were transcriptional differences between cells grown in planktonic LB medium and isolates contained in sputum, it is striking that sputum harboring different strains (shown in Fig. 5A as described below) collected at various time points and under various health contexts, as measured by the CFQ-R respiratory symptom score (RSS) (see Fig. S4 and Table S6), had largely similar profiles for the 75 transcripts.
FIG 4.

Comparisons of transcript profiles across in vivo and in vitro samples obtained using the PAV2 Nanostring codeset. (A) Simplified rank abundance heat map of all transcripts in all samples analyzed. The detailed heatmap with all sample identifiers and all transcript names is presented in Fig. S3 in the supplemental material. For the in vitro samples, the strain phenotype (classical, mucoid, or LasR deficient) is shown. For the in vivo samples, the subject number and treatment code (A, aztreonam; C, colistimethate; T, tobramycin; and N, no treatment) is shown. Transcripts that likely vary at the DNA sequence level between strains are indicated by arrows: 1, fliC type B and fliC type A, respectively; 2, popB; 3, exoU and pscC (top and bottom); 4, pldA; 5, pvdA; 6, PA4929. (B) Principal-component analysis of the ranks of all PAV2 transcripts in all in vivo and in vitro samples. All in vivo (black) samples cluster together and are distinct from the in vitro samples. The in vitro samples can be separated into three clusters: the classical strains, including the laboratory strains PAO1 and PA14 (in green), the mucoid strains (in red), and the LasR-deficient strains (in blue). CI224_M is both mucoid and LasR deficient and is located between both clusters and labeled in red text surrounded by a blue line.
FIG 5.
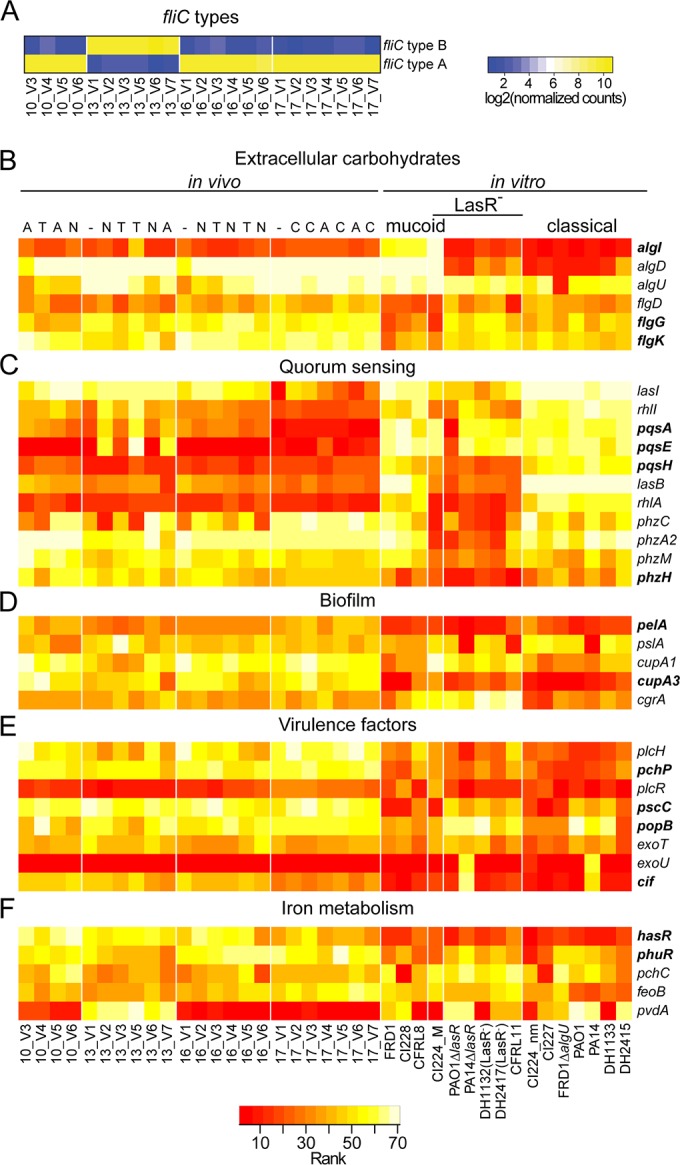
P. aeruginosa gene expression in vivo in serial sputum samples from four CF subjects and in P. aeruginosa strains grown in vitro. (A) Detection of different fliC gene alleles present among CF subjects. Note that log2-transformed normalized reads were used in the comparison of levels of the fliC type A and B alleles. The flagellar type remained constant within a subject across the series. (B to F) Rank abundance analysis indicating levels of transcripts (most abundant in yellow and least abundant in red). Panels show subsets of genes involved or coregulated with extracellular carbohydrate production (B), quorum sensing (C), biofilm formation (D), virulence (E), and iron acquisition (F). The sample and strain names are along the bottom. For the in vivo samples, the first number indicates the subject (10, 13, 16, and 17), and the number following the “V” indicates the visit number within the 6-month enrollment period. Letters above each in vivo sample column denote the type of inhaled antibiotic used at the time of sample collection (A, aztreonam; C, colistimethate; T, tobramycin; and N, no treatment). The in vivo samples (RNA extracted from sputum) and in vitro mucoid strains were compared, and the genes highlighted in boldface were statistically differentially ranked following correction for multiple hypotheses (false discovery rate-corrected P value of <0.05).
Analysis of similarities and difference between sputum-derived and in vitro-grown P. aeruginosa RNA.
To compare the P. aeruginosa PAV2 profiles for mRNA from sputum to the mRNAs from in vitro-grown P. aeruginosa, we analyzed the data for all samples by rank abundance and visualized the data as a heat map (see Fig. S4 in the supplemental material, which used data shown in Table S5). First, we analyzed the strain-specific fliC transcripts. Analysis of the relative counts for the fliC type A and type B alleles showed that three of the individuals were colonized by strains with fliC type A alleles and one subject was colonized by a strain(s) with an fliC type B allele. There were no instances of a shift from an fliC type A and type B population within an individual across the serial samples from that subject (Fig. 5A).
All subjects had positive clinical sputum cultures for the mucoid P. aeruginosa (Table 1). Of the 75 transcripts analyzed, the algD transcript, which is involved in production of the exopolysaccharide alginate, was highly abundant in all of the sputum samples (Fig. 5B). Transcript levels for algU, which encodes a gene product that positively regulates both its own transcription and that of algD, were also uniformly high (44, 45). While algI was also among the most abundant transcripts in mucoid strains relative to nonmucoid strains in the in vitro samples, algI was not at high relative abundance in P. aeruginosa RNA isolated from sputum across all 23 samples from four independent subjects. AlgI is involved in alginate acetylation and is not required for alginate biosynthesis (46), and these data suggest that the transcription or stability of algI is modulated in the in vitro environment.
In our analysis of mucoid versus nonmucoid strains grown in vitro, we found a significant negative correlation between alginate-associated transcript levels and flagellar transcript levels. Interestingly, flgK, flgG, and flgD were at higher rank abundance in the sputum RNAs than in RNAs from the mucoid strains grown in vitro in liquid medium, suggesting the presence of subpopulations within the sputum sample with elevated flagellar expression or that there is higher flagellar gene expression relative to alginate gene expression in P. aeruginosa in the lung (47). When the sputum RNAs were compared to the in vitro profiles of the mucoid strains grown in LB with aeration at 37°C, we found that algI was significantly different but algD and algU were not (Fig. 5B). ivy, a transcript found to be significantly more abundant in mucoid strains than in nonmucoid strains in the in vitro analysis, was at similar relative abundance in sputum RNAs and in RNA from mucoid strains grown in vitro.
Analysis of quorum-sensing-associated genes in sputum-derived P. aeruginosa RNA.
Variation in the relative levels of quorum-sensing-related genes was observed between subjects. For example, in subject 17, we observed lower sputum levels of the transcripts encoding enzymes involved in the synthesis of key quorum-sensing signals (lasI, rhlI, and pqsA) than in subjects 10, 13, and 16 (Fig. 5C), suggesting the presence of a QS-defective mutant (48, 49) in subject 17. In subject 13, the relative abundance levels of rhlI, pqsA, and pqsE fluctuated over the serial samples, while no other transcripts showed a similar pattern, raising the question of whether population-level changes occur over time. A comparison of all of the sputum RNA profiles to profiles of mucoid strains grown in vitro found a statistically significant trend with lower levels of quorum-sensing-regulated transcripts in sputum RNA compared to strains grown in vitro (Fig. 5C). While the levels of some of the quorum-sensing-controlled genes measured here were lower than levels in mucoid strains grown in vitro, including hcnA, involved in cyanide biosynthesis, lasB, which encodes an elastase, and rhlA, associated with rhamnolipid biosynthesis (50), the phenazine biosynthetic genes phzA, phzC, phzM, and phzH were among the most abundant transcripts in all samples and were not at levels lower than those in in vitro cultures. (Fig. 5C). The finding that phenazine-associated transcripts were high is consistent with the detection of high levels of redox-active small-molecule phenazines in CF sputum (50). The disconnection between phenazine-related transcript levels and other quorum-sensing-associated transcripts suggests a mode of regulation that is not directly correlated with levels of QS. Future studies will determine if this type of profile is associated with variation in dominant P. aeruginosa populations or changes in the environment in the lung (discussed in more detail below).
Biofilm-associated transcripts in sputum-associated RNA.
Transcripts encoding the biofilm matrix carbohydrates Pel and Psl were at a lower rank abundance than the alg genes (Fig. 5A). pelA transcripts were present at a significantly higher relative abundance in RNA isolated from sputum than from mucoid strains grown in culture (Fig. 5D). Transcripts associated with the production of CupA fimbriae, a surface appendage also associated with biofilm formation, were also more highly expressed in sputum than in in vitro cultures (Fig. 5D). Transcription of the cupA1-5 operon and cgrA-C, which encodes the cupA regulator, is controlled by Anr, an oxygen-responsive regulator (25, 32, 51).
Virulence-associated transcripts in sputum-associated RNA.
Previous work has shown high expression of genes associated with production and activity of PlcH, a hemolytic phospholipase C, in RNAs from CF sputum (52). Consistent with this finding, plcH and plcR were at higher rank abundance in the sputum RNAs than the RNAs from in vitro-grown cultures. The transcript encoding the choline phosphate phosphatase, which acts on choline phosphate (the product of PlcH activity), also showed this trend. Similarly, levels of transcripts associated with the type III secretion system (pscC and popB) were significantly higher in the sputum RNAs than in the mucoid RNAs from strains grown in culture. The level of transcript encoding the T3SS effector ExoT was not significantly higher in sputum RNAs than in RNA from mucoid strains, and none of the samples had detectable levels of exoU, a potent type III-secreted cytotoxin that is present only in a subset of P. aeruginosa strains (53). The level of transcript encoding cif was also significantly higher (P < 0.05) in RNA from sputum than from in vitro-grown cultures (Fig. 5E).
Profiles associated with iron acquisition by P. aeruginosa in vivo.
Because numerous studies have found links between iron availability and the state of CF lung disease (50, 54–56), we examined transcripts associated with iron metabolism by analyzing levels of hasR, phuR, pchC, feoB, and pvdA. The levels of transcripts hasR and phuR were significantly higher (P < 0.05) in P. aeruginosa RNA from sputum than in RNA from in vitro-grown mucoid strains, LasR− strains, or classical phenotypes (Fig. 5F) where pchC (involved in pyochelin biosynthesis) and feoB (involved in ferrous iron uptake) were not significantly different. Because pvdA, which encodes l-ornithine N5-oxygenase, involved in pyoverdine biosynthesis (57), can vary in sequence based on the type of Pvd cluster present (39) (see Fig. S3 in the supplemental material), we speculate that the striking differences in pvdA levels across subjects also reflect gene sequence differences. The higher expression of hasR and phuR is consistent with the utilization of heme as an iron source when P. aeruginosa is in the CF lung (58).
DISCUSSION
This study describes the novel application of multiplexed Nanostring technology to quantify P. aeruginosa mRNA transcripts in CF sputum samples. We showed that Nanostring analysis could detect variation in the expression pattern of 75 transcripts in phenotypically different P. aeruginosa strains, in samples from different subjects, and in samples collected at different time points from the same subject. Quantifying gene expression by the Nanostring method is efficient and avoids the potentially confounding effects of in vitro culture conditions. Analysis of the total counts for the 75 transcripts indicated that P. aeruginosa RNA comprised 25 to 50% of the RNA in most samples. Our analysis of bulk sputum allows for the analysis of transcripts that represent multiple key pathways at the population level in samples from the CF lung, and while we are only measuring 75 transcripts in this study, the RNA sample subsequently could be analyzed by other methods, including additional Nanostring codesets, quantitative reverse transcription PCR, or whole-transcriptome profiling methods. The transcriptional signatures that we obtained from the analysis of serial sputum samples from four subjects provided a picture that was consistent with other studies that analyzed P. aeruginosa directly in sputum. For example, we found evidence for production of alginate and nonalginate exopolysaccharides (59, 60), phospholipase C (21), phenazines (61), and iron-scavenging compounds (62) in vivo.
P. aeruginosa isolates from CF patients are heterogeneous. For example, by analyzing 34 sputum samples collected from a single CF patient over the span of 1 year, Workentine et al. (63) identified significant phenotypic variation among P. aeruginosa isolates with the same colony morphotype (i.e., mucoid or nonmucoid), even when they came from the same sample. As further evidence of P. aeruginosa phenotypic variability in CF sputum, colonies of the same morphotype often have different in vitro antibiotic susceptibility profiles (9, 64). Thus, accurate characterization of the phenotype of the P. aeruginosa population in vivo has been elusive. While these methods do not provide resolution at the level of single cells or subpopulations with a common genotype, the largely uniform profiles across serial samples from the same subject, despite differences in therapy or respiratory health, and even across subjects, suggests that the lung environment induces a common response in the majority of cells in CF sputum.
Several lines of evidence suggest that P. aeruginosa exists in a biofilm-like state in the lung and that in vivo biofilm lifestyle influences its susceptibility to drugs (65–67). Antibiotics only modestly or transiently alter microbial community structure in the lungs of CF patients despite improvements in health status (68–70). These observations led us to question whether the salubrious effects of antibiotics were associated less with their microbicidal activity and more with how they affect bacterial phenotypes in the lung, as evidenced by their gene transcription profiles. To determine if specific transcripts varied in relation to antibiotic treatment (see Fig. S5 in the supplemental material) over the preceding month or health status at the time of visit, we analyzed the sputum transcriptional profiles in relation to these data. A comparison of samples collected after a common drug regimen (e.g., tobramycin) did not find transcripts that showed significant correlations with the type of inhaled drug over the preceding month (data not shown). While we did not see significant differences in profiles that correlated with use or abstinence from a particular antibiotic, the samples collected in this study were taken at the end of a 30-day period on the indicated treatment (antibiotic or no inhaled antibiotic). Future studies will determine if changes in P. aeruginosa profiles are evident earlier after a change in treatment, as it is possible that cells in chronic infections return to a steady state after sustained antibiotic exposure.
Much of the literature pertaining to the CF sputum microbiome has demonstrated that bacterial richness and abundance vary modestly despite changes in clinical status and antibiotic treatment (68, 69, 71). In this study, each subject had at least one set of sequential samples for which there was a clinically relevant change in CFQ-R RSS (≥4 points) (72–78) (see Fig. S4 in the supplemental material). We employed the CFQ-R because it is a generally accepted framework for discussing health-related quality of life for this disease (79–81). Whether the ebb and flow of respiratory symptoms in CF are associated with changes in microbial gene transcription is not yet known. Here, we did not observe discrete transcriptional patterns among these 75 transcripts that correlated with differences in patient respiratory health, but additional studies are required in order to determine whether P. aeruginosa gene expression varies between periods of disease stability or disease exacerbation.
Based on our successful application of the Nanostring platform to the analysis of sputum mRNA transcripts, we propose that the use of codesets for additional genes reveals differences in the abundance of specific P. aeruginosa transcripts between subjects. Use of other codesets indicates the utility of different treatments or may be able to indicate, at an early time point, when therapy is working. Similar approaches to personalized medicine using the Nanostring platform have recently been advanced for children with septic shock in which glucose uptake pathways were analyzed (82) and for women with early-stage breast cancer (83). The ability to ascertain whether a CF patient harbors P. aeruginosa that is iron starved stands to inform the use of inhaled iron chelators. Conversely, the mRNA signature of a quorum-sensing mutant (Fig. 5C, subject 17) might predict diminished efficacy of quorum-sensing inhibitors under investigation (84). Clinicians generally select antibiotics to treat infections based on the in vitro susceptibility profiles of bacteria isolated in the laboratory. However, this paradigm is no more effective than empiricism in those with CF and P. aeruginosa infection (64, 85, 86), highlighting the need for novel approaches.
This technology allows for the analysis of numerous transcripts (dozens to hundreds) in a nonenzymatic analysis that negates the need to eliminate contaminating DNA from clinical samples. Thus, this methodology is a very useful complementary approach to the analysis of transcripts using global profiling methods such as microarray (43) or RNA-Seq, in that it allows for the rapid and easy analysis of many clinical samples. Furthermore, rapid sample preparation makes it possible to analyze small amounts of material that would be insufficient for a broader analysis.
Supplementary Material
ACKNOWLEDGMENTS
This work was funded by the National Institute of Allergy and Infectious Disease (R01AI091702), Cystic Fibrosis Research Development Program (STANTO07R0), the National Institute of General Medical Sciences (NIGMS) (P30GM106394), and the National Center for Advancing Translational Sciences (NCATS) (KL2TR001088 for A.H.G.). This work was also supported in part by the William H. Neukom 1964 Institute for Computational Science (J.E.H. and D.A.H.).
Footnotes
Supplemental material for this article may be found at http://dx.doi.org/10.1128/IAI.00437-16.
REFERENCES
- 1.Fux CA, Shirtliff M, Stoodley P, Costerton JW. 2005. Can laboratory reference strains mirror “real-world” pathogenesis? Trends Microbiol 13:58–63. doi: 10.1016/j.tim.2004.11.001. [DOI] [PubMed] [Google Scholar]
- 2.Spencer DH, Kas A, Smith EE, Raymond CK, Sims EH, Hastings M, Burns JL, Kaul R, Olson MV. 2003. Whole-genome sequence variation among multiple isolates of Pseudomonas aeruginosa. J Bacteriol 185:1316–1325. doi: 10.1128/JB.185.4.1316-1325.2003. [DOI] [PMC free article] [PubMed] [Google Scholar]
- 3.Head NE, Yu H. 2004. Cross-sectional analysis of clinical and environmental isolates of Pseudomonas aeruginosa: biofilm formation, virulence, and genome diversity. Infect Immun 72:133–144. doi: 10.1128/IAI.72.1.133-144.2004. [DOI] [PMC free article] [PubMed] [Google Scholar]
- 4.Borriello G, Werner E, Roe F, Kim AM, Ehrlich GD, Stewart PS. 2004. Oxygen limitation contributes to antibiotic tolerance of Pseudomonas aeruginosa in biofilms. Antimicrob Agents Chemother 48:2659–2664. doi: 10.1128/AAC.48.7.2659-2664.2004. [DOI] [PMC free article] [PubMed] [Google Scholar]
- 5.Folkesson A, Jelsbak L, Yang L, Johansen HK, Ciofu O, Hoiby N, Molin S. 2012. Adaptation of Pseudomonas aeruginosa to the cystic fibrosis airway: an evolutionary perspective. Nat Rev Microbiol 10:841–851. doi: 10.1038/nrmicro2907. [DOI] [PubMed] [Google Scholar]
- 6.Bragonzi A, Paroni M, Nonis A, Cramer N, Montanari S, Rejman J, Di Serio C, Doring G, Tummler B. 2009. Pseudomonas aeruginosa microevolution during cystic fibrosis lung infection establishes clones with adapted virulence. Am J Respir Crit Care Med 180:138–145. doi: 10.1164/rccm.200812-1943OC. [DOI] [PubMed] [Google Scholar]
- 7.Mulcahy LR, Burns JL, Lory S, Lewis K. 2010. Emergence of Pseudomonas aeruginosa strains producing high levels of persister cells in patients with cystic fibrosis. J Bacteriol 192:6191–6199. doi: 10.1128/JB.01651-09. [DOI] [PMC free article] [PubMed] [Google Scholar]
- 8.Hoffman LR, Richardson AR, Houston LS, Kulasekara HD, Martens-Habbena W, Klausen M, Burns JL, Stahl DA, Hassett DJ, Fang FC, Miller SI. 2010. Nutrient availability as a mechanism for selection of antibiotic tolerant Pseudomonas aeruginosa within the CF airway. PLoS Pathog 6:e1000712. doi: 10.1371/journal.ppat.1000712. [DOI] [PMC free article] [PubMed] [Google Scholar]
- 9.Darch SE, McNally A, Harrison F, Corander J, Barr HL, Paszkiewicz K, Holden S, Fogarty A, Crusz SA, Diggle SP. 2015. Recombination is a key driver of genomic and phenotypic diversity in a Pseudomonas aeruginosa population during cystic fibrosis infection. Sci Rep 5:7649. doi: 10.1038/srep07649. [DOI] [PMC free article] [PubMed] [Google Scholar]
- 10.Clark ST, Diaz Caballero J, Cheang M, Coburn B, Wang PW, Donaldson SL, Zhang Y, Liu M, Keshavjee S, Yau YC, Waters VJ, Elizabeth Tullis D, Guttman DS, Hwang DM. 2015. Phenotypic diversity within a Pseudomonas aeruginosa population infecting an adult with cystic fibrosis. Sci Rep 5:10932. doi: 10.1038/srep10932. [DOI] [PMC free article] [PubMed] [Google Scholar]
- 11.Warren AE, Boulianne-Larsen CM, Chandler CB, Chiotti K, Kroll E, Miller SR, Taddei F, Sermet-Gaudelus I, Ferroni A, McInnerney K, Franklin MJ, Rosenzweig F. 2011. Genotypic and phenotypic variation in Pseudomonas aeruginosa reveals signatures of secondary infection and mutator activity in certain cystic fibrosis patients with chronic lung infections. Infect Immun 79:4802–4818. doi: 10.1128/IAI.05282-11. [DOI] [PMC free article] [PubMed] [Google Scholar]
- 12.Chung JC, Becq J, Fraser L, Schulz-Trieglaff O, Bond NJ, Foweraker J, Bruce KD, Smith GP, Welch M. 2012. Genomic variation among contemporary Pseudomonas aeruginosa isolates from chronically infected cystic fibrosis patients. J Bacteriol 194:4857–4866. doi: 10.1128/JB.01050-12. [DOI] [PMC free article] [PubMed] [Google Scholar]
- 13.Dotsch A, Schniederjans M, Khaledi A, Hornischer K, Schulz S, Bielecka A, Eckweiler D, Pohl S, Haussler S. 2015. The Pseudomonas aeruginosa transcriptional landscape is shaped by environmental heterogeneity and genetic variation. mBio 6:e00749. [DOI] [PMC free article] [PubMed] [Google Scholar]
- 14.Mayer-Hamblett N, Ramsey BW, Kulasekara HD, Wolter DJ, Houston LS, Pope CE, Kulasekara BR, Armbruster CR, Burns JL, Retsch-Bogart G, Rosenfeld M, Gibson RL, Miller SI, Khan U, Hoffman LR. 2014. Pseudomonas aeruginosa phenotypes associated with eradication failure in children with cystic fibrosis. Clin Infect Dis 59:624–631. doi: 10.1093/cid/ciu385. [DOI] [PMC free article] [PubMed] [Google Scholar]
- 15.Mayer-Hamblett N, Rosenfeld M, Gibson RL, Ramsey BW, Kulasekara HD, Retsch-Bogart GZ, Morgan W, Wolter DJ, Pope CE, Houston LS, Kulasekara BR, Khan U, Burns JL, Miller SI, Hoffman LR. 2014. Pseudomonas aeruginosa in vitro phenotypes distinguish cystic fibrosis infection stages and outcomes. Am J Respir Crit Care Med 190:289–297. [DOI] [PMC free article] [PubMed] [Google Scholar]
- 16.Li Z, Kosorok MR, Farrell PM, Laxova A, West SE, Green CG, Collins J, Rock MJ, Splaingard ML. 2005. Longitudinal development of mucoid Pseudomonas aeruginosa infection and lung disease progression in children with cystic fibrosis. JAMA 293:581–588. doi: 10.1001/jama.293.5.581. [DOI] [PubMed] [Google Scholar]
- 17.Hoffman LR, Kulasekara HD, Emerson J, Houston LS, Burns JL, Ramsey BW, Miller SI. 2009. Pseudomonas aeruginosa lasR mutants are associated with cystic fibrosis lung disease progression. J Cyst Fibros 8:66–70. doi: 10.1016/j.jcf.2008.09.006. [DOI] [PMC free article] [PubMed] [Google Scholar]
- 18.Smith EE, Buckley DG, Wu Z, Saenphimmachak C, Hoffman LR, D'Argenio DA, Miller SI, Ramsey BW, Speert DP, Moskowitz SM, Burns JL, Kaul R, Olson MV. 2006. Genetic adaptation by Pseudomonas aeruginosa to the airways of cystic fibrosis patients. Proc Natl Acad Sci U S A 103:8487–8492. doi: 10.1073/pnas.0602138103. [DOI] [PMC free article] [PubMed] [Google Scholar]
- 19.Konings AF, Martin LW, Sharples KJ, Roddam LF, Latham R, Reid DW, Lamont IL. 2013. Pseudomonas aeruginosa uses multiple pathways to acquire iron during chronic infection in cystic fibrosis lungs. Infect Immun 81:2697–2704. doi: 10.1128/IAI.00418-13. [DOI] [PMC free article] [PubMed] [Google Scholar]
- 20.Harmer C, Alnassafi K, Hu H, Elkins M, Bye P, Rose B, Cordwell S, Triccas JA, Harbour C, Manos J. 2013. Modulation of gene expression by Pseudomonas aeruginosa during chronic infection in the adult cystic fibrosis lung. Microbiology 159:2354–2363. doi: 10.1099/mic.0.066985-0. [DOI] [PubMed] [Google Scholar]
- 21.Wargo MJ, Gross MJ, Rajamani S, Allard JL, Lundblad LK, Allen GB, Vasil ML, Leclair LW, Hogan DA. 2011. Hemolytic phospholipase C inhibition protects lung function during Pseudomonas aeruginosa infection. Am J Respir Crit Care Med 184:345–354. doi: 10.1164/rccm.201103-0374OC. [DOI] [PMC free article] [PubMed] [Google Scholar]
- 22.Hoboth C, Hoffmann R, Eichner A, Henke C, Schmoldt S, Imhof A, Heesemann J, Hogardt M. 2009. Dynamics of adaptive microevolution of hypermutable Pseudomonas aeruginosa during chronic pulmonary infection in patients with cystic fibrosis. J Infect Dis 200:118–130. doi: 10.1086/599360. [DOI] [PubMed] [Google Scholar]
- 23.Kulkarni MM. 2011. Digital multiplexed gene expression analysis using the NanoString nCounter system. Curr Protoc Mol Biol Chapter 25:Unit 25B.10. [DOI] [PubMed] [Google Scholar]
- 24.Quittner AL, Buu A, Messer MA, Modi AC, Watrous M. 2005. Development and validation of the Cystic Fibrosis Questionnaire in the United States: a health-related quality-of-life measure for cystic fibrosis. Chest 128:2347–2354. doi: 10.1378/chest.128.4.2347. [DOI] [PubMed] [Google Scholar]
- 25.Hammond JH, Dolben EF, Smith TJ, Bhuju S, Hogan DA. 2015. Links between Anr and quorum sensing in Pseudomonas aeruginosa biofilms. J Bacteriol 197:2810–2820. doi: 10.1128/JB.00182-15. [DOI] [PMC free article] [PubMed] [Google Scholar]
- 26.Geiss GK, Bumgarner RE, Birditt B, Dahl T, Dowidar N, Dunaway DL, Fell HP, Ferree S, George RD, Grogan T, James JJ, Maysuria M, Mitton JD, Oliveri P, Osborn JL, Peng T, Ratcliffe AL, Webster PJ, Davidson EH, Hood L, Dimitrov K. 2008. Direct multiplexed measurement of gene expression with color-coded probe pairs. Nat Biotechnol 26:317–325. doi: 10.1038/nbt1385. [DOI] [PubMed] [Google Scholar]
- 27.Warnes GR, Bolker B, Bonebakker L, Gentleman R, Huber W, Liaw A, Lumley T, Maechler M, Magnusson A, Moeller S, Schwartz M, Venables B. 2014. R: a language and environment for statistical computing, v2.15.0. R Foundation for Statistical Computing, Vienna, Austria: http://cran.r-project.org/web/packages/gplots/gplots.pdf. [Google Scholar]
- 28.Bland JM, Altman DG. 1986. Statistical methods for assessing agreement between two methods of clinical measurement. Lancet i:307–310. [PubMed] [Google Scholar]
- 29.Goslee SC, Urban DL. 2007. The ecodist package for dissimilarity-based analysis of ecological data. J Stat Soft 22:v022i07. [Google Scholar]
- 30.Tart AH, Blanks MJ, Wozniak DJ. 2006. The AlgT-dependent transcriptional regulator AmrZ (AlgZ) inhibits flagellum biosynthesis in mucoid, nonmotile Pseudomonas aeruginosa cystic fibrosis isolates. J Bacteriol 188:6483–6489. doi: 10.1128/JB.00636-06. [DOI] [PMC free article] [PubMed] [Google Scholar]
- 31.Yoon SS, Coakley R, Lau GW, Lymar SV, Gaston B, Karabulut AC, Hennigan RF, Hwang SH, Buettner G, Schurr MJ, Mortensen JE, Burns JL, Speert D, Boucher RC, Hassett DJ. 2006. Anaerobic killing of mucoid Pseudomonas aeruginosa by acidified nitrite derivatives under cystic fibrosis airway conditions. J Clin Investig 116:436–446. doi: 10.1172/JCI24684. [DOI] [PMC free article] [PubMed] [Google Scholar]
- 32.Vallet-Gely I, Sharp JS, Dove SL. 2007. Local and global regulators linking anaerobiosis to cupA fimbrial gene expression in Pseudomonas aeruginosa. J Bacteriol 189:8667–8676. doi: 10.1128/JB.01344-07. [DOI] [PMC free article] [PubMed] [Google Scholar]
- 33.Zaki R, Bulgiba A, Ismail R, Ismail NA. 2012. Statistical methods used to test for agreement of medical instruments measuring continuous variables in method comparison studies: a systematic review. PLoS One 7:e37908. doi: 10.1371/journal.pone.0037908. [DOI] [PMC free article] [PubMed] [Google Scholar]
- 34.Winstanley C, Coulson MA, Wepner B, Morgan JA, Hart CA. 1996. Flagellin gene and protein variation amongst clinical isolates of Pseudomonas aeruginosa. Microbiology 142(Part 8):2145–2151. doi: 10.1099/13500872-142-8-2145. [DOI] [PubMed] [Google Scholar]
- 35.Morgan JA, Bellingham NF, Winstanley C, Ousley MA, Hart CA, Saunders JR. 1999. Comparison of flagellin genes from clinical and environmental Pseudomonas aeruginosa isolates. Appl Environ Microbiol 65:1175–1179. [DOI] [PMC free article] [PubMed] [Google Scholar]
- 36.Winsor GL, Lam DK, Fleming L, Lo R, Whiteside MD, Yu NY, Hancock RE, Brinkman FS. 2011. Pseudomonas Genome Database: improved comparative analysis and population genomics capability for Pseudomonas genomes. Nucleic Acids Res 39:D596–D600. doi: 10.1093/nar/gkq869. [DOI] [PMC free article] [PubMed] [Google Scholar]
- 37.Ajayi T, Allmond LR, Sawa T, Wiener-Kronish JP. 2003. Single-nucleotide-polymorphism mapping of the Pseudomonas aeruginosa type III secretion toxins for development of a diagnostic multiplex PCR system. J Clin Microbiol 41:3526–3531. doi: 10.1128/JCM.41.8.3526-3531.2003. [DOI] [PMC free article] [PubMed] [Google Scholar]
- 38.Barret M, Egan F, Fargier E, Morrissey JP, O'Gara F. 2011. Genomic analysis of the type VI secretion systems in Pseudomonas spp.: novel clusters and putative effectors uncovered. Microbiology 157:1726–1739. doi: 10.1099/mic.0.048645-0. [DOI] [PubMed] [Google Scholar]
- 39.Smith EE, Sims EH, Spencer DH, Kaul R, Olson MV. 2005. Evidence for diversifying selection at the pyoverdine locus of Pseudomonas aeruginosa. J Bacteriol 187:2138–2147. doi: 10.1128/JB.187.6.2138-2147.2005. [DOI] [PMC free article] [PubMed] [Google Scholar]
- 40.Arora SK, Wolfgang MC, Lory S, Ramphal R. 2004. Sequence polymorphism in the glycosylation island and flagellins of Pseudomonas aeruginosa. J Bacteriol 186:2115–2122. doi: 10.1128/JB.186.7.2115-2122.2004. [DOI] [PMC free article] [PubMed] [Google Scholar]
- 41.Ballok AE, Bahl CD, Dolben EL, Lindsay AK, St Laurent JD, Hogan DA, Madden DR, O'Toole GA. 2012. Epoxide-mediated CifR repression of cif gene expression utilizes two binding sites in Pseudomonas aeruginosa. J Bacteriol 194:5315–5324. doi: 10.1128/JB.00984-12. [DOI] [PMC free article] [PubMed] [Google Scholar]
- 42.MacEachran DP, Ye S, Bomberger JM, Hogan DA, Swiatecka-Urban A, Stanton BA, O'Toole GA. 2007. The Pseudomonas aeruginosa secreted protein PA2934 decreases apical membrane expression of the cystic fibrosis transmembrane conductance regulator. Infect Immun 75:3902–3912. doi: 10.1128/IAI.00338-07. [DOI] [PMC free article] [PubMed] [Google Scholar]
- 43.Son MS, Matthews WJ Jr, Kang Y, Nguyen DT, Hoang TT. 2007. In vivo evidence of Pseudomonas aeruginosa nutrient acquisition and pathogenesis in the lungs of cystic fibrosis patients. Infect Immun 75:5313–5324. doi: 10.1128/IAI.01807-06. [DOI] [PMC free article] [PubMed] [Google Scholar]
- 44.Govan JR, Deretic V. 1996. Microbial pathogenesis in cystic fibrosis: mucoid Pseudomonas aeruginosa and Burkholderia cepacia. Microbiol Rev 60:539–574. [DOI] [PMC free article] [PubMed] [Google Scholar]
- 45.Yin Y, Damron FH, Withers TR, Pritchett CL, Wang X, Schurr MJ, Yu HD. 2013. Expression of mucoid induction factor MucE is dependent upon the alternate sigma factor AlgU in Pseudomonas aeruginosa. BMC Microbiol 13:232. doi: 10.1186/1471-2180-13-232. [DOI] [PMC free article] [PubMed] [Google Scholar]
- 46.Franklin MJ, Ohman DE. 1996. Identification of algI and algJ in the Pseudomonas aeruginosa alginate biosynthetic gene cluster which are required for alginate O acetylation. J Bacteriol 178:2186–2195. [DOI] [PMC free article] [PubMed] [Google Scholar]
- 47.Bjarnsholt T, Jensen PO, Fiandaca MJ, Pedersen J, Hansen CR, Andersen CB, Pressler T, Givskov M, Hoiby N. 2009. Pseudomonas aeruginosa biofilms in the respiratory tract of cystic fibrosis patients. Pediatr Pulmonol 44:547–558. doi: 10.1002/ppul.21011. [DOI] [PubMed] [Google Scholar]
- 48.Williams P, Camara M. 2009. Quorum sensing and environmental adaptation in Pseudomonas aeruginosa: a tale of regulatory networks and multifunctional signal molecules. Curr Opin Microbiol 12:182–191. doi: 10.1016/j.mib.2009.01.005. [DOI] [PubMed] [Google Scholar]
- 49.Pesci EC, Pearson JP, Seed PC, Iglewski BH. 1997. Regulation of las and rhl quorum sensing in Pseudomonas aeruginosa. J Bacteriol 179:3127–3132. [DOI] [PMC free article] [PubMed] [Google Scholar]
- 50.Hunter RC, Asfour F, Dingemans J, Osuna BL, Samad T, Malfroot A, Cornelis P, Newman DK. 2013. Ferrous iron is a significant component of bioavailable iron in cystic fibrosis airways. mBio 4:e00557-13. [DOI] [PMC free article] [PubMed] [Google Scholar]
- 51.Vallet-Gely I, Donovan KE, Fang R, Joung JK, Dove SL. 2005. Repression of phase-variable cup gene expression by H-NS-like proteins in Pseudomonas aeruginosa. Proc Natl Acad Sci U S A 102:11082–11087. doi: 10.1073/pnas.0502663102. [DOI] [PMC free article] [PubMed] [Google Scholar]
- 52.Wargo MJ, Ho TC, Gross MJ, Whittaker LA, Hogan DA. 2009. GbdR regulates Pseudomonas aeruginosa plcH and pchP transcription in response to choline catabolites. Infect Immun 77:1103–1111. doi: 10.1128/IAI.01008-08. [DOI] [PMC free article] [PubMed] [Google Scholar]
- 53.Sato H, Frank DW, Hillard CJ, Feix JB, Pankhaniya RR, Moriyama K, Finck-Barbancon V, Buchaklian A, Lei M, Long RM, Wiener-Kronish J, Sawa T. 2003. The mechanism of action of the Pseudomonas aeruginosa-encoded type III cytotoxin, ExoU. EMBO J 22:2959–2969. doi: 10.1093/emboj/cdg290. [DOI] [PMC free article] [PubMed] [Google Scholar]
- 54.Gifford AH, Miller SD, Jackson BP, Hampton TH, O'Toole GA, Stanton BA, Parker HW. 2011. Iron and CF-related anemia: expanding clinical and biochemical relationships. Pediatr Pulmonol 46:160–165. doi: 10.1002/ppul.21335. [DOI] [PMC free article] [PubMed] [Google Scholar]
- 55.Reid DW, Carroll V, O'May C, Champion A, Kirov SM. 2007. Increased airway iron as a potential factor in the persistence of Pseudomonas aeruginosa infection in cystic fibrosis. Eur Respir J 30:286–292. doi: 10.1183/09031936.00154006. [DOI] [PubMed] [Google Scholar]
- 56.Smith DJ, Anderson GJ, Bell SC, Reid DW. 2014. Elevated metal concentrations in the CF airway correlate with cellular injury and disease severity. J Cyst Fibros 13:289–295. doi: 10.1016/j.jcf.2013.12.001. [DOI] [PubMed] [Google Scholar]
- 57.Visca P, Ciervo A, Orsi N. 1994. Cloning and nucleotide sequence of the pvdA gene encoding the pyoverdin biosynthetic enzyme L-ornithine N5-oxygenase in Pseudomonas aeruginosa. J Bacteriol 176:1128–1140. [DOI] [PMC free article] [PubMed] [Google Scholar]
- 58.Smith AD, Wilks A. 2015. Differential contributions of the outer membrane receptors PhuR and HasR to heme acquisition in Pseudomonas aeruginosa. J Biol Chem 290:7756–7766. doi: 10.1074/jbc.M114.633495. [DOI] [PMC free article] [PubMed] [Google Scholar]
- 59.Pedersen SS, Kharazmi A, Espersen F, Hoiby N. 1990. Pseudomonas aeruginosa alginate in cystic fibrosis sputum and the inflammatory response. Infect Immun 58:3363–3368. [DOI] [PMC free article] [PubMed] [Google Scholar]
- 60.Huse HK, Kwon T, Zlosnik JE, Speert DP, Marcotte EM, Whiteley M. 2013. Pseudomonas aeruginosa enhances production of a non-alginate exopolysaccharide during long-term colonization of the cystic fibrosis lung. PLoS One 8:e82621. doi: 10.1371/journal.pone.0082621. [DOI] [PMC free article] [PubMed] [Google Scholar]
- 61.Hunter RC, Klepac-Ceraj V, Lorenzi MM, Grotzinger H, Martin TR, Newman DK. 2012. Phenazine content in the cystic fibrosis respiratory tract negatively correlates with lung function and microbial complexity. Am J Respir Cell Mol Biol 47:738–745. doi: 10.1165/rcmb.2012-0088OC. [DOI] [PubMed] [Google Scholar]
- 62.Martin LW, Reid DW, Sharples KJ, Lamont IL. 2011. Pseudomonas siderophores in the sputum of patients with cystic fibrosis. Biometals 24:1059–1067. doi: 10.1007/s10534-011-9464-z. [DOI] [PubMed] [Google Scholar]
- 63.Workentine ML, Sibley CD, Glezerson B, Purighalla S, Norgaard-Gron JC, Parkins MD, Rabin HR, Surette MG. 2013. Phenotypic heterogeneity of Pseudomonas aeruginosa populations in a cystic fibrosis patient. PLoS One 8:e60225. doi: 10.1371/journal.pone.0060225. [DOI] [PMC free article] [PubMed] [Google Scholar]
- 64.Foweraker JE, Laughton CR, Brown DF, Bilton D. 2005. Phenotypic variability of Pseudomonas aeruginosa in sputa from patients with acute infective exacerbation of cystic fibrosis and its impact on the validity of antimicrobial susceptibility testing. J Antimicrob Chemother 55:921–927. doi: 10.1093/jac/dki146. [DOI] [PubMed] [Google Scholar]
- 65.Singh PK, Schaefer AL, Parsek MR, Moninger TO, Welsh MJ, Greenberg EP. 2000. Quorum-sensing signals indicate that cystic fibrosis lungs are infected with bacterial biofilms. Nature 407:762–764. doi: 10.1038/35037627. [DOI] [PubMed] [Google Scholar]
- 66.Drenkard E, Ausubel FM. 2002. Pseudomonas biofilm formation and antibiotic resistance are linked to phenotypic variation. Nature 416:740–743. doi: 10.1038/416740a. [DOI] [PubMed] [Google Scholar]
- 67.Anderson GG, Moreau-Marquis S, Stanton BA, O'Toole GA. 2008. In vitro analysis of tobramycin-treated Pseudomonas aeruginosa biofilms on cystic fibrosis-derived airway epithelial cells. Infect Immun 76:1423–1433. doi: 10.1128/IAI.01373-07. [DOI] [PMC free article] [PubMed] [Google Scholar]
- 68.Price KE, Hampton TH, Gifford AH, Dolben EL, Hogan DA, Morrison HG, Sogin ML, O'Toole GA. 2013. Unique microbial communities persist in individual cystic fibrosis patients throughout a clinical exacerbation. Microbiome 1:27. doi: 10.1186/2049-2618-1-27. [DOI] [PMC free article] [PubMed] [Google Scholar]
- 69.Fodor AA, Klem ER, Gilpin DF, Elborn JS, Boucher RC, Tunney MM, Wolfgang MC. 2012. The adult cystic fibrosis airway microbiota is stable over time and infection type, and highly resilient to antibiotic treatment of exacerbations. PLoS One 7:e45001. doi: 10.1371/journal.pone.0045001. [DOI] [PMC free article] [PubMed] [Google Scholar]
- 70.Smith DJ, Badrick AC, Zakrzewski M, Krause L, Bell SC, Anderson GJ, Reid DW. 2014. Pyrosequencing reveals transient cystic fibrosis lung microbiome changes with intravenous antibiotics. Eur Respir J 44:922–930. doi: 10.1183/09031936.00203013. [DOI] [PubMed] [Google Scholar]
- 71.Tunney MM, Klem ER, Fodor AA, Gilpin DF, Moriarty TF, McGrath SJ, Muhlebach MS, Boucher RC, Cardwell C, Doering G, Elborn JS, Wolfgang MC. 2011. Use of culture and molecular analysis to determine the effect of antibiotic treatment on microbial community diversity and abundance during exacerbation in patients with cystic fibrosis. Thorax 66:579–584. doi: 10.1136/thx.2010.137281. [DOI] [PubMed] [Google Scholar]
- 72.Quittner AL, Modi AC, Wainwright C, Otto K, Kirihara J, Montgomery AB. 2009. Determination of the minimal clinically important difference scores for the Cystic Fibrosis Questionnaire-revised respiratory symptom scale in two populations of patients with cystic fibrosis and chronic Pseudomonas aeruginosa airway infection. Chest 135:1610–1618. doi: 10.1378/chest.08-1190. [DOI] [PMC free article] [PubMed] [Google Scholar]
- 73.Retsch-Bogart GZ, Quittner AL, Gibson RL, Oermann CM, McCoy KS, Montgomery AB, Cooper PJ. 2009. Efficacy and safety of inhaled aztreonam lysine for airway pseudomonas in cystic fibrosis. Chest 135:1223–1232. doi: 10.1378/chest.08-1421. [DOI] [PMC free article] [PubMed] [Google Scholar]
- 74.Ramsey BW, Davies J, McElvaney NG, Tullis E, Bell SC, Drevinek P, Griese M, McKone EF, Wainwright CE, Konstan MW, Moss R, Ratjen F, Sermet-Gaudelus I, Rowe SM, Dong Q, Rodriguez S, Yen K, Ordonez C, Elborn JS, VX08-770-102 Study Group . 2011. A CFTR potentiator in patients with cystic fibrosis and the G551D mutation. N Engl J Med 365:1663–1672. doi: 10.1056/NEJMoa1105185. [DOI] [PMC free article] [PubMed] [Google Scholar]
- 75.Wainwright CE, Elborn JS, Ramsey BW. 2015. Lumacaftor-ivacaftor in patients with cystic fibrosis homozygous for Phe508del CFTR. N Engl J Med 373:1783–1784. doi: 10.1056/NEJMc1510466. [DOI] [PubMed] [Google Scholar]
- 76.Sawicki GS, Rasouliyan L, McMullen AH, Wagener JS, McColley SA, Pasta DJ, Quittner AL. 2011. Longitudinal assessment of health-related quality of life in an observational cohort of patients with cystic fibrosis. Pediatr Pulmonol 46:36–44. doi: 10.1002/ppul.21325. [DOI] [PubMed] [Google Scholar]
- 77.Modi AC, Lim CS, Driscoll KA, Piazza-Waggoner C, Quittner AL, Wooldridge J. 2010. Changes in pediatric health-related quality of life in cystic fibrosis after IV antibiotic treatment for pulmonary exacerbations. J Clin Psychol Med Settings 17:49–55. doi: 10.1007/s10880-009-9179-2. [DOI] [PMC free article] [PubMed] [Google Scholar]
- 78.Tepper LA, Utens EM, Caudri D, Bos AC, Gonzalez-Graniel K, Duivenvoorden HJ, van der Wiel EC, Quittner AL, Tiddens HA. 2013. Impact of bronchiectasis and trapped air on quality of life and exacerbations in cystic fibrosis. Eur Respir J 42:371–379. doi: 10.1183/09031936.00137612. [DOI] [PubMed] [Google Scholar]
- 79.Sawicki GS, Sellers DE, Robinson WM. 2011. Associations between illness perceptions and health-related quality of life in adults with cystic fibrosis. J Psychosom Res 70:161–167. doi: 10.1016/j.jpsychores.2010.06.005. [DOI] [PMC free article] [PubMed] [Google Scholar]
- 80.Palermo TM, Harrison D, Koh JL. 2006. Effect of disease-related pain on the health-related quality of life of children and adolescents with cystic fibrosis. Clin J Pain 22:532–537. doi: 10.1097/01.ajp.0000210996.45459.76. [DOI] [PubMed] [Google Scholar]
- 81.Dill EJ, Dawson R, Sellers DE, Robinson WM, Sawicki GS. 2013. Longitudinal trends in health-related quality of life in adults with cystic fibrosis. Chest 144:981–989. doi: 10.1378/chest.12-1404. [DOI] [PMC free article] [PubMed] [Google Scholar]
- 82.Wong HR, Cvijanovich NZ, Anas N, Allen GL, Thomas NJ, Bigham MT, Weiss SL, Fitzgerald J, Checchia PA, Meyer K, Shanley TP, Quasney M, Hall M, Gedeit R, Freishtat RJ, Nowak J, Shekhar RS, Gertz S, Dawson E, Howard K, Harmon K, Beckman E, Frank E, Lindsell CJ. 2015. Developing a clinically feasible personalized medicine approach to pediatric septic shock. Am J Respir Crit Care Med 191:309–315. doi: 10.1164/rccm.201410-1864OC. [DOI] [PMC free article] [PubMed] [Google Scholar]
- 83.Gnant M, Filipits M, Greil R, Stoeger H, Rudas M, Bago-Horvath Z, Mlineritsch B, Kwasny W, Knauer M, Singer C, Jakesz R, Dubsky P, Fitzal F, Bartsch R, Steger G, Balic M, Ressler S, Cowens JW, Storhoff J, Ferree S, Schaper C, Liu S, Fesl C, Nielsen TO, Austrian Breast and Colorectal Cancer Study Group . 2014. Predicting distant recurrence in receptor-positive breast cancer patients with limited clinicopathological risk: using the PAM50 risk of recurrence score in 1478 postmenopausal patients of the ABCSG-8 trial treated with adjuvant endocrine therapy alone. Ann Oncol 25:339–345. doi: 10.1093/annonc/mdt494. [DOI] [PubMed] [Google Scholar]
- 84.O'Loughlin CT, Miller LC, Siryaporn A, Drescher K, Semmelhack MF, Bassler BL. 2013. A quorum-sensing inhibitor blocks Pseudomonas aeruginosa virulence and biofilm formation. Proc Natl Acad Sci U S A 110:17981–17986. doi: 10.1073/pnas.1316981110. [DOI] [PMC free article] [PubMed] [Google Scholar]
- 85.Hurley MN, Ariff AH, Bertenshaw C, Bhatt J, Smyth AR. 2012. Results of antibiotic susceptibility testing do not influence clinical outcome in children with cystic fibrosis. J Cyst Fibros 11:288–292. doi: 10.1016/j.jcf.2012.02.006. [DOI] [PMC free article] [PubMed] [Google Scholar]
- 86.Smith AL, Fiel SB, Mayer-Hamblett N, Ramsey B, Burns JL. 2003. Susceptibility testing of Pseudomonas aeruginosa isolates and clinical response to parenteral antibiotic administration: lack of association in cystic fibrosis. Chest 123:1495–1502. doi: 10.1378/chest.123.5.1495. [DOI] [PubMed] [Google Scholar]
Associated Data
This section collects any data citations, data availability statements, or supplementary materials included in this article.