

Abstract
Drug discovery programs frequently target members of the human kinome and try to identify small molecule protein kinase inhibitors, primarily for cancer treatment, additional indications being increasingly investigated. One of the challenges is controlling the inhibitors degree of selectivity, assessed by in vitro profiling against panels of protein kinases. We manually extracted, compiled, and standardized such profiles published in the literature: we collected 356 908 data points corresponding to 482 protein kinases, 2106 inhibitors, and 661 patents. We then analyzed this data set in terms of kinome coverage, results reproducibility, popularity, and degree of selectivity of both kinases and inhibitors. We used the data set to create robust proteochemometric models capable of predicting kinase activity (the ligand–target space was modeled with an externally validated RMSE of 0.41 ± 0.02 log units and R02 0.74 ± 0.03), in order to account for missing or unreliable measurements. The influence on the prediction quality of parameters such as number of measurements, Murcko scaffold frequency or inhibitor type was assessed. Interpretation of the models enabled to highlight inhibitors and kinases properties correlated with higher affinities, and an analysis in the context of kinases crystal structures was performed. Overall, the models quality allows the accurate prediction of kinase-inhibitor activities and their structural interpretation, thus paving the way for the rational design of compounds with a targeted selectivity profile.
Introduction
Protein kinases typically function in highly connected, dynamic, and regulated networks and are central actors in the majority of signal transduction cascades. The human kinome is composed of more than 500 kinases1 and deregulated kinase signaling has frequently been observed to be oncogenic.2 Human kinases are therefore attractive targets for drug discovery and thus have received considerable attention from the pharmaceutical industry, which has invested in the identification of small molecule protein kinase inhibitors (PKIs) targeting the protein kinase catalytic domain.3,4 These efforts have so far led to the approval of 36 PKIs for clinical use (28 by the US Food and Drugs Administration5). In addition, at least 600 PKIs have entered formal clinical trials.6 The vast majority of the approved or under investigation PKIs aim at treating various neoplasms, but PKIs are now also being designed to treat other indications such as diabetes, neurological, inflammatory, and autoimmune diseases like rheumatoid arthritis.7−11
A number of PKIs behave as allosteric regulators12−14 but the majority (about 95%6) act as competitive inhibitors,15 usually blocking ATP cofactor binding, with several different distinct binding modes as demonstrated in X-ray crystallography studies.16,17 There is also a relatively large set of irreversible PKIs.18,19 The highly conserved nature of the ATP binding site renders the development of highly selective PKIs challenging,20 while the selectivity profile of a PKI governs its total effect on an organism. Indeed, the clinical efficacy of some PKIs against kinase targets against which they were not originally developed led to their approval for other indications. For example, while originally approved to treat chronic myeloid leukemia,21 acting via inhibition of cAbl, Imatinib (Gleevec) was later shown to inhibit Kit and PDGFR. Consequently, it was approved for the treatment of gastrointestinal stromal tumors and the hypereosinophilic syndrome in which these particular kinases are dysregulated.22,23 The dual beneficial and adverse off-target pharmacology of PKIs is complex24−27 and relies on both target exposure and activity spectra.
In vitro profiling is one of the standard tools at hand to reduce attrition rates observed during drug discovery and development.28 As a general rule, promiscuous compounds are difficult to optimize and develop. Given both the known promiscuity of PKIs, and the large number of protein kinase genes known and assayable, compounds developed as PKIs are routinely profiled against substantial parts of the (human) kinome.29−32 The objective here is to screen out the PKIs with undesired kinase profiles as early as possible. Furthermore, it is now common practice to screen compound libraries against the kinome in order to identify either new pharmacological probes for poorly characterized targets,33 or to identify hits for newly validated kinases.
Since the initial work of Davies et al. in 2000,34 a growing number of publications have reported the profiling against large kinase panels of either libraries of compounds (some selected as potential PKIs),35,36 or smaller and more focused sets of PKIs (as part of their characterization).37,38 Databases such as ChEMBL39,40 make publicly available a very large amount of structure–activity relationships (SARs) manually extracted and curated from the scientific literature. Due to the literature focus of these efforts, full kinase profiles of compounds were not routinely added, with notable exceptions, such as for the Millipore Kinase Screening data set41 (CHEMBL2218924) and the GSK Kinase Inhibitor data set42 (CHEMBL2303647). An effort was therefore undertaken to manually capture in the primary literature (including, but not limited to medicinal chemistry journals) and standardize such kinase profile-related SAR. Here, we report the collation of an unprecedentedly large number of kinase inhibition data points, and the release to the public domain, through a deposition in the ChEMBL database.
Due to the heterogeneous nature of the sources, the collected SAR data set is not a complete one:43 while for some PKIs most of the kinases were tested, others were tested only on a few kinases. In addition, the sizes of the kinase panels vary across the publications and assay technology and readout can substantially vary. To overcome this and demonstrate the potential of a kinase data set like the current in the public domain, we leveraged on the collected SAR and the content of the ChEMBL database to populate the kinase/PKI pairs that were not initially measured, using a state-of-the-art and robust activity modeling methodology. After integration with ChEMBL data (release 19, see Materials and Methods for details), proteochemometric bioactivity modeling (PCM) was applied at large-scale to this set. The results demonstrate that the application of this method to the compiled data set enables a robust prediction of kinase activity across the subset of the kinome covered by the data set; combined with a systematic exploration of the compounds and kinases features that drive potency, this paves the way for bespoke design of compounds with selective promiscuity.
Materials and Methods
Data Sources
All potential sources of PKI kinome profiling bioactivities were identified through literature searches. A first selection restricted the sources to articles or data sets containing bioactivities from assays where (i) the target was tractable; (ii) the technology generated results of the following activity types: Pct_Ctrl, Pct_Inhib, Kd, Ki, IC50 (excluding for example bioactivities generated from thermal stability shift assays44); (iii) the ligand structures were disclosed; and (iv) quantitative bioactivity measurements were available and not expressed exclusively as ranges. In addition to measurements published in peer-reviewed articles, data points made publicly available by the NIH Libraries of Network-based Cellular Signatures (LINCS) program45,46 and the International Centre for Kinase Profiling within the MRC Protein Phosphorylation Unit at the University of Dundee47 were included. For each data source, the bibliographic reference, PubMed identifier, digital object identifier (DOI), date of publication, title, authors list and abstract of the publication, publishing journal name, reference. The list of data sources is provided in the Supporting Information (SI) Table S1.
PKIs
PKI structures were directly extracted, transformed from SMILES representations, or manually drawn using Biovia Draw48 and then standardized using Pipeline Pilot version 8.5:49 salts were removed, charges and stereochemistry were standardized, and a canonical tautomer was generated. The accuracy of stereochemistry and tautomeric state were manually checked and adjusted if necessary, using PubMed for bibliographic searches (http://www.ncbi.nlm.nih.gov/pubmed) and the Protein Data Bank (PDB) for kinase–PKI complex crystal structures (http://www.rcsb.org/pdb). A unique name was attributed to each structure and synonyms were stored. The list of PKI names, structures, and compound-related data is provided in Supporting Information Table S2.
Kinases
For each name used to identify the kinase in the original publications (SwissProt entry number, kinase name, gene name), the corresponding Entrez preferred gene symbol from the Human Genome Nomenclature Committee (HGNC) (www.genenames.org) was identified. To further qualify the kinases, several properties were added, describing whether the assay was run against a single kinase, the targeted binding site (for the kinases with multiple kinase domains), the length of the domain, the source of the assayed kinase, the presence and nature of mutations, the exact sequence, the phosphorylation status, and the organism (see Supporting Information 1 for details); however we anticipate that this data is tentative in some cases due to sparse reporting in the literature. The list of kinases is provided in Supporting Information Table S3.
Assays
To fully describe the assays and when applicable, the name of the kinase profiling service commercial provider, the assay technology, the measured effect and the ATP and compound concentrations were captured (see Supporting Information 2 for details).
Bioactivities
For all bioactivities, the original value, operator, unit and display name (of possible values: Kd, Ki, IC50, Pct_Ctrl, Pct_Inhib) were captured. Pct_Ctrl is one assay results preprocessing method that attempts to correct for variability by normalizing compound measurements relative to controls: Pct_Ctrl =100 × Mean_on_compound/Mean_on_controls. Similarly, Pct_Inhib is defined as 1 – (100 × Mean_on_sample/Mean_on_controls). Those values were then submitted to a set of standardization rules described in details in Supporting Information 3. Briefly, Pct_Ctrl and Pct_Inhib results were transformed in Pct_Effect values; all bioactivities were then standardized (standardized result value, SRV and their negative logarithm pSRV); an additional property was created to monitor the applied transformations (standardized result type, SRT).
The minimal set of properties required to capture a bioactivity value was the compound and target names, the organism, the result value, result operator, and result type. The list of possible values for all properties related to bioactivities is provided in Supporting Information Table S4.
Generation of Data Sets 1 and 2
The ensemble of bioactivities initially captured was filtered to build data set 1: only measurements from human kinases were kept, and measurements were rejected where the exact kinase could not be identified (Target Type = “Gene Family”) or where the standardized result type was “inconclusive”. In the analysis, two naming conventions refer to the kinases that were assayed:
“HGNC”, corresponding to the Target Name
“Kinase”, corresponding to the Target Name, Binding Site, and Mutation and describing the kinase with more precision
The notion of coverage was introduced as follows: for a Kinase–PKI or HGNC–PKI pair, the presence of at least one measurement in data set 1 contributes one unit. By summing over all pairs and dividing by the number of pairs (per data source or across data set 1), the coverage of the data source or of the data set is calculated.
Multiple measurements per Kinase–PKI pair were aggregated to keep only one copy: the original measurements and their sources were discarded, and only the number N, mean, and standard deviation (SD) of pSRV were considered further. Data set 2 was then generated by filtering out the aggregated measurements with a pSRV SD greater than one standard deviation unit.
Kinase- and PKI-Centric Indices
For each Kinase, the number of PKIs having a pSRV_Mean, a pSRV_Mean below 6 (1 μM), and a pSRV_Mean below 7 (100 nM), the kinase selectivity index at 1 μM (SI_k_1uM) and the kinase selectivity index at 100 nM (SI_k_100 nM)35,50,51 were calculated. For each PKI, the number of Kinases having a pSRV_Mean, a pSRV_Mean below 6 (1 μM), and a pSRV_Mean below 7 (100 nM), the selectivity index at 1 μM (SI_1uM) and the selectivity index at 100 nM (SI_100 nM) were calculated. All calculations and data processing were performed with Pipeline Pilot version 8.5.49
SureChEMBL Searches
SureChEMBL (https://www.surechembl.org/) is a large, freely available, live repository of compound structures automatically extracted from full-text patent documents.52 The SureChEMBL system consists of the data pipeline and the user interface. The former automatically detects named chemical entities in text, and chemical structures in images. It annotates the incoming patent documents with chemical structures, which are then stored in a database. The latter allows users to search patent documents using text or chemical queries and retrieve the compounds extracted from specified document search hits.
The SureChEMBL repository was used to search for the earliest patent documents claiming the PKIs in the data set. The search was implemented as follows:
Each of the PKIs in the data set was submitted to the UniChem53 web service to run a search against the SureChEMBL compound pool. In addition to exact matching, UniChem allows connectivity matching, i.e. searching for compounds with the same connectivity, by ignoring stereochemistry, isotope or salt information.54
For each of the 1132 search hits (53.8% of the data set), all patent documents containing the hit (either in text or image) from the three main patent authorities (WIPO, USPTO, and EPO) were retrieved.
The PKIs and their corresponding earliest patent documents were annotated with bibliographic data, such as priority date, title, inventor, and assignee.
The target, target family, and target type properties were manually assigned based on patent titles with additional PubMed look ups when required. The affiliation type and activity domain properties were manually assigned based on the SureChEMBL-provided list of inventors and affiliations.
The list of PKIs, patents, and related properties is provided in Supporting Information Table S2.
Proteochemometric Models
Proteochemometric (PCM) modeling creates predictive models using machine-learning.55,56 The methodology is related to conventional quantitative structure–activity relationship (QSAR) modeling but includes an explicit target protein-based descriptor alongside conventional small molecule descriptors.57 This allows the pooling of bioactivity data of several related targets into a single PCM model. Previous application areas of PCM include GPCR families and their ligands, viral mutants and enzyme inhibitors, transporter proteins and compounds blocking these proteins, and kinases and kinase inhibitors.58−64 While this is not the first attempt to apply PCM to a PKI data set, it is, to the authors’ knowledge, the first time it has been applied on the large scale demonstrated here and to a kinase data set of such ligand diversity. Schürer and Muskal used a diverse public set, yet constructed hundreds of separate QSAR models, an approach that does not allow interpretation from the kinase perspective (which residues contribute to binding of which compound).65 Finally, our additional aim is to explore the feasibility of PCM analysis toward the rational design of kinase inhibitors with biased, defined promiscuity.
Proteochemometric Data Set
To generate PCM models with the broadest applicability domain, Ki data points from the collected SAR set were merged with those present in ChEMBL (release 19). For modeling, Ki values were -log10 transformed, leading to pKi values. Multiple measurements were averaged; if duplicate pairs were present in this set and ChEMBL, the duplicates were discarded favoring the measurements presented here over those already in ChEMBL. Furthermore, allosteric data points were removed based on previously published work (using data points that were retrieved from text mining paper abstracts)66 and peptide-like PKIs were discarded. Peptides were detected according to the protocol used by ChEMBL (among others filters based on presence of a peptide bond and known peptides).
Proteochemometric Descriptors
The binding pocket was described using the kinase sequences alignment provided by Huang et al.67 which was converted to physicochemical properties using the first three Z-scales published by Sandberg et al.68 as done previously.57 This led to 117 protein descriptors. Three mean values for the total sequence for the 3 Z-scales (Z1_mean, Z2_mean, Z3_mean), and 3 scales per residue (Z1_Res_1, Z2_res_1, etc.) times 38 residues. PKIs were described using a combination of physicochemical properties (37 descriptors, see Supporting Information Table S5 for a full list) and FCFP_6 circular fingerprints.69 The fingerprint features were selected based on their frequency (optimal frequency was present in 50% of the PKIs) and a total of 768 features were encoded as a fixed-length bit string. Finally, 16 properties coded for presence of cofactors or secondary kinase domains, and 4 encoded properties about the activity type/interaction (IC50/Ki/Kd/predicted allosteric). In total, the feature vector consisted of 942 descriptors per PKI/kinase pair.
Proteochemometric Machine Learning
Script files for R statistics (version 2.15.0) were prepared in Pipeline Pilot version 8.5 using the “randomForest” package.49,70,71 Models were trained using 10 000 trees on the EMBL-EBI cluster (45 cores) in parallel using the “foreach” package.72 The optimal value for “mtry” was empirically found to be a fraction of 0.3 of the total descriptors. Scaling of the importance variables was turned off and no imputation was performed.
Proteochemometric Regression Models
Several models were created: the data set was split into random training sets of 10%, 30%, 50%, 70%, and 90% of the total data set. Subsequently models were trained on these sets and validated on the remaining 90%, 70%, 50%, 30%, and 10% of the set to create learning curves. This process was performed four times, splitting the set with a different seed every iteration. Finally a full model was trained on 100% of the set, which was subsequently interpreted and is available for prediction.
Model quality was validated using both the correlation coefficient and the Root Mean Square Error (RMSE). The combination was chosen as both are complementary. RMSE can be overly optimiztic when the bulk of the compounds is inactive (a simple inactive prediction suffices) whereas the R2 suffers from distortions if the modeled activity range is very low (see Results for further details).
Results
Data Set Composition
There were 356 908 entries in the original data set, corresponding to 61 data sources, 482 HGNC symbols and 2106 PKIs. Perhaps counterintuitively, the analysis of the data sources indicates that the majority of bioactivities were disclosed in journals not directly focused on medicinal chemistry: 74.6% of the measurements were published in three journals: Nature Chemical Biology (30.5%), Biochemical Journal (22.6%), and Nature Biotechnology (21.5%) (Figure 1a). Furthermore, 78.2% of the measurements came from three articles and the two online sources (Figure 1b).
Figure 1.

Distribution of measurements across (a) the journals and (b) the data sources.
In vitro kinase profile commercial providers generated 68.5% of the measurements, the major contributors being DiscoverX (22.5%), Millipore (20.9%), and Reaction Biology (15.0%) (Table 1). The vast majority of the measurements were of type Pct_Ctrl (61.8%), followed by Ki (30.0%), Kd (7.7%), and IC50 (0.5%).
Table 1. Distribution of Measurements Across Kinase Profile Commercial Providersa.
| kinase profile provider | measurements count | percent of total |
|---|---|---|
| Ambit/DiscoverX | 80328 | 22.5 |
| Millipore | 74620 | 20.9 |
| Reaction Biology | 53417 | 15.0 |
| MRC Dundee | 28778 | 8.1 |
| Carna Biosciences | 2725 | 0.8 |
| Caliper Life Sciences | 1856 | 0.5 |
| Invitrogen | 1910 | 0.5 |
| Proquinase | 931 | 0.3 |
| Abbott | 72742 | 20.4 |
| Other | 39595 | 11.1 |
Although not a kinase profile provider, the large number of measurements shared by Abbott justified the creation of a dedicated category.
The standardized result type provides an assessment of the amount of usable information within the data set: 9.9% of the data were qualified as “inconclusive”, 14.8% as “inactive” (ranges with thresholds indicating a lack of activity), 60.8% as “calculated” (Pct_Effect, single point measurements), and 14.5% as “measured” (Ki, Kd, or IC50, in which a greater confidence can be given than in single point measurements;Table 2). Supporting Information Figure S1 compares across the data sources the relative numbers of measurements and their distribution according to the result types.
Table 2. Distribution of Measurements Across the Standardized Result Types.
| result type | measurements count | percent of total |
|---|---|---|
| calculated | 216894 | 60.8 |
| inactive | 52817 | 14.8 |
| measured | 51797 | 14.5 |
| inconclusive | 35394 | 9.9 |
The distribution of the standardized result type values across the result types is presented in Figure 2. It shows that approximately half of the Kd measurements were considered as inactive (to be compared with approximately one-third of the Ki measurements, with another third being considered inconclusive).
Figure 2.
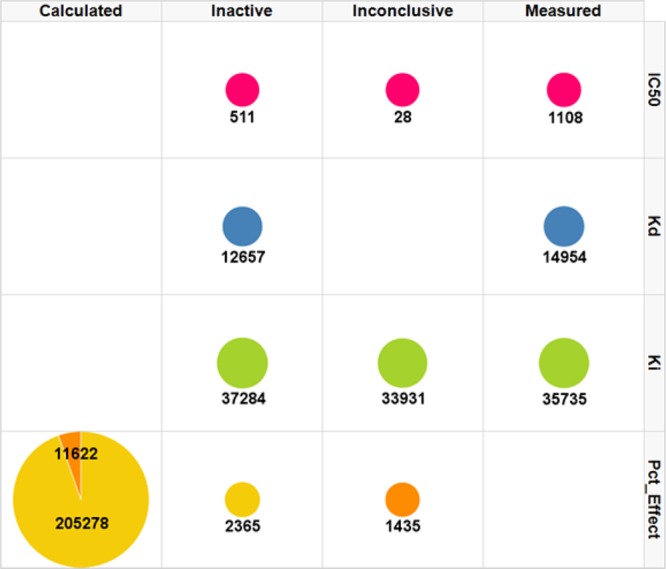
Distribution of measurements across the standardized result types, split by measured result types. The number of measurements is labeled and is proportional to the radius of the discs. The color corresponds to the original data type (yellow Pct_Ctrl, orange PCT_Inhib).
The analysis of the Target Type values indicates that 97.6% of the measurements were obtained in assays where the target could be mapped to a single HGNC symbol, with another 2.2% coming from complexes. Here, 65.2% of the measurements were generated in binding assays, 22.5%, in quantitative PCR assays, and 11.2%, in fluorescence assays. Finally, almost all measurements were generated in human kinase assays (99.5%).
The collected data cover widely the kinome, as can be observed in Figure 3 where the majority of the branches in the treelike representation of the kinome introduced by Manning et al. feature measurements.1
Figure 3.

Coverage of the kinome by the current data set. The kinase names and circles sizes are proportional to the number of corresponding compounds. The picture was generated using the Kinome Render,73 and the kinome tree illustration is reproduced courtesy of Cell Signaling Technology, Inc. (www.cellsignal.com). A high resolution version is available as Supporting Information Figure S2.
A limited number of kinases have already proven to be attractive targets for drug discovery efforts, and the number of measurements available per HGNC symbol reflects this trend: roughly one-third of the 482 genes exhibited more than 1000 measurements, another third had 250 to 1000 measurements, and the last third less than 250 measurements (Figure 4a). The 10 most characterized kinases are ABL1, EGFR, FLT3, KIT, LCK, PIM1, PRKACA, GSK3B, AURKB, and PDPK1, with more than 2000 measurements each (Figure 4b). The 10 least profiled kinases are PINK1, SGK233, ATR, CDK1, CDK8, EFNA2, EIF2AK4, MAST3, SMG1, and STRADA, with less than four measurements each (Figure 4c).
Figure 4.

Number of measurements per HGNC symbol: (a) all kinases; (b) most popular kinases; (c) least popular kinases. The colors indicate the result type.
To focus on data of interest for drug discovery projects, data set 1 was prepared by excluding measurements from nonhuman kinases (1923 measurements) or from gene families (exact kinase not identified, 267 measurements) and qualified as inconclusive (35 392 measurements). In total, 319 320 measurements were further considered (89.5% of the initial data set). Those were not distributed equally among the data sources, since the sizes of the kinase panels depend on the profiling organizations. The coverage across the data sources was therefore analyzed. In total, the coverage was 15.6% when considering the targets at the kinase level, and 20.0% at the HGNC level (Table 3). Supporting Information Tables S6 and S7 provide the counts and coverages for each data source, at the Kinase and HGNC levels, respectively.
Table 3. Coverage of Dataset 1 at the Kinase and HGNC Levels.
| compounds count | targets count | pairs count | count of pairs with data | coverage (%) | |
|---|---|---|---|---|---|
| kinase level | 2106 | 627 | 1320462 | 207495 | 15.7 |
| HGNC level | 2106 | 452 | 951912 | 191877 | 20.2 |
In data set 1, only 15.7% of the Kinase–PKI pairs do have at least one measurement. But the distribution of coverage per data source indicates that 42 data sources have an internal coverage of 90% or more (68.9% of the data sources) at the Kinase level, while only 7 have a coverage of 50% or less (Table 4). This highlights that data set 1 is a heterogeneous “patchwork” of relatively densely populated submatrices of Kinases-PKIs, separated by empty submatrices (Supporting Information Figure S3).
Table 4. Distribution of the Data Sources of Dataset 1 per Binned Coverage, at the Kinase Level.
| internal coverage (%) | [0; 20] | ]20; 30] | ]30; 40] | ]40; 50] | ]50; 60] | ]60; 70] | ]70; 80] | ]80; 90] | ]90; 100] |
|---|---|---|---|---|---|---|---|---|---|
| count | 1 | 2 | 2 | 2 | 0 | 2 | 5 | 5 | 42 |
The reproducibility of the measurements was then analyzed. Data set 1 corresponds to 319 320 measurements, distributed across 207 495 Kinase–PKI pairs. 70.6% of these pairs exhibit a unique measurement, while only 1.8% had five measurements or more (Table 5).
Table 5. Distribution of the Number of Measurements Per Kinase–PKI Pair.
| number of measurements per Kinase–PKI pair | 1 | 2 | 3 | 4 | 5 or more |
|---|---|---|---|---|---|
| count | 146564 | 25134 | 27656 | 4477 | 3664 |
| percent total | 70.63 | 12.11 | 13.33 | 2.16 | 1.77 |
For the 29.4% of Kinase–PKI pairs with multiple measurements, the distribution of the pSRV SD indicates that applying a filter at SD equal or less than 1 unit would lead to the rejection of only 570 pairs (Table 6), a relatively small number, in the order of magnitude of the amount of information contained in the profile of a single PKI against all Kinases. Supporting Information Figure S4 shows the distribution of the binned pSRV SD values split by number of measurements per Kinase–PKI pair.
Table 6. Binned Distribution of the pSRV SD.
| binned pSRV SD | 0.0 | ]0.0; 0.5] | ]0.5; 1.0] | ]1.0; 1.5] | ]1.5; 2.0] | >2.0 |
|---|---|---|---|---|---|---|
| count | 161844 | 39002 | 6079 | 507 | 58 | 5 |
| percent total | 78.00 | 18.80 | 2.93 | 0.24 | 0.03 | 0.00 |
Data set 2 was created by applying the “pSRV SD ≤ 1” filter to include only Kinase–PKI pairs with significant measurements. It contains 627 Kinases, 2106 PKIs, and 206 925 Kinase–PKI pairs with a pSRV (15.6% of the total number of pairs). For 316 Kinases (50.4%), at most 200 PKIs were tested that provided a significant measurement, while only 51 Kinases (8.1%) had more than 1000 PKIs tested against (Table 7).
Table 7. Distribution of the Binned Number of PKIs per Kinase.
| binned number of PKIs per Kinase | [1; 200] | ]200; 400] | ]400; 600] | ]600; 800] | ]800; 1000] | ]1000; 1200] | ]1200; 1400] | ]1400; 1600] | >1600 |
|---|---|---|---|---|---|---|---|---|---|
| count | 316 | 137 | 70 | 29 | 24 | 36 | 14 | 0 | 1 |
| percent total | 50.40 | 21.85 | 11.16 | 4.63 | 3.83 | 5.74 | 2.23 | 0.00 | 0.16 |
By applying an upper limit of 100 nM for potent PKIs, it was observed that the coverage of the kinome by potent inhibitors is similar to the one observed in Data set 1 (Supporting Information Figure S5). The distribution of the kinase selectivity index at 100 nM across the kinome (limited to Kinases with at least 100 PKIs to reduce sampling bias, rejecting mutants, and nonkinase domains) indicates that some Kinases seem more prone to inhibition than others, namely CDC7, MAP2K5, FLT3, FLT1, and DDR1 (Supporting Information Figure S6). However, the SI_k_100 nM does not allow factoring in the number of tested PKIs. The number of potent PKIs was plotted against the number of tested PKIs to identify among the Kinases probed with many PKIs those that proved difficult to inhibit (selective Kinases, such as NEK2, MAPK1, MAPK12, MAPK13, MAPKKAPK2, AKT1, AKT2, and AKT3) and those that were more prone to inhibition (promiscuous Kinases, such as FLT3, CLK4, AURKB, KDR, FLT1, CSF1R, RET, and CDC7) (Figure 5). For example, a similar number of PKIs was tested against CLK4 (1206 PKIs) and NEK2 (1210 PKIs); however, while 447 PKIs were active below 1 μM and 175 below 100 nM against CLK4, only 71 PKIs were active below 1 μM and 11 below 100 nM against NEK2. Of course, directly comparing these hit rates requires assuming that the PKIs assayed against each Kinase (57% of the total number of PKIs) covered the same chemical space, which is not necessarily true: the numbers of PKIs are similar, but the PKIs might be different. Furthermore, defining a Kinase as “selective” or “promiscuous” relies on a similar assumption and a more appropriate but more complex qualification for these Kinases would be selective or promiscuous “within the boundaries of the chemical space they were assayed against”.
Figure 5.
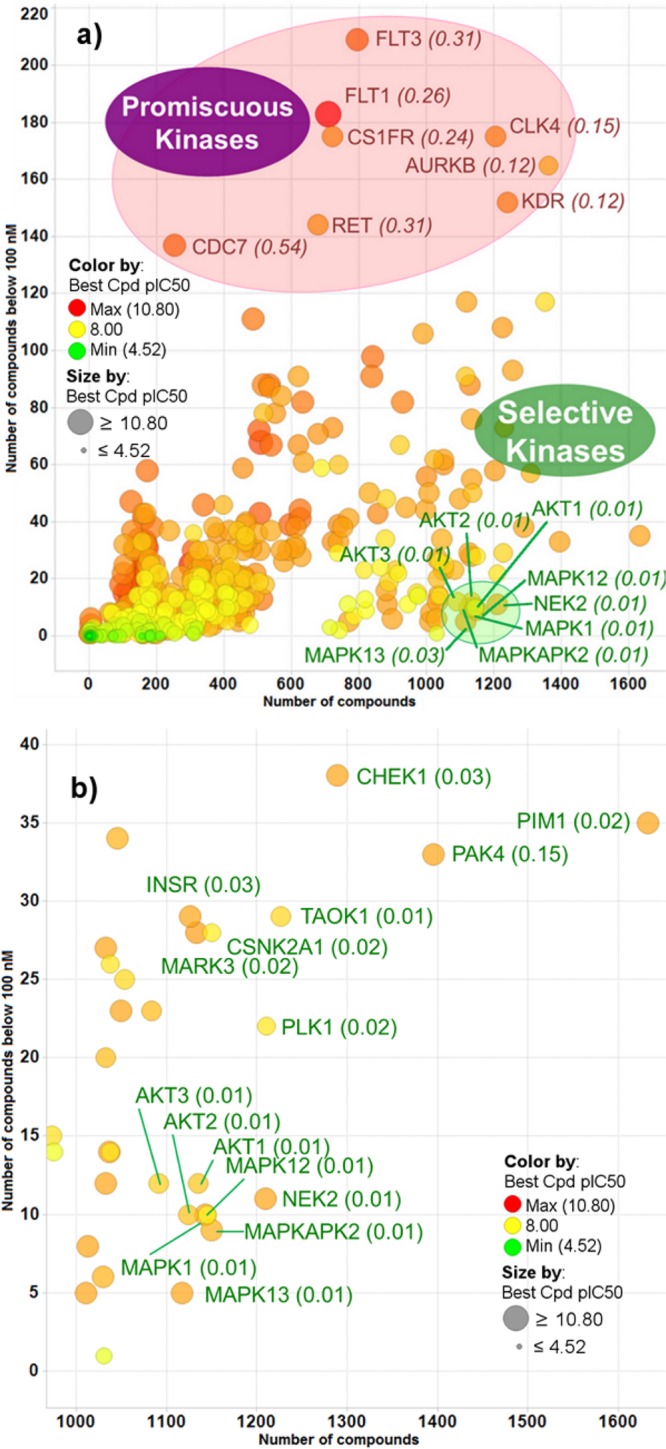
(a) Comparison across all Kinases between the number of PKIs tested (x axis) and the number of PKIs active below 100 nM (y axis). (b) Same comparison as in part a with a focus on the most selective Kinases. Color and marker size reflect the potency of the most potent inhibitor of each Kinase. Shown in parentheses is the SI_k_100 nM.
A similar analysis of data set 2 can be performed by focusing on PKIs instead of Kinases. Some of the collected data sources describe the results of PKIs profiling against Kinase panels of limited size. In addition, a number of measurements were rejected when building data sets 1 and 2. As a consequence, a significant number of PKIs from data set 2 present results against 50 Kinases or less (925 PKIs, 43.9%) (Table 8), too small a panel to allow the evaluation of kinase selectivity. In parallel, 323 PKIs present results against at least 200 Kinases (15.3%) (Table 8). At that level of coverage of the kinome, it should be possible to identify nonselective kinase inhibitors, and inhibitors already displaying some selectivity could be prioritized (keeping in mind the possibility of a later identification of additional inhibited kinases that were not present in the initial panel). It is to be noted that this constraint prevented any further analysis based on Murcko scaffolds, due to the limited size of the sample left after filtering (2 Murcko scaffolds with 5 PKIs, 3 Murcko scaffolds with 4 PKIs, 5 Murcko scaffolds with 3 PKIs, 22 Murcko scaffolds with 2 PKIs, and singletons).
Table 8. Distribution of the Binned Number of Kinases with Measurements per PKIa.
| binned number of Kinases per PKI | [1; 25] | ]25; 50] | ]50; 75] | ]75; 100] | ]100; 200] | ]200; 300] | ]300; 400] | ]400; 500] | >500 |
|---|---|---|---|---|---|---|---|---|---|
| count | 628 | 297 | 244 | 446 | 168 | 36 | 192 | 87 | 8 |
| percent total | 29.82 | 14.10 | 11.59 | 21.18 | 7.98 | 1.71 | 9.12 | 4.13 | 0.38 |
Note that two different bin sizes (25 and 100 Kinases) were used.
Table 9 presents the 10 PKIs with the highest number of Kinases exhibiting at least one significant measurement (485 Kinases and more), and the structures of the top 25 PKIs are shown in Supporting Information Figure S7. Not unexpectedly, one can observe the presence of Staurosporine and derivatives PKC412 and Go6976, which share a privileged kinase scaffold, along with FDA-approved PKIs Sorafenib, Sunitinib, and Pazopanib.
Table 9. List of the 10 PKIs with the Highest Number of Kinases Exhibiting at Least One Significant Measurement.
| PKI name | kinase count |
|---|---|
| Tyrphostin_AG1478 | 525 |
| Akti_1_2 | 523 |
| JNK_Inhibitor_IX | 521 |
| AS601245 | 518 |
| PKC412 | 503 |
| AR_AO_14418 | 503 |
| Sorafenib | 501 |
| Go6976 | 501 |
| Indirubin_6_bromo_oxime | 493 |
| Staurosporine | 487 |
The same threshold for potency was used to assess which of the most frequent PKIs were often observed to be potent (Figure 6). Unsurprisingly, Staurosporine stands out as the most promiscuous PKI, along with close structural analogs Lestaurtinib and K252a. But structurally dissimilar PKIs such as AZD7762 (a checkpoint kinase inhibitor that potentiates chemotherapy-induced apoptosis),74,75 TAE_684 (a PKI identified as an inhibitor of NPM-ALK and LRRK2)76,77 and MK_8033 (a c-Met/Ron dual inhibitor)78 exhibit the same apparent lack of selectivity.
Figure 6.

(a) Comparison across all PKIs between the number of Kinases tested (x axis) and the number of Kinases with measurements below 100 nM (y axis). (b) Same comparison as in part a with a focus on the most selective PKIs. Color and marker size reflect the potency of the most potently inhibited Kinase for each PKI.
Focusing then on the most selective PKIs, PKIs with measurements on more than 450 Kinases and less than 15 Kinases inhibited below 100 nM were analyzed. Such selective PKIs were the JNK2/3 inhibitor JNK_inhibitor_IX,79 the EGFR inhibitor Tyrphostin_AG1478,80 the JNK inhibitor AS602145,81 the GSK3 inhibitor AR_A0_14418,82 the p38-MAPK signaling pathway inhibitors Skepinone_L83 and SB_203580,84 the LRRK2 inhibitor HG_10_102_01,85,86 the FLT3 inhibitor Tandutinib,87 and the dual PI3K/mTOR inhibitor PI_10388 (Figure 6).
The apparent structural diversity of these selective PKIs rules out the simplistic association of kinase selectivity with certain scaffolds. Assuming that compounds sharing similar scaffolds bind in similar ways in the orthosteric site, the importance of scaffold decorations to fine-tune the interactions to these sites is highlighted by comparing pairs of structurally related compounds. Such an interesting pair comprises MK_8033 (tested on 214 Kinases out of which 176 were inhibited below 100 nM, 82.2%) and Skepinone_L (tested on 479 Kinases out of which only 2 were inhibited below 100 nM, 0.4%) (Figure 6).
The most selective PKI was Akti_1_2, a dual AKT1-AKT2, whose level of selectivity might be explained by its allosteric, pleckstrin homology (PH), domain-dependent mode of binding.89 This observation led us to further investigate the influence of the PKIs binding modes on their kinase profiles. PKIs with an unspecified mode of binding (assumed to be Type I), Type II and covalent PKIs all compete with ATP to bind in the catalytic site. Type I PKIs bind to activated kinases, type II bind to inactivated kinases, and covalent PKIs bind irreversibly to both activated and inactivated kinases. Allosteric PKIs do not compete with ATP and bind kinases in several cavities (if binding in the catalytic site, they do not interact with the hinge). By comparing the value of the largest inhibition per PKI across all Kinases to the number of Kinases observed within 10-fold of that value (limiting ourselves as previously to the 322 PKIs exhibiting at least 200 Kinases with measurements), it was observed that the largest inhibition was on average the highest for type II PKIs, followed by covalent and type I PKIs (here, PKIs are assumed to be of type I when not in the other categories) (Figure 7). The allosteric PKIs were on average weaker inhibitors. This is a similar observation to what was found in previous work.66 While we have not compared the size of the allosteric inhibitors to the competitive inhibitors in this work, previously we found them to have a lower absolute affinity but to be equally ligand efficient due to their smaller molecular weight.66 This was also true for the kinase inhibitor section of our data set. No significant difference was observed for the number of Kinases observed within one log of the largest inhibition per PKI across all Kinases.
Figure 7.

Influence of the PKIs binding mode on their potency. (a) The x axis shows for each PKI the number of Kinases found within 10-fold of the most potently inhibited Kinase, in log scale, and the y axis shows the value at which this Kinase is inhibited. Marker size reflects the number of Kinases having measurements, for each PKI. (b) Boxplots show the upper quartile, median, average, and lower quartile for the value of the largest inhibition per PKI across all Kinases.
An alternative explanation of the observed lower affinity could be that allosteric PKIs were most often discovered by serendipity and might therefore be less often the outcome of numerous rounds of medicinal chemistry optimization, while on the other hand type II and covalent PKIs are usually rationally designed or optimized under the assumption that the specific structural features of their binding modes will confer on them an advantage in terms of kinase selectivity. The number of Kinases with a measurement was therefore compared to the SI_100 nM index, across the different binding modes classes. As noted previously, allosteric PKIs were observed to be significantly less potent than the other types of PKIs, and only one allosteric PKI did exhibit a non-null value of SI_100 nM: allosteric PKIs could therefore not be compared to the other types for SI_100 nM. As recently observed by Sutherland et al., Type II PKIs exhibited larger SI_100 nM values than the Type I and covalent PKIs, which were not significantly different (Figure 8).90 It appears therefore that, in this data set, Type II PKIs might achieve a higher potency but not necessarily a better selectivity than Type I and covalent ones.
Figure 8.

Influence of the PKI binding mode on the kinase selectivity. (a) The x axis shows for each PKI the number of Kinases with at least one measurement, and the y axis shows in log scale the value of the SI_100 nM selectivity index. (b) The boxplots show the upper quartile, median, average, and lower quartile for the value of the SI_100 nM selectivity index.
SureChEMBL Patent Analysis
Out of the 661 unique patents, a majority (563; 85.2%) were assigned to commercial companies, followed by 91 patents (13.8%) assigned to academic institutions, and only 7 (1.1%) to academic–industry partnerships. Most of the patents (552; 83.5%) were assigned after 1995, with a significant increase of the number of patents issued per year by industry in 2002–2003 and an apparent decline in the industry since 2006 (Figure 9).
Figure 9.

Number of patents priority claims per year. The color indicates the affiliation type.
It should be noted that these observations are valid within the boundaries of this data set which was not obtained via an exhaustive search of all kinase-related patents for the same period but via a nonexhaustive search of literature: trends on the plot do not reflect the overall kinase inhibitor patent productivity, but the publication bias of literature compounds. In addition, no attempt was made to account for the multiple mergers and acquisitions within the industrial sector, and the assignees names were kept as in the original patents. The assignees activity domains corresponded almost always to pharmaceutical research (630; 95.3%), with 5 patents coming from the agrochemical industry (0.8%), 19 (2.9%) from other industries, and 7 (1.1%) that could not be attributed. The 12 assignees having the highest numbers of unique patents in the data set are presented at Table 10.
Table 10. List of the 12 Assignees Having the Highest Numbers of Unique Patents.
| assignee | number of patents |
|---|---|
| Abbott | 55 |
| Smithkline Beecham | 24 |
| Novartis AG | 16 |
| AstraZeneca | 15 |
| Pfizer | 14 |
| Warner Lambert | 11 |
| Boehringer Ingelheim | 10 |
| Dana Farber Cancer Inst. | 10 |
| Bayer AG | 8 |
| Glaxo Group | 8 |
| Hoffmann La Roche | 8 |
| Merck & Co | 8 |
Out of the 12 most prolific institutions, one is an academic center, and the Abbott company alone accounts for 395 patented PKIs (34.9%) and 55 patents. This is not unexpected since one single article from Abbott91 contributes to 1441 PKIs to the complete data set (68.5%), some PKIs being not exclusive to this article. The target families for the patent could be identified in 301 cases (45.5%) and, not unexpectedly, it was a kinase in all but 39 cases (5.9%) (Figure 10).
Figure 10.

Target families as identified in the patent titles. The bars are colored according to the priority claims year (one patent from 1900, covering caffeine, was undisplayed for clarity).
In 147 cases (22.2%), a disease or medical term was used instead of a target name to define the scope of the patent, while no disease or target info was provided in 189 cases (28.6%). Finally, 24 patents were not related to pharmaceutical research.
Proteochemometric Analysis Results
The PCM data set was composed of 117 148 data points (100 969 Ki, 979 IC50, 15 200 Kd) corresponding to 361 Kinases and 2860 PKIs (11% matrix completeness). Approximately 27% were uniquely present in data set 2, 1% were uniquely present in ChEMBL, and 72% were present in both sets. The PCM models perform very well on this data set. The ligand–target space is modeled with an RMSE of 0.20 log units and an R02 of 0.94 (with the externally validated performance reaching 0.41 ± 0.02 log units and R02 0.74 ± 0.03 at 90%/10% cross-validated models) (see the learning curves in Figure 11a). Grouping predictions per target drops performance slightly to 0.44 ± 0.15 log units RMSE and 0.65 ± 0.14 R02 (Figure 11b), and when grouped per compound, performance is 0.36 ± 0.12 log units RMSE and 0.59 ± 0.22 R02 (Figure 11c). This illustrates that while the full kinase ligand–target space is well modeled, there are negative outliers, likely caused by a nonuniform sampling of the interaction space. From a target perspective, some Kinases are more densely populated with tested PKIs (Figure 3, Table 7), whereas from a chemical perspective, some PKIs have also been tested on more Kinases than others (Figure 6). Interestingly the average RMSE for individual compounds is slightly lower than that for individual targets, whereas the correlation coefficient is on average slightly higher for analysis grouped per target than for grouped per PKI. In other words, PKIs tend to show a lower variance across targets than the other way around, target variance across PKIs. We also observe this effect in our data: when the bioactivity points are grouped by target the mean pKi of compounds is 6.16 (±0.87) log units, whereas when the values are grouped by compound the mean pKi of targets is 6.56 (±1.20) log units. As PKIs bind (on average) with a relatively similar potency on different targets (displaying a lower variance), the RMSE is relatively low. However, the narrow spread makes it challenging for a model to rank order the PKIs by affinity (does a PKI bind better to target A than B?), and this translates in a relatively lower correlation coefficient. Conversely, this means that targets can display a greater variance in compound affinity. As a consequence, targets are unlikely to have (on average) a similar preference for all PKIs as indicated by the larger RMSE. However, larger differences in affinity lead to the modeling error having a lower influence on the compound ranking. For example, two compounds A and B, A having a better affinity, with a difference larger than the RMSE, are predicted correctly ranked when the model is slightly mispredicting within the RMSE. If their difference is smaller than the model RMSE, the chances are higher for these compounds to be ranked wrongly. Here, the larger variance translates in a relatively higher correlation coefficient.
Figure 11.

Performance of proteochemometric modeling on the set (R02 and RMSE). The curves show the median value and median average deviation (MAD) at different sizes of the training set based on the four different iterations (a) or based on the different targets or compounds (b, c). (a) Full validation set (the dashed lines extrapolate to full model performance using the values obtained in random forest out-of-bag validation). (b) Validation set grouped per target and subsequent median of these values (this method provides a better performance estimate of the models for individual targets). (c) Validation set grouped per PKI and a subsequent median of these values (this method provides a better performance estimate of the models for individual PKIs).
In order to further quantify performance, the average RMSE was also calculated (using all models that made up the learning curves) for each target. R02 was ignored here as the full activity range was smaller than 2.5 log units for some targets, which is insufficient (assuming an average error of approximately 0.5 log units).92,93 For both the validation sets grouped per Kinase and per PKI, the average RMSE was plotted versus the frequency (Figure 12). The plots show that our PCM models are capable of a robust modeling of the kinase ligand–target space. However, it should be noted that PKIs or Kinases with only a few data points could display a variable performance.
Figure 12.

(a) Average RMSE versus number of data points in the set grouped per PKI, for the Kinases with at least 600 PKIs tested with Ki results. (b) Average RMSE versus number of data points in the set grouped per Kinase, for the PKIs with at least 200 Kinases tested with Ki results. The color indicates the mean pKi across all Kinases/PKIs. The plots have been created on all models (different iterations of the learning curves) and give a good idea of the error distribution of our PCM models.
Only 104 Kinases had Ki results on more than 600 PKIs, the threshold we chose for the analysis. On that subset, the three best modeled Kinases were PRKCZ, PAK1, and CAMK2B (RMSE 0.22–0.24 log units) whereas GSK3B, AURKB, and CLK4 were modeled the worst (RMSE 0.69–0.78 log units) (Figure 12a). A representative validation plot for CAMK2B is shown in Supporting Information Figure S8, and a representative plot for GSK3B is in Supporting Information Figure S9.
Much fewer PKIs (∼600–800) have been tested on the best predicted Kinases than on the worst predicted ones (∼1000–1200). At the same time, their mean pKi (∼5.2) is on average almost one log unit smaller than that of the worst predicted ones (∼6.0) (Figure 12), and their mean SI_k_100 nM (∼0.01) is also smaller than that of the worst predicted ones (∼0.14), which might imply that the distribution of pKi values is more important than the number of values (Supporting Information Figure S10). This is also observed when plotting the pKi values against the Kinases (Supporting Information Figure S11).
The number of PKIs per Murcko scaffold94 was variable in the data set, ranging from singletons and pairs (half of the compounds) to 22 compounds sharing the same Murcko scaffold (Supporting Information Figure S12a). Judging from the RMSE, scaffold frequency did not seem to have an influence on the quality of the predictions (Supporting Information Figure S12b). In addition, the median similarity of the compounds to the rest of the training set was calculated and further investigation led to the conclusion that no trend could be observed with regards to the RMSE or R2 (data not shown).
The worst modeled Kinases appear to have more PKIs, which are on average more potent, and which cover a wider range of potencies, than the best modeled ones. That might seem counterintuitive if one reasons by analogy to the pharmacophore perception problem. This problem states that when a training set is built, it should contain several diverse chemical series, with large ranges of potencies within each series, in order to computationally identify the structural features responsible for the biological activity. One explanation for our observed inconsistency to this wider range might be as follows: we judge the “ability to predict” (i.e., small RMSE value) by excluding data from the set, building models without the excluded data and then using the models to predict the values for these data before comparing to the measured values:
If the complete range of measured values is narrow, then whatever the composition of the excluded set, there are good chances that its range will be covered by that of the model building set: we stay within the “applicability domain” in terms of pKi values.
On the other hand, if the range is wide, then the ranges of excluded and model building data might not overlap very well anymore, which might lead to poorer performances.
Only 50 PKIs had Ki results on more than 200 Kinases, the threshold we chose for the analysis. On that subset, the PKIs whose activities were predicted the best were VX745, CP_724714, and Roscovitine (RMSE 0.31–0.32 log units), and the worst were Staurosporine, Bosutinib, and CEP_32496 (RMSE 0.91–0.96 log units) (Figure 12b), with the structures shown in Figure 13. Representative plots for two are shown in the Supporting Information Figures S13 (VX745) and S14 (Bosutinib).
Figure 13.

Examples of PKIs whose activities were well predicted by our model (green, underlined) and predicted with lesser accuracy (red, in italic).
The number of Kinases against which the PKIs were tested does not seem to influence the RMSE (Figure 12b). But as already observed with the validation set grouped per Kinase, the mean pKi of the best predicted PKIs (∼5.2) is on average almost one log unit smaller than that of the worst predicted ones (∼6.3) (Figure 12b), and their mean SI_100 nM (∼0.01) is also smaller than that of the worst predicted ones (∼0.26), underlining again the importance of the distribution of the pKi values (Supporting Information Figure S10b). This is also observed when plotting the pKi values against the Kinases (Supporting Information Figure S15).
It is never trivial to prospectively validate a model; however, something can be said on the relevance of future predictions. Novel PKIs might belong to the chemical space of the data set (e.g., structures tested on a different Kinase, or new structures similar to the data set ones) and then quantification of reliability of predictions is relatively straightforward. Should a structure not be completely covered, reliability is expected to be lower; however, as we have shown, it is difficult to quantify the reliability for individual compounds. Hence the best course of action would be in our view to consider the average model error.
Finally, when plotting the RMSE as a function of the number of Kinases assayed for a PKI, no difference was observed between PKIs with type I or type II binding modes (covalent PKIs were represented by only two compounds and no conclusion can therefore be made on this small population) (Figure 14). It is to be noted that the three best and three worst predicted compounds mentioned above were all type I orthosteric binders.
Figure 14.

Influence of the PKI binding mode type on the RMSE for the PKIs. The x axis shows the number of Kinases and the y axis shows the RMSE value.
Model Interpretation
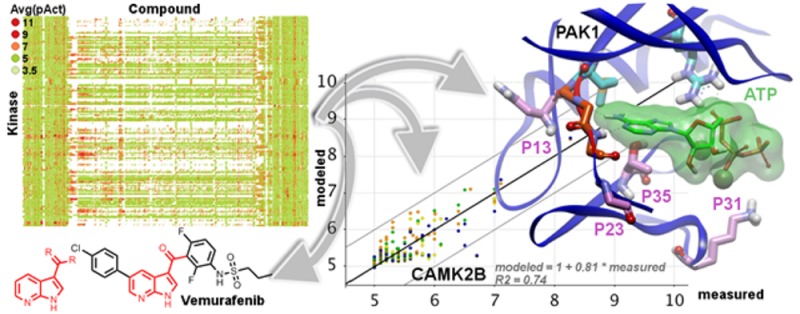
The model quality allows the accurate prediction of PKI–Kinase activities, opening the door for rational design of selectivity for individual PKIs. Analyzing the descriptors (see Supporting Information Table S8 for the complete list), several key properties were identified to correlate with a higher Ki value across the board. For the PKIs these were (in order of decreasing importance): compound size (and related properties like number of bonds and number of rings), lower predicted solubility (i.e., more lipophilic compounds tend to have a higher affinity),95 larger number of hydrogen bond donors, and a larger polar surface area. Metz et al. had already highlighted the influence of the number of hydrogen bonds donors and acceptors but had excluded a correlation with size.91 In addition, a number of molecular substructures were found to correlate with a higher affinity. Out of the 15 substructures with the highest correlation to affinity (averaged over all 20 models), 11 clearly correspond to the Staurosporine class of compounds (they retrieve 10–19 of the 19 Staurosporine analogs), 3 retrieved bicyclic aromatic systems such as azaindole (as observed in Vemurafenib) and derivatives, and the last one is the common motif diamine phenylpyrimidine, observed for example in Tamatinib (Figure 15, with more examples presented in Supporting Information Figure S16).
Figure 15.

(a) List of the 15 substructures with the highest correlation to affinity (averaged over all 20 models. (b) examples of PKIs retrieved by these substructures. The substructures (a) and hits (b) are colored by chemical class: green diamine phenylpyrimidine (DAPP) and related; blue Staurosporine and related; orange azaindole and related.
Analysis of the molecular substructures correlated to the prediction accuracy identified sets of similar substructures, as seen in Figure 16 where the previously identified top 15 substructures are again highlighted.
Figure 16.

Impact of molecular substructures on the correlation with affinity (x axis) and on the importance for accuracy (y axis), both averaged over the 20 models. The 15 substructures previously described are displayed and colored by chemical class (green diamine phenylpyrimidine (DAPP) and related; blue Staurosporine and related; brown azaindole and related) while the other substructures are only represented by gray markers.
Conversely we could identify protein features correlated to higher affinity: Kinases with more electrophilic, large and hydrophobic (small effect) residues tend to display higher affinities. More specifically, key properties at specific positions were found to correlate with relatively higher affinities: alignment positions 13 (larger and more electrophilic amino acids), 23 (large amino acids), 31 (hydrophobic and small amino acids), and 35 (more hydrophobic). As an example, Table 11 shows the amino acids observed at these four positions in three Kinases of increasing mean pKi: PAK1 (mean pKi = 5.12, third smallest pKi value observed; RMSE = 0.23, second smallest RMSE value observed), TYRO3 (mean pKi = 5.69; RMSE = 0.39), and FLT1 (mean pKi = 6.47, largest pKi value observed; RMSE = 0.67, fourth largest RMSE value observed). While on this example the properties of the amino acids at position 13 do not allow a clear differentiation, the trend is overall respected at the three other positions.
Table 11. Values of the Key Properties Correlated with Higher Affinities at the Four Identified Positionsa.
| PAK1 (mean
pKi = 5.12) |
TYRO3 (mean pKi = 5.69) |
FLT1 (mean pKi = 6.47) |
|||||
|---|---|---|---|---|---|---|---|
| position | desirable property (unit) | amino acid | value | amino acid | value | amino acid | value |
| 13 | large size (Da) | Asn329 | 132 | Lys572 | 146 | Asn893 | 132 |
| 13 | electrophilicity (KD score) | Asn329 | –3.5 | Lys572 | –3.9 | Asn893 | –3.5 |
| 23 | large size (Da) | Gly349 | 75 | His598 | 155 | Tyr914 | 181 |
| 31 | small size (Da) | Lys391 | 146 | Ala647 | 89 | Ala1024 | 89 |
| 31 | hydrophobicity (KD score) | Lys391 | –3.9 | Ala647 | 1.8 | Ala1024 | 1.8 |
| 35 | hydrophobicity (KD score) | Thr406 | –0.7 | Ala662 | 1.8 | Cys1039 | 2.5 |
The KD score corresponds to the Kyte and Doolitle hydrophobicity96.
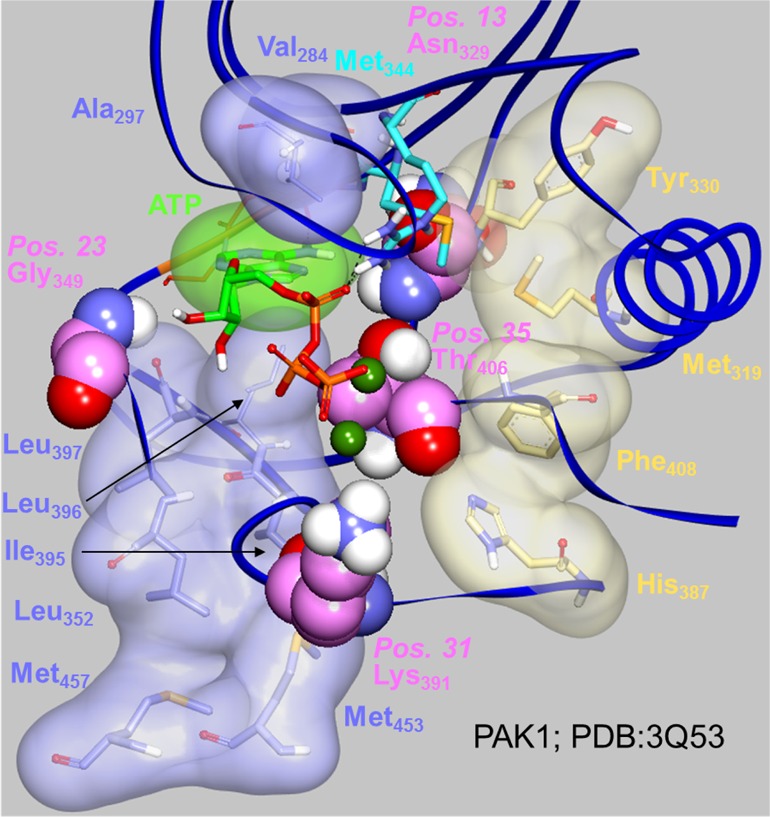
Position 13 belongs to the ß4 strand of the N lobe and lines the back pocket of the orthosteric site, while position 23 in the loop between the N lobe ß4 strand and the C lobe D helix lies in the entrance pocket, separated from the hinge amino acids by one amino acid (Figure 17). The side chains of the amino acids at positions 13 and 23 point away from the ATP cavity and cannot make any interaction with it. Position 31 belongs to the catalytic loop in the C lobe and lines the phosphate pocket. Lysine amino acids are conservatively observed at this position in the kinome since the Lysine side chain points toward the cavity and is engaged in stabilizing interactions with the ATP phosphate groups. Position 35 belongs to the activation loop in the C lobe and precedes the Asp-Phe-Gly (DFG) motif at the N terminus of the activation loop, which conformational switch distinguishes between type I and type II ligands. Its side chain points toward the cavity, potentially interacting with ligands (via direct hydrogen bonds to type II ligands for example). The reason why the PCM model identified these four positions is therefore not immediately related to a potential modulation (depending on the nature of the amino acid) of direct interactions with ligands.
Figure 17.
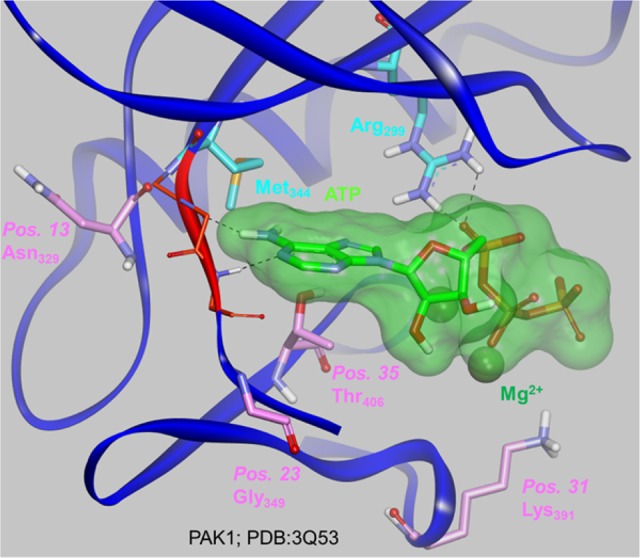
Mapping of the four positions where key properties correlate with relatively higher affinities (carbon atoms in pink) on the PAK1–ATP (carbon atoms in light green) crystal structure (PDB Code: 3Q53, resolution: 2.09 A). The hinge amino acids are highlighted in orange (carbon atoms in orange, only the backbone is displayed). Key amino acids Met344 (gatekeeper) and Arg299 are also displayed (carbon atoms in cyan). The hydrogen bonds between ATP and the amino acids are represented as dotted lines.
The model might have captured more complex parameters such as the impact of the presence of key amino acids on the conformational plasticity of the kinases. A highly conserved spatial motif of four hydrophobic amino acids spanning all structural domains have been found to dynamically assemble upon kinase activation, a process that depends on the Activation Loop conformation and phosphorylation status. These amino acids form a “Regulatory Spine” (R-Spine) that stabilizes the kinase active conformation, coordinates the motions of the N- and C-lobes and is disordered in the inactive conformation.97 A second spine was later identified, formed via the assembly of eight hydrophobic amino acids and requiring the additional presence of the adenine ring of the ATP (or an equivalent ring system from a synthetic ligand). This “Catalytic Spine” (C-Spine) traverses and connects both lobes.98 The protein kinase functionality requires conformational plasticity, provided by the spines assembly and dismantlement, itself triggered by activation loop phosphorylation state and ATP presence. The four positions identified by the PCM model were all found in close proximity to the R- and C-Spine amino acids (Table 12, Figure 18), a region of strategically great importance.99 For the construction of the PCM model we limited ourselves to a sequence alignment based mainly on the ATP binding pocket. Hence, what we observe interpreting the model for residues at positions 13, 23, 31, 35 might be a proxy for changes actually taking place in the spine region. The currently used alignment includes half of the Spines positions: two of the four R-Spine positions and four of the eight C-Spine positions. It might very well be that extending this alignment to include the full spine regions will improve the PCM model and allow it to confirm the role these amino acids play.
Table 12. List, Amino Acid Identities and Locations of the Four Positions Identified by the PCM Models and of the C- and R-Spine Amino Acids in Their Vicinity.
| amino acid | location | |
|---|---|---|
| position 13 | Asn329 | N lobe, ß4 strand |
| R-Spine | Tyr330 | N lobe, ß4 strand |
| position 23 | Gly349 | N lobe ß4 strand to C lobe D-helix loop |
| C-Spine | Leu352 | C lobe, D-helix |
| R-Spine | His387 | C lobe, catalytic loop |
| position 31 | Lys391 | C lobe, catalytic loop |
| C-Spine | Ile395 | C lobe, ß7 strand |
| C-Spine | Leu396 | C lobe, ß7 strand |
| C-Spine | Leu397 | C lobe, ß7 strand |
| position 35 | Thr406 | C lobe, activation loop |
| R-Spine | Phe408 | C lobe, activation loop |
Figure 18.
Four positions where key properties correlate with relatively higher affinities (carbon atoms in pink) are surrounded by the regulatory (carbon atoms in light brown) and catalytic (carbon atoms in light blue for the kinase, in light green for the ATP) spines in this PAK1-ATP crystal structure (PDB code 3Q53, resolution 2.09 A). The hinge amino acids are highlighted in orange (carbon atoms in orange, only the backbone is displayed). Key amino acids Met344 (gatekeeper) and Arg299 are also displayed (carbon atoms in cyan). The hydrogen bonds between ATP and the amino acids are represented as dotted lines.
It is to be noted that a previous effort by Martin and Mukherjee, relying on a 46 amino acids definition of the binding site as composed of the ATP and back pockets, and on a sequence identity as a similarity measure, identified a set of 16 amino acids most influential for interkinase SAR similarity. Our method relied on a 38 amino acids definition of the binding site and we translated our amino acids to physicochemical properties, that could arguably be considered to be more relevant for drug binding: we have previously shown that using different descriptors leads to different descriptions of the binding pocket.57 There, while performance of the models trained was similar,100 interpretation might be diverging between different descriptor types. Indeed, out of the 4 amino acids highlighted in our approach, only 1 is also present in the 16 amino acids from Martin and Mukherjee, while 2 are adjacent to 1 of Martin and Mukherjee and the fourth is located 5 amino acids away.
Summary and Conclusions
We have presented here our efforts in compiling, standardizing and analyzing a very large set of kinase bioactivity profiles based on published literature, followed by extensive proteochemometric bioactivity modeling. The full data set is available as a Supporting Information zip file and can be downloaded from the ChEMBL FTP server.101 The bioactivity data will be fully integrated and available in a future release of the ChEMBL database. This will complement the existing kinase screening depositions and will hopefully facilitate more comparative chemogenomics studies in the community.
Different aspects of the data set composition were analyzed, ranging from the data sources (journals, articles) to the data types and providers, the patents covering the PKIs and the corresponding patentees’ affiliations, the kinome coverage, the selectivity or promiscuity of both Kinases and PKIs, and the impact of the PKI type on both their potency and selectivity.
Though incomplete by nature due to the heterogeneity of the sources, the data set allowed for a robust proteochemometric prediction of kinase activity across the fraction of the kinome addressed in the compiled literature: our models facilitate the exploration of the kinase ligand–target space and the rationalization of the global activity. The provided data files in the Supporting Information enable the rational design of compounds with a targeted selectivity profile, hopefully leading to more specific leads or probes with higher efficacy. The key is the ability to capture the differences in ligand–target interaction space displayed by the kinases and their inhibitors. Here it has been demonstrated that the current set allows for the creation of PCM models capable to achieve just that. However, the currently presented PCM model can be further improved by descriptor tuning or inclusion of other parameters such as protein domain102 or concentrations used in the experiments. Although it was judged outside the scope of the current work, our future plans include a dedicated study on a high quality kinomewide PCM as proposed here.
In conclusion, in the opinion of the authors, the ever increasing computational power, coupled to the development of better algorithms (such as deep learning)103 will allow the possibility of rational kinome inhibitor design to be a reality in the very near future.
Acknowledgments
We thank the multiple authors of the studies cited here for making their bioactivity data publicly available.
Glossary
Abbreviations
- ATP
adenosine triphosphate
- DOI
digital object identifier
- GPCR
G protein-coupled receptors
- HGNC
Human Genome Nomenclature Committee
- IC50
half-maximum inhibitory concentration
- Kd
dissociation constant
- Ki
inhibition constant
- PCM
proteochemometrics
- Pct_Ctrl
Percent of Control
- Pct_Inhib
percent of inhibition
- PDB
Protein Data Bank
- PKI
protein kinase inhibitor
- QSAR
quantitative structure–activity relationship
- RMSE
root-mean-square error
- SAR
structure–activity relationships
- SD
standard deviation
- SI_1uM
selectivity index at 1 μM
- SI_100 nM
selectivity index at 100 nM
- SI_k_1uM
kinase selectivity index at 1 μM
- SI_k_100 nM
kinase selectivity index at 100 nM
- SRT
standardized result type
- SRV
standardized result value
Supporting Information Available
The Supporting Information is available free of charge on the ACS Publications website at DOI: 10.1021/acs.jcim.6b00122.
Supporting figures: (1) Comparison across the data sources of the relative numbers of measurements and of their distribution according to the result types. (2) High resolution version of Figure 3. (3) Coverage across data sources, at the Kinase level. (4) Distribution of the binned pStandardized_Result_Value_SD. (5) Coverage of the kinome by compounds from the current data set PKIs exhibiting a STD_RESULT_VALUE of 100 nM or less. (6) Spread of the SI_k_100 nM values across the kinome, for the Kinases with at least 100 compounds tested. (7) Structures of the 25 PKIs with the highest number of Kinases. (8) Example of a well-modeled kinase: CAMK2B. (9) Example of a poorly modeled kinase: GSK3B. (10) Comparison between RMSE and SI_(k)_100 nM values for the Kinases. (11) Influence of the spread of pKi values on the RMSE for the Kinases. (12) Relative populations of singletons, pairs, etc. and boxplot of the RMSE vs the Murcko fragment. (13) Example of a well-modeled compound: VX745. (14) Example of a poorly modeled compound: Bosutinib. (15) Influence of the spread of pKi values on the RMSE for the PKIs. (16) Examples of compounds retrieved using the substructures showing the highest correlation to affinity (PDF)
Data collection procedures for kinases-related properties, assays-related properties, and bioactivities processing (PDF)
Complete data set (ZIP)
Supporting tables: (1) Data sources. (2) Compounds, with SureChEMBL data. (3) HGNCs and Kinases. (4) Bioactivities-related properties and their values. (5) Compound physicochemical property descriptors. (6) Counts and coverages for each data source at the Kinase level. (7) Counts and coverages for each data source at the HGNC level. (8) Calculated PCM descriptors and their impact on affinity prediction (XLSX)
Author Present Address
§ S.C.-F.: Novartis Institutes for BioMedical Research, Postfach, CH-4002, Basel, Switzerland.
Author Present Address
# G.J.P.v.W.: Medicinal Chemistry, Leiden Academic Center for Drug Research, Leiden University, Einsteinweg 55, 2333CC, Leiden, The Netherlands.
Author Present Address
∥ F.B.E.: Medicines for Malaria Venture, Route de Pré-Bois 20, 1215 Meyrin, Switzerland.
Author Present Address
⊥ A.R.: EMD Serono, 45 Middlesex Turnpike, Billerica, MA 01821, USA.
Author Present Address
○ J.P.O.: Stratified Medical, 40 Churchway, London, NW1 1LM, UK.
Author Present Address
□ D.D.: Wega Informatik AG, Aeschengraben 20, 4051 Basel, Switzerland.
G.P. would like to acknowledge the Wellcome Trust and the European Molecular Biology Laboratory for funding. G.J.P.v.W. would like to thank the European Molecular Biology Laboratory and Marie Curie for funding (COFUND; EIPOD-229597).
The authors declare no competing financial interest.
Supplementary Material
References
- Manning G.; Whyte D. B.; Martinez R.; Hunter T.; Sudarsanam S. The Protein Kinase Complement of the Human Genome. Science 2002, 298, 1912–1934. 10.1126/science.1075762. [DOI] [PubMed] [Google Scholar]
- Blume-Jensen P.; Hunter T. Oncogenic Kinase Signaling. Nature 2001, 411, 355–365. 10.1038/35077225. [DOI] [PubMed] [Google Scholar]
- Cohen P. Protein kinases--the major drug targets of the twenty-first century?. Nat. Rev. Drug Discovery 2002, 1, 309–15. 10.1038/nrd773. [DOI] [PubMed] [Google Scholar]
- Zhang J.; Yang P. L.; Gray N. S. Targeting Cancer with Small Molecule Kinase Inhibitors. Nat. Rev. Cancer 2009, 9, 28–39. 10.1038/nrc2559. [DOI] [PMC free article] [PubMed] [Google Scholar]
- Wu P.; Nielsen T. E.; Clausen M. H. FDA-approved small-molecule kinase inhibitors. Trends Pharmacol. Sci. 2015, 36, 422–439. 10.1016/j.tips.2015.04.005. [DOI] [PubMed] [Google Scholar]
- A comprehensive view of small molecule inhibitors of the protein kinase domain was built in a hierarchical and regularly updated manner from the following sources: (1) FDA Orange book, Korean, Chinese, Japanese, and European drug approval agency web sites; (2) WHO INN and AMA USAN web sites; (3) corporate web sites; and (4) industry news feeds. Chemical structures could be reliably assigned to 72% of compounds and were confirmed by linkage to originator patents. Development status and molecular targets were assigned and confirmed by PubMed searches and via corporate web sites. It is of note that clinicaltrials.gov only covers 79% of this set, the remainder being either historical agents or currently in trials outside of the US.
- Eglen R. M.; Reisine T. The Current Status of Drug Discovery against the Human Kinome. Assay Drug Dev. Technol. 2009, 7, 22–43. 10.1089/adt.2008.164. [DOI] [PubMed] [Google Scholar]
- Burmester G. R.; Blanco R.; Charles-Schoeman C.; Wollenhaupt J.; Zerbini C.; Benda B.; Gruben D.; Wallenstein G.; Krishnaswami S.; Zwillich S. H.; Koncz T.; Soma K.; Bradley J.; Mebus C. Tofacitinib (CP-690,550) in Combination with Methotrexate in Patients with Active Rheumatoid Arthritis with an Inadequate Response to Tumour Necrosis Factor Inhibitors: A Randomised Phase 3 Trial. Lancet 2013, 381, 451–460. 10.1016/S0140-6736(12)61424-X. [DOI] [PubMed] [Google Scholar]
- Cohen P.; Alessi D. R. Kinase Drug Discovery-What’s next in the Field?. ACS Chem. Biol. 2013, 8, 96–104. 10.1021/cb300610s. [DOI] [PMC free article] [PubMed] [Google Scholar]
- Simmons D. L. Targeting kinases: a new approach to treating inflammatory rheumatic diseases. Curr. Opin. Pharmacol. 2013, 13, 426–434. 10.1016/j.coph.2013.02.008. [DOI] [PubMed] [Google Scholar]
- Kontzias A.; Laurence A.; Gadina M. l.; O’Shea J. J. Kinase inhibitors in the treatment of immune-mediated disease. F1000 Med. Rep. 2012, 4, 5–12. 10.3410/M4-5. [DOI] [PMC free article] [PubMed] [Google Scholar]
- Eglen R. M.; Reisine T. Human Kinome Drug Discovery and the Emerging Importance of Atypical Allosteric Inhibitors. Expert Opin. Drug Discovery 2010, 5, 277–290. 10.1517/17460441003636820. [DOI] [PubMed] [Google Scholar]
- Eglen R.; Reisine T. Drug discovery and the human kinome: recent trends. Pharmacol. Ther. 2011, 130, 144–156. 10.1016/j.pharmthera.2011.01.007. [DOI] [PubMed] [Google Scholar]
- Fang Z.; Grütter C.; Rauh D. Strategies for the Selective Regulation of Kinases with Allosteric Modulators: Exploiting Exclusive Structural Features. ACS Chem. Biol. 2013, 8, 58–70. 10.1021/cb300663j. [DOI] [PubMed] [Google Scholar]
- Dar A. C.; Shokat K. M. The evolution of protein kinase inhibitors from antagonists to agonists of cellular signaling. Annu. Rev. Biochem. 2011, 80, 769–795. 10.1146/annurev-biochem-090308-173656. [DOI] [PubMed] [Google Scholar]
- Liu Y.; Gray N. S. Rational design of inhibitors that bind to inactive kinase conformations. Nat. Chem. Biol. 2006, 2, 358–364. 10.1038/nchembio799. [DOI] [PubMed] [Google Scholar]
- Zuccotto F.; Ardini E.; Casale E.; Angiolini M. Through the “Gatekeeper Door”: Exploiting the Active Kinase Conformation. J. Med. Chem. 2010, 53, 2681–2694. 10.1021/jm901443h. [DOI] [PubMed] [Google Scholar]
- Barf T.; Kaptein A. Irreversible Protein Kinase Inhibitors: Balancing the Benefits and Risks. J. Med. Chem. 2012, 55, 6243–6262. 10.1021/jm3003203. [DOI] [PubMed] [Google Scholar]
- Liu Q.; Sabnis Y.; Zhao Z.; Zhang T.; Buhrlage S. J.; Jones L. H.; Gray N. S. Developing Irreversible Inhibitors of the Protein Kinase Cysteinome. Chem. Biol. 2013, 20, 146–159. 10.1016/j.chembiol.2012.12.006. [DOI] [PMC free article] [PubMed] [Google Scholar]
- Haar E.; Walters W. P.; Pazhanisamy S.; Taslimi P.; Pierce A. C.; Bemis G. W.; Salituro F. G.; Harbeson S. L. Kinase Chemogenomics: Targeting the Human Kinome for Target Validation and Drug Discovery. Mini-Rev. Med. Chem. 2004, 4, 235–253. 10.2174/1389557043487367. [DOI] [PubMed] [Google Scholar]
- Mughal T. I.; Goldman J. M. Chronic myeloid leukemia: current status and controversies. Oncology (Williston Park) 2004, 18, 837–844. [PubMed] [Google Scholar]
- Demetri G. D. Identification and Treatment of Chemoresistant Inoperable or Metastatic GIST: Experience with the Selective Tyrosine Kinase Inhibitor Imatinib Mesylate (STI571). Eur. J. Cancer 2002, 38, S52–S59. 10.1016/S0959-8049(02)80603-7. [DOI] [PubMed] [Google Scholar]
- Cools J.; DeAngelo D. J.; Gotlib J.; Stover E. H.; Legare R. D.; Cortes J.; Kutok J.; Clark J.; Galinsky I.; Griffin J. D.; Cross N. C. P.; Tefferi A.; Malone J.; Alam R.; Schrier S. L.; Schmid J.; Rose M.; Vandenberghe P.; Verhoef G.; Boogaerts M.; Wlodarska I.; Kantarjian H.; Marynen P.; Coutre S. E.; Stone R.; Gilliland D. G. A Tyrosine Kinase Created by Fusion of the PDGFRA and FIP1L1 Genes as a Therapeutic Target of Imatinib in Idiopathic Hypereosinophilic Syndrome. N. Engl. J. Med. 2003, 348, 1201–1214. 10.1056/NEJMoa025217. [DOI] [PubMed] [Google Scholar]
- Apsel B.; Blair J. A.; Gonzalez B.; Nazif T. M.; Feldman M. E.; Aizenstein B.; Hoffman R.; Williams R. L.; Shokat K. M.; Knight Z. A. Targeted Polypharmacology: Discovery of Dual Inhibitors of Tyrosine and Phosphoinositide Kinases. Nat. Chem. Biol. 2008, 4, 691–699. 10.1038/nchembio.117. [DOI] [PMC free article] [PubMed] [Google Scholar]
- Hopkins A. L. Network Pharmacology: The next Paradigm in Drug Discovery. Nat. Chem. Biol. 2008, 4, 682–690. 10.1038/nchembio.118. [DOI] [PubMed] [Google Scholar]
- Knight Z. A.; Lin H.; Shokat K. M. Targeting the Cancer Kinome through Polypharmacology. Nat. Rev. Cancer 2010, 10, 130–137. 10.1038/nrc2787. [DOI] [PMC free article] [PubMed] [Google Scholar]
- Morphy R. Selectively Nonselective Kinase Inhibition: Striking the Right Balance. J. Med. Chem. 2010, 53, 1413–1437. 10.1021/jm901132v. [DOI] [PubMed] [Google Scholar]
- Bowes J.; Brown A. J.; Hamon J.; Jarolimek W.; Sridhar A.; Waldron G.; Whitebread S. Reducing Safety-Related Drug Attrition: The Use of in Vitro Pharmacological Profiling. Nat. Rev. Drug Discovery 2012, 11, 909–922. 10.1038/nrd3845. [DOI] [PubMed] [Google Scholar]
- Goldstein D. M.; Gray N. S.; Zarrinkar P. P. High-throughput kinase profiling as a platform for drug discovery. Nat. Rev. Drug Discovery 2008, 7, 391–397. 10.1038/nrd2541. [DOI] [PubMed] [Google Scholar]
- Bi K.; Lebakken C. S.; Vogel K. W. Transformation of in Vitro Tools for Kinase Profiling: Keeping an Eye over the off-Target Liabilities. Expert Opin. Drug Discovery 2011, 6, 701–712. 10.1517/17460441.2011.575776. [DOI] [PubMed] [Google Scholar]
- Miduturu C. V.; Deng X.; Kwiatkowski N.; Yang W.; Brault L.; Filippakopoulos P.; Chung E.; Yang Q.; Schwaller J.; Knapp S.; King R. W.; Lee J.-D.; Herrgard S.; Zarrinkar P.; Gray N. S. High-Throughput Kinase Profiling: A More Efficient Approach toward the Discovery of New Kinase Inhibitors. Chem. Biol. 2011, 18, 868–879. 10.1016/j.chembiol.2011.05.010. [DOI] [PMC free article] [PubMed] [Google Scholar]
- Bamborough P. System-Based Drug Discovery within the Human Kinome. Expert Opin. Drug Discovery 2012, 7, 1053–1070. 10.1517/17460441.2012.724056. [DOI] [PubMed] [Google Scholar]
- Knapp S.; Arruda P.; Blagg J.; Burley S.; Drewry D. H.; Edwards A.; Fabbro D.; Gillespie P.; Gray N. S.; Kuster B.; Lackey K. E.; Mazzafera P.; Tomkinson N. C. O.; Willson T. M.; Workman P.; Zuercher W. J. A Public-Private Partnership to Unlock the Untargeted Kinome. Nat. Chem. Biol. 2012, 9, 3–6. 10.1038/nchembio.1113. [DOI] [PubMed] [Google Scholar]
- Davies S. P.; Reddy H.; Caivano M.; Cohen P. Specificity and Mechanism of Action of Some Commonly Used Protein Kinase Inhibitors. Biochem. J. 2000, 351, 95–105. 10.1042/0264-6021:3510095. [DOI] [PMC free article] [PubMed] [Google Scholar]
- Karaman M. W.; Herrgard S.; Treiber D. K.; Gallant P.; Atteridge C. E.; Campbell B. T.; Chan K. W.; Ciceri P.; Davis M. I.; Edeen P. T.; Faraoni R.; Floyd M.; Hunt J. P.; Lockhart D. J.; Milanov Z. V.; Morrison M. J.; Pallares G.; Patel H. K.; Pritchard S.; Wodicka L. M.; Zarrinkar P. P. A quantitative analysis of kinase inhibitor selectivity. Nat. Biotechnol. 2008, 26, 127–132. 10.1038/nbt1358. [DOI] [PubMed] [Google Scholar]
- Bamborough P.; Drewry D.; Harper G.; Smith G. K.; Schneider K. Assessment of Chemical Coverage of Kinome Space and Its Implications for Kinase Drug Discovery. J. Med. Chem. 2008, 51, 7898–7914. 10.1021/jm8011036. [DOI] [PubMed] [Google Scholar]
- Pearce L. R.; Alton G. R.; Richter D. T.; Kath J. C.; Lingardo L.; Chapman J.; Hwang C.; Alessi D. R. Characterization of PF-4708671, a Novel and Highly Specific Inhibitor of p70 Ribosomal S6 Kinase (S6K1). Biochem. J. 2010, 431, 245–255. 10.1042/BJ20101024. [DOI] [PubMed] [Google Scholar]
- Najafov A.; Sommer E. M.; Axten J. M.; Deyoung M. P.; Alessi D. R. Characterization of GSK2334470, a novel and highly specific inhibitor of PDK1. Biochem. J. 2011, 433, 357–369. 10.1042/BJ20101732. [DOI] [PubMed] [Google Scholar]
- Gaulton A.; Bellis L. J.; Bento A. P.; Chambers J.; Davies M.; Hersey A.; Light Y.; McGlinchey S.; Michalovich D.; Al-Lazikani B.; Overington J. P. ChEMBL: a large-scale bioactivity database for drug discovery. Nucleic Acids Res. 2012, 40, D1100–D1107. 10.1093/nar/gkr777. [DOI] [PMC free article] [PubMed] [Google Scholar]
- Bento A. P.; Gaulton A.; Hersey A.; Bellis L. J.; Chambers J.; Davies M.; Krüger F. A.; Light Y.; Mak L.; McGlinchey S.; Nowotka M.; Papadatos G.; Santos R.; Overington J. P. The ChEMBL bioactivity database: an update. Nucleic Acids Res. 2014, 42, D1083–D1090. 10.1093/nar/gkt1031. [DOI] [PMC free article] [PubMed] [Google Scholar]
- Gao Y.; Davies S. P.; Augustin M.; Woodward A.; Patel U. A.; Kovelman R.; Harvey K. J. A Broad Activity Screen in Support of a Chemogenomic Map for Kinase Signalling Research and Drug Discovery. Biochem. J. 2013, 451, 313–328. 10.1042/BJ20121418. [DOI] [PubMed] [Google Scholar]
- Dranchak P.; MacArthur R.; Guha R.; Zuercher W. J.; Drewry D. H.; Auld D. S.; Inglese J. Profile of the GSK Published Protein Kinase Inhibitor Set across ATP-Dependent and-Independent Luciferases: Implications for Reporter-Gene Assays. PLoS One 2013, 8, e57888. 10.1371/journal.pone.0057888. [DOI] [PMC free article] [PubMed] [Google Scholar]
- Mestres J.; Gregori-Puigjané E.; Valverde S.; Solé R. V. Data Completeness-the Achilles Heel of Drug-Target Networks. Nat. Biotechnol. 2008, 26, 983–984. 10.1038/nbt0908-983. [DOI] [PubMed] [Google Scholar]
- Fedorov O.; Marsden B.; Pogacic V.; Rellos P.; Müller S.; Bullock A. N.; Schwaller J.; Sundström M.; Knapp S. A systematic interaction map of validated kinase inhibitors with Ser/Thr kinases. Proc. Natl. Acad. Sci. U. S. A. 2007, 104, 20523–20528. 10.1073/pnas.0708800104. [DOI] [PMC free article] [PubMed] [Google Scholar]
- HMS LINCS. http://lincs.hms.harvard.edu/db/datasets/ using “KINOMEscan” as a query (accessed 01/14/2013).
- KINOMEscan. http://www.discoverx.com/services/drug-discovery-development-services/kinase-profiling/kinomescan (accessed 04/18/2013).
- MRC Dundee. http://www.kinase-screen.mrc.ac.uk/kinase-inhibitors (accessed 01/28/2013).
- Biovia Draw. http://accelrys.com/products/collaborative-science/biovia-draw/ (accessed 11/10/2015).
- Biovia Pipeline Pilot. http://accelrys.com/products/collaborative-science/biovia-pipeline-pilot/ (accessed 11/10/2015).
- Posy S. L.; Hermsmeier M. A.; Vaccaro W.; Ott K. H.; Todderud G.; Lippy J. S.; Trainor G. L.; Loughney D. A.; Johnson S. R. Trends in kinase selectivity: insights for target class-focused library screening. J. Med. Chem. 2011, 54, 54–66. 10.1021/jm101195a. [DOI] [PubMed] [Google Scholar]
- Anastassiadis T.; Deacon S. W.; Devarajan K.; Ma H.; Peterson J. R. Comprehensive assay of kinase catalytic activity reveals features of kinase inhibitor selectivity. Nat. Biotechnol. 2011, 29, 1039–1045. 10.1038/nbt.2017. [DOI] [PMC free article] [PubMed] [Google Scholar]
- Papadatos G.; Davies M.; Dedman N.; Chambers J.; Gaulton A.; Siddle J.; Koks R.; Irvine S. A.; Pettersson J.; Goncharoff N.; Hersey A.; Overington J. P. SureChEMBL: a large-scale, chemically annotated patent document database. Nucleic Acids Res. 2016, 44 (D1), D1220–D1228. 10.1093/nar/gkv1253. [DOI] [PMC free article] [PubMed] [Google Scholar]
- Chambers J.; Davies M.; Gaulton A.; Hersey A.; Velankar S.; Petryszak R.; Hastings J.; Bellis L.; McGlinchey S.; Overington J. P. UniChem: A Unified Chemical Structure Cross-Referencing and Identifier Tracking System. J. Cheminf. 2013, 5, 3–11. 10.1186/1758-2946-5-3. [DOI] [PMC free article] [PubMed] [Google Scholar]
- Chambers J.; Davies M.; Gaulton A.; Papadatos G.; Hersey A.; Overington J. P. UniChem: extension of InChI-based compound mapping to salt, connectivity and stereochemistry layers. J. Cheminf. 2014, 6, 43–52. 10.1186/s13321-014-0043-5. [DOI] [PMC free article] [PubMed] [Google Scholar]
- Lapinsh M.; Prusis P.; Gutcaits A.; Lundstedt T.; Wikberg J. E. Development of Proteo-Chemometrics: A Novel Technology for the Analysis of Drug-Receptor Interactions. Biochim. Biophys. Acta, Gen. Subj. 2001, 1525, 180–190. 10.1016/S0304-4165(00)00187-2. [DOI] [PubMed] [Google Scholar]
- van Westen G. J.; Wegner J. K.; Ijzerman A. P.; van Vlijmen H. W.; Bender A. Proteochemometric modeling as a tool to design selective compounds and for extrapolating to novel targets. Med. MedChemComm 2011, 2, 16–30. 10.1039/C0MD00165A. [DOI] [Google Scholar]
- van Westen G. J.; Swier R. F.; Wegner J. K.; Ijzerman A. P.; van Vlijmen H. W.; Bender A. Benchmarking of protein descriptor sets in proteochemometric modeling (part 1): comparative study of 13 amino acid descriptor sets. J. Cheminf. 2013, 5, 41–51. 10.1186/1758-2946-5-41. [DOI] [PMC free article] [PubMed] [Google Scholar]
- Lapinsh M.; Prusis P.; Lundstedt T.; Wikberg J. E. S. Proteochemometrics Modeling of the Interaction of Amine G-Protein Coupled Receptors with a Diverse Set of Ligands. Mol. Pharmacol. 2002, 61, 1465–1475. 10.1124/mol.61.6.1465. [DOI] [PubMed] [Google Scholar]
- Prusis P.; Lapins M.; Yahorava S.; Petrovska R.; Niyomrattanakit P.; Katzenmeier G.; Wikberg J. E. S. Proteochemometrics Analysis of Substrate Interactions with Dengue Virus NS3 Proteases. Bioorg. Med. Chem. 2008, 16, 9369–9377. 10.1016/j.bmc.2008.08.081. [DOI] [PubMed] [Google Scholar]
- Lapins M.; Wikberg J. E. Kinome-Wide Interaction Modelling Using Alignment-Based and Alignment-Independent Approaches for Kinase Description and Linear and Non-Linear Data Analysis Techniques. BMC Bioinf. 2010, 11, 339. 10.1186/1471-2105-11-339. [DOI] [PMC free article] [PubMed] [Google Scholar]
- van Westen G. J. P.; van den Hoven O. O.; van der Pijl R.; Mulder-Krieger T.; de Vries H.; Wegner J. K.; Ijzerman A. P.; van Vlijmen H. W. T.; Bender A. Identifying Novel Adenosine Receptor Ligands by Simultaneous Proteochemometric Modeling of Rat and Human Bioactivity Data. J. Med. Chem. 2012, 55, 7010–7020. 10.1021/jm3003069. [DOI] [PubMed] [Google Scholar]
- De Bruyn T.; van Westen G. J.; Ijzerman A. P.; Stieger B.; de Witte P.; Augustijns P. F.; Annaert P. P. Structure-based identification of OATP1B1/3 inhibitors. Mol. Pharmacol. 2013, 83, 1257–1267. 10.1124/mol.112.084152. [DOI] [PubMed] [Google Scholar]
- van Westen G. J. P.; Hendriks A.; Wegner J. K.; Ijzerman A. P.; van Vlijmen H. W. T.; Bender A. Significantly Improved HIV Inhibitor Efficacy Prediction Employing Proteochemometric Models Generated from Antivirogram Data. PLoS Comput. Biol. 2013, 9, e1002899. 10.1371/journal.pcbi.1002899. [DOI] [PMC free article] [PubMed] [Google Scholar]
- Subramanian V.; Prusis P.; Pietilä L. O.; Xhaard H.; Wohlfahrt G. Visually interpretable models of kinase selectivity related features derived from field-based proteochemometrics. J. Chem. Inf. Model. 2013, 53, 3021–3030. 10.1021/ci400369z. [DOI] [PubMed] [Google Scholar]
- Schürer S. C.; Muskal S. M. Kinome-Wide Activity Modeling from Diverse Public High-Quality Data Sets. J. Chem. Inf. Model. 2013, 53, 27–38. 10.1021/ci300403k. [DOI] [PMC free article] [PubMed] [Google Scholar]
- Van Westen G. J.; Gaulton A.; Overington J. P. Chemical, target, and bioactive properties of allosteric modulation. PLoS Comput. Biol. 2014, 10, e1003559. 10.1371/journal.pcbi.1003559. [DOI] [PMC free article] [PubMed] [Google Scholar]
- Huang D.; Zhou T.; Lafleur K.; Nevado C.; Caflisch A. Kinase Selectivity Potential for Inhibitors Targeting the ATP Binding Site: A Network Analysis. Bioinformatics 2010, 26, 198–204. 10.1093/bioinformatics/btp650. [DOI] [PubMed] [Google Scholar]
- Sandberg M.; Eriksson L.; Jonsson J.; Sjöström M.; Wold S. New Chemical Descriptors Relevant for the Design of Biologically Active Peptides. A Multivariate Characterization of 87 Amino Acids. J. Med. Chem. 1998, 41, 2481–2491. 10.1021/jm9700575. [DOI] [PubMed] [Google Scholar]
- Rogers D.; Hahn M. Extended-Connectivity Fingerprints. J. Chem. Inf. Model. 2010, 50, 742–754. 10.1021/ci100050t. [DOI] [PubMed] [Google Scholar]
- R Development core team. R: A Language and Environment for Statistical Computing; 2013.
- Breiman L. Random Forests. Machine Learning. 2001, 45, 5–32. 10.1023/A:1010933404324. [DOI] [Google Scholar]
- http://cran.r-project.org/web/packages/foreach/foreach.pdf (accessed 11/10/2015).
- Chartier M.; Chénard T.; Barker J.; Najmanovich R. Kinome Render: A Stand-Alone and Web-Accessible Tool to Annotate the Human Protein Kinome Tree. PeerJ 2013, 1, e126. 10.7717/peerj.126. [DOI] [PMC free article] [PubMed] [Google Scholar]
- Zabludoff S. D.; Deng C.; Grondine M. R.; Sheehy A. M.; Ashwell S.; Caleb B. L.; Green S.; Haye H. R.; Horn C. L.; Janetka J. W.; Liu D.; Mouchet E.; Ready S.; Rosenthal J. L.; Queva C.; Schwartz G. K.; Taylor K. J.; Tse A. N.; Walker G. E.; White A. M. AZD7762, a Novel Checkpoint Kinase Inhibitor, Drives Checkpoint Abrogation and Potentiates DNA-Targeted Therapies. Mol. Cancer Ther. 2008, 7, 2955–2966. 10.1158/1535-7163.MCT-08-0492. [DOI] [PubMed] [Google Scholar]
- Landau H. J.; McNeely S. C.; Nair J. S.; Comenzo R. L.; Asai T.; Friedman H.; Jhanwar S. C.; Nimer S. D.; Schwartz G. K. The Checkpoint Kinase Inhibitor AZD7762 Potentiates Chemotherapy-Induced Apoptosis of p53-Mutated Multiple Myeloma Cells. Mol. Cancer Ther. 2012, 11, 1781–1788. 10.1158/1535-7163.MCT-11-0949. [DOI] [PubMed] [Google Scholar]
- Galkin A. V.; Melnick J. S.; Kim S.; Hood T. L.; Li N.; Li L.; Xia G.; Steensma R.; Chopiuk G.; Jiang J.; Wan Y.; Ding P.; Liu Y.; Sun F.; Schultz P. G.; Gray N. S.; Warmuth M. Identification of NVP-TAE684, a Potent, Selective, and Efficacious Inhibitor of NPM-ALK. Proc. Natl. Acad. Sci. U. S. A. 2007, 104, 270–275. 10.1073/pnas.0609412103. [DOI] [PMC free article] [PubMed] [Google Scholar]
- Zhang J.; Deng X.; Choi H. G.; Alessi D. R.; Gray N. S. Characterization of TAE684 as a potent LRRK2 kinase inhibitor. Bioorg. Med. Chem. Lett. 2012, 22, 1864–1869. 10.1016/j.bmcl.2012.01.084. [DOI] [PMC free article] [PubMed] [Google Scholar]
- Northrup A. B.; Katcher M. H.; Altman M. D.; Chenard M.; Daniels M. H.; Deshmukh S. V.; Falcone D.; Guerin D. J.; Hatch H.; Li C.; Lu W.; Lutterbach B.; Allison T. J.; Patel S. B.; Reilly J. F.; Reutershan M.; Rickert K. W.; Rosenstein C.; Soisson S. M.; Szewczak A. A.; Walker D.; Wilson K.; Young J. R.; Pan B.-S.; Dinsmore C. J. Discovery of 1-[3-(1-Methyl-1H-Pyrazol-4-Yl)-5-Oxo-5H-benzo[4,5]cyclohepta[1,2-B]pyridin-7-Yl]-N-(pyridin-2-Ylmethyl)methanesulfonamide (MK-8033): A Specific c-Met/Ron Dual Kinase Inhibitor with Preferential Affinity for the Activated State of c-Met. J. Med. Chem. 2013, 56, 2294–2310. 10.1021/jm301619u. [DOI] [PubMed] [Google Scholar]
- Angell R. M.; Atkinson F. L.; Brown M. J.; Chuang T. T.; Christopher J. A.; Cichy-Knight M.; Dunn A. K.; Hightower K. E.; Malkakorpi S.; Musgrave J. R.; Neu M.; Rowland P.; Shea R. L.; Smith J. L.; Somers D. O.; Thomas S. A.; Thompson G.; Wang R. N-(3-Cyano-4,5,6,7-tetrahydro-1-benzothien-2-yl)amides as potent, selective, inhibitors of JNK2 and JNK3. Bioorg. Med. Chem. Lett. 2007, 17, 1296–1301. 10.1016/j.bmcl.2006.12.003. [DOI] [PubMed] [Google Scholar]
- Han Y.; Caday C. G.; Umezawa K.; Nanda A. Preferential Inhibition of Glioblastoma Cells with Wild-Type Epidermal Growth Factor Receptors by a Novel Tyrosine Kinase Inhibitor Ethyl-2,5-Dihydroxycinnamate. Oncol. Res. 1997, 9, 581–587. [PubMed] [Google Scholar]
- Carboni S.; Hiver A.; Szyndralewiez C.; Gaillard P.; Gotteland J.-P.; Vitte P.-A. AS601245 (1,3-Benzothiazol-2-Yl (2-[[2-(3-Pyridinyl) Ethyl] Amino]-4 Pyrimidinyl) Acetonitrile): A c-Jun NH2-Terminal Protein Kinase Inhibitor with Neuroprotective Properties. J. Pharmacol. Exp. Ther. 2004, 310, 25–32. 10.1124/jpet.103.064246. [DOI] [PubMed] [Google Scholar]
- Bhat R.; Xue Y.; Berg S.; Hellberg S.; Ormö M.; Nilsson Y.; Radesäter A.-C.; Jerning E.; Markgren P.-O.; Borgegård T.; Nylöf M.; Giménez-Cassina A.; Hernández F.; Lucas J. J.; Díaz-Nido J.; Avila J. Structural Insights and Biological Effects of Glycogen Synthase Kinase 3-Specific Inhibitor AR-A014418. J. Biol. Chem. 2003, 278, 45937–45945. 10.1074/jbc.M306268200. [DOI] [PubMed] [Google Scholar]
- Koeberle S. C.; Romir J.; Fischer S.; Koeberle A.; Schattel V.; Albrecht W.; Grütter C.; Werz O.; Rauh D.; Stehle T.; Laufer S. A. Skepinone-L is a selective p38 mitogen-activated protein kinase inhibitor. Nat. Chem. Biol. 2011, 8, 141–143. 10.1038/nchembio.761. [DOI] [PubMed] [Google Scholar]
- Young P. R.; McLaughlin M. M.; Kumar S.; Kassis S.; Doyle M. L.; McNulty D.; Gallagher T. F.; Fisher S.; McDonnell P. C.; Carr S. A.; Huddleston M. J.; Seibel G.; Porter T. G.; Livi G. P.; Adams J. L.; Lee J. C. Pyridinyl Imidazole Inhibitors of p38 Mitogen-Activated Protein Kinase Bind in the ATP Site. J. Biol. Chem. 1997, 272, 12116–12121. 10.1074/jbc.272.18.12116. [DOI] [PubMed] [Google Scholar]
- Chen H.; Chan B. K.; Drummond J.; Estrada A. A.; Gunzner-Toste J.; Liu X.; Liu Y.; Moffat J.; Shore D.; Sweeney Z. K.; Tran T.; Wang S.; Zhao G.; Zhu H.; Burdick D. J. Discovery of selective LRRK2 inhibitors guided by computational analysis and molecular modeling. J. Med. Chem. 2012, 55, 5536–5545. 10.1021/jm300452p. [DOI] [PubMed] [Google Scholar]
- Choi H. G.; Zhang J.; Deng X.; Hatcher J. M.; Patricelli M. P.; Zhao Z.; Alessi D. R.; Gray N. S. Brain Penetrant LRRK2 Inhibitor. ACS Med. Chem. Lett. 2012, 3, 658–662. 10.1021/ml300123a. [DOI] [PMC free article] [PubMed] [Google Scholar]
- Kelly L. M.; Yu J.-C.; Boulton C. L.; Apatira M.; Li J.; Sullivan C. M.; Williams I.; Amaral S. M.; Curley D. P.; Duclos N.; Neuberg D.; Scarborough R. M.; Pandey A.; Hollenbach S.; Abe K.; Lokker N. A.; Gilliland D. G.; Giese N. A. CT53518, a Novel Selective FLT3 Antagonist for the Treatment of Acute Myelogenous Leukemia (AML). Cancer Cell 2002, 1, 421–432. 10.1016/S1535-6108(02)00070-3. [DOI] [PubMed] [Google Scholar]
- Fan Q. W.; Weiss W. A. Isoform specific inhibitors of PI3 kinase in glioma. Cell Cycle 2006, 5, 2301–2305. 10.4161/cc.5.20.3362. [DOI] [PubMed] [Google Scholar]
- Lindsley C. W.; Zhao Z.; Leister W. H.; Robinson R. G.; Barnett S. F.; Defeo-Jones D.; Jones R. E.; Hartman G. D.; Huff J. R.; Huber H. E.; Duggan M. E. Allosteric Akt (PKB) inhibitors: discovery and SAR of isozyme selective inhibitors. Bioorg. Med. Chem. Lett. 2005, 15, 761–764. 10.1016/j.bmcl.2004.11.011. [DOI] [PubMed] [Google Scholar]
- Sutherland J. J.; Gao C.; Cahya S.; Vieth M. What General Conclusions Can We Draw from Kinase Profiling Data Sets?. Biochim. Biophys. Acta, Proteins Proteomics 2013, 1834, 1425–1433. 10.1016/j.bbapap.2012.12.023. [DOI] [PubMed] [Google Scholar]
- Metz J. T.; Johnson E. F.; Soni N. B.; Merta P. J.; Kifle L.; Hajduk P. J. Navigating the kinome. Nat. Chem. Biol. 2011, 7, 200–202. 10.1038/nchembio.530. [DOI] [PubMed] [Google Scholar]
- Tropsha A. Best practices for QSAR development, Validation, and Exploration. Mol. Inf. 2010, 29, 476–488. 10.1002/minf.201000061. [DOI] [PubMed] [Google Scholar]
- Kalliokoski T.; Kramer C.; Vulpetti A.; Gedeck P. Comparability of Mixed IC50 Data - a Statistical Analysis. PLoS One 2013, 8, e61007. 10.1371/journal.pone.0061007. [DOI] [PMC free article] [PubMed] [Google Scholar]
- Bemis G. W.; Murcko M. A. The Properties of Known Drugs. 1. Molecular Frameworks. J. Med. Chem. 1996, 39, 2887–2893. 10.1021/jm9602928. [DOI] [PubMed] [Google Scholar]
- Tetko I. V.; Tanchuk V. Y.; Kasheva T. N.; Villa A. E. Estimation of Aqueous Solubility of Chemical Compounds Using E-State Indices. J. Chem. Inf. Comput. Sci. 2001, 41, 1488–1493. 10.1021/ci000392t. [DOI] [PubMed] [Google Scholar]
- Kyte J.; Doolittle R. F. A Simple Method for Displaying the Hydropathic Character of a Protein. J. Mol. Biol. 1982, 157, 105–132. 10.1016/0022-2836(82)90515-0. [DOI] [PubMed] [Google Scholar]
- Kornev A. P.; Haste N. M.; Taylor S. S.; Eyck L. F. Surface comparison of active and inactive protein kinases identifies a conserved activation mechanism. Proc. Natl. Acad. Sci. U. S. A. 2006, 103, 17783–17788. 10.1073/pnas.0607656103. [DOI] [PMC free article] [PubMed] [Google Scholar]
- Kornev A. P.; Taylor S. S.; Ten Eyck L. F. A Helix Scaffold for the Assembly of Active Protein Kinases. Proc. Natl. Acad. Sci. U. S. A. 2008, 105, 14377–14382. 10.1073/pnas.0807988105. [DOI] [PMC free article] [PubMed] [Google Scholar]
- Taylor S. S.; Kornev A. P. Protein Kinases: Evolution of Dynamic Regulatory Proteins. Trends Biochem. Sci. 2011, 36, 65–77. 10.1016/j.tibs.2010.09.006. [DOI] [PMC free article] [PubMed] [Google Scholar]
- van Westen G. J.; Swier R. F.; Cortes-Ciriano I.; Wegner J. K.; Overington J. P.; Ijzerman A. P.; van Vlijmen H. W.; Bender A. Benchmarking of protein descriptor sets in proteochemometric modeling (part 2): modeling performance of 13 amino acid descriptor sets. J. Cheminf. 2013, 5, 42–62. 10.1186/1758-2946-5-42. [DOI] [PMC free article] [PubMed] [Google Scholar]
- ftp://ftp.ebi.ac.uk/pub/databases/chembl/KinasesPublication/.
- Rudolf A. F.; Skovgaard T.; Knapp S.; Jensen L. J.; Berthelsen J. A Comparison of Protein Kinases Inhibitor Screening Methods Using Both Enzymatic Activity and Binding Affinity Determination. PLoS One 2014, 9, e98800. 10.1371/journal.pone.0098800. [DOI] [PMC free article] [PubMed] [Google Scholar]
- LeCun Y.; Bengio Y.; Hinton G. Deep learning. Nature 2015, 521, 436–444. 10.1038/nature14539. [DOI] [PubMed] [Google Scholar]
Associated Data
This section collects any data citations, data availability statements, or supplementary materials included in this article.