Abstract
Purpose
Methods for direct visualization of compact bone using MRI have application in several ‘MR-informed’ technologies, such as MR-guided focused ultrasound, MR-PET reconstruction and MR-guided radiation therapy. The specificity of bone imaging can be improved by manipulating image sensitivity to Bloch relaxation phenomena, facilitating distinction of bone from other tissues detected by MRI.
Methods
From Bloch equation dynamics, excitation pulses suitable for creating specific sensitivity to short-T2 magnetization from cortical bone are identified. These pulses are used with UTE subtraction demonstrate feasibility of MR imaging of compact bone with positive contrast.
Results
MR images of bone structures are acquired with contrast similar to that observed in x-ray CT images. Through comparison of MR signal intensities with CT Hounsfield units of the skull, the similarity of contrast is quantified. The MR technique is also demonstrated in other regions of the body that are relevant for interventional procedures, such as the shoulder, pelvis and leg.
Conclusion
Matching RF excitation pulses to relaxation rates improves the specificity to bone of short-T2 contrast. It is demonstrated with a UTE sequence to acquire images of cortical bone with positive contrast, and the contrast is verified by comparison with x-ray CT.
Keywords: Bone MRI, MR-Guided Focused Ultrasound Planning, MR Image-Guided Radiation Therapy, MR/PET Attenuation Correction, Ultrashort Echo Time, Zero Echo Time
Introduction
Techniques for imaging a wide range of anatomy with good contrast have made magnetic resonance (MR) imaging a valuable tool in many aspects of clinical practice. The development and maturation both of MR imaging-guided interventional procedures, such as MR-guided focused ultrasound (MRgFUS) (1, 2) and image-guided radiation therapy (IGRT) (3), and of multi-modal imaging technologies, such as MR/PET, has heightened interest in making bone visible in MRI. The attenuation correction (AC) step of MR/PET reconstruction and the planning steps of MRgFUS procedures (4) and IGRT (5) all require knowledge of bone structure and composition. To this end, ‘ultra-short echo time’ (6) and ‘zero-echo time’ (ZTE) (7, 8) imaging methods have been explored for acquiring MR bone images (9–11), since a salient feature of cortical bone is very short T2 relaxation time (10, 12). Accordingly, one common approach to bone MRI is estimation of T2 and classification from the estimate (4, 13). Another strategy is suppression of long-T2 signals so that image contrast is specific to short-T2 anatomy (10, 14). Strategies that distinguish bone from other anatomy by proton density—rather than T2—have also been demonstrated (11).
An example use of bone imaging is in MRgFUS procedures targeting bone metastases. These procedures currently use previously-acquired CT images registered to MR images acquired on the treatment day for evaluation of bone integrity. This registration can be difficult because the CT and MR images are often acquired with the patient in different positions. In addition, the CT images may be acquired weeks in advance, so they may no longer accurately depict tumor size or bone integrity. As such, an integrated in-place, ‘day-of’ imaging technique available from MR may improve image guidance. MRI also does not use ionizing radiation, so if substituted for CT its use in bone imaging avoids radiation dose.
A central challenge in using UTE- or ZTE-type pulse sequences is developing adequate contrast (15, 16). A number of approaches have been proposed, generally relying upon acquisition of multiple echo images at different time-delays following an excitation RF pulse (17) or upon using preparation pulses to condition the longitudinal magnetization prior to excitation for image acquisition (14, 18). The latter strategy is suitable for ZTE sequences (19–21).
Here a method capable of creating or augmenting relaxation-parameter contrast that is compatible with UTE imaging techniques is presented. By selecting RF excitation pulse parameters to manipulate the extent of concurrent relaxation and excitation (22), a method for altering relaxation-dependence of contrast is introduced. Then, independently of or in concert with other sequence specifications such as tip angle or echo time, it is possible to adjust the excitation pulse dimensions to match a particular T2 relaxation rate, and thereby to improve short-T2 contrast.
The purpose of this work is to demonstrate the relaxation-matched excitation technique in phantoms and in vivo using a multi-echo UTE pulse sequence with parameters selected to create short-T2 (or short-) contrast from the excitation. When used with UTE echo subtraction, this augments the contrast otherwise available and enables specific depiction of bone with positive contrast relative to soft tissue. With simple normalization for proton density included, it potentially also distinguishes compact bone from cancellous bone with image intensity. When these relations are exploited to develop short-T2 contrast and are applied in conjunction with UTE echo subtraction, the acquired images can be made to give CT-like contrast, i.e. to have a signal intensity pattern apparently indicative of bone compactness, possibly by being sensitized to calcification. The demonstrated contrast in bone can be validated by direct comparison to x-ray CT, which is done here by retrospective registration and resolution-matching of CT data available from the same subjects scanned by MR. With its suitability for enabling in vivo UTE bone imaging shown here, incorporating this technique with MR-integrated imaging technologies and interventional procedures, such as MR/PET or MRgFUS, can improve guidance, simplify work ow and reduce radiation dose.
Theory
MRI uses a strong longitudinal (z) magnetic field B0 to establish magnetization and resonance ω0 = γB0. In the Bloch description, a radiofrequency (RF) pulse applied at the resonance tips longitudinally-aligned (along-z) magnetization into the transverse (x, y) plane. Magnetization always undergoes decay within the x, y plane (T2 relaxation) and recovery to the z axis (T1 relaxation). When local field perturbations (ΔB0) exist, e.g., from susceptibility differences or chemical shielding, the resonance frequency is proportionately shifted (Δω0 = γΔB0). From these dynamics pulse sequences that manipulate the number, intensity and timing of pulses can be used to induce signal dependence upon Bloch parameters. This is a widely-used strategy for generating tissue contrast in MR images (23). For example the echo time (TE) can be shifted to create T2 contrast, a common strategy for creating short-T2 sensitivity (17). To analyze the effect of pulse timing upon contrast, pulses are typically conceptualized as occurring instantaneously, with relaxation, rotation and precession applied independently (23–26).
In the particular case of UTE sequences, it can arise that relaxation and RF rotation effects are not accurately considered as independent from the perspective of describing image contrast. However, UTE-type pulse sequences often are implemented with maximum-power, short-duration RF excitations, which for most clinical systems renders intra-excitation relaxation insignificant (27).
Echo shifting
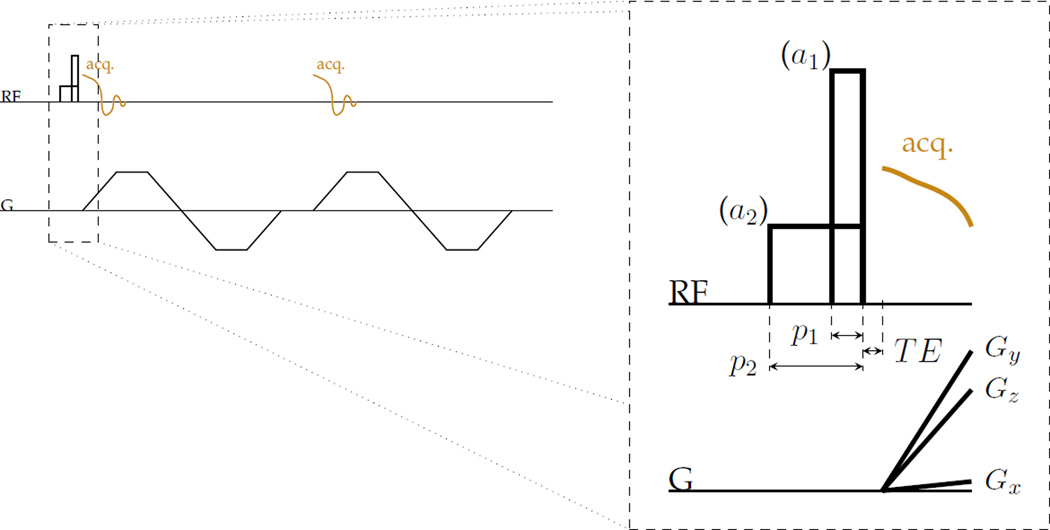
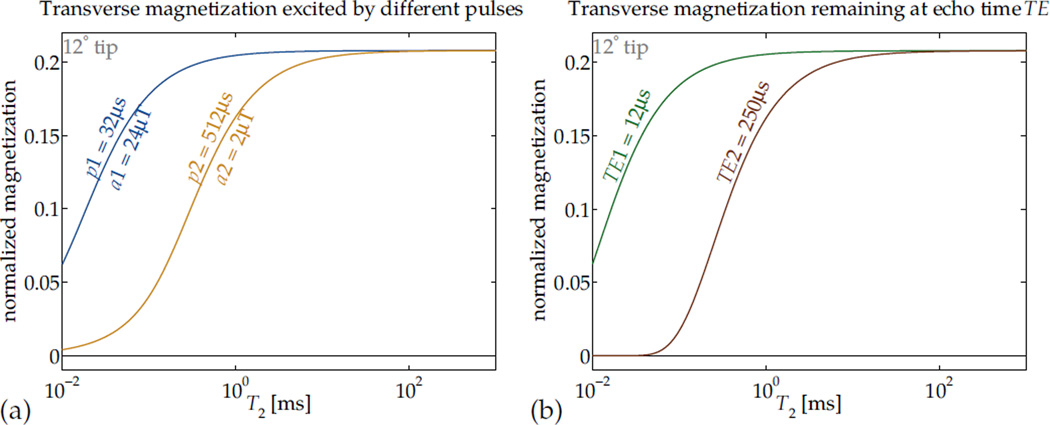
The T2 relaxation phenomenon always decreases Mxy, exponentially in time with time-constant T2 = 1/R2, so that at any time t after excitation Mxy has been reduced proportionally by e−R2T. Thus if one image is acquired at the echo time TE (Fig. 1) and another at a shifted echo time TE + ΔTE, a difference between the two images will be weighted by T2 sensitivity e−R2ΔTE(1−e−R2ΔTE). The selection of TE and ΔTE can allow a ‘band-selective’ sensitivity in T2 (Fig. 2a).
Figure 1.
RF hard pulses designed with different durations and equal area effect different T2-selectivity of excitation to transverse magnetization Mxy without significantly changing other contrast. This strategy can be used with, for instance, a UTE-type sequence to manipulate T2 contrast without changing echo times. For example, two different pulses can be used for excitation in a three-dimensional centre-out radial imaging sequence that collects two gradient echoes have amplitudes a1 and a2 and durations p1 and p2 that are proportionate such that the area of the pulses are equal.
Figure 2.
Relaxation that occurs during RF pulses can affect contrast (a). In this application, RF hard pulses with different durations and equal area can be used to effect differing short-T2-selectivity of excitation to transverse magnetization Mxy.
By analogy, in many imaging sequences, the echo time TE effectively imposes a ‘T2 selectivity’ or T2 contrast upon the image, such that magnetizations with short values of T2 contribute very little signal (b, assuming perfect excitation). Manipulation of contrast by matching RF pulse dimensions to particular relaxation rates can be used independently or in concert with TE selection.
RF Pulses
Beyond setting the tip angle α in designing excitation pulses, the pulse duration p and amplitude a (Fig. 1) can also be selected to manipulate relaxation-dependence in the image contrast. For any particular α, if p (equivalently, a) is selected to balance the competing effects of relaxation and excitation, the nutation can be made selective in T2 (Fig. 2). This is the mechanism central to design of T2-selective preparation pulses (14, 28, 29). Its effect can be seen as analogous to that of changing TE to alter T2 contrast (Fig. 2).
Generally, the selectivity of some particular pulse parameters can be mapped by computing Mxy from Bloch simulation with a discrete time-step (zero-order hold) approximation, for which the closed-form solution to each time-step is formulated. For some sequences, the solutions can be ‘layered’ for each time-step and the calculus carried through to find closed-form expressions for the relationships between relaxation parameters and magnetization amplitudes (30–32). Detailed descriptions of the general relations governing these computations are provided in an appendix.
A specific circumstance of interest is an excitation pulse of amplitude B1 = ω1/γ generated perpendicularly to a relaxing magnetization for some non-zero duration, which describes a hard pulse applied on resonance. In this case there are only two relevant dimensions, so the system matrix of the Bloch equation is
The matrix A is diagonalizable as A = VΛV−1, with V orthogonal and Λ = diag(λ+, λ−) diagonal. The eigenvalues are
A simple derivation is included in the appendix. As the ‘time-evolution operator’ for the time period is etA = VetΛV−1, it is the discriminant of the eigenvalues expression that indicates whether the excitation (B1) can overcome relaxation (R1 and R2). If the eigenvalues have an imaginary component, the system is ‘under-damped’, and it is possible to nutate the magnetization without destroying it. Therefore the condition for significantly exciting magnetization in the presence of relaxation effects is
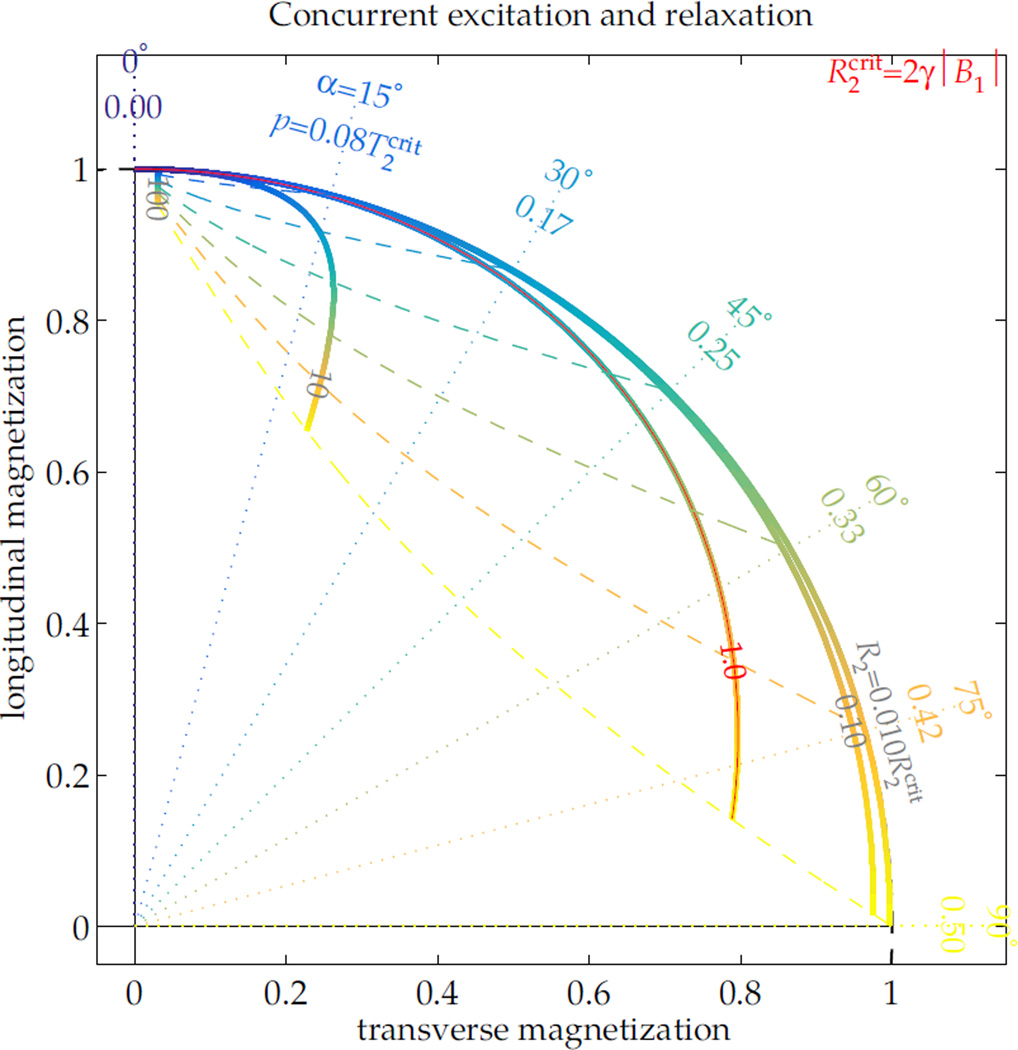
This condition can explain a scenario of particular interest. During excitation without appreciable T1 relaxation, the ‘critical’ transverse relaxation rate is is —i.e. magnetization relaxing faster than this will ultimately be driven to 0. Thus, if magnetization experiences non-negligible relaxation during the excitation pulse, the RF pulse effect is not purely a rotation, but rather the pulse also modifies the magnetization amplitude (Fig. 3). The ‘efficiency’ of an excitation pulse, Mxy/sin(α) for Mxy immediately following the pulse, will then vary depending upon T2 and α. For example, a 1 ms 90° RF pulse yields only 45% excitation from a 0.5 ms-T2 magnetization. A 90° pulse can be performed in less than 1 ms on many clinical systems, but even a minimum-duration pulse with of 20 μT yields only 76% of the expected signal from the magnetization, which relaxes faster than the critical rate of 0.59 ms. A fuller illustration of excitation and relaxation dynamics is included as supporting information, which describes the full range of nutation with T2 relaxation (Sup. Fig. S1). This facilitates calculation of efficacy for excitation (Sup. Fig. S2), saturation (Sup. Fig. S3) and inversion (Sup. Fig. S4), which can be used to design pulse amplitudes or summarize their effects without implementation of Bloch simulations.
Figure 3.
During RF excitation, if there is no R1 relaxation or off-resonance, the ratio of R2 to dictates the excitation dynamic. With a constant applied RF field B1 and no off-resonance, the excitation is specified by its pulse duration p or nominal excitation angle α = γB1p. Its effect upon magnetization varies over the range of relative R2 (thick lines). As the excitation proceeds to longer durations for higher tip angles (blue → yellow gradient), short-T2 magnetization ceases to increase its transverse component. For all tip angles, the final orientations of magnetization across the range of R2 (dashed lines tracing the range over R2) can differ greatly from the nominal excitation angle (dotted lines).
On this principle, the pulse duration p can be adjusted to match the desired T2-sensitivity and thereby manipulate T2 contrast. For a particular nominal tip α—which is the net pulse 7 area scaled by γ—in the case of T1 ≫T2, the critical T2 scales linearly with the pulse duration: . If the desired T2 contrast is signal from only longer-T2 magnetization, the pulse duration p can be chosen to give a T2-cutoff below the desired range. Images acquired of magnetization excited by this pulse with a broadly T2-sensitive sequence, such as UTE, will then show the desired contrast.
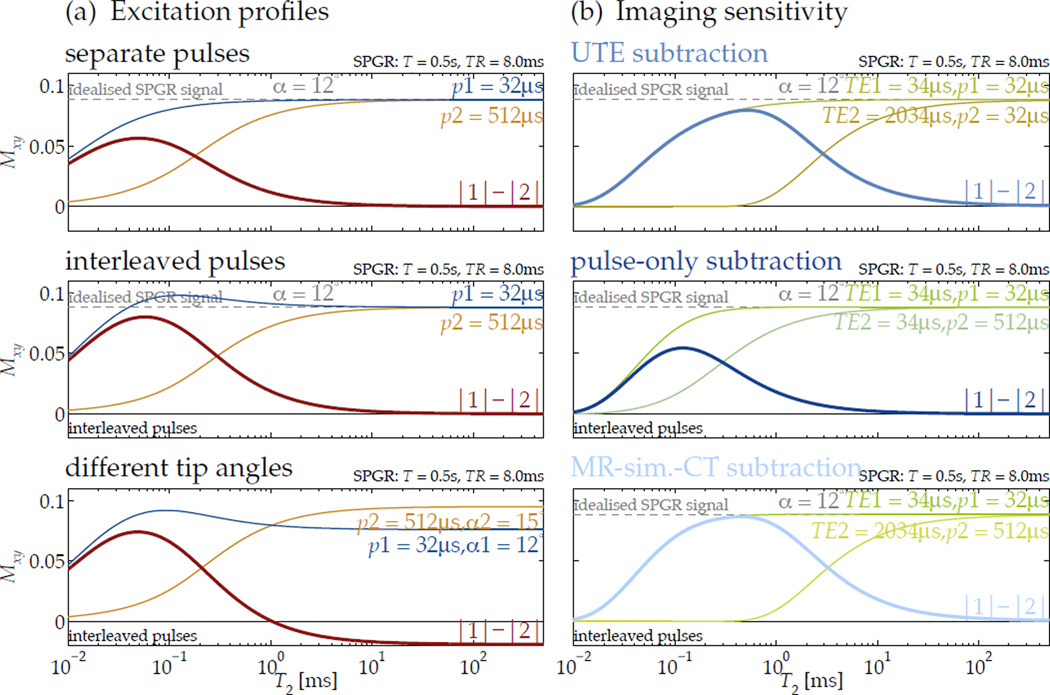
If signal only from magnetization within a specific range of T2 is desired, two durations p1 and p2 may be chosen so that the sensitivity transitions bracket the range of interest (Fig. 4a). Then two images can be acquired—one using each pulse, but otherwise formed with the same imaging parameters—that have differing T2 sensitivity. By computing a difference image, a specific T2-contrast that positively highlights spins relaxing with a chosen range of T2 values can be created.
Figure 4.
Controlling excitation T2 selectivity by relaxation-matching pulse dimensions can be used to create sensitivity in the steady state of a spoiled gradient echo (SPGR) sequence (here, for 0.5 s T1 in SPGR with 8 ms TR). The difference in excitation profiles for two different pulses highlights a specific range of T2 (a, top). If the pulses are alternated to allow interleaved image encodes, the steady-state T2 profiles are altered slightly, with a some added emphasis of short-T2 magnetization (a, middle). When the alternate pulses also tip to different angles, the difference profile creates heightened short-T2 sensitivity and ‘inverted’ longer-T2 signal (a, bottom).
For imaging, the sensitivity profiles created by subtracting images acquired at different echo times but with only one pulse rate (b, top) or with different pulse rates but at the same echo time (b, middle) are shaped differently from that of the proposed subtraction (b, bottom).
Acquisition interleaving
As a practical matter, because imaging times for three-dimensional (3D) UTE sequences can be relatively long, subtraction of images can become sensitive to motion between acquisitions. An effective strategy for mitigating motion artifacts is interleaving of the encodes for each acquisition—e.g., pulse A, encode 1A – pulse B, encode 1B – pulse A, encode 2A – etc. This alters slightly the steady-state for each image, but the effect may be beneficial and can be considered another mode of contrast manipulation. Specifically, for short-T2 imaging this effect is salutary since it gives added emphasis to short-T2 magnetization (Fig. 4a) by producing a longer effective TR for it.
A further degree of exibility can be realized by using two pulses with slightly different tip angles together to further shape the sensitivity profile. For example, to highlight short-T2 structures and suppress long-T2 ones, an imaging sequence can be assembled that alternates between exciting to some tip angle α using a high B1 amplitude and some slightly larger tip angle α + δα using a low B1 amplitude (Fig. 4a). Depending upon RF system fidelity, this may occur unintentionally. The short-T2 magnetization remains emphasized and has positive difference, but long-T2 magnetization has negative difference. This can improve robustness for thresholding classification of long- and short-T2 components. In addition, these techniques are compatible with contrast manipulation by echo time, and offer a complementary method of shaping the T2 sensitivity (Fig. 4b). For in vivo imaging, this complementarity is leveraged to create compact bone-specific sensitivity.
Other phenomena
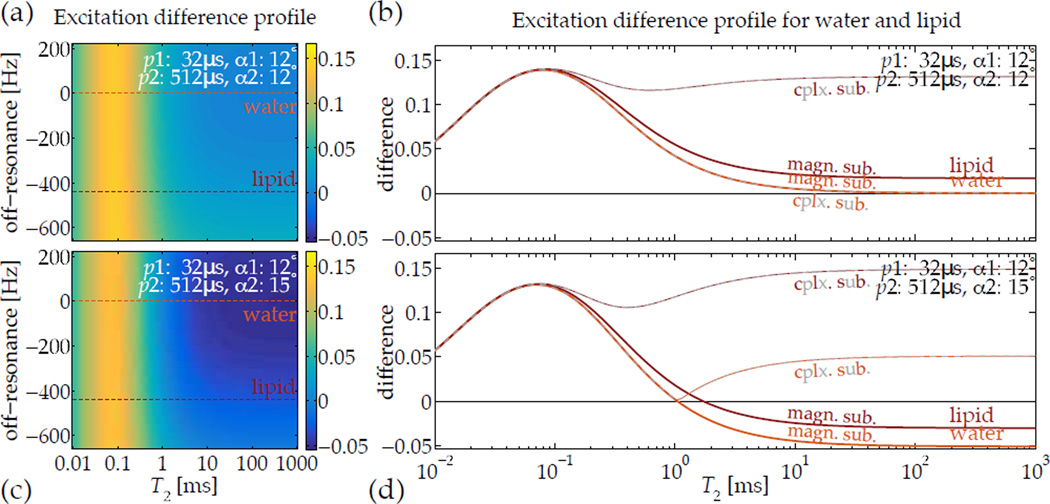
An obvious potential confound to assumption of on-resonance excitation is any local field-deviation or off-resonance Δω0. Generally, off-resonance will diminish the ‘tip’ effect of any single RF pulse, but its impact upon magnetization can differ according to T2. A short-T2 magnetization has a different spectral response than a long-T2 magnetization has, so the bandwidth of all excitation pulses must be broad enough to accommodate both, or any difference image will also be sensitized to Δω0. For some specific cases, such as creation of short-T2 contrast, the biologically relevant ranges of off-resonance are tolerated without additional compensation (Fig. 5). However, as field strength increases and typical off-resonance cycle periods become shorter, the range of T2 values that can be distinguished is diminished.
Figure 5.
Images acquired after excitation by relaxation-matched pulses can be subtracted to highlight a specific range of T2, but off-resonance precession occuring during the RF pulse can confound the subtraction. For short-T2-specific UTE imaging, however, typical ranges of off-resonance expected in vivo—e.g., lipids precessing 3.5 ppm away from water at 3 T field-strength—are compatible with normal tip angles (a,b), and the difference between the magnetization excited by the pulses is relatively invariant with off-resonance. Additionally, when using a slightly higher tip angle with the ‘slow’ pulse, the improved robustness in differentiating short-T2 signals from longer ones is retained across the normal range of off-resonance (c,d). Computing complex instead of magnitude subtractions—i.e. |1 − 2| instead of |1| − |2|—introduces significant positive sensitivity to off-resonance-induced phase accrual, which is not the desired contrast.
An additional factor in image intensity is the amount of available magnetization. When using multiple pulses and images to create particular relaxation sensitivity, a ‘raw’ difference |1| − |2| is intrinsically weighted also by the steady-state magnetization strength. As the steady state amplitude is strongly dependent upon proton density, a normalized difference (|1| − |2|)/(|1| + |2|) image can relieve such intensity biases. In all subtractions, magnitude images (rather than complex images) are used to avoid introducing sensitivity to phase accrued during the excitation. A complex subtraction is highly sensitive to off-resonant magnetization.
Methods
Validation of the relaxation-selectivity in excitation concept was performed by MR imaging experiments with excitation pulses chosen according to the described dynamics. Amplitude and width specifications were applied to the excitation tip pulse of a 3D UTE-style sequence (Fig. 1).
RF pulses
Two excitation pulses were specified with durations of 40 µs and 256 µs for 15° tip to image phantoms. The slower pulse fully excites (within 5% of max.) magnetization having T2 longer than 2.5 ms, so a difference image is sensitized to T2 values below 2 ms.
In vivo compact bone is expected to have significant populations of magnetization with T2 values of approximately 0.1 ms and 0.4 ms, and also to have some additional populations having 1ms and greater values (10, 12). Therefore pulse-widths of 32 µs and 512 µs were used, creating a wide difference profile around the cortical bone T2 range (Fig. 4).
In both phantom and in vivo imaging, the tip angle and duration of the short pulse were constrained to use the nominal maximum B1 provided by the scanner.
The T2 excitation profiles over a range of Δω0 were also calculated by Bloch simulation to verify that over the expected range of off-resonance the selected short-T2 contrast would not be altered (Fig. 5). In this case, for example, at 450 Hz off-resonance for lipids at 3 T, the off-resonance cycle period is still long enough relative to the pulse durations that this effect does not confound.
Sequence and processing
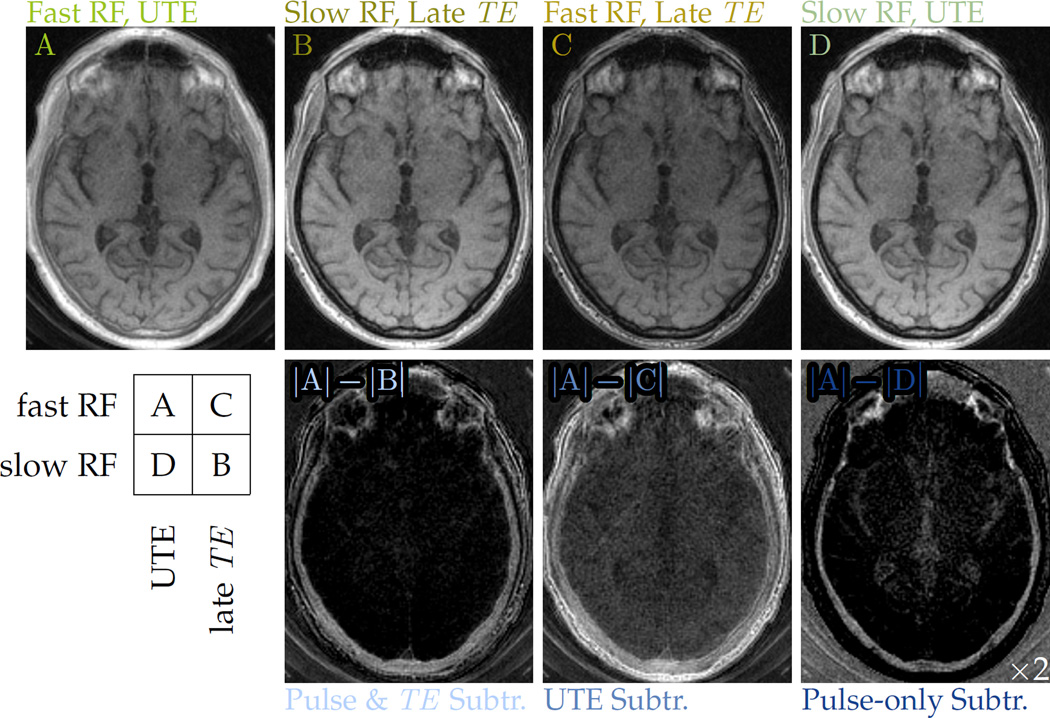
For phantom and in vivo imaging, two sets of images were acquired with different pulse durations but otherwise identical sequence parameters. The echo times for in vivo datasets were also paired to the excitation pulse, so that after the fast pulse a short TE is used (image set ‘A’), and after the slow pulse a longer TE is used (‘B’). For further insight into the MR contrast, additional MR images pairing the fast pulse with a longer TE (‘C’) and the slow pulse with a short TE (‘D’) were also collected. A conventional method for highlighting short-T2 components is to change only the TE and form a ‘UTE subtraction’ difference image—i.e. to use A and C for subtraction (15). The sensitivity profile in difference images formed with these alternatives are biased differently (Fig. 4b). A 3D gradient-echo UTE sequence with facility for specifying excitation durations independently of tip angle and capability of interleaving encodings was used for acquisitions (Fig. 1).
Difference images formed from A and B, C or D are all generally sensitized to short-T2 signals. Subtractions of B from A are relatively specific to cortical bone signals, which UTE subtraction (A–C difference images) are not, and also have broad sensitivity to the cortical bone T2 range, which pulse-only (A–D) differences do not (Fig. 4b). If UTE subtraction were performed with a much shorter second echo time, the result would be similar to the pulse-only subtraction (Fig. 2). Image intensities are also strongly dependent upon proton density. Cortical bone has a low proton density (13), so normalization mitigates this image intensity ‘bias’. Computing normalized differences with A and B creates ‘MR-simulated-CT’ (MR-sim.-CT) images then with intensities indicative of cortical bone content, as in the range of T2 targeted, the portion of signal attributable to short-T2 is expected to correlate with bone mineral density (33).
To gauge the similarity of information provided by x-ray CT and by MR-sim.-CT, MR head images were acquired of patients from whom CT datasets were available. Scans were performed with informed consent. The CT scans were acquired at 140 kVp with 0.49 mm×0.49 mm in-plane resolution on a clinical scanner (GE Lightspeed VCT), and images were reconstructed using the ‘Medium’ filter and ‘Bone’ or ‘Bone Plus’ convolution kernels. The acquisition slice thickness was 1.25 mm for subject 1 (75 y/o male) and 0.65 mm for subject 2 (86 y/o male).
To facilitate a voxel-wise comparison between MR image intensity and CT Hounsfield units (HU), the CT volumes were registered and downsampled by bilinear rigid transformation to match the MR-simulated-CT image volumes using the Matlab image registration tool-box. The registration is only performed for comparison purposes, and it is not necessary if directly using the MR images for MRgFUS planning or for MR/PET AC. However, for voxel-wise comparison, it is critical that the registration be accurate. Therefore, for intensity comparison, regions of interest were drawn in several slices over a posterior section of the skull deemed by visual inspection to have good registration, since achieving a registration correct for each voxel in the head is challenging. The posterior of the head tends to be better registered because during each scan it is the best-immobilized region; its SNR in MRI is higher due to its relative proximity to the coil; and in the MR scan it is closest to iso-center, where gradient non-linearity distortion is least severe. Within this well-registered region, a subset of voxels were also identified by visual inspection as cortical or medullary bone. These were used to form class-wise comparison of intensities in compact and cancellous bone for investigating the feasibility of performing more complex bone classification with either modality.
Phantom imaging
Sequence parameters for phantom imaging were 3D isotropic 25 cm FOV, 1.25 mm resolution, 15° tip, 9 ms repetition, 40 µs echo, 4.2 min scan time. A 1.5 T clinical scanner (GE Signa Excite) was used for acquisition with a body transmit coil and a receive-only eight-channel head array (MRI Devices Corporation, ‘8ch High Resolution Brain Array (Receive Only)’) A phantom proof of principle was performed using water bottle phantoms containing a solution doped with manganese-chloride (MnCl2) to varying concentration (Fig. 6), which induces differing T1 and T2 properties (34). The phantoms were filled with 26.0, 13.0, 6.51, 3.26, 2.18, 1.64, 1.31, 0.665 and 0.275 mM MnCl2, creating (T2, T1) values of (0.500,5.18), (1.00,10.3), (2.00,20.6), (4.00,41.0), (6.00,61.1), (8.00,81.0), (10.0,100), (20.0,195) and (50.0,449) ms respectively. Image acquisitions for each tip pulse were interleaved, theoretically eliciting the ‘pulse-only’ contrast profile for imaging sensitivity (Fig. 4).
Figure 6.
Short-T2 contrast can be generated in short-TE images by adjusting the pulse duration p and maintaining constant tip angle α in a gradient spoiled sequence (TE=40 µs, TR=9 ms, α=15°). Phantoms comprised of water doped with different concentrations of MnCl2 to have differing T2 will give differing signal intensities in a gradient-spoiled acquisition (red: T2 values, yellow: intensity windowing). The T1 value also changes as the concentration of MnCl2 is changed; the relative intensities in different bottles therefore varies, as in any GRE sequence.
In vivo imaging
In vivo imaging was conducted with 28 cm FOV, 1.14 mm resolution, 12° tip, 8 ms repetition, 34 µs/2.034 ms echoes, 12 min scan time using a 3 T clinical scanner (GE Discovery MR750); transmit and receive coils were chosen according to anatomy scanned. UTE subtraction at 3 T typically uses a later echo time not shorter than 2 ms to allow lipid rephasing. Receive arrays with spatial sensitivity extent of approximately 28 cm or smaller in any direction were chosen.
Imaging was performed in the head, upper torso, pelvis and leg. The body transmit coil was used in all cases except the leg. Head images were acquired from an eight-channel head array (Invivo Corporation, ‘HD 8Ch HiRes BRAIN ARRAY’); torso images from an eight-channel shoulder coil (NeoCoil, ‘HD 3.0T 8Ch Receive Only Shoulder Coil’); pelvic images from a six-channel, two-piece ‘ex’ array coil (GE Medical Systems, ‘3.0T GE 6-Channel Phased Array Flex Coil’); and leg images from an eight-channel knee coil (Invivo Corporation, ‘3T HD T/R KNEE ARRAY’).
Acquisitions were encoded as a 3D isotropic volume and reconstructed in the axial orientation. For shoulder, pelvic and leg images, a 3D multi-planar reformat (MPR) was used to find orientations aligned with the bones of interest. In all in vivo acquisitions, image encodings for each tip pulse were interleaved to avoid motion artifacts in a difference image.
Results
Phantom imaging
Experiments with MnCl2-doped water bottle phantoms demonstrate that the proposed manipulation of relaxation-parameter contrast by matching the excitation pulse dimensions to relaxation is feasible (Fig. 6). When imaged with a ‘fast’ excitation pulse, all phantoms give relatively strong signal; however, when excited by a ‘slow’ pulse, the short-T2 phantoms are excited to a lesser degree, while the moderate- and longer-T2 phantoms do not give significantly different responses. For short-T2 signals, the intensity difference can be significant even for very small changes in excitation pulse duration, as is evident from a difference image.
In vivo imaging
The modified T2 sensitivity afforded by relaxation-matched pulses gives good specificity for bone imaging. In head imaging, the fast pulse with UTE (Fig. 7, ‘A’) creates nearly full excitation and detects all anatomy including the skull, but the soft tissue signal is much stronger primarily due to its larger equilibrium magnetization. However, the slower-pulse image acquired at a later echo time (Fig. 7, ‘B’) selectively avoids excitation and reception of signals from the skull bone, so that a subtraction (Fig. 7, ‘|A| – |B|’) clearly reveals the skull form and suppresses longer-T2 structures. As compared to UTE subtraction (Fig. 7, ‘|A| – |C|’), the A–B difference is much more specific to bone signals. It also captures more signal from bone than does the pulse-only difference image (Fig. 7, ‘|A| – |D|’).
Figure 7.
Various pairings of fast (24.47 μT) and slow (1.53 μT) excitation pulses with UTE (34 µs) and later (2.0 ms) echo times modulate the imaging T2 sensitivity. The A–B difference image more specifically depicts cortical bone than does the conventional UTE subtraction, A–C difference image. It is also more broadly sensitive to the various components of compact bone than the pulse-rate subtraction, A–D difference image, for which the display intensity window is narrowed by half and then shifted lower by 10%
The A–B difference image still retains proton-density weighting. The normalized difference MR-sim.-CT images (Fig. 8) show intensity enhancement patterns similar to those observed in x-ray CT, which in CT images are interpreted as distinguishing between cortical compact bone and medullary spongy bone. Additionally, the bone signals are detected with positive contrast, while the air does not give bright signal, which is often a challenge for methods that identify bone from inverted image intensity or absence of signal. Some elements from the coil housing and padding inserted for patient comfort are also highlighted in the difference image. These can be removed by a signal mask formed from the ‘slow’ image, but masking was not performed in some images to allow comparison of the bone with the air.
Figure 8.
Pairing a fast excitation pulse with UTE (A: 24.47 μT RF, 34 µs TE) and a slow excitation pulse with a later echo (B: 1.53 μT RF, 2 ms TE) sensitizes the magnitude difference image to short-T2 signals. Normalizing the difference removes proton density weighting and allows clear depiction of the skull in MR head imaging. Contrast in the normalized difference MR-sim.-CT images resembles that of x-ray CT images (e) acquired from the same subject.
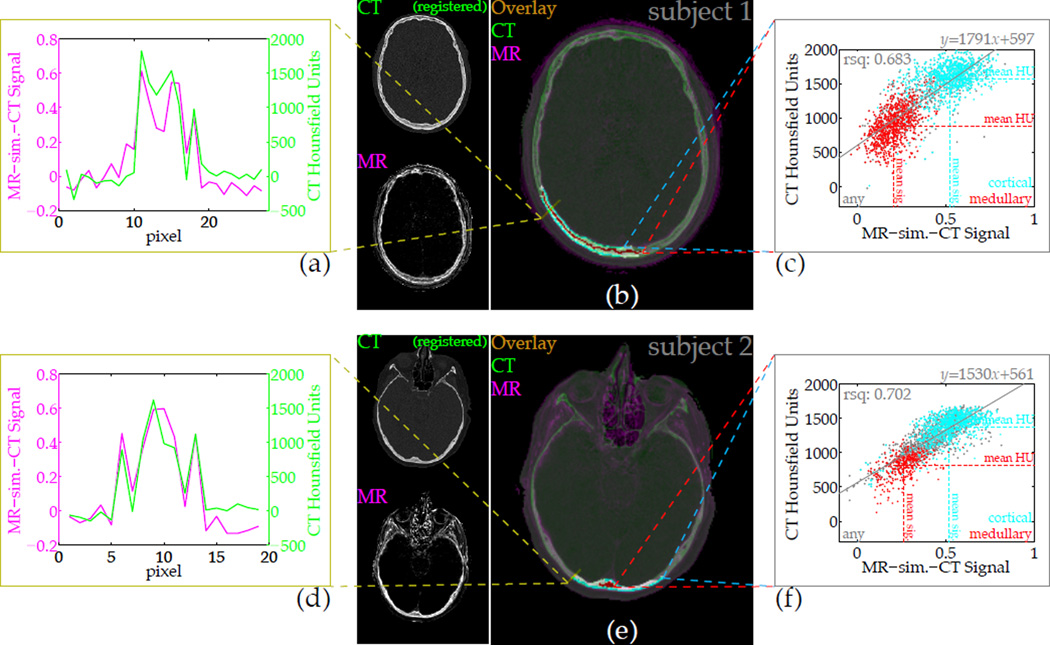
With a CT volume registered to the MR images, a voxel-wise comparison of the MR difference signal intensity against the CT Hounsfield units demonstrates the similarity of contrast (Fig. 9). The registration was not accurate everywhere in the head, but a portion of the posterior region was adequately successful to allow signal comparison. The cross section shows tracking of intensities between the two data sets, and a scatter plot for all bone from the delineated regions of interest illustrates the correlation between the parameters. For one subject the sample correlation between MR-sim.-CT intensity and CT HU is 0.683 (1737 samples), and for the other it is 0.702 (1710 samples). Bone can be distinguished from soft tissue according to the MR difference intensity. Furthermore, the sub-classification of bone types indicates that the cortex regions of the skull bone tend to have both high MR-sim.-CT signal and high HU, while the medullary regions tend to have low signal and low HU.
Figure 9.
The CT-likeness of contrast in the difference images can be quantified by direct comparison of intensities. After registration and resolution downsampling, a slice from the CT volume overlaid on the MR image depicts the similarity of bone contrast (b,e), and a cross-section plot of amplitudes further demonstrates the correspondence (a,d). Voxel-wise correlation of intensities depends heavily on the quality of registration, but over a large region (b,e: highlighted) selected through several slices, the normalized difference or ‘MR-sim.-CT’ signal correlates strongly with the x-ray CT Hounsfield units (c,f). Sub-classification of different bone types within the well-registered region are shown, but the signal correlation is formed over all voxels within the region.
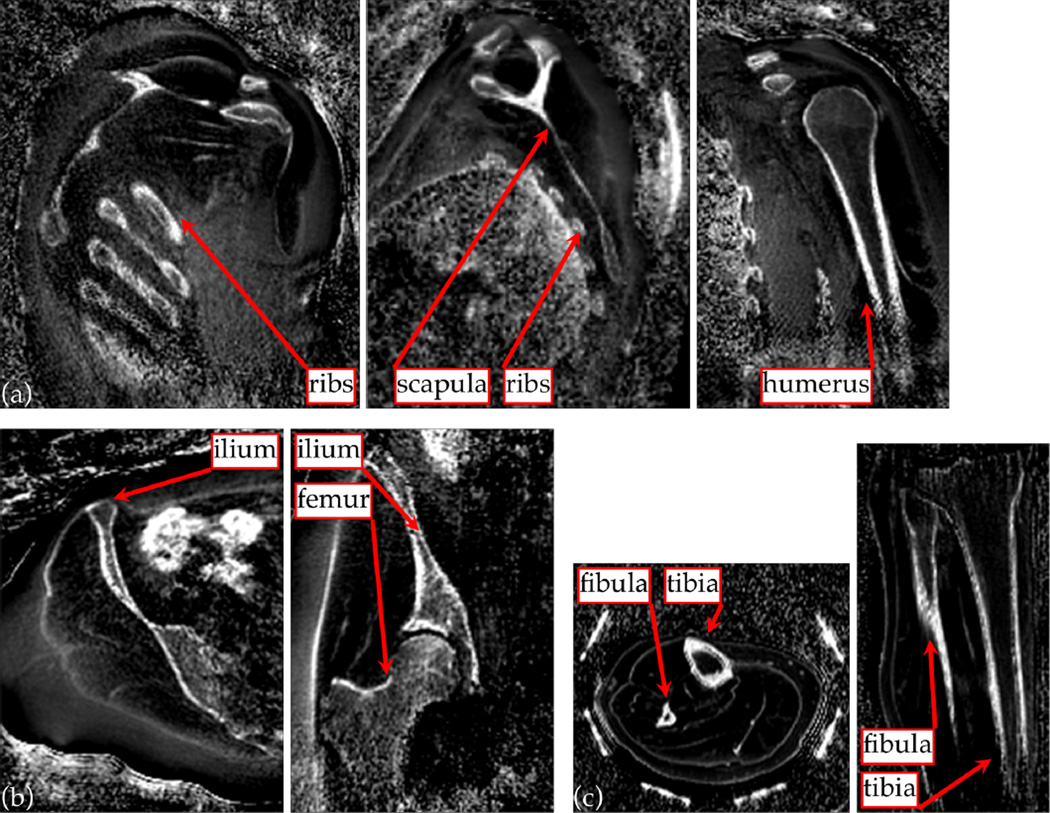
The MR imaging method can be applied to other anatomy also (Fig. 10). Imaging the upper torso reveals bone structures from the shoulder, with hyper-intense signal from dense bone in the humerus, ribs and scapula in particular. In the pelvic region, the ilium and femur are well visualized by the fast/slow RF difference image. The bowel, which can contain gas or stool, also shows bright intensity, as the images are sensitized to the large off-resonance arising from susceptibility changes. An image volume from the lower leg also clearly shows the tibia and fibula.
Figure 10.
The short-T2-specific UTE protocol as used for skull imaging can also be applied to depict bone structures in other anatomy. 3D MPR images from the upper torso (a) clearly show bones of the ribs, the scapula and humerus; and images of the pelvic region (b) show the iliac and femoral structures. These anatomy are of interest to MRgFUS treatments of liver and of uterine fibroids. Imaging the lower leg (c) gives clear depiction of the fibula and tibia.
Discussion
The basic principle of relaxation-rate matching RF excitation pulse dimensions to manipulate contrast has been demonstrated here using a UTE sequence for a short-T2 imaging application. Images showing positive contrast in short-T2 cortical bone have been created, demonstrating the principle.
The manipulation is premised upon linear response of the RF system; however, this can be challenging to ensure. In particular, it is assumed that the amplitude and duration of the applied RF field can be controlled in a known manner for all of the excitations. For example, with two pulses (similar to Fig. 1), it would be assumed that halving the amplitude and doubling the duration of one pulse can be done accurately so as to maintain equal area with the other. Typically there is good fidelity in duration of a pulse. It can occur, though, that the stronger pulse pushes the RF amplifier into saturation, while the other pulse does not, so that their net areas are not equal. In the context of short-T2 imaging, this is not troublesome because the result is effectively a larger tip angle for the slower pulse, which creates negative long-T2 signal in a subtraction image (Fig. 4a). In other applications, though, it may be necessary to calibrate and correct for such behavior, either by amplitude pre-emphasis or using full characterization.
Matching excitation to a relaxation rate is relatively simple to achieve for RF hard pulses, but it can be more complicated for shaped pulses, for example those used in slice selection. Here, spatial localization has been achieved using limited receive coil sensitivity extent. The localization can alternatively be achieved using a transmit coil with limited sensitivity extent. However, it may be impractical to find a set of coils with the desired extent and to position them suitably.
Another potentially important consideration is the effect of off-resonance upon the excitation response. To avoid mixing sensitivity to local field changes with the relaxation-parameter dependence, all the applied pulses must elicit a similar spectral response over the range of frequency shifts present in the sample. This means the narrowest-bandwidth pulse should have bandwidth wider than the off-resonance spectrum of the sample. Since the relaxation and spectral response are not independent, it can be impractical to manipulate intermediate-and longer-T2 or -T1 sensitivity in this way. Therefore possible adaptation to tendon or ligament imaging may not be straightforward, but it is not a challenge for the bone imaging applications presented here.
Manipulation of the T2-relaxation sensitivity profiles performs well for in vivo imaging of bone structures. It may be the relaxation phenomenon being exploited is actually , but for the ranges of interest and strengths of RF fields available as standard, it is not practical to make a distinction unless the rates differ by multiple orders of magnitude. The mechanism by which compact bone gives hyper-intense signal in an image specifically sensitized to short-T2 is not known definitively. Results from NMR studies of bone indicate that collagen-bound water has short T2 (12); and that the proportion of collagen-bound water in a sample correlates with the peak stress and yield stress of the sample, and these quantities correlate with the bone mineral density (33). So in more compact bone, the T2 spectrum may be expected to shift into the region of T2 sensitivity targeted by this technique, thereby enhancing its signal.
Relatively high correlation between the MR-sim.-CT signal and CT HU was shown (Fig. 9), but the correlation depends heavily upon registration accuracy. While bone composition varies across subjects, the outer regions of the skull tend to be comprised of compact bone, and the middle portion is often spongy bone. The similarity of MR-sim.-CT signal amplitudes and CT HU in sub-regions drawn from visual identifications of bone types indicates that beyond classification of ‘bone’ and ‘not bone’, it is also possible to make richer classification of bone types using either parameter. For some cases (e.g., Fig. 9, subject 2) and some applications, a two-class model for bone may still be overly reductive—as may be a linear fit—but generally the MR-sim.-CT images provide similar information to the x-ray CT images. This indicates the MR images can provide information that is useful to MR-guided interventional procedures. For example, they may improve MRI-based phase selection for MRgFUS brain treatments, since the skull composition can dramatically affect ultrasound phase aberrations. Additionally, during planning for MRgFUS bone metastasis treatments they may help to assess the integrity of the bone cortex.
This method develops positive contrast from cortical bone primarily by sensitization to short-T2 signals. However, anatomy other than bone can also show real or apparent short T2. For example, interfaces with air or gas create rapid signal decay, as noted near the bowel. Additionally, if images are acquired at echo times such that relative phase between lipid and water resonances differs, intra-voxel dephasing in heterogeneous voxels can mimic T2 decay. Other methods for sensitizing MR image intensity to bone compactness, such as inverse proton-density-weighted ZTE acquired images, can be confounded by and require correction for spatial variation in transmit or receive sensitivity (11). Varying sensitivity is not a severe complication for this technique because the same variations weight all acquired images, so normalization of the subtraction effectively removes the unwanted intensity weighting imposed if such variation exists.
Conclusion
A mechanism for introducing relaxation-parameter-specific contrast into images by matching the RF excitation pulse dimensions to a particular relaxation rate has been described. The technique uses the Bloch equation to choose amplitudes and durations for the excitation pulse that can balance the competing relaxation and excitation phenomena. Applied in conjuction with echo time-shifting, this facilitates specification of a UTE pulse sequence capable of making short-T2-specific images that clearly depict bone structures with positive contrast in vivo. The excitation pulses have been demonstrated with UTE imaging.
Imaging of cortical bone with MR has traditionally been challenging because the magnetization from hydrogen atoms in compact bone experiences much faster transversal relaxation than other tissues in the body, and the available magnetization is relatively low owing to reduced proton density. A UTE imaging sequence can specifically sensitize images to the T2 spectrum of compact bone by applying relaxation-matched excitation pulses and acquiring multiple echoes. From this, with a simple normalization for proton-density weighting, MR images showing positive contrast from cortical bone can be generated. The contrast in skull imaging is validated by comparison with x-ray CT of the same subjects, and demonstrations imaging other anatomy show similar bone contrast. MR bone images can be of particular utility to several MR-dependent technologies. For example they may provide attenuation-correction information to MR/PET reconstructions; or they can be used for treatment planning in MR-guided radiation therapy or MRgFUS procedures.
Supplementary Material
Acknowledgments
This work was supported by NIH P01 CA159992 and P41 EB015891 and by GE Medical Systems.
Appendix
Section A
The way that pulse shape affects relaxation parameter-dependence of image contrast can be explained by following the dynamics of the Bloch equation. At any point in time τ, the Bloch equation describing the dynamics of a magnetization vector m = (mx, my, mz) in the presence of a magnetic field B(τ) = (Bx(τ), By(τ), Bz(τ)) is
where the precession-frequency for each axis is ωx,y,z(τ) = γBx,y,z(τ), and the longitudinal-and transverse-relaxation rates are R1 = 1/T1 and R2 = 1/T2 (presumed unchanging). If the magnetic field amplitude is constant during some time period t, then the Bloch equation has an explicit solution relating the magnetization afterward m(0 + t) to the preceding magnetization m(0) in terms of the ‘system matrices’ A and b during the period:
The solution can describe dynamics under a time-varying magnetic field B(τ) by approximating the scenario as several short-duration time-intervals between a set of time-points {ti : ti = τi − τi−1} with corresponding non-time-varying field amplitudes {B(τ0), B(τ1), …, B(τn−1)} exist. Commonly, uniform intervals are used, i.e. t1 = ⋯ = tn. This is a good representation of the digital-to-analogue conversion by commercial MRI machines.
Consequent of the discrete approximation, the system matrices b and Ai = A(τi−1) for each interval i ∈ {1, …, n} can be formed and the corresponding solutions successively applied to compute the effect of a sequence B(τ) on an initial magnetization m(0). This sequence of operations effected by b and the collection of Ai can be summarized by the ‘sequence system matrices’
in which case m(τn) = Cm(0) + d.
The effect of applying an amplitude-adjusted RF pulse in a steady-state sequence can also be calculated from the Bloch solution matrices. With C and d summarizing the sequence of operations over a full repetition starting and ending at the signal echo time, the steady-state magnetization vector is computed as
and the signal is identified as the x and y components of this magnetization vector.
Section B
The set of eigenvalues {λ} and eigenvectors {v} of a matrix A are defined as those satisfying the equation (λI − A)v = 0. Assuming existence, this means that the eigenvalues satisfy det(λI−A) = 0. In the case of an on-resonant hard pulse applied in the presence of significant relaxation, the Bloch system matrix is
The polynomial equation specifying the eigenvalues is then
The quadratic equation solution expresses the eigenvalues:
References
- 1.Martin E, Jeanmonod D, Morel A, Zadicario E, Werner B. High-intensity focused ultrasound for noninvasive functional neurosurgery. Annals of neurology. 2009;66:858–861. doi: 10.1002/ana.21801. [DOI] [PubMed] [Google Scholar]
- 2.McDannold N, Clement G, Black P, Jolesz F, Hynynen K. Transcranial MRI-guided focused ultrasound surgery of brain tumors: Initial findings in three patients. Neurosurgery. 2010;66:323. doi: 10.1227/01.NEU.0000360379.95800.2F. [DOI] [PMC free article] [PubMed] [Google Scholar]
- 3.Raaymakers B, Lagendijk J, Overweg J, Kok J, Raaijmakers A, Kerkhof E, van der Put R, Meijsing I, Crijns S, Benedosso F, et al. Integrating a 1.5 T MRI scanner with a 6 MV accelerator: proof of concept. Physics in medicine and biology. 2009;54:N229. doi: 10.1088/0031-9155/54/12/N01. [DOI] [PubMed] [Google Scholar]
- 4.Vyas U, Kaye E, Pauly KB. Transcranial phase aberration correction using beam simulations and MR-ARFI. Medical physics. 2014;41:032901. doi: 10.1118/1.4865778. [DOI] [PMC free article] [PubMed] [Google Scholar]
- 5.Johansson A, Karlsson M, Nyholm T. CT substitute derived from MRI sequences with ultrashort echo time. Medical physics. 2011;38:2708–2714. doi: 10.1118/1.3578928. [DOI] [PubMed] [Google Scholar]
- 6.Bergin C, Pauly J, Macovski A. Lung parenchyma: projection reconstruction MR imaging. Radiology. 1991;179:777–781. doi: 10.1148/radiology.179.3.2027991. [DOI] [PubMed] [Google Scholar]
- 7.Hafner S. Fast imaging in liquids and solids with the back-projection low angle shot (BLAST) technique. Magnetic resonance imaging. 1994;12:1047–1051. doi: 10.1016/0730-725x(94)91236-p. [DOI] [PubMed] [Google Scholar]
- 8.Madio DP, Lowe IJ. Ultra-fast imaging using low ip angles and FIDs. Magnetic Resonance in Medicine. 1995;34:525–529. doi: 10.1002/mrm.1910340407. [DOI] [PubMed] [Google Scholar]
- 9.Krug R, Larson PEZ, Wang C, Burghardt AJ, Kelley DA, Link TM, Zhang X, Vigneron DB, Majumdar S. Ultrashort echo time MRI of cortical bone at 7 Tesla field strength: a feasibility study. Journal of Magnetic Resonance Imaging. 2011;34:691–695. doi: 10.1002/jmri.22648. [DOI] [PMC free article] [PubMed] [Google Scholar]
- 10.Du J, Carl M, Bydder M, Takahashi A, Chung CB, Bydder GM. Qualitative and quantitative ultrashort echo time (UTE) imaging of cortical bone. Journal of Magnetic Resonance. 2010;207:304–311. doi: 10.1016/j.jmr.2010.09.013. [DOI] [PubMed] [Google Scholar]
- 11.Wiesinger F, Sacolick LI, Menini A, Kaushik SS, Ahn S, VeitHaibach P, Delso G, Shanbhag DD. Zero TE MR bone imaging in the head. Magnetic Resonance in Medicine. 2015 doi: 10.1002/mrm.25545. [DOI] [PubMed] [Google Scholar]
- 12.Horch RA, Nyman JS, Gochberg DF, Dortch RD, Does MD. Characterization of 1H NMR signal in human cortical bone for magnetic resonance imaging. Magnetic Resonance in Medicine. 2010;64:680–687. doi: 10.1002/mrm.22459. [DOI] [PMC free article] [PubMed] [Google Scholar]
- 13.Keereman V, Fierens Y, Broux T, Deene YD, Lonneux M, Vandenberghe S. MRI-based attenuation correction for PET/MRI using ultrashort echo time sequences. The Journal of Nuclear Medicine. 2010;51:812–818. doi: 10.2967/jnumed.109.065425. [DOI] [PubMed] [Google Scholar]
- 14.Larson PEZ, Conolly SM, Pauly JM, Nishimura DG. Using adiabatic inversion pulses for long-T2 suppression in ultrashort echo time (UTE) imaging. Magnetic Resonance in Medicine. 2007;58:952–961. doi: 10.1002/mrm.21341. [DOI] [PMC free article] [PubMed] [Google Scholar]
- 15.Robson MD, Gatehouse PD, Bydder M, Bydder GM. Magnetic resonance: An introduction to ultrashort TE (UTE) imaging. Journal of Computer Assisted Tomography. 2003;27:825–846. doi: 10.1097/00004728-200311000-00001. [DOI] [PubMed] [Google Scholar]
- 16.Weiger M, Pruessmann K. MRI with zero echo time. eMagRes. 2012;1 [Google Scholar]
- 17.Rahmer J, Blume U, Börnert P. Selective 3D ultrashort TE imaging: comparison of dual-echo acquisition and magnetization preparation for improving short-T2 contrast. Magnetic Resonance Materials in Physics, Biology and Medicine. 2007;20:83–92. doi: 10.1007/s10334-007-0070-6. [DOI] [PubMed] [Google Scholar]
- 18.Larson PEZ, Gurney PT, Nayak K, Gold GE, Pauly JM, Nishimura DG. Designing long-T2 suppression pulses for ultrashort echo time imaging. Magnetic Resonance in Medicine. 2006;56:94–103. doi: 10.1002/mrm.20926. [DOI] [PMC free article] [PubMed] [Google Scholar]
- 19.Weiger M, Brunner DO, Wyss M, Dietrich BE, Wilm BJ, Pruessmann KP. Proceedings of International Society for Magnetic Resonance in Medicine. Milan, Italy: 2014. ZTE imaging with T1 contrast; p. 4262. [Google Scholar]
- 20.Börnert P, Groen J, Smink J, Nehrke K. Proceedings of International Society for Magnetic Resonance in Medicine. Toronto, Ontario, Canada: 2015. Magnetization prepared ZTE to address multiple diagnostic contrasts; p. 510. [Google Scholar]
- 21.Weiger M, Wu M, Wurnig MC, Kenkel D, Boss A, Andreisek G, Pruessmann KP. ZTE imaging with long-T2 suppression. NMR in Biomedicine. 2015;28:247–254. doi: 10.1002/nbm.3246. [DOI] [PubMed] [Google Scholar]
- 22.Johnson EM, Vyas U, Pauly KB, Pauly JM. Proceedings of International Society for Magnetic Resonance in Medicine. Toronto, Ontario, Canada: 2015. T2-selective excitation with UTE imaging for bone imaging; p. 2436. [Google Scholar]
- 23.Nishimura DG. Principles of magnetic resonance imaging. Stanford University; 1996. [Google Scholar]
- 24.Hennig J. Multiecho imaging sequences with low refocusing ip angles. Journal of Magnetic Resonance (1969) 1988;78:397–407. [Google Scholar]
- 25.Oppelt A, Graumann R, Barfuss H, Fischer H, Hartl W, Schajor W, et al. FISP—a new fast MRI sequence. Electromedica. 1986;54:15–18. [Google Scholar]
- 26.Oshio K, Feinberg DA. Grase (gradient-and spin-echo) imaging: A novel fast MRI technique. Magnetic Resonance in Medicine. 1991;20:344–349. doi: 10.1002/mrm.1910200219. [DOI] [PubMed] [Google Scholar]
- 27.Springer F, Steidle G, Martirosian P, Claussen CD, Schick F. Effects of in-pulse transverse relaxation in 3D ultrashort echo time sequences: analytical derivation, comparison to numerical simulation and experimental application at 3T. Journal of Magnetic Resonance. 2010;206:88–96. doi: 10.1016/j.jmr.2010.06.010. [DOI] [PubMed] [Google Scholar]
- 28.Pauly JM, Conolly SM, Nishimura DG. Magnetic resonance imaging of short T2 species with improved contrast. United States Patent. 1992:5150053. [Google Scholar]
- 29.Gold GE, Pauly JM, Glover GH, Moretto JC, Macovski A, Herfkens RJ. Characterization of atherosclerosis with a 1.5-T imaging system. Journal of Magnetic Resonance Imaging. 1993;3:399–407. doi: 10.1002/jmri.1880030216. [DOI] [PubMed] [Google Scholar]
- 30.Torrey HC. Transient nutations in nuclear magnetic resonance. Phys. Rev. 1949;76:1059–1068. [Google Scholar]
- 31.Sussman MS. PhD thesis. University of Toronto; 1997. Design of Practical T2-Selective RF Excitation (TELEX) Pulses. [DOI] [PubMed] [Google Scholar]
- 32.Carl M, Bydder M, Du J, Takahashi A, Han E. Optimization of RF excitation to maximize signal and T2 contrast of tissues with rapid transverse relaxation. Magnetic resonance in medicine. 2010;64:481–490. doi: 10.1002/mrm.22433. [DOI] [PubMed] [Google Scholar]
- 33.Horch RA, Gochberg DF, Nyman JS, Does MD. Non-invasive predictors of human cortical bone mechanical properties: T2-discriminated H NMR compared with high resolution x-ray. PloS one. 2011;6:e16359. doi: 10.1371/journal.pone.0016359. [DOI] [PMC free article] [PubMed] [Google Scholar]
- 34.Watts J. Mixing manganese chloride. 1996 [Google Scholar]
Associated Data
This section collects any data citations, data availability statements, or supplementary materials included in this article.


