

Summary
Cell cycle control during spermatogenesis is a highly complex process owing to the control of the mitotic expansion of the spermatogonial cell population and following meiosis, induction of DNA breaks during meiosis and the high levels of physiological germ‐cell apoptosis. We set out to study how E2F1, a key controller of cell cycle, apoptosis, and DNA damage responses, functions in the developing and adult testis. We first analyzed the expression pattern of E2f1 during post‐natal testis development using RNA in situ hybridization, which showed a differential expression pattern of E2f1 in the adult and juvenile mouse testes. To study the function of E2f1, we took advantage of the E2F1−/− mouse line, which was back‐crossed to C57Bl/6J genetic background. E2f1 loss led to a severe progressive testicular atrophy beginning at the age of 20 days. Spermatogonial apoptosis during the first wave of spermatogenesis was decreased. However, already in the first wave of spermatogenesis an extensive apoptosis of spermatocytes was observed. In the adult E2F1−/− testes, the atrophy due to loss of spermatocytes was further exacerbated by loss of spermatogonial stem cells. Surprisingly, only subtle changes in global gene expression array profiling were observed in E2F1−/− testis at PND20. To dissect the changes in each testicular cell type, an additional comparative analysis of the array data was performed making use of previously published data on transcriptomes of the individual testicular cell types. Taken together, our data indicate that E2F1 has a differential role during first wave of spermatogenesis and in the adult testis, which emphasizes the complex nature of cell cycle control in the developing testis.
Keywords: apoptosis, cell cycle, E2F1, testis
Introduction
Spermatogenesis is a highly complex process where mitosis, meiosis, and haploid cell differentiation follow each other. Mouse spermatogenesis has the potential to amplify a single undifferentiated spermatogonium to 4096 mature spermatozoa: first through amplification of the spermatogonial population by consecutive mitotic divisions and second by meiotic division that yields four haploid cells for each spermatocyte (Russell et al., 1990). Simultaneous presence of both mitosis and meiosis contribute to the complex nature of cell cycle control within the adult testis. In addition, the somatic testicular cell types such as the supporting Sertoli cells (SCs) and peritubular myoid cells (PTMs) form a large population of proliferating cells in the juvenile testis. Thus, defects in cell cycle control have multifaceted implications in the testis during development.
A key controller of the cell cycle is the E2F1 transcription factor. E2F1 is a member of the eight‐member E2F‐protein‐family that controls cell cycle, apoptosis, DNA damage response, and cell differentiation (for review see (Chen et al., 2009)). Since its discovery, E2F1 has been implicated as a direct target of the retinoblastoma tumor suppressor protein (Helin et al., 1992; Kaelin et al., 1992; Shan et al., 1992). In quiescent cells hypophosphorylated RB binds E2F1 and inhibits E2F‐mediated transcription. When mitogenic signaling permits cell cycle to proceed from G1 to S‐phase, RB is deactivated and releases E2F1. As a result E2F1 activates transcription of genes required for DNA synthesis. In fact, activation of ectopic E2F1 expression is sufficient to induce cell cycle progression in quiescent cells (Johnson et al., 1993).
E2Fs are classified to transcriptional activators (E2F1‐3a) and repressors (E2F3b‐8). This traditional grouping does not appear to apply in vivo, since activator E2Fs in progenitor cells can become transcriptional repressors upon differentiation (Chong et al., 2009). Moreover, E2F1 can act as both an oncogene and a tumor suppressor in vivo depending on the tissue (Yamasaki et al., 1996).
In the adult mouse testis E2F1 protein expression has previously been shown in germ cells from A spermatogonia to zygotene spermatocytes (El‐Darwish et al., 2006). In the human testis, altered E2F1 expression has been shown to be characteristic to testicular carcinoma in situ (CIS; currently referred to as germ‐cell neoplasia in situ, GCNIS), a precursor for testicular germ‐cell cancer (Novotny et al., 2007). Both loss and overexpression of E2f1 led to disruption of spermatogenesis in the mouse (Yamasaki et al., 1996; Agger et al., 2005). In the first reports on the E2f1 knockout phenotype, testicular atrophy was observed from the age of 3 months onwards (Field et al., 1996; Yamasaki et al., 1996).When transgenic overexpression of E2f1 was induced in the adult testis, a rapid increase in apoptosis of spermatocytes was observed and a long exposure to the transgene resulted in accumulation of GCNIS‐like cells and loss of more mature germ cells (Agger et al., 2005). This E2f1‐transgene‐induced apoptosis in the testis was p53‐independent (Holmberg et al., 1998). E2f1 has also been suggested to play a role in Sertoli cell function and cause Sertoli cell apoptosis in the absence of retinoblastoma protein (Nalam et al., 2009).
Despite these reports the mechanism of E2F1 action in the different testicular cell types during post‐natal testis development remains elusive. In the present study, we addressed the expression pattern and function of E2f1 in adult and juvenile mouse testes. E2F1−/− animals were backcrossed to C57Bl/6J‐strain which led to an exacerbation of the previously reported testicular atrophy associated with E2F1 loss. This atrophy was the consequence of a biphasic germ‐cell loss: first by apoptosis of meiotic cells and second by a gradual exhaustion of the spermatogonial stem cells. E2F1 did not appear to have role in the function of the somatic cells during testis development.
Materials and Methods
Animal husbandry
Animals were housed under environmentally controlled conditions (12 h light/12 h darkness; temperature, 21 ± 1°C) in the animal facility of the University of Turku. They were fed mouse chow SDS RM‐3 (Special Diet Service, E, Soy‐free, Whitman, Essex, UK) and tap water ad libitum. All procedures were carried out according to the institutional and ethical policies of the University of Turku and approved by the local ethics committee on animal experimentation. The E2f‐1−/− mice B6;129S4‐E2f1tm1Meg/J (Field et al., 1996; Yamasaki et al., 1996) were purchased from the Jackson Laboratory. C57BI/6J control animals were obtained from the breeding stocks of the Central Animal Laboratory of the University of Turku. The E2F1−/− animals were cross‐bred with the C57BI/6‐mice for eight consecutive generations to obtain a uniform genetic background. Age and litter‐matched controls were used when possible.
Fertility test
At the ages of 3 and 5 months E2F1+/+ and E2F1−/− males (n = 3–4) were bred with four different C57Bl/6J females. The animals were mated and on the following day the presence of a copulative plug was observed. In the absence of a copulative plug, the animals were allowed to mate for two more times within the week and the females were checked for copulative plugs. The litter size and the sexes on the resulting pups were recorded and results of breeding are presented as average litter size/male.
Morphological analysis of the testis
The animals were sacrificed by CO2 inhalation and cervical dislocation at different stages of post‐natal development to target specific stages of testicular development in the downstream assays (post‐natal day (P) 6, P10, P20, P40, P90, and P270). Animals and the reproductive organs were inspected macroscopically and weighed. Serum was collected from 3‐month‐old animals for hormone assays. For histomorphometric study the testes were fixed in Bouin's fluid overnight and consecutively processed for paraffin embedding. Three or four animals per group (E2f1+/+, E2f1+/−, and E2f1−/−) at the ages of P40, P90, and P270 (9 months) were used to assess the testicular phenotype upon aging. Five micrometer sections were cut using a microtome and stained with Periodic Acid Schiff (PAS). Random visual fields encompassing 30 round seminiferous tubule cross sections per sample were imaged using a 20× objective with Leica DMRBE microscope (Leica Microsystems GmbH, Wetzlar, Germany). The seminiferous tubules from a given sample were grouped into three groups according to their histological appearance: normal (all stage‐appropriate layers of germ cells present in the seminiferous epithelium), germ‐cell loss (apparent loss of germ cells), and Sertoli cell only (complete absence of germ cell in the seminiferous tubules cross section). The representative histological images (Fig. 3) were imaged using Pannoramic Slidescanner (3D Histech, Budapest, Hungary).
Hormone assays
Serum LH and FSH levels were measured by immunofluorometric assay (IFMA, Delfia, Wallac Oy, Turku, Finland) as described previously (Haavisto et at., 1993; van Casteren, Schoonen, & Kloosterboer, 2000). The sensitivity of the LH and FSH assays was 0.03 μg/L in 25 μL and 0.1 μg/L, respectively. For serum testosterone determination, 25 μL aliquots were used. The sera were extracted twice with 2 mL diethyl ether and evaporated to dryness. The residues were reconstituted in PBS with 0.1% BSA and measured using standard RIA, as described previously (Huhtaniemi et al., 1985). The sensitivity of the assay was 1 nmol/L. All serum samples were assayed at the same time using specific antiserum and radiolabeled hormones diluted the same day.
RNA in situ hybridization and immunohistochemistry
RNAscope® 2.0 Assay (cat. ACD‐310035, Advanced Cell Diagnostics, Hayward, CA, USA) was used to detect E2f1 mRNA transcripts on PFA‐fixed, paraffin embedded section from 6, 10, 20, and 40‐day‐old wild‐type testis (Wang et al., 2012). The probe against mmE2f1 was custom‐made and the standard positive control (Mm‐PPIB, cat. ACD‐313902) and negative control (DapB, cat. ACD‐310043) probes were used. The assay was performed according to the manufacturer's instructions. After the DAB (3,3,‐diaminobenzidine) reaction, the slides were counterstained using hematoxylin and permanently mounted using Pertex. Negative signal threshold was set according to the manufacturer's instructions to no staining or <1 dot to every 10 cells per cell type. The samples were imaged using Pannoramic Slidescanner (3D Histech).
For a more precise identification of different germ‐cell types, the RNAscope assay was coupled to immunohistochemistry of Plzf and γH2AX‐S139 (antibody information in Table S1). The RNAscope assay was performed according to manufacturer's instructions until the DAB reaction. After washing with dH2O, the samples were blocked with 5% horse serum in PBS for 1 h at RT. Primary antibodies were diluted 1/200 in the blocking solution and they were incubated overnight at +4 °C. After washing off the primary antibody, the slides were incubated 30 min at RT with biotinylated horse anti‐mouse (cat. # BA‐2000; Vector laboratories, Burlingame, CA, USA) or anti‐goat (cat. # BA‐9500; Vector laboratories) secondary antibodies diluted 1/400. Vectastain ABC‐AP Standard kit (cat. # AK‐5000; Vector Laboratories) was used to according to the manufacturer's instructions. Vector Blue alkaline phosphatase substrate (cat. # SK‐5300; Vector Laboratories) supplemented with a drop of Levamisole (cat. # SP‐5000; Vector Laboratories) was used to visualize the signal. The slides were aqueously mounted using Vectashield Hard‐set mounting medium (cat. # H‐1400; Vector Laboratories).
lmmunofluorescence, BrdU and TUNEL assay
Immunofluorescence double labeling of apoptotic cells with Terminal deoxynucleotidyl transferase dUTP nick end labeling (TUNEL) or proliferating cells with 5‐bromo‐2′‐deoxyuridine (BrdU) coupled to detection of specific cell types with marker antibodies were done as described previously (Rotgers et al., 2014). Spermatogonia were detected using Magbee antibody (a kind gift from V. Thane) and Sertoli cells using Wilm's tumor 1 (WT1) antibody from P10 and P40 testes, n = 4 per group. Manufacturers, catalog codes and dilution of antibodies used are listed in Table S1. The number of Magbee or WT1 and TUNEL or BrdU‐positive and double‐positive cells was determined as intratubular cell count per analyzed round seminiferous tubule cross‐section. In the samples from the P10 testes the analyzed 50 round cross sections were chosen randomly. For the P40 animals only tubule cross sections in stage VII–VIII of the seminiferous epithelial cycle were chosen for the analysis and the minimum amount of analyzed tubules was five per animal. The stage‐specific analysis was done to decrease the variation caused by the stage‐specific pattern of apoptosis and to increase the sensitivity of the assay as there is no almost apoptosis in the normal testis in these stages. Double immunofluorescence labeling of γH2AX‐S139 and Plzf antibodies was performed on P40 testes using a standard immunofluorescence protocol (Rotgers et al., 2014).
Analysis of testicular cell populations by flow cytometry
Flow cytometry analysis for the behavior of the testicular cell populations was performed as previously described (Rotgers et al., 2015). Four E2F1+/+ and E2F1−/− animals at P20 and P40 were included in the assay. Briefly, whole testis tissue was cut to 10 mg aliquots and mechanically disrupted using McPherson‐Vannas scissors. The tissue was subsequently digested enzymatically with dispase (cat. # 10269638001; Roche, Basel, Switzerland), 1 mg/mL hyaluronidase (cat. # H3506; Sigma–Aldrich, Saint Louis, MO, USA), 1 mg/mL DNAse1 (cat. # DN‐25; Sigma–Aldrich, Saint Louis, MO, USA). The samples were filtered through 35 μm pore size filters (cat. # 352235; BD Falcon, Franklin Lakes, NJ, USA) and washed with PBS. The cells were fixed using 4% paraformaldehyde followed by a permeabilization with 90% methanol. The samples were stored frozen in −20 °C prior to analyses. To assess the germ‐cell populations in the testes, all the cells were stained with propidium iodide (Sigma–Aldrich, Saint Louis, MO, USA) to analyze the DNA content of the cells. A fixed volume of samples was run with BD LSRII (Becton Dickinson, Franklin Lakes, NJ, USA). A 488 nm laser was used for excitation and emissions were collected with and 575/26 nm band pass filter. The testicular cell populations were gated based on their DNA amount: 2C cells (spermatogonia and somatic cells), 4C cells (primary spermatocytes and proliferating cells in G2/M phase of cell cycle), proliferating cells in S‐phase with DNA amount between 2C and 4C population and 1C cells (spermatids). The amount of cells in each population is represented as cells per mg of tissue.
Gene expression microarray
Total RNA was isolated with TRIZOL reagent (Invitrogen, Carlsbad, CA, USA) from P20 E2F1+/+ and E2F1−/− snap‐frozen testis tissue. The RNA was pre‐cleaned using RNeasy MinElute Cleanup Kit (Qiagen, Valencia, CA, USA). Gene expression was analyzed using sentrix mousewg‐6 v2.0 Expression Bead Chip‐ microchip (Illumina Inc., San Diego, CA, USA) by the Finnish Microarray and Sequencing Centre at the Turku Centre for Biotechnology according to the manufacturer's instructions. The arrays were scanned with Illumina Bead Array Reader and the data were obtained using genomestudio v. 2011.1; gene expression module v. 1.9.0‐software (Illumina, San diego, CA, USA). Normalization and statistical analyses of the microarray data were performed using the statistical software r package limma (http://www.R-project.org) or sigma stat 3.1 (SPSS Inc., Chicago, IL, USA).
Downstream functional data analysis workflow
The differentially expressed genes from the E2F1−/− microarray were ranked according to the primary site of expression. Information of the relative expression levels of the transcripts in each testicular cell type was derived from the RNA‐seq data published by Soumillon et al. (2013). The data were recovered from the Gene expression Omnibus (GEO) under the accession code GSE43717. Data on Sertoli cells, spermatogonia, spermatocytes, and spermatids were chosen for the purposes of this study. The data on mature spermatozoa were excluded from the analysis because they are not yet present at the analyzed time point (P20). chipster software was used for the RNA‐seq data analysis (Kallio et al., 2011). The raw data were aligned to reference using TopHat2 and statistically significant differential expression over the different cell types was assessed using the DESeq2 tool (Love, MI et al. 2014). The transcripts were ranked according to their primary expression site by ranking the pairwise comparisons (e.g. A Sertoli cell‐enriched transcript should have high expression levels when compared to the other germ‐cell data sets and vice versa). The differentially expressed genes between E2F1+/+ and E2F1−/− testes from the microarray were grouped by their most likely cell type of origin according to this information on the cell‐type‐specific transcriptomes. The resulting transcript lists are referred to as the cell‐type‐weighed transcript lists. Enriched biological process GO terms were analyzed using the online tool Amigo by Gene Ontology Consortium (geneontology.org) (Ashburner et al., 2000). The cell‐type‐weighed gene ID lists were submitted to the tool using Mus musculus as the reference and Bonferroni correction of multiple hypothesis testing. The obtained GO term lists and adjusted p‐values were visualized using the revigo software to assess general trends and to filter redundant terms (Supek et al., 2011). The enrichment of putative E2F1 target genes in the lists of altered transcripts was analyzed using the PASTAA tool with stringent settings (−200 to +200 bp, sites conserved between Mus musculus and Homo sapiens, maximum affinity) (Roider et al., 2009).
RNA extraction and q‐RT‐PCR
Total RNA was isolated with TRIZOL reagent (lnvitrogen, Carlsbad, CA, USA) from whole testis tissue of P6, P20, and P90 E2f1+/+and E2f1−/− mice, n = 4/group. RNA was then purified using either RNeasy Micro Kit (P6) with an RNeasy MinElute Cleanup Kit (P20 and P90) (Qiagen, Valencia, CA, USA). RNA samples were then treated with DNase (DNase1 Amplification Grade Kit, lnvitrogen, Life Technologies, Paisley, UK). cDNA synthesis and quantitative RT‐PCR were performed using the DyNAmo HS two step SYBR Green qRT‐PCR kit (Thermo Scientific, Waltham, MA, USA). The data were normalized by relating gene expression to the mouse ribosomal protein Ll9, peptidyl‐prolyl isomerase A (PPIA, cyclophilin A) and hypoxanthine guanine phosphoribosyl transferase (Hprt) using the Pfaffl method (Pfaffl, 2001). The primer sequences are listed in Table S2.
Statistical analysis
Unless otherwise stated graphpad Prism5 (GraphPad Software, Inc., La Jolla, CA, USA) software was used for statistical testing. Depending on the number of experimental groups either one‐way‐anova followed by Tukey's test, two‐way anova or t‐test were used for statistical testing. Significance level was set at p = 0.05.
Results
E2f1 is expressed in a cell type‐specific manner during mouse testis development
E2f1 mRNA expression during mouse post‐natal testicular development was analyzed at different time points (P10, P20, and P40) using RNAscope® 2.0 Assay. Positive signal was a brown dot‐like DAB precipitate in the cytoplasmic area of the cells. For a more precise identification of the different germ‐cell populations the RNAscope assay was also coupled to immunohistochemical detection PLZF and phosphorylated γH2AX‐Ser139 (pH2AX). Plzf is a marker of undifferentiated spermatogonia. pH2AX gives a dispersed nuclear signal in the leptotene spermatocytes, but in the pachytene spermatocytes only the sex body is positive for pH2AX, which allows identification of these cells types in stage IX‐X seminiferous tubules. E2f1 was expressed in a cell‐type specific and developmentally controlled manner in the mouse testis (Fig. 1). At P10, the majority of the E2f1‐positive signal was observed in the spermatogonia (Fig. 1A, green arrows, middle panel and upper right panels). E2f1 was expressed in a few interstitial cells (open black arrow head) and peritubular myoid cells (PTM) (black arrow head) were also positive for E2f1 (Fig. 1A, middle panel). At P20, when the first wave of spermatogenesis had progressed to the pachytene stage, spermatogonia (green arrow) remained highly positive for E2f1 (Fig. 1B, middle and upper right panels), while only low expression was seen in the pachytene spermatocytes (dashed circles) (Fig. 1B middle and lower right panels). A few interstitial cells (open black arrowhead) continued to express E2f1 at a low level at P20 (Fig. 1B, middle panel). In the P40 young adult testis with full spermatogenesis a clear stage‐specific pattern for E2f1 expression emerged (Fig. 1C, left panel). The A spermatogonia at stage VII–VIII were strongly positive for E2f1 (green arrow) (Fig. 1C, middle panel). After spermiation (stage VIII–IX) towards the later stages of the seminiferous epithelial cycle a strong E2f1 signal was seen in the leptotene and zygotene spermatocytes (red arrow) (Fig. 1C, middle and right lower panel). E2f1 was gradually silenced as the germ cells entered the the pachytene phase of meiosis (dashed circles, Fig. 1B,C, middle and lower right panels). The PLZF‐positive spermatogonial subpopulation had a multiple foci of E2f1 signal in all analyzed time points (Fig. 1A–C, upper right panels). The leptotene spermatocytes, which exhibited a strong dispersed nuclear pH2AX signal, were also E2f1‐positive from P10 onwards (Fig. 1A–C, lower right panels). In the pachytene spermatocytes, where pH2AX is localized only in the sex body, E2f1 expression was decreased (dashed circles, Fig. 1B,C, middle and lower right panel). An unspecific positive brown signal could be seen in the nucleolus of round spermatids. Sertoli cells remained E2f1 negative at all time points (purple arrow) (Fig. 1A–C, middle panels).
Figure 1.
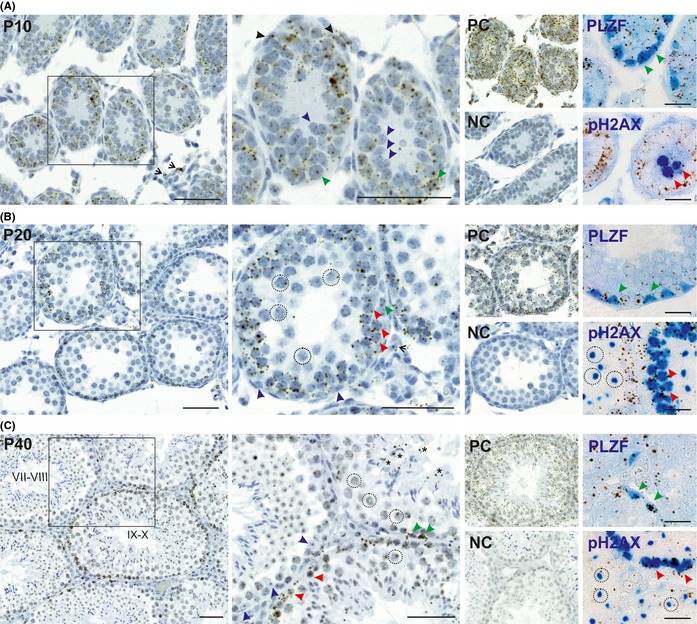
E2f1 is expressed in a dynamic manner during post‐natal mouse testis development. RNAScope 2.0 assay was used to localize E2f1 mRNA on testicular sections; positive signal is cytoplasmic brown precipitate. An immunohistochemical detection of Plzf and pH2AX was coupled to the RNAscope assay to aid identification of the different E2f1‐positive germ‐cell subtypes (right panels, E2f1 in brown, pH2AX and PLZF blue). (A) E2f1 mRNA is detected at PND 10 in all germ cells (green arrow), and a subset of PMCs (black arrow) and interstitial cells (open arrow head). SCs (purple arrow) are negative for E2f1 mRNA. PC = positive control with mmPpib probe, NC = negative control with Dapb probe against a bacterial transcript. PLZF‐positive undifferentiated spermatogonia express E2f1. (B) At P20 E2f1 mRNA is no longer detected in PMCs (black arrow). The Pachytene spermatocytes (dashed circle) had very low or no E2f1 expression. Spermatogonia (green arrow) and the Plzf‐positive E2f1 were detected in the Plzf‐positive spermatogonia. The Pachytene spermatocytes have a positive blue pH2AX‐signal in the sex body. And the leptotene and zygotene spermatocytes (red arrow, dispersed nuclear blue pH2AX‐signal) are positive. (C) At P40 a stage‐specific E2f1 expression pattern is observed with E2f1 expression in similar cell types as P20. Elongating spermatocytes (asterisk) have a positive cytoplasmic signal. A false‐positive background is observed in round spermatid nucleoli. Black square marks the area of the picture in the higher magnification. Scale bar 50 μm in RNAScope only panels and 20 μm in RNAscope and immunohistochemistry panels.
E2F1−/− males in C57Bl/6 genetic background exhibit testis atrophy during the first wave of spermatogenesis
The E2F1B6;12954‐E2f1tm1Meg/J mice were back‐crossed to C57Bl/6 genetic background over eight generations. A decreased relative testis weight was observed already at P20 in the E2F1−/− strain in the C57Bl‐background and this macroscopic atrophy progressed over time (Fig. 2B). The E2F1−/− males were subfertile already at the age of 3 months but, despite the progressive phenotype, no further deterioration of fertility was observed in the 5‐month‐old animals (Fig. 2C). The histological appearance of E2F1+/+, E2F1+/−, and E2F1−/− was assessed at ages P40, P90, and P270 (9 months) (Figs 2D–F & 3B). The seminiferous tubule cross sections from PAS‐stained histological sections were classified as appearing normal (all germ‐cell layers present), exhibiting germ‐cell loss (clear loss of the germ‐cell layers in the epithelium) or Sertoli cell only (SCO, no germ cells present). There was a statistically significant deterioration of the seminiferous epithelium in time with increasing proportion of tubule cross sections with germ‐cell loss and SCO and decreasing proportion of normal tubules as the E2F1−/− animals aged (Figs 2D–F & 3B). In the 20‐day‐old E2F1−/− testis the primary histological defect appeared to be the loss of the meiotic cell pool of the first wave of spermatogenesis (Fig. 3A). In the adult testis a compound effect of loss the meiotic cells and spermatogonia was observed in the histological level (Fig. 3B). Flow cytometric analysis of the testicular cell populations was conducted to complement the gross histological analysis. The different cell populations were distinguished based on their DNA amount using propidium iodide. An overall decrease in cellularity was observed at both P20 and P40 in the E2F1−/− testes (Table 1). The major contributors to this decrease were the loss meiotic cells (4C) and haploid cells (1C) cells at both time points (Table 1). In addition, there was a significant decrease in the amount of the 2C cells in the P40 E2F1−/− testes (Table 1).
Figure 2.
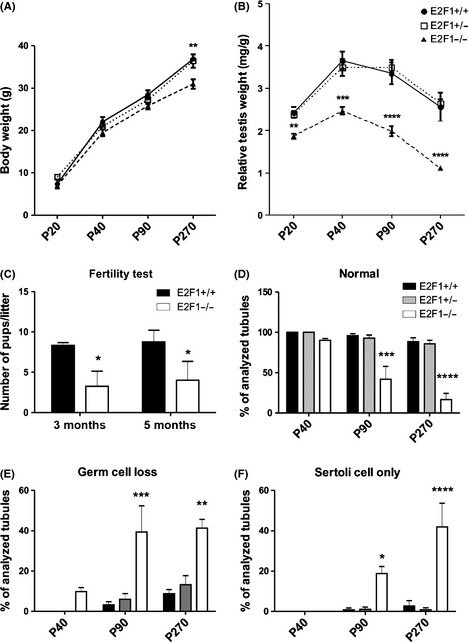
Loss of E2f1 in C57 genetic background leads to decreased testicular size from PND20 onwards. (A) Body weights of E2f1+/+, E2f1+/−,\ and E2f1−/− animals at different time points n = 4–6. There is significant decrease in bodyweight at the age of 270 days (9 months) in the E2f1−/−. (B) Relative testis weights (mg of testis/g of bodyweight) of E2f1+/+, E2f1+/−, and E2f1−/− animals at different time points. A statistically significant decrease in relative testis weight can be observed at PND20 in E2F1−/−. (C) Fertility test was performed by breeding E2f1+/+ and E2f1−/− males (n = 3–4) with four different C57 females at different time points. The number of pups per litter was recorded. *p < 0.05, **p < 0.01, ***p < 0.001, ****p < 0.0001. (D–F) Classification of seminiferous tubule morphology to normal, tubules with germ‐cell loss, and tubules with only SCs.
Figure 3.
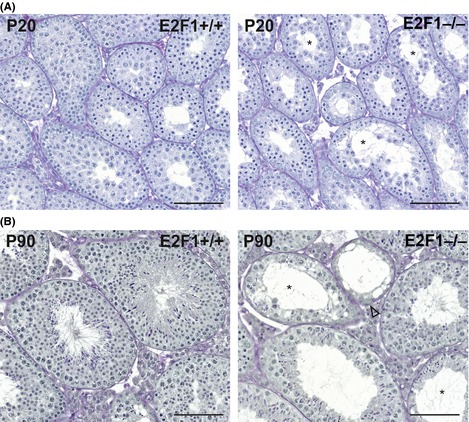
Histological alterations in E2F1−/− testis already at P20. (A) Loss of meiotic germ cells can be observed on a microscopic level already at P20 in E2F1−/− testis (asterisk). (B) At P90 SCO‐seminiferous‐tubule cross sections (open arrow head) and loss of meiotic germ cells (asterisk) are observed. There was evidence of previous successful rounds of spermatogenesis even in the disrupted tubules, since elongated spermatids could be found (asterisk). Scale bar represents 100 μm.
Table 1.
Quantification of the cell dynamics in E2F1−/− testes using flow cytometry recapitulates the histological findings
| Age | Group | Cells/mg | 2 C/mg | Prolif./mg | 4 C/mg | 1 C/mg |
|---|---|---|---|---|---|---|
| P20 | E2F1+/+ | 1301 ± 60 | 474 ± 52 | 126 ± 12 | 414 ± 26 | 183 ± 52 |
| E2F1−/− | 671 ± 99** | 294 ± 66 | 74 ± 11* | 148 ± 9**** | 38 ± 4* | |
| P40 | E2F1+/+ | 7982 ± 1313 | 1500 ± 300 | 424 ± 58 | 981 ± 176 | 4277 ± 53 |
| E2F1−/− | 2163 ± 92** | 385 ± 63* | 320 ± 61 | 289 ± 20** | 947 ± 68** |
E2F1 loss results in an overall decrease in the testicular cell counts, which is primarily caused by a highly significant loss of meiotic (4C) cells and haploid (1C) cells. Single cell suspensions of E2F1+/+ and E2F1−/− testes were stained with propidium iodide DNA stain at P20 and P40 and subsequently analyzed using flow cytometry. The analyzed cell counts were normalized to amount of tissue analyzed and cell concentration, n = 4 animals. The t‐test was used for statistical testing and significance is marked as *p < 0.05, **p < 0.01, ****p < 0.0001.
As the E2F1+/− did not significantly differ from the E2F1+/+ animals in the histological evaluation, we decided to include only E2F1+/+ and E2F1−/− animals to the subsequent steps of the analyses.
E2f1 has a differential role during the first‐wave and adult spermatogenesis
To determine whether the observed loss of germ cells in the juvenile (P10) and adult testis (P40) could be attributed to apoptosis of spermatogonia, we performed fluorescent TUNEL assay coupled to detection of spermatogonia with MAGE‐B4 (Fig. 4A–C) (Osterlund et al., 2000). In the adult testis, the amount of TUNEL positive was significantly increased as compared with younger time points (Fig. 4A). As there were no MAGE‐B4‐positive apoptotic cells observed in the adult testes in E2F1−/− testis compared with E2F1+/+ (Fig. 4B), the increase in the TUNEL‐positive cells was attributed to spermatocytes, based on the localization and nuclear morphology of the cells (Fig. 4C). To our surprise, there was a significant decrease in apoptosis on the MAGE‐B4‐positive cells in the P10 E2F1−/− testes (Fig. 4B).
Figure 4.
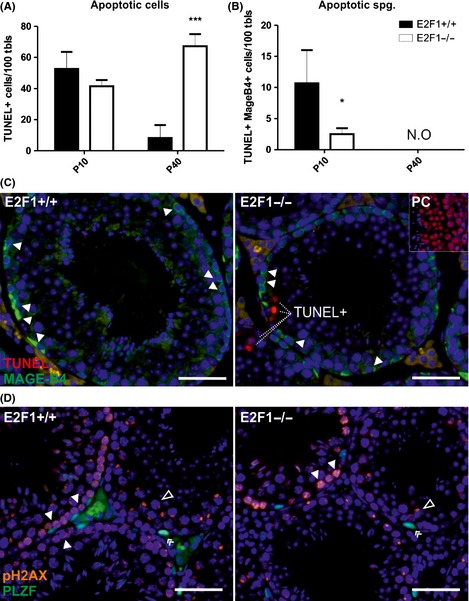
Decreased apoptosis of the first‐wave spermatogonia and increased apoptosis of meiotic germ cells in the E2F1−/− testis. TUNEL assay coupled to detection of MAGE‐B4 positive spermatogonia was performed. *p < 0.05, ***p > 0.001. (A) Quantitation of TUNEL‐positive cells. (B) Quantitation of apoptotic spermatogonia in E2F1+/+ and E2F1−/− at the ages of P10 and P40. N.O. = not observed. (C) Representative pictures from the TUNEL/MAGE‐B4‐assay testes at P40. MAGE‐B4‐positive spermatogonia = white arrow head. MAGE‐B4 = green, TUNEL = red. Inset: Positive control for TUNEL assay with DNAse treatment. (D) Phosphorylated γH2AX (pH2AX) localization was assessed in P40 E2F1+/+ and −/− testis together with PLZF (a marker for undifferentiated spermatogonia). pH2AX staining was comparable in control and mutant. There was a strong nuclear pH2AX signal in the meiotic cells undergoing meiotic DSB formation (the leptotene and zygotene spermatocytes, white arrow heads). No positive foci (indicating DNA damage) are detected outside the sex body in the pachytene spermatocytes (open arrow head). PLZF‐positive undifferentiated spermatogonia remain negative for pH2AX in the E2F1−/− testis (double arrow head). pH2AX = orange, PLZF = green. Scale bar represents 50 μm in C and D.
To assess whether activated DNA damage signaling contributed to the apoptosis of the meiotic cells, the pattern of S139‐phosphorylated γH2AX (pH2AX) was examined in P40 E2F1+/+ and E2F1−/− testes using immunofluorescence (Fig. 4D). A strong pH2AX signal in the nuclei of the leptotene spermatocytes and in the sex body of the pachytene spermatocytes was observed in both E2F1−/− and control testes. In addition, there was no pH2AX‐activation observed in the PLZF‐positive undifferentiated spermatogonia (Fig. 4D).
To further characterize the dynamics of the different germ‐cell populations, q‐RT‐PCR of several markers for different stages of germ development was performed: Oct4, Ngn3, and Plzf for undifferentiated spermatogonia, Stra8 for differentiating spermatogonia and early meiotic cells and Spo11 for meiotic cells (Fig. 5A). Both Oct4 and Plzf, which were considered markers of SSCs, were significantly decreased in P90 E2F1−/− testes (Fig. 5A). Spo11 was analyzed at P6 to assess whether the E2F1−/− ‐spermatogonia had an accelerated meiotic entry, but no induction of Spo11 at P6 was observed in the E2F1−/− (Fig. 5A). A significant decrease in the number of MAGE‐B4‐positive cells was observed at P10, although the decline in spermatogonial proliferation did not reach statistical significance (Fig. 5B). No significant changes in either parameter were observed at P40 in the E2F1−/− testis (Fig. 5B).
Figure 5.
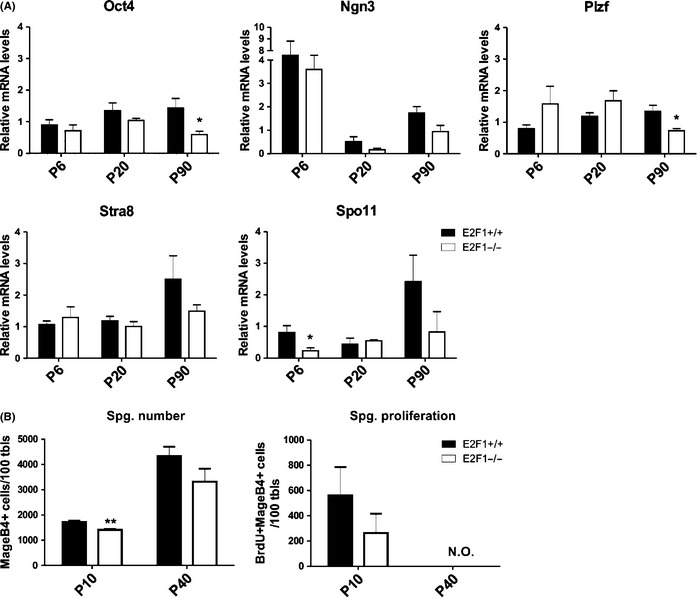
Loss of undifferentiated spermatogonia in the absence of E2f1. (A) Relative mRNA levels of germ‐cell markers for undifferentiated spermatogonia (Oct4, Ngn3, Plzf), differentiating spermatogonia (Stra8) and meiotic cells (Spo11). (B) Quantitation of proliferating spermatogonia in E2F1+/+ and E2F1−/− at the ages of P10 and P40. MAGE‐B4 (spermatogonia marker) and BrdU (proliferation marker) positive cells were count. N.O. = not observed * = p < 0.05, ** = p < 0.01.
E2f1 did not have role in the control of the somatic cells in the post‐natal mouse testis
Sertoli cell numbers and proliferation were unaffected in E2F1−/− animals in both P10 and P40 testis in the WT1‐BrdU‐assay (Fig. 6A,B). A relative mRNA level of Claudin11, a component of the blood‐testis‐barrier, was assessed as a functional SC marker (Fig. 6C). Smooth muscle actin (Sma) was used in a similar fashion for peritubular myoid cells (Fig. 6D). There were no significant changes in either of the markers in the E2F1−/− testis (Fig. 6C,D).
Figure 6.
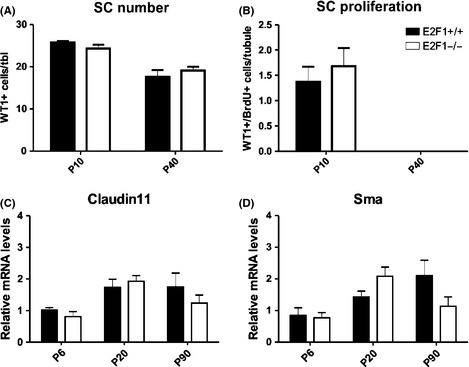
Sertoli cells and peritubular myoid cells are not affected by E2f1 loss. The number and proliferation of Sertoli cells is not altered in E2F1−/− at P10 and P40. (A–B) WT1 (SC marker) and BrdU (proliferation marker) positive cells were analyzed in P10 and in P40 control and E2F1−/− testes. n = 4. (C–D) Relative mRNA levels of Claudin11 (a SC tight‐junction marker) and Sma (a peritubular myoid cell marker) were analyzed from whole testis RNA at different time points.
E2f1 was expressed in the interstitial cells in the juvenile mouse testis (Fig. 1A,B). This cell compartment consists of Leydig cells (LC), macrophages and other minor interstitial cell types. However, lack of E2f1 did not appear to impact the androgenic status of adult males. There were no significant alterations in the serum gonadotrophin and testosterone levels in the P90 E2F1−/− animals (Fig. 7A). Furthermore, androgen receptor (AR) expression was not significantly altered during testicular development in the E2F1−/− (Fig. 7B). Spinlw2 and Rhox5, known target genes of androgen signaling, were not significantly altered in the adult E2F1−/testes (Fig. 7B). The mRNA levels of 3βHSD, a LC marker, were significantly increased at ages P6 and P90, which was likely to reflect a relative increase in LC amount as the cellularity of the E2F1−/− testes changed (Fig. 7B).
Figure 7.
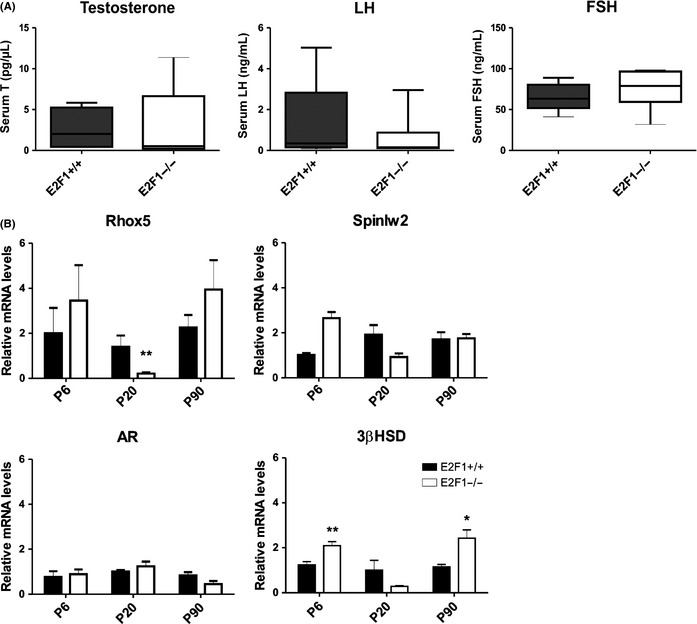
E2f1−/− mice have an unaltered hypothalamo‐pituitary‐gonadal axis. (A) Serum hormone levels of 90‐day‐old E2f1+/+, and E2f1−/− animals. FSH (ng/mL), LH (ng/mL), testosterone (pg/μL), n = 5–6. (B) Relative mRNA levels of genes related to androgen signaling in E2f1+/+ and E2f1−/− testis at ages of PND6, 20 and 90, n = 4. Ar, Spinlw2 (Eppin) mRNA levels and Rhox5 mRNA levels. *p < 0.05, **p < 0.01.
Global gene expression changes in E2F1−/− testis reflected the testicular phenotype
Illumina gene expression microarray profiling was conducted on whole testis tissue RNA from P20 animals. P20 was chosen for analysis to avoid extreme changes in cellularity that could have biased the analysis. The fold changes of the differentially expressed genes were relatively modest (FC −4.4 to 2.6) and the samples were relatively mixed in the hierarchical clustering and principal component analysis, which indicated that there were no drastic differences in cell compositions between the samples and that the selection of the time point for the assay was appropriate. 164 genes were up‐ and 56 downregulated in E2F−/− vs. E2F1+/+ (Fig. S1A).
Quite surprisingly E2f1 was the most upregulated gene when the results from E2F1+/+ and E2F1−/− were compared. This was likely caused by an upregulated expression of a truncated non‐functional E2f1 mRNA in the knockout as the Illumina array probe directed against E2f1 mRNA was complementary to E2f1 mRNA sequence on exon 7 (Fig. S1B). In the E2F1−/− animals, however, there is partial deletion of exon 3 and a complete deletion of exon 4, which render the transcribed mRNA non‐functional and no translation of E2F1 protein occurs. To control the results of the array, primers targeting exons 3 and 4 were used to assess the E2f1 mRNA levels using qPCR. As expected, there was no signal observed from the E2F1−/− testis (Fig. S1C). A set of altered transcripts form the microarray were selected for a further qPCR validation and the majority of them followed the trend in expression as analyzed in the array (Fig. S1D‐E).
Since RNA from whole decapsulated testes was used for the assay, it was difficult to draw conclusions of gene expression changes on a cellular level. To overcome this limitation, the differentially expressed genes (DE genes) between E2F1−/− and E2F1+/+ were ranked according to their primary site of expression, i.e. which cell type likely contributed most to the observed changes in expression (Fig. 8A). A previously published data set on the transcriptomes of the different testicular cell types (Sertoli cell, spermatogonia, spermatocytes, and spermatids) after primary cell extraction was used for the analysis (Soumillon et al., 2013). Differential expression of genes in the different testicular cell types was analyzed. Then DE genes from the E2F1 microarray were compared against this data and subsequently ranked according to their most likely cell type of origin. The obtained transcript groups were referred to as the cell‐type‐weighed transcript lists (Table S3). The conditions for a transcript to be classified as originating from a single cell type were relatively stringent and there was no overlap between the cell‐type‐weighed transcript lists (Fig. 8B).
Figure 8.
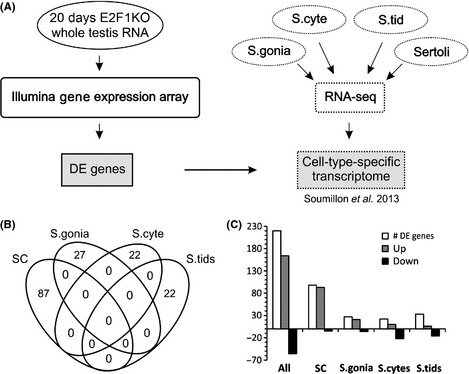
Ablation of E2f1 leads to upregulation of transcripts related to spermatogonia and SCs. (A) A schematic representation of the RNA microarray data analysis workflow. The list of differentially expressed genes from the E2F1‐array was compared against the cell‐type‐specific transcriptome data from Soumillon et al. to assess which cell types are responsible for the transcript level changes in the array. (B) A Venn diagram of the different cell‐type‐weighed transcript groups showing no overlap between different ell types in the analysis. (C) Graph representing the number of up‐ and downregulated transcripts from the E2F1‐array grouped according to the cell‐type‐weighed analysis. Majority of the DE genes are upregulated in E2f1−/− testis at P20.
Majority of the DE genes in the E2f1−/− testis were upregulated. In the cell‐type‐weighed analysis, SC and spermatogonia‐associated changes primarily led to upregulation of gene expression in the absence of E2f1 (Fig. 8C). In spermatocytes and spermatids a tendency for downregulation dominated (Fig. 8C). The downregulation of the transcript levels of the post‐meiotic cells could be attributed to the loss of these cell types in the E2f1−/− testes, while the increased expression among the SC‐weighed transcript list could reflect the enrichment of SCs as a result of the germ‐cell loss (Figs. 3 & 8C).
An intrinsic role for E2F1 in controlling transcription in spermatogonia
The cell‐weighed gene lists were submitted to GO consortium Amigo2‐tool to assess which biological processes were enriched in each cell type. The obtained GO term list and p‐values were analyzed using the ReviGO tool to filter out redundant terms and to visualize the main categories of the GO terms (Supek et al., 2011). Among the most significantly enriched cellular processes in the E2F1−/− SCs were response to stimulus (GO:0042981), immune system process (GO:0006950), response to stress (GO:0050896), regulation of apoptotic process (GO:0008152), and metabolic process (GO:0002376) (Table 2).
Table 2.
GO biological process term enrichment in different testicular cell types in the E2F1−/− testes
| Gene ontology terms for biological process | |||
|---|---|---|---|
| Term ID | Name | Adjusted p‐value | Associated cellular function |
| Spermatogonia | |||
| GO:0071622 | Regulation of granulocyte chemotaxis | 9,77E‐03 | Stem cell niche |
| GO:0071268 | Homocysteine biosynthetic process | 1,58E‐02 | Cell metabolism |
| GO:0046108 | Uridine metabolic process | 1,58E‐02 | Cell metabolism |
| GO:0019510 | S‐adenosylhomocysteine catabolic process | 1,58E‐02 | Cell metabolism |
| GO:0071930 | Negative regulation of transcription involved in G1/S transition of mitotic cell cycle | 4,72E‐02 | Cell cycle |
| Spermatocytes | |||
| GO:0048608 | Reproductive structure development | 6,83E‐03 | Testis function |
| GO:0009725 | Response to hormone | 2,06E‐02 | Hormonal control |
| GO:0010466 | Negative regulation of peptidase activity | 2,64E‐02 | Hormonal control |
| GO:0010629 | Negative regulation of gene expression | 2,69E‐02 | Gene expression |
| GO:0035411 | Catenin import into nucleus | 3,77E‐02 | Germ‐cell function |
| Spermatids | |||
| GO:1902230 | Negative regulation of intrinsic apoptotic signaling pathway in response to DNA damage | 2,23E‐03 | Apoptosis |
| GO:0051704 | Multi‐organism process | 1,04E‐02 | Testis function |
| GO:0019953 | Sexual reproduction | 2,19E‐02 | Testis function |
| GO:0070212 | Protein poly‐ADP‐ribosylation | 3,11E‐02 | Protein synthesis |
| GO:0032212 | Positive regulation of telomere maintenance via telomerase | 5,17E‐02 | DNA replication |
| Sertoli cells | |||
| GO:0042981 | Regulation of apoptotic process | 4,43E‐07 | Response to germ‐cell apoptosis |
| GO:0006950 | Response to stress | 1,05E‐06 | Response to germ‐cell apoptosis |
| GO:0050896 | Response to stimulus | 1,55E‐05 | Testis function |
| GO:0008152 | Metabolic process | 6,37E‐05 | Testis function |
| GO:0002376 | Immune system process | 8,81E‐04 | Response to germ‐cell apoptosis |
| Whole testis | |||
| GO:0008152 | Metabolic process | 3,48E‐05 | Cell metabolism |
| GO:0022414 | Reproductive process | 3,68E‐05 | Testis function |
| GO:0044092 | Negative regulation of molecular function | 7,11E‐05 | Inhibition |
| GO:0055114 | Oxidation–reduction process | 3,90E‐04 | Reaction to reactive oxygen species |
| GO:2001021 | Negative regulation of response to DNA damage stimulus | 7,88E‐04 | DNA damage response |
Transcripts that were significantly altered in the E2F1−/− vs. 20 days wild‐type in 20 days testis in the Illumina array, were classified as their predominant cell type of origin in to different groups. GO consortium advanced Amigo2 analysis tool was used to find significantly enriched biological process GO terms with the different cell‐type‐weighed transcript sets. REVIGO tool was used to assess redundancy of the terms. Top five terms are shown in the table.
When a similar analysis was applied to the spermatogonia, the top‐enriched GO terms were regulation of granulocyte chemotaxis (GO:0071622), homocysteine biosynthetic process (GO:0071268), uridine metabolic process (GO:0046108), S‐adenosylhomocysteine catabolic process (GO:0019510), and negative regulation of transcription involved in G1/S transition of the mitotic cell cycle (GO:0071930) (Table 2).
Furthermore, the possible enrichment of putative E2F1 target genes in the differentially expressed genes in E2F1−/− gene expression array was analyzed using the PASTAA tool (Roider et al., 2009). PASTAA compares the promoters and frequencies of consensus binding sites for different factors against a reference list of all the promoters in the genome of the given organisms and it estimates also the statistical significance of the finding. Both the complete list of the differentially expressed genes and the lists obtained from the cell‐type‐weighed analysis were submitted to PASTAA. E2F binding in vivo commonly occurs near the transcription start site in the proximal promoter area and to decrease the chances of false positives, the consensus binding site search was restricted to that area (Bieda et al., 2006). Interestingly, spermatogonia were the only cell type with statistically significant enrichment of E2F consensus binding sites in the promoter areas of the altered genes (Table S4).
Discussion
This study explored the role of E2F1 transcription factor in mouse testicular development and adult spermatogenesis by analyzing the commercially available E2F1−/− mouse strain. We assessed the contribution of the genetic background to the phenotype by breeding the animals to C57Bl/6J‐strain, which showed that genetic background had a strong influence on the severity and the time course of the phenotype associated with E2F1 loss. In the previous studies on the E2F1−/− mice the testicular atrophy has been reported from the age of 3 months onwards (Field et al., 1996; Yamasaki et al., 1996; Hoja et al., 2004). In contrast, in C57Bl/6 genetic background significant testicular atrophy occurred already at P20. It was caused by a loss of germ cells and as the animals aged an increasing proportion of seminiferous tubules exhibited germ‐cell loss and a Sertoli cell only (SCO) phenotype.
We showed that E2f1 mRNA is present in the spermatogonia from P10 onwards. The number of spermatogonia in the P10 E2F1−/− testis was a slightly but significantly decreased in the immunofluorescence assay but there were no significant alterations in the spermatogonial proliferation rate or an accelerated entry into meiosis as Spo11 levels were not increased at P6. We surmised that the decreased Spo11 levels at P6 may have been caused by a loss of the more differentiated spermatogonia at this time point. To our surprise, E2F1−/− animals showed decreased spermatogonial apoptosis at P10. A high level of spermatogonial apoptosis is physiological at this time point, since e.g. correct Sertoli/germ cell‐ratio for the successive rounds of spermatogenesis is established during the first wave of spermatogenesis (Shaha et al., 2010). Important effectors of the first‐wave apoptosis are the pro‐apoptotic Bax and anti‐apoptotic Bcl‐w, Bcl‐XL and Bcl‐2 (Knudson et al., 1995; Furuchi et al., 1996; Rodriguez et al., 1997; Yan et al., 2003; Jahnukainen et al., 2004). Ablation of Bax or over‐expression of the anti‐apoptotic factors (Bcl‐2 or Bcl‐XL) result in disruption of spermatogenesis because of eliminated first‐wave apoptosis. Interestingly, E2F1 has been shown to regulate these factors either directly or via p53 (reviewed in (Polager & Ginsberg, 2009)). An absence of E2F1‐mediated activation of these genes is a possible cause of the decreased first‐wave apoptosis of spermatogonia in the E2F1−/− testes.
E2F1 appeared to have a differential role in the adult spermatogonia as there was no effect on their apoptosis, despite being expressed in the all PLZF‐positive spermatogonia from the age of P10 to adulthood. Instead of being involved in spermatogonial apoptosis, E2F1 was necessary for the maintenance of spermatogonial stem cell (SSC) pool in the successive rounds of adult spermatogenesis. The loss of the self‐renewing SSCs likely contributed to the progression of the E2F1−/− phenotype, since gradually the proportion of SCO tubules increased in a similar fashion as in the Plzf−/− mouse testis where the SSC are lost (Costoya et al., 2004). The observed reduction in the 2C cell population at P40 in the flow cytometry assay likely resulted from a loss of the diploid spermatogonial cell population. In addition, the mRNA levels of Oct4 (a marker for SSCs) and Plzf (a marker for undifferentiated spermatogonia) were significantly decreased in the adult testes compared to younger animals. The discrepancy between the first wave and the adult spermatogonia phenotype was expected. Even in the normal testis the spermatogonia in the first wave of spermatogenesis differ from the adult spermatogonia: their differentiation is accelerated and their progenitors are most likely gonocytes instead of SSCs (Yoshida et al., 2006).
Both loss of E2f1 and transgenic over‐expression results in increased apoptosis of meiotic cells (Yamasaki et al., 1996; Agger et al., 2005). Indeed, a strong E2f1 mRNA expression was detected in B spermatogonia and leptotene and zygotene spermatocytes, but when germ cells entered the pachytene phase of meiosis, E2f1 expression was downregulated in a similar fashion as in adult human testis (Novotny et al., 2007). In the histological evaluation and the flow cytometric analysis it was seen that a highly significant proportion of the primary spermatocytes were lost and the number of round spermatids was consequently decreased in the E2F1−/−‐testis at P20. As a compound effect of loss of spermatogonia (the progenitors of spermatocytes) and spermatocytes, a reduction in both 2C and 4C cell numbers was observed in the P40 E2F1−/− testis. Apoptosis was a major contributor for the loss of spermatocytes in the P40 testis as shown in the TUNEL‐apoptosis assay. Despite the increased apoptosis, the germ cells that managed to escape this process during meiosis developed normally to mature spermatozoa and no meiotic arrest was observed. Even male mice with relatively disrupted spermatogenesis and subfertility were able to sire viable pups.
We were interested in whether DNA double strand break (DSB) repair was altered in the E2F1−/−‐testes. DSB repair and E2F1 are closely connected and E2F1 can both be stabilized by and activate DSB proteins ATM and ATR (Lin et al., 2001; Berkovich & Ginsberg, 2003). Furthermore, activation of DNA damage repair is a normal event in meiosis. During meiosis induction of DSBs by Spo11‐endonuclease occurs in the leptotene spermatocytes as the chromosomes begin to pair, in the same cell type with a high E2f1 expression level (Baudat et al., 2000; Romanienko & Camerini‐Otero, 2000). In zygotene spermatocytes the pairing is completed and DSB repair and meiotic crossing‐over commence in the pachytene phase. Here, we chose S139‐phophorylated γH2AX (pH2AX) as a proxy for DNA damage and meiotic DSB repair. When spermatocytes accumulate DNA damage due to ionizing radiation or chemotherapeutics, distinct foci of positive pH2AX signal can be observed in the nuclei outside the sex body (Hamer et al., 2003) and the levels of pH2AX can be used to assess the faithfulness of the meiotic recombination. There were no alterations in the pH2AX staining pattern in the E2F1−/−‐testis at P40 compared with E2F1+/+, which indicated that increased DNA damage was not the source of the spermatocyte apoptosis. In addition, this shows that the initial meiotic DSB formation occurred normally, as impaired DSB formation commonly leads to a decreased pH2AX staining in the spermatocytes (Hoja et al., 2004; Lam & Keeney, 2014). This suggested that despite having high E2F1 expression levels in the cell types undergoing meiotic DSB formation, E2f1 did not contribute to this process.
Contrary to the germ cells, E2f1 was redundant in the function of the somatic cell populations of the testis. We showed that E2f1 is expressed in a subset of peritubular myoid cells and interstitial cells during post‐natal testis development. However, there were no alterations in either serum gonadotropin and testosterone levels or androgen signaling in the adult E2F1−/− males. We examined the mRNA levels of peritubular myoid cell marker Sma and Sertoli cell marker Claudin 11, but observed no significant changes in the E2F1−/− testes. Furthermore, Sertoli cell numbers and proliferation were unaffected.
To analyze the effect of E2f1 loss on transcription, we performed Illumina microarray gene expression profiling of total RNA from whole testes at P20. To aid the analysis of the list of the differentially expressed genes, we took advantage of RNA‐seq data of transcriptomes of primary extracted SCs, spermatogonia, spermatocytes, and spermatids from the repository (Soumillon et al., 2013). A differential expression analysis was performed on the repository data to evaluate which cell type has the highest level of each transcript. Then the list of differentially expressed genes from the E2F1‐array was compared against cell‐type‐weighed transcript list to assess which cells were the most likely to contribute to the observed differential expression in the array. In the cell‐type‐weighed analysis of the differentially expressed genes, there was a pattern of upregulation of gene expression in the Sertoli cell and spermatogonia enriched transcripts and downregulation in the spermatocyte and spermatid enriched transcripts. A plausible explanation to the downregulation of the spermatocyte and spermatid enriched transcripts was the change in the cellularity of the E2F1−/−‐testis. The spermatogonia‐weighed transcripts list was the only one with a significant E2F1‐binding site enrichment on the promoters in the in silico analysis of a consensus binding site enrichment analysis, which supported the role of spermatogonia as the primary E2f1 target.
A few individual genes assigned to the spermatogonia‐weighed transcript list were interesting, because they are connected to stem cell pool maintenance in other organ systems. One of these was chromodomain‐helicase‐DNA‐binding protein 1 (Chd1), which is involved in maintaining the promoters of differentiation‐associated genes silenced in pluripotent stem cell cells (Gaspar‐Maia et al., 2009). The cell‐type‐weighed transcript lists were submitted to a GO term enrichment analysis. Genes related to homocysteine metabolism, granulocyte chemotaxis, and negative regulation of transcription in the G1/S‐phase of cell cycle were significantly enriched in the spermatogonia‐weighed transcript list. Altered homocysteine metabolism can be a sign of oxidative stress and altered nucleic acid metabolism in the germ cells (reviewed in (Forges et al., 2007)). E2F1 loss led to aberrant transcription in the proliferating spermatogonia as the genes involved negative regulation of transcription in the G1/S‐phase of cell cycle were also enriched.
In contrast to the spermatogonia, there was no enrichment of putative E2F1‐binding sites in spermatocytes. However, it has been shown that a majority of the experimentally validated E2F target genes in vivo lack a consensus binding site (Bieda et al., 2006; Rabinovich et al., 2008). But the overall trend among the spermatocyte‐weighed transcript list was downregulation, which together with the histology and flow cytometry data, suggested that the primary cause of the altered transcript levels was the loss of spermatocytes. For instance one of the most downregulated genes in the array was ovo‐like 2 (Ovol2), a gene which is expressed specifically in the XY body of the pachytene spermatocytes (Chizaki et al., 2012).
SC‐associated genes were the largest group in the cell‐type‐weighed analysis of the microarray results. We presumed that these alterations mirrored the reaction of SCs to germ‐cell loss rather than intrinsic cellular events. In the GO term analysis of the SC‐weighed transcript list the altered cellular processes included negative regulation of cellular processes such as apoptosis. This could indicate that the SCs attempted to compensate the loss of SSCs by promoting cell survival. One of the altered SC transcripts was Cxcl12, which promotes primordial germ‐cell homing to the gonad and the establishment of the spermatogonial stem cell niche (Molyneaux et al., 2003; Gilbert et al., 2009; Kanatsu‐Shinohara et al., 2012). The observed enrichment of the immunological response genes was likely to be a consequence of the increased germ‐cell apoptosis observed in the E2F1−/−‐testis. An increased amount of damaged spermatogenic cell products and germ‐cell apoptosis trigger the secretion of inflammatory cytokines by SCs and attract macrophages to the testis (Zhang et al., 2013).
The comparative analysis of the microarray and the RNA‐seq data had some apparent limitations. For instance, some transcripts were classified to clearly erroneous cell types in this analysis. Luteinizing hormone/choriogonadotropin receptor (Lhcgr), which is known to be expressed in exclusively in Leydig cells, could be seen in the spermatocyte population. This example depicts the shortcomings of the experimental and analytical procedures: contamination of unwanted cells in the primary cell extractions or a specificity issue in the differential expression analysis of the RNA‐seq data. Furthermore, the varied transcriptional complexity between the different germ‐cell populations may cause biases in the RNA‐seq‐analysis (Soumillon et al., 2013). Moreover, it would have been ideal if all the samples used in this comparative analysis were from the same time points, since gene expression in spermatogenesis and testicular development is highly dynamic. Future studies taking advantage of ChIP‐seq and mass‐spectrometry to identify direct E2F1 target genes and binding partners in spermatogenesis should further illuminate the function of E2F1 in vivo.
There are complex feedback loops and considerable functional redundancy between the different activator E2Fs in vivo (Chen et al., 2009). In the mouse testis E2F2 and E2F3 have been shown to be partially expressed in the same germ‐cell types as E2F1 (El‐Darwish et al., 2006; Rotgers et al., 2014). To our surprise there were no other E2Fs among the differentially expressed genes in E2F1−/−‐testis. It is possible that the other E2Fs compensate for E2F1 action but not on a transcriptional level. Compound knock‐outs of the different E2Fs in the germ‐cell population would be required to further dissect the role of the different activator E2Fs in the testis.
Altered E2F1 expression levels may also have implications in clinical care. E2F1 is expressed in B spermatogonia and pre‐leptotene and leptotene spermatocytes in the human testis. E2F1 is post‐transcriptionally silenced in the pachytene spermatocytes and GCNIS‐cells in the human testis (Novotny et al., 2007). Furthermore, E2f1 microduplications and microdeletions have been shown to be enriched in men with non‐obstructive azoospermia implying a role for E2F1 in male‐factor infertility (Jorgez et al., 2015).
In summary, we have shown that E2F1 has a complex role in the control of cell cycle during spermatogenesis. E2F1 promotes apoptosis of spermatogonia during the first wave of spermatogenesis, is involved in the maintenance of the SSC pool in the adult and inhibits apoptosis of the meiotic germ cells.
Author Contributions
E. R. designed a part of the experiments, conducted the majority of the experiments, and wrote the manuscript. M. N. took part in the experimental design and revised the manuscript. E. P. conducted some of the sample collection and the morphological study. S. C. M. conducted the flow cytometry experiments. J. T. designed some experiments, was a scientific advisor and revised the manuscript.
Disclosures
The authors have nothing to disclose.
Supporting information
Figure S1. Validation of the microarray results.
Table S1. Antibody information.
Table S2. Primer sequences.
Table S3. Cell‐type‐weighed transcript lists.
Table S4. Transcription factor‐binding site enrichment analysis.
Acknowledgements
We want to thank Dr. Sonia Bourguiba‐Hachemi for conducting the genetic backcrossing of the strains. We acknowledge Ms. Tiina Kyrölä for the care of the animals, Ms. Taija Poikkipuoli, and Ms. Erica Nyman for expertise in histological sample preparation and Mrs. Taina Kirjonen for conducting and helping with the hormone assays. We thank MSc. Jouko Sandholm for invaluable assistance with the flow cytometry study. This work has been funded by the Academy of Finland, Sigrid Jusélius Foundation, and Turku University Hospital special research grants.
References
- Agger K, Santoni‐Rugiu E, Holmberg C, Karlstrom O & Helin K. (2005) Conditional E2F1 activation in transgenic mice causes testicular atrophy and dysplasia mimicking human CIS. Oncogene 24, 780–789. [DOI] [PubMed] [Google Scholar]
- Ashburner M, Ball CA, Blake JA, Botstein D, Butler H, Cherry JM, Davis AP, Dolinski K, Dwight SS, Eppig JT, Harris MA, Hill DP, Issel‐Tarver L, Kasarskis A, Lewis S, Matese JC, Richardson JE, Ringwald M, Rubin GM, Sherlock G. (2000) Gene ontology: tool for the unification of biology. The Gene Ontology Consortium. Nat Genet 25, 25–29. [DOI] [PMC free article] [PubMed] [Google Scholar]
- Baudat F, Manova K, Yuen JP, Jasin M & Keeney S. (2000) Chromosome synapsis defects and sexually dimorphic meiotic progression in mice lacking Spo11. Mol Cell 6, 989–998. [DOI] [PubMed] [Google Scholar]
- Berkovich E & Ginsberg D. (2003) ATM is a target for positive regulation by E2F‐1. Oncogene 22, 161–167. [DOI] [PubMed] [Google Scholar]
- Bieda M, Xu X, Singer MA, Green R & Farnham PJ. (2006) Unbiased location analysis of E2F1‐binding sites suggests a widespread role for E2F1 in the human genome. Genome Res 16, 595–605. [DOI] [PMC free article] [PubMed] [Google Scholar]
- Chen HZ, Tsai SY & Leone G. (2009) Emerging roles of E2Fs in cancer: an exit from cell cycle control. Nat Rev Cancer 9, 785–797. [DOI] [PMC free article] [PubMed] [Google Scholar]
- Chizaki R, Yao I, Katano T, Matsuda T & Ito S. (2012) Restricted expression of Ovol2/MOVO in XY body of mouse spermatocytes at the pachytene stage. J Androl 33, 277–286. [DOI] [PubMed] [Google Scholar]
- Chong JL, Wenzel PL, Saenz‐Robles MT, Nair V, Ferrey A, Hagan JP, Gomez YM, Sharma N, Chen HZ, Ouseph M, Wang SH, Trikha P, Culp B, Mezache L, Winton DJ, Sansom OJ, Chen D, Bremner R, Cantalupo PG, Robinson ML, Pipas JM, Leone G. (2009) E2f1‐3 switch from activators in progenitor cells to repressors in differentiating cells. Nature 462, 930–934. [DOI] [PMC free article] [PubMed] [Google Scholar]
- Costoya JA, Hobbs RM, Barna M, Cattoretti G, Manova K, Sukhwani M, Orwig KE, Wolgemuth DJ & Pandolfi PP. (2004) Essential role of Plzf in maintenance of spermatogonial stem cells. Nat Genet 36, 653–659. [DOI] [PubMed] [Google Scholar]
- El‐Darwish KS, Parvinen M & Toppari J. (2006) Differential expression of members of the E2F family of transcription factors in rodent testes. Reprod Biol Endocrinol 4, 63. [DOI] [PMC free article] [PubMed] [Google Scholar]
- Field SJ, Tsai FY, Kuo F, Zubiaga AM, Kaelin WG Jr, Livingston DM, Orkin SH & Greenberg ME. (1996) E2F‐1 functions in mice to promote apoptosis and suppress proliferation. Cell 85, 549–561. [DOI] [PubMed] [Google Scholar]
- Forges T, Monnier‐Barbarino P, Alberto JM, Gueant‐Rodriguez RM, Daval JL & Gueant JL. (2007) Impact of folate and homocysteine metabolism on human reproductive health. Hum Reprod Update 13, 225–238. [DOI] [PubMed] [Google Scholar]
- Furuchi T, Masuko K, Nishimune Y, Obinata M & Matsui Y. (1996) Inhibition of testicular germ cell apoptosis and differentiation in mice misexpressing Bcl‐2 in spermatogonia. Development 122, 1703–1709. [DOI] [PubMed] [Google Scholar]
- Gaspar‐Maia A, Alajem A, Polesso F, Sridharan R, Mason MJ, Heidersbach A, Ramalho‐Santos J, McManus MT, Plath K, Meshorer E & Ramalho‐Santos M. (2009) Chd1 regulates open chromatin and pluripotency of embryonic stem cells. Nature 460, 863–868. [DOI] [PMC free article] [PubMed] [Google Scholar]
- Gilbert DC, Chandler I, McIntyre A, Goddard NC, Gabe R, Huddart RA & Shipley J. (2009) Clinical and biological significance of CXCL12 and CXCR4 expression in adult testes and germ cell tumours of adults and adolescents. J Pathol 217, 94–102. [DOI] [PubMed] [Google Scholar]
- Haavisto AM, Pettersson K, Bergendahl M, Perheentupa A, Roser JF & Huhtaniemi I. (1993) Endocrinology. 132(4), 1687–1691. [DOI] [PubMed] [Google Scholar]
- Hamer G, Roepers‐Gajadien HL, van Duyn‐Goedhart A, Gademan IS, Kal HB, van Buul PP & de Rooij DG. (2003) Biol Reprod. 68(2), 628–634. [DOI] [PubMed] [Google Scholar]
- Helin K, Lees JA, Vidal M, Dyson N, Harlow E & Fattaey A. (1992) A cDNA encoding a pRB‐binding protein with properties of the transcription factor E2F. Cell 70, 337–350. [DOI] [PubMed] [Google Scholar]
- Hoja MR, Liu JG, Mohammadieh M, Kvist U & Yuan L. (2004) E2F1 deficiency impairs murine spermatogenesis and augments testicular degeneration in SCP3‐nullizygous mice. Cell Death Differ 11, 354–356. [DOI] [PubMed] [Google Scholar]
- Holmberg C, Helin K, Sehested M & Karlstrom O. (1998) E2F‐1‐induced p53‐independent apoptosis in transgenic mice. Oncogene 17, 143–155. [DOI] [PubMed] [Google Scholar]
- Huhtaniemi I, Nikula H & Rannikko S. (1985) Treatment of prostatic cancer with a gonadotropin‐releasing hormone agonist analog: acute and long term effects on endocrine functions of testis tissue. J Clin Endocrinol Metab 61, 698–704. [DOI] [PubMed] [Google Scholar]
- Jahnukainen K, Chrysis D, Hou M, Parvinen M, Eksborg S & Soder O. (2004) Increased apoptosis occurring during the first wave of spermatogenesis is stage‐specific and primarily affects midpachytene spermatocytes in the rat testis. Biol Reprod 70, 290–296. [DOI] [PubMed] [Google Scholar]
- Johnson DG, Schwarz JK, Cress WD & Nevins JR. (1993) Expression of transcription factor E2F1 induces quiescent cells to enter S phase. Nature 365, 349–352. [DOI] [PubMed] [Google Scholar]
- Jorgez CJ, Wilken N, Addai JB, Newberg J, Vangapandu HV, Pastuszak AW, Mukherjee S, Rosenfeld JA, Lipshultz LI & Lamb DJ. (2015) Genomic and genetic variation in E2F transcription factor‐1 in men with nonobstructive azoospermia. Fertil Steril 103, 44–52.e1. [DOI] [PMC free article] [PubMed] [Google Scholar]
- Kaelin WG Jr, Krek W, Sellers WR, DeCaprio JA, Ajchenbaum F, Fuchs CS, Chittenden T, Li Y, Farnham PJ & Blanar MA. (1992) Expression cloning of a cDNA encoding a retinoblastoma‐binding protein with E2F‐like properties. Cell 70, 351–364. [DOI] [PubMed] [Google Scholar]
- Kallio MA, Tuimala JT, Hupponen T, Klemela P, Gentile M, Scheinin I, Koski M, Kaki J & Korpelainen EI. (2011) Chipster: user‐friendly analysis software for microarray and other high‐throughput data. BMC Genom 12, 507. [DOI] [PMC free article] [PubMed] [Google Scholar]
- Kanatsu‐Shinohara M, Inoue K, Takashima S, Takehashi M, Ogonuki N, Morimoto H, Nagasawa T, Ogura A & Shinohara T. (2012) Reconstitution of mouse spermatogonial stem cell niches in culture. Cell Stem Cell 11, 567–578. [DOI] [PubMed] [Google Scholar]
- Knudson CM, Tung KS, Tourtellotte WG, Brown GA & Korsmeyer SJ. (1995) Bax‐deficient mice with lymphoid hyperplasia and male germ cell death. Science 270, 96–99. [DOI] [PubMed] [Google Scholar]
- Lam I & Keeney S. (2014) Mechanism and regulation of meiotic recombination initiation. Cold Spring Harb Perspect Biol 7 (1):a016634. doi:10.1101/cshperspect.a016634. [DOI] [PMC free article] [PubMed] [Google Scholar]
- Lin WC, Lin FT & Nevins JR. (2001) Selective induction of E2F1 in response to DNA damage, mediated by ATM‐dependent phosphorylation. Genes Dev 15, 1833–1844. [PMC free article] [PubMed] [Google Scholar]
- Love MI, Huber W, Anders S. Moderated estimation of fold change and dispersion for RNA‐seq data with DESeq2. Genome Biology 2014. 15:550 http://dx.doi.org/10.1186/s13059-014-0550-8. [DOI] [PMC free article] [PubMed] [Google Scholar]
- Molyneaux KA, Zinszner H, Kunwar PS, Schaible K, Stebler J, Sunshine MJ, O'Brien W, Raz E, Littman D, Wylie C & Lehmann R. (2003) The chemokine SDF1/CXCL12 and its receptor CXCR4 regulate mouse germ cell migration and survival. Development 130, 4279–4286. [DOI] [PubMed] [Google Scholar]
- Nalam RL, Andreu‐Vieyra C, Braun RE, Akiyama H & Matzuk MM. (2009) Retinoblastoma protein plays multiple essential roles in the terminal differentiation of Sertoli cells. Mol Endocrinol 23, 1900–1913. [DOI] [PMC free article] [PubMed] [Google Scholar]
- Novotny GW, Sonne SB, Nielsen JE, Jonstrup SP, Hansen MA, Skakkebaek NE, Rajpert‐De Meyts E, Kjems J & Leffers H. (2007) Translational repression of E2F1 mRNA in carcinoma in situ and normal testis correlates with expression of the miR‐17‐92 cluster. Cell Death Differ 14, 879–882. [DOI] [PubMed] [Google Scholar]
- Osterlund C, Tohonen V, Forslund KO & Nordqvist K. (2000) Mage‐b4, a novel melanoma antigen (MAGE) gene specifically expressed during germ cell differentiation. Cancer Res 60, 1054–1061. [PubMed] [Google Scholar]
- Pfaffl MW. (2001) A new mathematical model for relative quantification in real‐time RT‐PCR. Nucleic Acids Res 29, e45. [DOI] [PMC free article] [PubMed] [Google Scholar]
- Polager S & Ginsberg D. (2009) p53 and E2f: partners in life and death. Nat Rev Cancer 9, 738–748. [DOI] [PubMed] [Google Scholar]
- Rabinovich A, Jin VX, Rabinovich R, Xu X & Farnham PJ. (2008) E2F in vivo binding specificity: comparison of consensus versus nonconsensus binding sites. Genome Res 18, 1763–1777. [DOI] [PMC free article] [PubMed] [Google Scholar]
- Rodriguez I, Ody C, Araki K, Garcia I & Vassalli P. (1997) An early and massive wave of germinal cell apoptosis is required for the development of functional spermatogenesis. EMBO J 16, 2262–2270. [DOI] [PMC free article] [PubMed] [Google Scholar]
- Roider HG, Manke T, O'Keeffe S, Vingron M & Haas SA. (2009) PASTAA: identifying transcription factors associated with sets of co‐regulated genes. Bioinformatics 25, 435–442. [DOI] [PMC free article] [PubMed] [Google Scholar]
- Romanienko PJ & Camerini‐Otero RD. (2000) The mouse Spo11 gene is required for meiotic chromosome synapsis. Mol Cell 6, 975–987. [DOI] [PubMed] [Google Scholar]
- Rotgers E, Rivero‐Muller A, Nurmio M, Parvinen M, Guillou F, Huhtaniemi I, Kotaja N, Bourguiba‐Hachemi S & Toppari J. (2014) Retinoblastoma protein (RB) interacts with E2F3 to control terminal differentiation of Sertoli cells. Cell Death Dis 5, e1274. [DOI] [PMC free article] [PubMed] [Google Scholar]
- Rotgers E, Cisneros‐Montalvo S, Jahnukainen K, Sandholm J, Toppari J & Nurmio M. (2015) A detailed protocol for a rapid analysis of testicular cell populations using flow cytometry. Andrology 3(5), 947–955. [DOI] [PMC free article] [PubMed] [Google Scholar]
- Russell LD, Ettlin RA, Sinha Hikim AP & Clegg ED. (1990) Histological and Histopathological Evaluation of the Testis. Cache River Press, Clearwater, Fl, USA. [Google Scholar]
- Shaha C, Tripathi R & Mishra DP. (2010) Male germ cell apoptosis: regulation and biology. Philos Trans R Soc Lond B Biol Sci 365, 1501–1515. [DOI] [PMC free article] [PubMed] [Google Scholar]
- Shan B, Zhu X, Chen PL, Durfee T, Yang Y, Sharp D & Lee WH. (1992) Molecular cloning of cellular genes encoding retinoblastoma‐associated proteins: identification of a gene with properties of the transcription factor E2F. Mol Cell Biol 12, 5620–5631. [DOI] [PMC free article] [PubMed] [Google Scholar]
- Soumillon M, Necsulea A, Weier M, Brawand D, Zhang X, Gu H, Barthes P, Kokkinaki M, Nef S, Gnirke A, Dym M, de Massy B, Mikkelsen TS & Kaessmann H. (2013) Cellular source and mechanisms of high transcriptome complexity in the mammalian testis. Cell Rep 3, 2179–2190. [DOI] [PubMed] [Google Scholar]
- Supek F, Bosnjak M, Skunca N & Smuc T. (2011) REVIGO summarizes and visualizes long lists of gene ontology terms. PLoS ONE 6, e21800. [DOI] [PMC free article] [PubMed] [Google Scholar]
- van Casteren JI, Schoonen WG & Kloosterboer HJ. (2000. Apr) Biol Reprod. 62(4), 886–894. [DOI] [PubMed] [Google Scholar]
- Wang F, Flanagan J, Su N, Wang LC, Bui S, Nielson A, Wu X, Vo HT, Ma XJ & Luo Y. (2012) RNAscope: a novel in situ RNA analysis platform for formalin‐fixed, paraffin‐embedded tissues. J Mol Diagn 14, 22–29. [DOI] [PMC free article] [PubMed] [Google Scholar]
- Yamasaki L, Jacks T, Bronson R, Goillot E, Harlow E & Dyson NJ. (1996) Tumor induction and tissue atrophy in mice lacking E2F‐1. Cell 85, 537–548. [DOI] [PubMed] [Google Scholar]
- Yan W, Huang JX, Lax AS, Pelliniemi L, Salminen E, Poutanen M & Toppari J. (2003) Overexpression of Bcl‐W in the testis disrupts spermatogenesis: revelation of a role of BCL‐W in male germ cell cycle control. Mol Endocrinol 17, 1868–1879. [DOI] [PubMed] [Google Scholar]
- Yoshida S, Sukeno M, Nakagawa T, Ohbo K, Nagamatsu G, Suda T & Nabeshima Y. (2006) The first round of mouse spermatogenesis is a distinctive program that lacks the self‐renewing spermatogonia stage. Development 133, 1495–1505. [DOI] [PubMed] [Google Scholar]
- Zhang X, Wang T, Deng T, Xiong W, Lui P, Li N, Chen Y & Han D. (2013) Damaged spermatogenic cells induce inflammatory gene expression in mouse Sertoli cells through the activation of Toll‐like receptors 2 and 4. Mol Cell Endocrinol 365, 162–173. [DOI] [PubMed] [Google Scholar]
Associated Data
This section collects any data citations, data availability statements, or supplementary materials included in this article.
Supplementary Materials
Figure S1. Validation of the microarray results.
Table S1. Antibody information.
Table S2. Primer sequences.
Table S3. Cell‐type‐weighed transcript lists.
Table S4. Transcription factor‐binding site enrichment analysis.