Abstract
Emerging evidence suggests that endocytic trafficking of adhesion proteins plays a crucial role in neuronal migration during neocortical development. However, molecular insights into these processes remain elusive. Here, we study the early endosomal protein Smad anchor for receptor activation (SARA) in the developing mouse brain. SARA is enriched at the apical endfeet of radial glia of the neocortex. Although SARA knockdown did not lead to detectable neurogenic phenotypes, SARA-suppressed neurons exhibited impaired orientation and migration across the intermediate zone. Mechanistically, we show that SARA knockdown neurons exhibit increased surface expression of the L1 cell adhesion molecule. Neurons ectopically expressing L1 phenocopy the migration and orientation defects caused by SARA knockdown and display increased contact with neighboring neurites. L1 knockdown effectively rescues SARA suppression-induced phenotypes. SARA knockdown neurons eventually overcome their migration defect and enter later into the cortical plate. Nevertheless, these neurons localize at more superficial cortical layers than their control counterparts. These results suggest that SARA regulates the orientation, multipolar-to-bipolar transition and the positioning of cortical neurons via modulating surface L1 expression.
KEY WORDS: SARA, Zfyve9, L1CAM, Endosomal trafficking, Cortical neuron migration, Adhesion
Summary: Early endosome protein SARA regulates the surface distribution of L1, which, in turn, affects cell adhesion and migration of cortical neurons.
INTRODUCTION
During embryonic corticogenesis, radial glia (RG) cells divide symmetrically to produce two identical daughter RG at the ventricular zone (VZ). Alternatively, RG divide asymmetrically to produce an RG cell and an intermediate basal progenitor. In turn, basal progenitors predominantly generate neurons (Taverna et al., 2014). Newborn neurons migrate radially to the cortical plate (CP) after temporally halting in the intermediate zone (IZ). These neurons mainly become projection neurons by extending axon processes tangentially across the IZ (Noctor et al., 2004). The final laminar cortical layers are formed ‘inside-out'. Later-born neurons migrate past the earlier born neurons, and hence older neurons are situated deeper in the cerebral cortex than younger neurons (Hatanaka et al., 2004).
Neuron migration requires the concerted establishment of traction force by forming attachments between the leading processes (LPs) and the extracellular matrix (ECM) and/or neighboring cells, as well as detachment at the cell rear (Elias et al., 2007; Jossin and Cooper, 2011; Shieh et al., 2011). Emerging evidence shows that perturbing components crucial for endocytic trafficking (e.g. Rab5, Rab11, dynamin, clathrin) leads to impaired cortical neuron migration by altering the surface distribution of adhesion molecules (e.g. N-cadherin, β1-integrin) (Shieh et al., 2011; Kawauchi et al., 2010).
L1 (L1CAM) is a cell adhesion molecule best known for its importance in axon growth, guidance and fasciculation (Kamiguchi et al., 1998). Recent studies showed that L1 suppression also disrupts the radial locomotion of cortical neurons (Kishimoto et al., 2013). Mutations in the L1 gene have been linked to hydrocephalus in several human congenital brain disorders (Kamiguchi et al., 1998; Weller and Gärtner, 2001). In vitro studies have shown that axonal plasma membrane expression of L1 is tightly regulated by a transcytotic pathway (Wisco et al., 2003; Yap et al., 2008). However, little is known about the mechanisms underlying the surface expression of L1 in vivo and its physiological relevance during cortical development.
Smad anchor for receptor activation (SARA; also known as Zfyve9) is an early endosome (EE) protein that acts as a downstream effector of Rab5-mediated EE fusion (Hu et al., 2002). Like overexpression of constitutively active Rab5, overexpression of SARA also causes the enlargement of EEs (Itoh et al., 2002; Seet and Hong, 2001). Furthermore, SARA has been shown to be involved in the vesicular trafficking of a variety of proteins, including Delta, Notch, uninflatable, rhodopsin, transferrin and Smad (Coumailleau et al., 2009; Loubéry et al., 2014; Chuang et al., 2007; Hu et al., 2002; Tsukazaki et al., 1998). A recent report revealed that SARA is unequally distributed to the two daughter cells of zebrafish spinal cord neural precursor cells that undergo asymmetric division, and that the expression level of SARA plays a determining role in the cell fate of the daughter cells (Kressmann et al., 2015). In the present study, we investigate the expression level and function of SARA during cortical development of the mouse brain.
RESULTS
SARA distributes equally into apically dividing cells
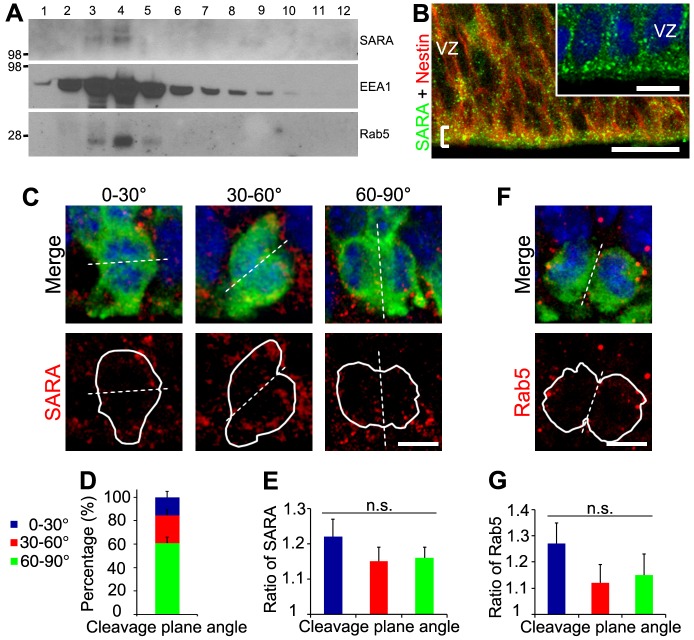
We employed both biochemical and immunohistochemical methods to investigate SARA expression in the developing mouse neocortex. In velocity gradient density fractions of embryonic day (E) 15 mouse brains, SARA was co-enriched with two other EE markers: EEA1 and Rab5 (Fig. 1A). In E15 mouse cortical slices, SARA immunofluorescence appeared in bright puncta throughout all layers. SARA is particularly enriched in the apical endfeet of nestin-labeled RG at the ventricle borders (Fig. 1B).
Fig. 1.
The expression pattern of the EE protein SARA in developing neocortex and its distribution in dividing apical progenitors. (A) E15.5 mouse brains were homogenized and sedimented on a 5-20% linear sucrose gradient. Equal amounts of each fraction were immunoblotted with the indicated antibodies. Marker size (kDa) is indicated on the left. (B) Confocal images of the ventricular surface of E15.5 mouse neocortical slices double labeled for SARA and nestin. A bracket marks the ventricular border. The inset shows a magnified view of SARA labeling. (C) Confocal images of dividing RG of E15.5 cortex expressing GFP (green) and labeled for endogenous SARA (red) classified according to their cleavage plane angle. DAPI is in blue. Dashed line depicts the cleavage plane. White solid lines outline the borders of dividing cell pairs. (D) Percentage of GFP-labeled dividing cells with vertical (60°-90°), intermediate (30°-60°) or horizontal (0°-30°) cleavage plane. Error bars indicate s.e.m. (E) Mean ratios of SARA endosomal distribution between diving cell pairs classified according to their cleavage plane angle. A ratio close to 1 indicates a comparable distribution of SARA between dividing cells. Data are means±s.e.m. P=0.58, one-way ANOVA. n=51 cells from three brains. (F) Representative image of a GFP-expressing dividing pair (green) labeled for endogenous Rab5 (red) at E15.5. DAPI is in blue. (G) Mean ratios of Rab5 endosomal distribution between diving cell pairs classified according to their cleavage plane angle. Data are means±s.e.m. P=0.33, one-way ANOVA. n=21 cells from three brains. Scale bars: 20 µm in B, 10 µm in inset; 5 µm in C,F.
We then determined whether SARA distributes equally into the daughters of apically dividing RG. We identified mitotic cell pairs in cortical slices of brains, which had been transfected at E13.5 with GFP by means of in utero electroporation (IUE), that exhibited characteristic condensed chromatin. Cortical slices were subjected to immunolabeling for endogenous SARA 40 h after transfection (Fig. 1C). To determine if the symmetrical or asymmetrical modes of divisions affected SARA distribution among the two daughter cells we measured their cleavage plane angle. As expected (Haydar et al., 2003), most apically diving cells presented a vertical cleavage plane (60-90°) relative to the horizontal ventricle border (Fig. 1D). We assessed SARA fluorescence intensity in each daughter cell and a ratio was calculated between cell pairs. Endosomes positive for SARA expression segregated similarly along all the focal planes (Fig. S1). For the three cleavage plane categories, SARA+ EEs were roughly equally distributed among the two cells with a ratio close to 1 (Fig. 1E). A similar analysis for Rab5 also points to a symmetrical distribution in apically dividing cells (Fig. 1F,G).
SARA in mammalian neurogenesis
To investigate the function of SARA in RG, we performed loss-of-function analysis by delivering a plasmid encoding both SARA short-hairpin (sh) RNA (SARAsh) and GFP into E13.5 cortex. Scrambled control shRNA (Ctrolsh) provided a control. The knockdown (KD) effect in SARAsh was previously validated (Chuang et al., 2007; Arias et al., 2015) and confirmed by SARA immunohistochemistry in transfected cortical slices (Fig. S2A).
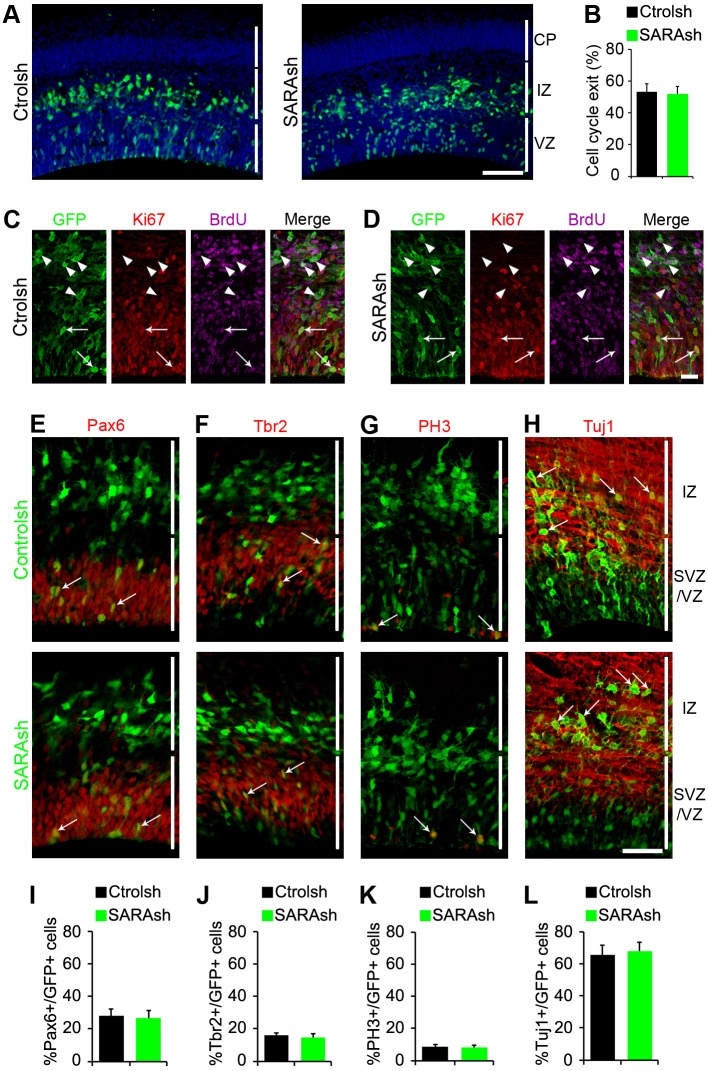
The distribution patterns of cells transfected with Ctrolsh or SARAsh were comparable in brains harvested 40 h after electroporation (Fig. 2A). To further test whether SARA plays a role in neurogenesis, we performed a cell cycle exit analysis. A single pulse of BrdU was given to mice 24 h after IUE, and the brain slices harvested 24 h later were immunolabeled for Ki67 and BrdU (Fig. 2C,D). The cell cycle exit index was similar between cells transfected with Ctrolsh or with SARAsh (Fig. 2B).
Fig. 2.
SARA is dispensable for neurogenesis and daughter cell fate. (A) Mouse brain slices electroporated at E13.5 with Ctrolsh or SARAsh and harvested 40 h later. (B-D) Cell cycle exit analysis. (B) Percentage of GFP+ BrdU+ Ki67− cells among total GFP+ BrdU+ cells (cell cycle exit index). Data are means±s.e.m. P=0.84, t-test. At least 112 cells from three brains were counted for each condition. (C,D) Representative confocal microscopy images of transfected mouse cortical slices subjected to cell cycle exit analysis. GFP+ cells (green) 24 h after BrdU treatment (magenta) and stained with antibodies against Ki67 (red). Arrowheads point to cells positive for GFP and BrdU but negative for Ki67. Arrows point to cells positive for GFP, BrdU and Ki67. (E-H) Mouse brain slices electroporated at E13.5 with Ctrolsh or SARAsh and harvested 40 h later were co-labeled for Pax6, Tbr2, PH3 or Tuj1 (red). (I-L) Percentage of GFP+ cells transfected with the indicated plasmids that were positive for Pax6 (I), Tbr2 (J), PH3 (K) and Tuj1 (L). Data are mean±s.e.m. At least three brains were analyzed for each condition. No significant difference was found between transfections for the indicated immunolabelings: P=0.83 (I), P=0.44 (J), P=0.78 (K) and P=0.82 (L), t-tests. Scale bars: 100 µm in A; 20 µm in C,D; 50 µm in E-H.
Furthermore, SARAsh transfection did not affect the expression pattern or number of Pax6-labeled apical progenitors and Tbr2 (Eomes)-labeled basal progenitors (Fig. 2E,F,I,J). The fraction of mitotic [phospho-histone H3 (PH3)-positive] cells was indistinguishable between Ctrolsh and SARAsh transfections(Fig. 1G,K). Similar to Ctrolsh-transfected brain slices, the expression of SARAsh did not alter the organization of RG processes as revealed by nestin immunostaining (Fig. S2B). Finally, SARAsh-transfected cells were able to reach the IZ and display the neuron marker Tuj1 (Tubb3) to a similar extent as control cells (Fig. 2H,L; Fig. S2C). These data derived from our KD experiments suggest that SARA is dispensable for the proliferation and differentiation of RG progenitors.
SARA suppression leads to a neuronal migration delay in the IZ
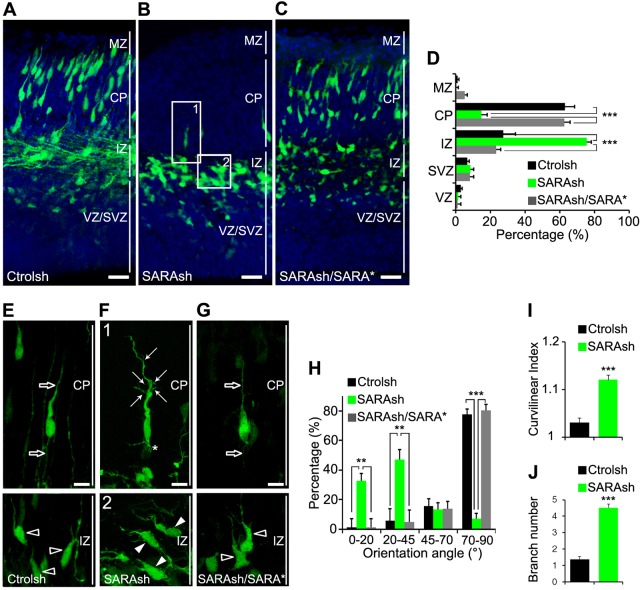
We next examined brains 3 days after transfection and found that the large majority of control neurons (>60%) had migrated into the CP (Fig. 3A,D). By contrast, only ∼14% of SARA-suppressed neurons had migrated into the CP; instead, a significantly higher fraction (∼75%) remained in the IZ (Fig. 3B,D).
Fig. 3.
SARA is important for neuronal orientation and migration in the developing neocortex. (A-C) Confocal micrographs of cortical slices electroporated at E13.5 with Ctrolsh (A), SARAsh (B) or SARAsh/SARA* (C) plasmids and harvested 3 days later. Blue, DAPI. (D) The percentage of transfected cells in different cortical regions with the indicated plasmids. MZ, marginal zone; CP, cortical plate; IZ, intermediate zone; SVZ, subventricular zone; VZ, ventricular zone. Data are means±s.e.m. n=3 (Ctrolsh, SARAsh/SARA*) or n=4 (SARAsh) brains. ***P<0.0001, one-way ANOVA. (E-G) High-magnification images of Ctrolsh (E), SARAsh (F) and SARAsh/SARA* (G) transfected neurons at the IZ and the CP. Open arrows (E,G) point to the single linear LP and trailing process of a control neuron at the CP. Open arrowheads (E,G) point to IZ-localized control neurons that typically exhibit a pia-directed orientation. (F) High-magnification images of the boxed areas (1 and 2) in B. Arrows and asterisk (F) point to abnormally branched leading and trailing processes, respectively. Arrowheads (F) point to IZ-localized SARAsh-transfected neurons that had both soma and LPs tilted from the pia-directed (vertical) angle. (H) Percentage of neurons expressing either Ctrolsh (n=3 brains), SARAsh (n=4 brains) or SARAsh/SARA* (n=3 brains) classified according to their orientation angle; taking the ventricular border as the horizontal plane with an angle of 0°. For this quantification, only bipolar neurons with a clear LP, which is morphologically distinct from other minor processes observed in multipolar neurons, were considered. Over 300 cells were counted from at least three brains. Data are means±s.e.m. **P<0.01, ***P<0.0001, one-way ANOVA. (I,J) Quantification of the curvilinear index (I) and branch number (J) for the LPs of neurons transfected with the indicated plasmids. Data are means±s.e.m. ***P<0.001, t-test. Scale bars: 50 µm in A-C; 10 µm in E-G.
Increased apoptosis is unlikely to explain the reduced number of SARA KD neurons at the CP because the number of cells expressing cleaved PARP (Fig. S3A,B), a main target of active caspase 3 (Tewari et al., 1995), was similar in the control and SARAsh-transfected brains.
At this developmental stage, the large majority (∼74%) of control neurons, either in the IZ or CP, had already developed a bipolar morphology with a pia-directed LP. The orientation of the LPs was mostly between 75° and 90° relative to the ventricle border (Fig. 3A,E,H). By contrast, most SARAsh-transfected neurons in the IZ were tilted: ∼30% angled 0°-20° and ∼50% angled 20°-45° (Fig. 3B,H, arrowheads in box 2 of F). Although ∼6% of SARA-suppressed neurons developed a vertical angle, both the LPs and trailing processes of these neurons were abnormally curved and branched (Fig. 3B,I,J, arrows in box 1 of F).
To rule out off-target effects of SARAsh, we showed that cells transfected with the rescue plasmid SARAsh/SARA*, which encodes SARAsh, shRNA-resistant SARA (from cDNA) and GFP, were able to reach the CP and displayed rather normal looking, pia-oriented LPs (Fig. 3C,D,G). These results suggest that the SARA KD-mediated phenotypes are specific.
The migration defect of SARA-suppressed neurons was unlikely to be due to defective polarity. This is supported by the finding that the large majority (∼90%) of SARAsh-transfected cells had their γ-tubulin-labeled centrosome localized normally between the nucleus and the LP, indicating a largely intact internal polarity (Fig. S3C).
SARA KD increases surface L1 and affects cell adhesion
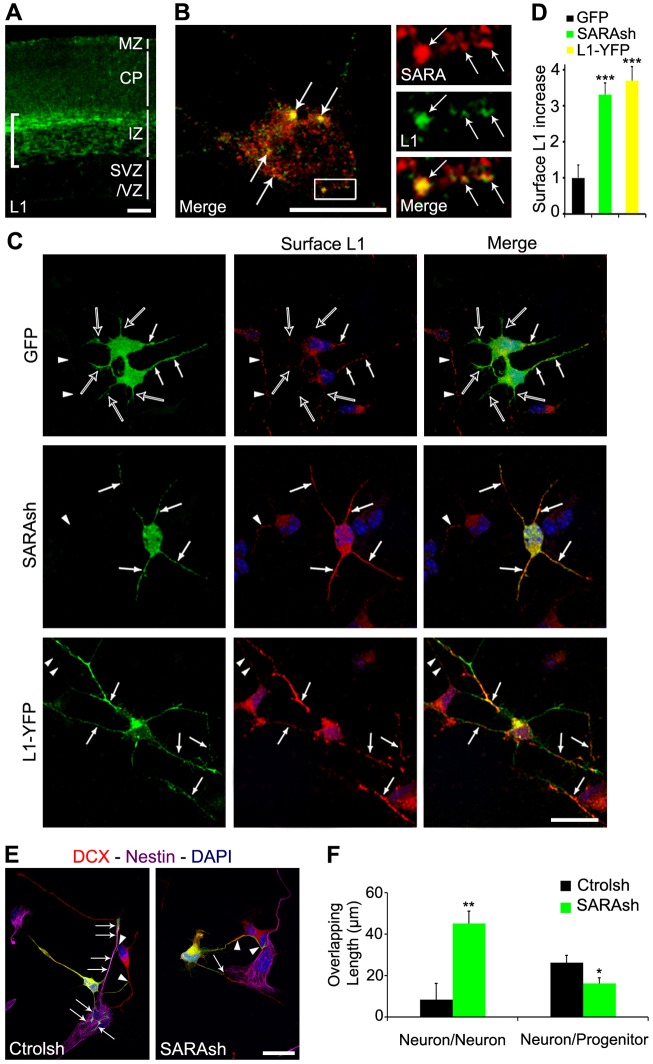
Previous studies showed that L1 KD neurons exhibit migration defects (Kishimoto et al., 2013) similar to SARA KD neurons. In E16.5 mouse cortex, L1 was abundantly expressed on the axonal tracks that are tangentially distributed along the IZ (Fig. 4A), as expected (Fushiki and Schachner, 1986; Chung et al., 1991). Weak L1 signal was also detected in the CP and marginal zone (MZ), and little or no L1 was detectable in the VZ and subventricular zone (SVZ).
Fig. 4.
Cortical neuron expression of L1 and its relationship with SARA. (A) Immunolabeling of E16.5 cortical slice for endogenous L1. Bracket indicates the intense L1 signal present on the axonal tracks at the IZ. (B) Confocal images of endogenous L1 (green) and SARA (red) immunostaining of cultured neurons at 2 days in vitro (DIV) isolated from E13.5 brains. Enlarged views of the boxed area are shown to the right. Arrows point to colocalization of L1 and SARA. (C) Cortical neurons were isolated from brains transfected with GFP, SARAsh or L1-YFP, cultured for 2 DIV, and immunolabeled for surface L1 under non-permeabilized conditions. Note that surface L1 was predominantly expressed in a single process (white arrows in top row) of GFP-transfected neurons, whereas the remaining processes (open arrows in top row) lacked surface L1. Stronger L1 surface signals were found in multiple processes of SARAsh-transfected and L1-YFP-transfected neurons (arrows in middle and bottom rows). The surface L1 signals were much brighter than those of neighboring non-transfected GFP-negative neurons (arrowheads, middle and bottom rows). (D) Quantification of surface L1 level increase on the processes of neurons transfected with the indicated plasmids. Only neuronal processes with detectable surface L1 were scored. Data are means±s.e.m. ***P<0.0001, one-way ANOVA. At least 15 neurons from three cultures were scored for each condition. (E) Cortical dissociated cells from brains transfected either with Ctrolsh or SARAsh, cultured for 2 DIV, and immunolabeled for the neuronal marker DCX (red) and the progenitor marker nestin (magenta). Arrows point to processes of transfected neurons growing over nestin+ progenitor cells. Arrowheads point to neuronal processes that contact other DCX+ neurons. Under both conditions, the number of neurons and glia remained similar. (F) Quantification of the overlap in length of transfected neurons on either other DCX+ neurons or nestin+ progenitors. Data are means±s.e.m. *P=0.03, **P=0.001, one-way ANOVA. At least 18 neurons from three cultures were scored for each condition. Scale bars: 35 µm in A; 5 µm in B; 10 µm in C; 20 µm in E.
Furthermore, we show that L1 signals were frequently associated with SARA-labeled endosomes in dissociated cortical neurons (Fig. 4B), indicating that L1 is trafficked through SARA-expressing EEs. Consistent with this notion, the surface distribution of L1 in axons is increased in SARA KD neuronal cultures (Arias et al., 2015). Thus, we hypothesized that the SARA KD-induced neuronal migration defect could be related to changes in the surface expression of L1. To test this, we labeled the endogenous surface L1 of neurons isolated from transfected brains. In these experiments, an antibody that specifically recognizes the extracellular domain of L1 was used for immunostaining under non-permeabilizing conditions. Notably, surface L1 was predominantly expressed in a single process (probably the future axon) of GFP-transfected neurons (arrows in Fig. 4C, top). By contrast, increased L1 was apparent on almost all processes of SARAsh-transfected neurons (arrows in Fig. 4C, middle). Quantification studies showed that SARAsh-transfected neurons had ∼3.5-fold more L1 on the plasma membrane of neuronal processes compared with the control GFP-transfected neurons (Fig. 4D). By contrast, the surface expression of β1-integrin in SARA KD neurons was unchanged compared with controls (Fig. S4A,B).
To evaluate whether the increase in surface L1 affects cell adhesion, we examined cortical cells dissociated from brain cortices 2 days after transfection and cultured for an additional 2 days. We used nestin and doublecortin (DCX) antibodies to label progenitor cells and neurons, respectively. We found that neuronal processes extended from control neurons preferentially contacted nestin+ progenitor cells rather than DCX+ neurons (Fig. 4E,F; Fig. S4C). By contrast, SARAsh-transfected neurons preferentially contacted other DCX+ neurons, rather than nestin+ progenitor cells.
L1 suppression rescues the phenotypes caused by SARA KD
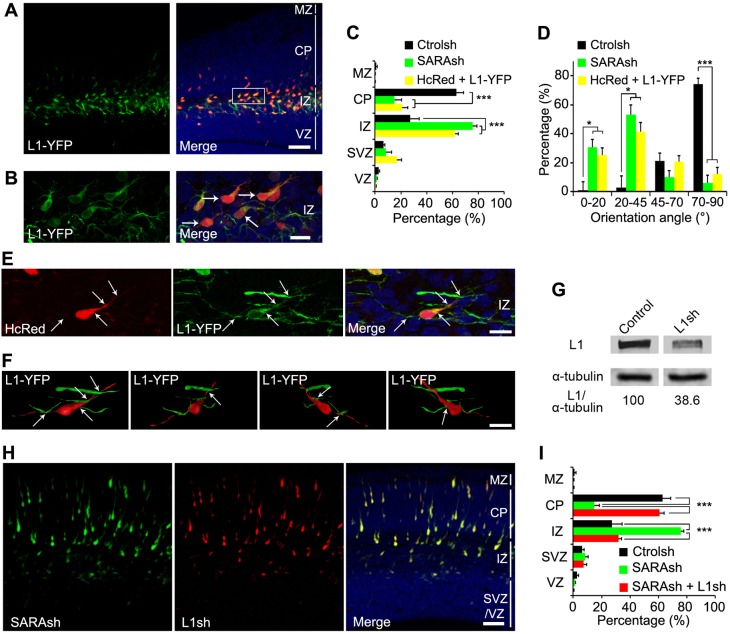
The above results prompted us to hypothesize that the impaired IZ exit of migrating neurons upon SARA suppression is due to elevated L1 surface expression. Consistent with this model, in 3-day transfected brains the majority of neurons overexpressing L1-YFP also failed to reach the CP and were retained in the IZ (Fig. 5A,C). These neurons were horizontally or obliquely aligned, similar to SARA-suppressed neurons (Fig. 5B,D).
Fig. 5.
Functional interaction between L1 and SARA during cortical migration. (A,B) Cortical slices co-transfected with HcRed and L1-YFP at E13.5 and harvested 3 days later; L1-YFP was visualized by GFP immunolabeling. Higher magnification image of the boxed area in A is shown in B. Arrows point to L1-YFP-transfected neurons stalled at the IZ with a tilted orientation. (C) Quantification of transfected cell distribution in different cortical regions. Data are means±s.e.m. n=3 (Ctrolsh), n=4 (SARAsh) or n=6 (HcRed+L1-YFP) brains. ***P<0.0001, one-way ANOVA. (D) The orientation angles of IZ- and CP-localized neurons expressing the indicated plasmids were scored by considering the ventricular border as 0°. Over 300 cells were counted from at least three brains. Data are means±s.e.m. *P<0.05, ***P<0.0001, one-way ANOVA. (E) Enlarged view of an L1-YFP/HcRed-coexpressing neuron at the IZ. Note the multiple contacts with neuronal processes from neighboring cells (arrows). Notably, L1-YFP better labeled the thin processes than did HcRed. These images were rendered into a 3D reconstruction as shown in the first panel of F. (F) Four 3D views of the IZ-localized L1-YFP-transfected neuron (as in E) are shown. For simplicity, only one soma is shown; the somata of neighboring transfected cells were masked. Also see Movie 1, in which all transfected cells are shown. The cell body and its cell processes are pseudocolored in red for a better visualization of cell-neurite and neurite-neurite contact sites (arrows). (G) Validation of L1 KD by L1sh. HEK cells were co-transfected with L1-YFP and mCherry (control) or L1sh/mCherry for 36 h and cell lysates processed for immunoblotting with the indicated antibodies. The signal ratio of L1 to α-tubulin of the control is considered as 100. (H) An example of a brain slice co-transfected with SARAsh and L1sh at E13.5 and harvested 3 days later. (I) The percentage of cells transfected with Ctrolsh, SARAsh or SARAsh together with L1sh that distributed into different cortical regions. Data are means±s.e.m. n=3 (Ctrolsh), n=4 (SARAsh, SARAsh+L1sh) brains. ***P<0.0001, one-way ANOVA. Note that the quantifications of Ctrolsh- and SARAsh-transfected brains correspond to those shown in Fig. 3 and are displayed here for comparison. Scale bars: 50 µm in A,H; 12 µm in B; 10 µm in E,F.
Resembling SARAsh-transfected neurons, the surface L1 signal was similarly increased in multiple processes of L1-YFP-expressing neurons isolated from transfected brains (Fig. 4C,D). Consistently, the ectopically expressed L1-YFP was also prominently detected in the LPs of migrating neurons (arrows, Fig. 5B). 3D rendering of confocal images showed that both the soma and processes of L1-YFP-overexpressing neurons in the IZ made multiple contacts with the processes extended by other transfected neurons (Fig. 5B,E,F; Movie 1), indicating that increased cell-cell contact in these neurons is the result of increased surface L1.
Next, we addressed whether upregulated L1 expression accounts for SARA KD-mediated phenotypes. We generated an L1 shRNA (L1sh)-expressing plasmid and validated its KD effect by immunoblotting of co-transfected L1-YFP cell lines (L1 levels were reduced to below 40% of control levels; Fig. 5G). Similar to previous reports (Kishimoto et al., 2013), neurons transfected for 3 days with our L1sh construct led to migration arrest around the IZ (Fig. S5A,B). Finally, 3-day transfected neurons coexpressing SARAsh and L1sh displayed a vertical orientation and ∼60% of them reached the CP, similarly to Ctrolsh-transfected neurons (Fig. 5H,I). These results suggest that SARA KD-mediated phenotypes can be effectively rescued by simultaneous KD of L1.
SARA is required for the neuronal multipolar-to-bipolar transition
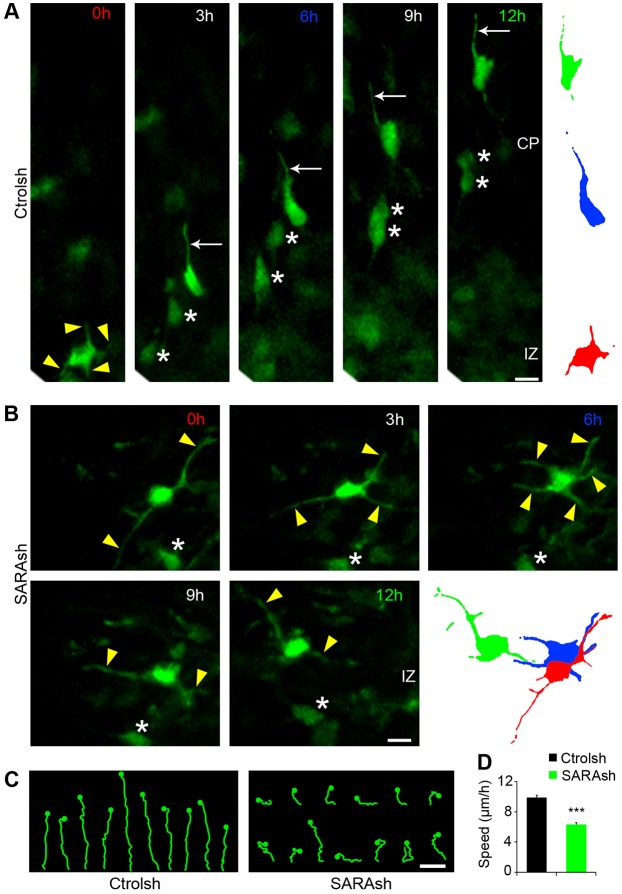
To further delineate the mechanism underlying the SARA KD-mediated neuronal migration defect, we imaged transfected neurons on live brain slices for 12-14 h. As expected (Noctor et al., 2004), multipolar Ctrolsh-transfected neurons exited the IZ, acquired a bipolar morphology with a pia-directed LP and migrated towards the CP (Fig. 6A,C; Movie 2). By contrast, neurons expressing SARAsh exhibited characteristic multipolar dynamics throughout the recording. These neurons constantly extended and retracted their neuronal processes in various directions, and frequently changed orientation (Fig. 6B,C; Movie 3). Almost no SARAsh-transfected cells were able to exit the IZ during the 14 h imaging period. Furthermore, the migration speed of transfected neurons was significantly slower in SARAsh-expressing cells compared with their control counterparts (Fig. 6D).
Fig. 6.
SARA KD cells exhibit impaired multipolar-to-bipolar transition. (A,B) Representative still images from time-lapse recordings tracking electroporated neurons for 12 h. Brains were electroporated with Ctrolsh or SARAsh at E13.5 and processed for slice cultures at E15.5. By the time the imaging experiment started, most neurons had already localized to the SVZ/IZ. Migration trajectories and speed were evaluated from this brain area on. Arrowheads point to neuronal processes of a multipolar neuron. Arrows point to the LP of a control migrating neuron. Asterisks label the soma of other transfected neurons in the same field of view. To the right, traces represent migrating neurons at 0 h (red), 6 h (blue) and 12 h (green). In A, a multipolar (t=0 h) Ctrolsh-transfected neuron acquires a bipolar morphology and migrates into the CP. In B, a SARAsh-transfected neuron displays a multipolar morphology with various processes actively extending and retracting throughout the imaging period. (C) Examples of neuron trajectories for the indicated plasmids. The dots indicate the final soma position at the end of the time-lapse experiment (t=12 h). (D) Quantification of migration speed for Ctrolsh- and SARAsh-transfected neurons. Data are means±s.e.m. ***P<0.0001, t-test. At least 64 neurons were scored for each condition. Scale bars: 10 µm.
SARA KD neurons arrive late at the CP
By examining 5-day transfected brains, we found that both Ctrolsh- and SARAsh-transfected neurons were able to reach the CP with their LPs contacting the MZ (Fig. 7A-C). Immunolabeling of SARAsh-transfected neurons showed that SARA was still knocked down at this time point (Fig. S6A,B). Thus, these results indicate that the delayed IZ exit of SARAsh-transfected neurons was overcome with time. Consistent with retarded migration through the IZ, SARA-suppressed neurons were localized in the more superficial cortical layers relative to Ctrolsh-transfected neurons (Fig. 7B,C). In addition, SARA-suppressed neurons tended to cluster together, presumably due to stronger adhesion.
Fig. 7.
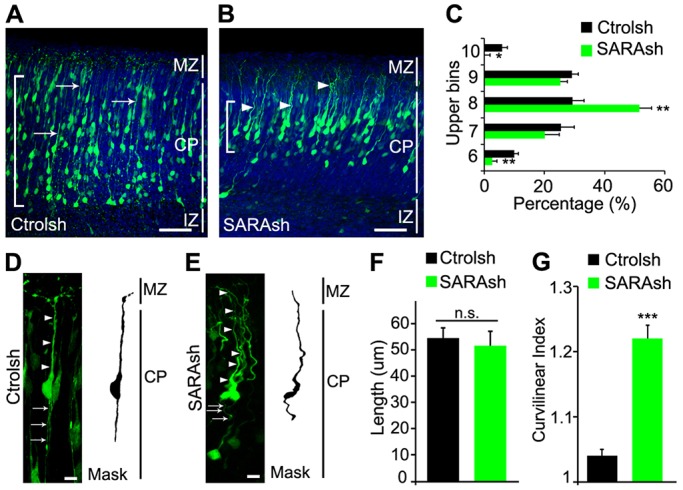
SARA KD cells arrive late at the CP and exhibit aberrant LPs. (A-C) Mouse cortices electroporated at E13.5 with Ctrolsh (A) or SARAsh (B) plasmid and harvested 5 days later. Control neurons have straight, linear LPs (arrows), whereas SARAsh-transfected neurons tend to be nonlinear and undulating (arrowheads). Brackets (A,B) show the cortex area where most transfected cell bodies locate. Cortices were divided into ten equally sized bins and the percentage of cells in each bin was scored; only the upper bins (6-10) contained transfected cells, and their percentages are shown in C. Data are means±s.e.m. n=3 brains for each condition. *P<0.05, **P<0.001, one-way ANOVA. (D,E) High-magnification images of 5-day transfected neurons. Arrowheads and arrows point to LPs and trailing processes, respectively. (F) Quantification of LP length of neurons transfected with the indicated plasmids. Data are means±s.e.m. P=0.62, t-test. (G) Quantification of curvilinear index for the LP of neurons transfected with the indicated plasmids. Data are means±s.e.m. ***P<0.0001, t-test. At least 19 neurons from three brains were scored for each condition. Scale bars: 50 µm in A,B; 10 µm in D,E.
Notably, the LPs of both control and SARA-suppressed neurons reached the MZ (Fig. 7D,E). Despite their similarity in length (Fig. 7F), the LPs of SARAsh-transfected neurons exhibited a greater curvature than those of controls (Fig. 7D,E), as reflected in a statistically significant difference in the curvilinear index (Fig. 7G). These results suggest that SARA is important for timely migration and correct positioning in the CP and for the LP morphogenesis of cortical projection neurons.
SARA KD neurons distribute to superficial layers in the postnatal cortex
We next evaluated whether the delayed migration of SARA KD neurons affected later corticogenesis. We studied transfected brains at postnatal day (P) 15, by which time neuronal migration is largely completed (Molyneaux et al., 2007). At this time point, SARA KD neurons were distributed to more superficial layers compared with control neurons (Fig. 8A,B). Using layer-specific markers, we found that ∼70% of Ctrolsh-expressing cells localized to the deep (V and VI) layers that expressed Ctip2 (Bcl11b), whereas a minor fraction expressed the upper-layer (II-IV) marker Cux1 (Fig. 8C). By contrast, the large majority of SARA KD neurons mapped to Cux1+ layers II-IV. Consistently, relative to the controls, the fraction of SARA KD neurons positive for Ctip2 and Cux1 decreased and increased, respectively (Fig. 8D). At P15 we did not detect any major differences in apical dendrite morphology between Ctrolsh- and SARAsh-transfected cells (not shown).
Fig. 8.
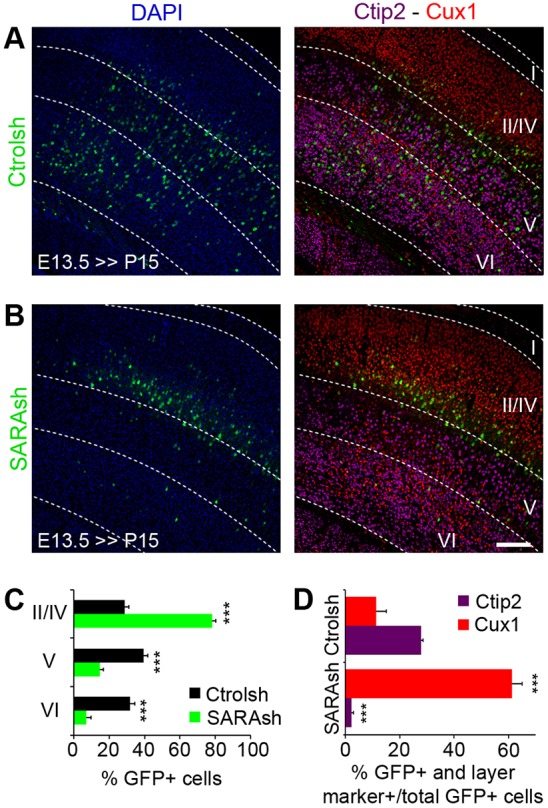
SARA is involved in neuronal CP positioning. (A,B) Mouse cortical slices electroporated at E13.5 with Ctrolsh (A) or SARAsh (B) plasmid were harvested at P15 and counterstained for layer-specific markers Ctip2 (magenta) and Cux1 (red). DAPI, blue. (C) Quantification of neurons transfected with the indicated plasmids in the different cortical layers. (D) Fraction of transfected cells positive for Ctip2 or Cux1 marker among total transfected cells. Data are means±s.e.m. ***P<0.0001, t-test. At least 440 cells from three brains were counted for each condition. Scale bar: 200 µm.
These data support the idea that SARA KD causes migration defects that affect laminar cortical layer development in the postnatal brain.
DISCUSSION
SARA is dispensable for the mitosis and neurogenesis of mammalian RG
Previous studies showed that SARA-expressing EEs play an important role in determining asymmetric cell division in Drosophila sensory organ precursor (SOP) cells by modulating Notch-Delta signaling (Coumailleau et al., 2009). However, SARA itself is dispensable for the asymmetric segregation of Delta and Notch and SOP development. Subsequent studies showed that in dividing cells of the zebrafish spinal cord SARA segregates asymmetrically, whereas Rab5 distributes symmetrically. In this model, the daughter cells that inherited more SARA-expressing EEs remain as proliferative progenitors through a Notch-dependent pathway, whereas the daughter cells containing fewer SARA-expressing EEs tend to leave the cell cycle and differentiate into neurons (Kressmann et al., 2015).
Here, we show that in the E15 mouse cortex SARA, as well as Rab5, is roughly equally distributed between the two daughters of a dividing RG cell. Furthermore, the expression patterns of specific markers for neuron, apical progenitor, basal progenitor, and mitotic cells are comparable between SARAsh- and control-transfected brains. Progenitor cell cycle exit is also unaffected after SARA KD. Thus, our results suggest that SARA is not crucial for mitosis and cell fate determination of RG in the developing mouse neocortex. This finding is unexpected given that SARA is enriched in RG apical endfeet, and that Notch is crucial for the asymmetric cell division of rodent RG (Bultje et al., 2009). We cannot completely exclude the possibility that residual SARA in the SARAsh-transfected apical progenitors obscured our detection of its role in neurogenesis. However, we favor a model whereby a redundant endocytic pathway is used to compensate for Notch-mediated asymmetric division when SARA is suppressed in the mammalian neocortex. SARA is a FYVE (Fab1p, YOTB, Vac1p and EEA1) domain-containing protein, several of which, such as EEA1 and Hrs, are also enriched in EEs and have been shown to be involved in endocytic vesicular trafficking (Stenmark and Aasland, 1999; Panopoulou et al., 2002) (see below).
SARA regulates the multipolar-to-bipolar transition and CP positioning
Both the cell distribution and live imaging studies showed that SARA suppression causes a substantial delay in the migration of postmitotic neurons through the IZ. Increased surface expression of L1 is likely to contribute to this phenotype because: (1) SARA KD neurons are stalled at the IZ, a region in which L1 is highly expressed (Fushiki and Schachner, 1986; Chung et al., 1991); (2) overexpression of L1 phenocopies SARA KD phenotypes; and, most importantly, (3) L1 suppression can rescue SARA KD-mediated defects.
The surface level of L1 appears to be tightly regulated during neuronal development: neurons expressing either too little (Kishimoto et al., 2013; Demyanenko et al., 1999) or too much (this work) L1 exhibit impaired migration and morphology/orientation of their LPs. Weakened adhesions may fail to provide sufficient traction force for forward movement, whereas excessive adhesions cause cells (and/or cell processes) to stick to each other and/or ECM, preventing their detachment (Shikanai et al., 2011). L1 is typically enriched on the axonal surface of wild-type neurons (Fig. 9A), but is increasingly expressed on all processes of SARA KD or L1-YFP-overexpressing neurons (Fig. 9B). We showed that SARA-suppressed neurons preferentially adhere to other neurons at the expense of their adhesion to progenitor cells. In vivo, the increased L1 in LPs of migrating neurons might enable preferred binding with neurites of other IZ-localized neurons and/or axonal processes of CP neurons. L1 is a transmembrane protein with extracellular immunoglobulin-like and fibronectin III domains. It may interact with L1 molecules (transhomophilic interaction) or other adhesion molecules such as axonin-1 (contactin 2), integrins and phosphacan (Ptprz1) (transheterophilic interaction) (Kuhn et al., 1991; Yip and Siu, 2001; Milev et al., 1994). Alternatively, L1 can also bind to the ECM. Enhanced adhesion might explain the abnormal orientation of mutant neurons and their reduced migration towards the CP (Fig. 9B).
Fig. 9.
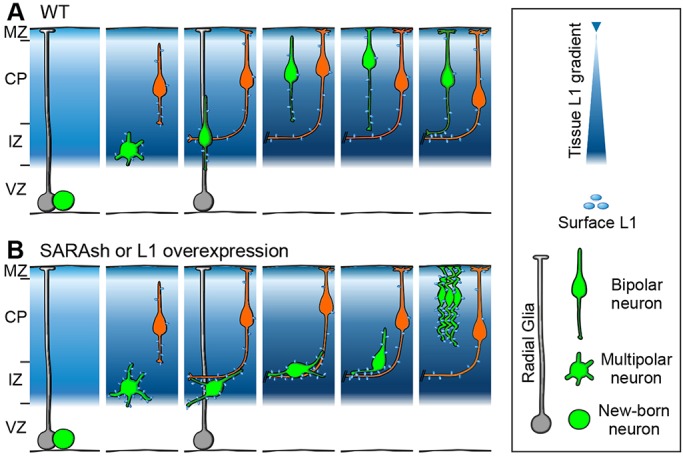
Summary of major findings. Diagrams depict the migration of postmitotic neurons in the developing neocortex. The blue background represents the expression level of L1. The asymmetric division of an RG cell gives rise to one RG cell (gray) with a radial process touching the pial surface, and one neuron (green) with multipolar, and later, bipolar neurites. Intermediate basal progenitors are omitted for simplicity. (A) Wild-type neuron undergoes radial migration through the IZ en route to the CP. (B) SARA-suppressed or L1-overexpressing migrating neurons display disorientated soma/LP, delayed multipolar-to-bipolar transition and IZ crossing. These defects are likely to be due to the increased surface L1 in the LPs, resulting in transhomophilic or transheterophilic (not shown) interaction with tangentially growing axons at the IZ (orange) or other migrating neurons (not shown). SARA-suppressed neurons are eventually able to overcome the IZ retention and reach the more superficial CP layers. The LPs of these neurons appear highly curved, presumably due to increased L1-mediated cell-cell and/or cell-ECM adhesion.
The multipolar-to-bipolar transition is an important step before engaging in RG-guided migration. Namely, multipolar cells in the upper SVZ and lower IZ need to acquire a bipolar morphology in which a stable pia-directed LP heads the migration out of the IZ and into the CP (Kriegstein and Noctor, 2004; LoTurco and Bai, 2006). Our time-lapse experiments revealed that the multipolar-to-bipolar transition is substantially impaired by SARA KD. These neurons consistently drifted randomly at the IZ and exhibited numerous highly dynamic neurites. The SARA KD-induced radial migration defect was partially overcome with time. In line with the idea that SARA-suppressed neurons arrive later at the CP, their somata resided in the most upper cortical layers relative to control neurons.
SARA regulates the surface expression of L1
Although the importance of cytoskeletal and motor proteins (e.g. filamin, LIS1, DCX, RhoA, myosin II, dynein) in neocortical development has been extensively established (Nagano et al., 2004; Tsai et al., 2005, 2007; Bai et al., 2003; Cappello et al., 2012; Solecki et al., 2009), only recently has evidence begun to emerge that endosomal trafficking also participates in guided neuron migration and proper positioning (Shieh et al., 2011; Kawauchi et al., 2010; Zhou et al., 2007). It is well established that internalized surface molecules can either be transported back to the plasma membrane from the EEs via a ‘fast recycling pathway' or through Rab11+ recycling endosomes via a ‘slow recycling pathway' (Maxfield and McGraw, 2004). It is also well known that transferrin and its receptor are trafficked through the slow recycling pathway. SARA has been shown to regulate transferrin recycling; overexpression of SARA significantly delays the recycling of transferrin as well as of transferrin receptor (Hu et al., 2002). However, the level of SARA is not critical for the internalization rate of transferrin.
In cortical neurons, L1 has been shown to be transcytosed from the somatodendritic domain to the axonal plasma membrane through the slow recycling pathway (Wisco et al., 2003). Our unpublished data (Y.-C. Hsu, J.-Z.C. and C.-H.S.) show that recycling endosome genesis requires SARA. Thus, L1 might be shifted to the fast recycling pathway in SARA-suppressed cells, and this might explain its overall increased surface expression. Since only a trace amount of internalized L1 (∼10%) undergoes lysosomal degradation (Schäfer et al., 2010), it is less likely that dysregulated degradation levels accounts for the increased L1 surface expression in SARA KD cells.
Consistent with the role of SARA in Rab5-mediated EE fusion (Hu et al., 2002), SARA KD neurons exhibit branched LPs and migration defects similar to those observed after Rab5 KD (Kawauchi et al., 2010). Rab5 KD phenotypes rely on elevated surface expression of N-cadherin. Although we do not know whether SARA KD also affects N-cadherin expression, surface β1-integrin expression was unchanged in SARA KD neurons. This indicates that the increase in L1 in SARA KD neurons is selective. Our other data suggest that SARA KD phenotypes can be accounted for by the increase in L1. Importantly, elevated L1 expression also explains the neuronal alignment defects observed in SARA KD but not in Rab5 KD (Kawauchi et al., 2010).
In addition to SARA, several other proteins known to be involved in Rab5-mediated EE fusion (e.g. Rabex-5, EHD1/4, EEA1) have been implied in L1 surface recycling (Aikawa, 2012; Yap et al., 2010; Lasiecka et al., 2014). For example, the surface expression of L1 is increased in dendrites of EHD1-overexpressing neurons (Yap et al., 2010). Similar to our current finding, a compensatory mechanism emerges later to alleviate this defect. This redundancy on trafficking regulation reiterates the importance of tight control of the L1 surface level. Notably, L1 is upregulated in post-stroke cortex and has been implicated in axonal regeneration after spinal cord injury (Carmichael et al., 2005; Roonprapunt et al., 2003; Chen et al., 2007). Thus, our finding that SARA regulates the surface expression level of L1 in the cerebral cortex in vivo might be of clinical relevance.
Finally, although highly controversial (Bakkebø et al., 2012; Runyan et al., 2012), SARA has been reported to be important for activation of the TGFβ signaling pathway (Tsukazaki et al., 1998; Itoh et al., 2002). Whether this functional aspect of SARA plays a role in L1 surface expression remains to be investigated.
MATERIALS AND METHODS
DNA constructs and cell line transfection
Expression and shRNA constructs were generated and transfected as described in the supplementary Materials and Methods.
Velocity density gradient sedimentation, protein electrophoresis and immunoblotting assays
Velocity density gradient sedimentation was conducted as previously described (Sachdev et al., 2007). E15.5 mouse brains were harvested and homogenized. The high-speed supernatant fraction was fractionated on a 5-20% linear sucrose gradient in 11 ml Tris-KCl buffer (20 mM Tris pH 7.5, 50 mM KCl, 5 mM MgCl2, 0.5 mM EGTA, 0.5 mM DTT, protease inhibitors) at 32,000 rpm (100,000 g) at 4°C for 16 h. Equal amounts of each fraction were subjected to immunoblotting assays using a standard method and the antibodies described in the supplementary Materials and Methods.
IUE, brain tissue processing and neuron culture
IUE procedures were performed on E13.5 mouse brains as previously described (Li et al., 2011; Artegiani et al., 2012). Briefly, the embryonic ventricles were injected with a mixture of plasmids (2 µg/µl), Fast Green dye and Tris-EDTA buffer. Immediately, three square electric pulses (30 V) were delivered using a BTX electroporator (Harvard Apparatus). Embryos were placed back to their original position and sutured. Female mice were allowed to recover from anesthesia on a warm plate.
For cell cycle exit analysis, pregnant mice (20-30 g) were injected with 1 mg BrdU 24 h after IUE, and fetal brains were harvested 24 h after BrdU treatment. Electroporated brains were harvested at the indicated time points. Embryonic brains were fixed by immersion in 4% paraformaldehyde (PFA) and 0.0125% glutaraldehyde overnight at 4°C, while postnatal animals were transcardially perfused with 4% PFA and brains postfixed by immersion in the same fixative. Brains were embedded in low melting point agarose, and sectioned by vibratome (40 µm). All animal manipulations were performed in accordance with the guidelines for animal experiments at Weill Medical Cornell IACUC, at Instituto M. y M. Ferreyra CICUAL, and Landesdirektion Sachsen.
In some experiments, electroporated brain cortices were dissociated with trypsin, dispersed on poly-L-lysine-coated coverslips (Thermo Scientific) and incubated at 37°C in Neurobasal medium (Gibco) supplemented with B27, N2 and Glutamax (Gibco). For co-culture of primary cortical neurons with nestin+ cells, Neurobasal medium supplemented with 10% horse serum was used. At the indicated time points (2 or 5 days after seeding), cells were fixed with 4% PFA and 4% sucrose in PBS followed by immunolabeling using a standard protocol and antibodies described in the supplementary Materials and Methods. Surface L1 or β1-integrin labeling was conducted similarly, except that Triton X-100 was omitted during the incubation with the primary and secondary antibodies. Cells were then permeabilized with 0.2% Triton X-100 before cytoskeleton counterstaining.
Details of quantitative image analyses, including statistical analysis, are provided in the supplementary Materials and Methods.
Slice culture and time-lapse imaging
Brains were harvested 2 days after electroporation (E15.5) and embedded in low melting point agarose at 37°C. The tissue was immediately sliced at 250 µm with a vibratome. Brain sections were transferred to membrane inserts for 6-well culture plates (BD Falcon), preincubated with 1.5 ml Neurobasal medium supplemented with 10% horse serum and antibiotics. The tissue was allowed to recover and to attach to the insert for 2 h before imaging.
Time-lapse imaging was performed with a Zeiss LSM 780 inverted confocal microscope using a Plan-Apochromat 10× air objective (NA 0.45) and a temperature-controlled incubator (Life Imaging Services), with CO2 set to 5% (Pecon). Stacks were captured every 30 min for 12 h. The migrating neurons were tracked and analyzed with the Manual Tracking plugin in ImageJ (NIH). At least six slices from three independent experiments were analyzed for each condition.
Acknowledgements
We thank the light microscopy facility of the BIOTEC/CRTD for excellent support; H. Kamiguchi (RIKEN, Japan) and D. Carrer (INIMEC-CONICET, Argentina) for reagents; M. Lorenzatti for assistance with Fig. 9; and A. Caceres for discussion.
Footnotes
Competing interests
The authors declare no competing or financial interests.
Author contributions
Conceptualization: I.M., C.-H.S.; Methodology: I.M., J.-Z.C.; Formal analysis and investigation: I.M.; Writing – original draft preparation: I.M.; Writing – review and editing: I.M., C.-H.S.; Funding acquisition: I.M., C.C., C.-H.S., F.C.; Resources: C.C., F.C.; Supervision: C.-H.S., J.-Z.C.
Funding
This work was supported by the National Eye Institute (NEI) of the National Institutes of Health (NIH) [EY11307 and EY016805], Starr Foundation, and Research to Prevent Blindness to C.-H.S. Travel grants from Journal of Cell Science/The Company of Biologists and the International Society for Neurochemistry, and a Consejo Nacional de Investigaciones Científicas y Técnicas (CONICET) fellowship were awarded to I.M. The Center for Regenerative Therapies Dresden, Technische Universität Dresden and Deutsche Forschungsgemeinschaft Collaborative Research Center SFB655 (subproject A20) supported F.C. PICT 2008-0671 from the Ministerio de Ciencia, Tecnología e Innovación Productiva was granted to C.C. Deposited in PMC for release after 12 months.
Supplementary information
Supplementary information available online at http://dev.biologists.org/lookup/doi/10.1242/dev.129338.supplemental
References
- Aikawa Y. (2012). Rabex-5 protein regulates the endocytic trafficking pathway of ubiquitinated neural cell adhesion molecule L1. J. Biol. Chem. 287, 32312-32323. 10.1074/jbc.M112.374322 [DOI] [PMC free article] [PubMed] [Google Scholar]
- Arias C. I., Siri S. O. and Conde C. (2015). Involvement of SARA in axon and dendrite growth. PLoS ONE 10, e0138792 10.1371/journal.pone.0138792 [DOI] [PMC free article] [PubMed] [Google Scholar]
- Artegiani B., Lange C., Calegari F. (2012). Expansion of embryonic and adult neural stem cells by in utero electroporation or viral stereotaxic injection. J. Vis. Exp. e4093 10.3791/4093 [DOI] [PMC free article] [PubMed] [Google Scholar]
- Bai J., Ramos R. L., Ackman J. B., Thomas A. M., Lee R. V. and LoTurco J. J. (2003). RNAi reveals doublecortin is required for radial migration in rat neocortex. Nat. Neurosci. 6, 1277-1283. 10.1038/nn1153 [DOI] [PubMed] [Google Scholar]
- Bakkebø M., Huse K., Hilden V. I., Forfang L., Myklebust J. H., Smeland E. B. and Oksvold M. P. (2012). SARA is dispensable for functional TGF-β signaling. FEBS Lett. 586, 3367-3372. 10.1016/j.febslet.2012.07.027 [DOI] [PubMed] [Google Scholar]
- Bultje R. S., Castaneda-Castellanos D. R., Jan L. Y., Jan Y.-N., Kriegstein A. R. and Shi S.-H. (2009). Mammalian Par3 regulates progenitor cell asymmetric division via notch signaling in the developing neocortex. Neuron 63, 189-202. 10.1016/j.neuron.2009.07.004 [DOI] [PMC free article] [PubMed] [Google Scholar]
- Cappello S., Böhringer C. R. J., Bergami M., Conzelmann K.-K., Ghanem A., Tomassy G. S., Arlotta P., Mainardi M., Allegra M., Caleo M. et al. (2012). A radial glia-specific role of RhoA in double cortex formation. Neuron 73, 911-924. 10.1016/j.neuron.2011.12.030 [DOI] [PubMed] [Google Scholar]
- Carmichael S. T., Archibeque I., Luke L., Nolan T., Momiy J. and Li S. (2005). Growth-associated gene expression after stroke: evidence for a growth-promoting region in peri-infarct cortex. Exp. Neurol. 193, 291-311. 10.1016/j.expneurol.2005.01.004 [DOI] [PubMed] [Google Scholar]
- Chen J., Wu J., Apostolova I., Skup M., Irintchev A., Kügler S. and Schachner M. (2007). Adeno-associated virus-mediated L1 expression promotes functional recovery after spinal cord injury. Brain 130, 954-969. 10.1093/brain/awm049 [DOI] [PubMed] [Google Scholar]
- Chuang J.-Z., Zhao Y. and Sung C.-H. (2007). SARA-regulated vesicular targeting underlies formation of the light-sensing organelle in mammalian rods. Cell 130, 535-547. 10.1016/j.cell.2007.06.030 [DOI] [PMC free article] [PubMed] [Google Scholar]
- Chung W.-W., Lagenaur C. F., Yan Y. and Lund J. S. (1991). Developmental expression of neural cell adhesion molecules in the mouse neocortex and olfactory bulb. J. Comp. Neurol. 314, 290-305. 10.1002/cne.903140207 [DOI] [PubMed] [Google Scholar]
- Coumailleau F., Fürthauer M., Knoblich J. A. and González-Gaitán M. (2009). Directional Delta and Notch trafficking in Sara endosomes during asymmetric cell division. Nature 458, 1051-1055. 10.1038/nature07854 [DOI] [PubMed] [Google Scholar]
- Demyanenko G., Tsai A. and Maness P. (1999). Abnormalities in neuronal process extension, hippocampal development, and the ventricular system of L1 knockout mice. J. Neurosci. 19, 4907-4920. [DOI] [PMC free article] [PubMed] [Google Scholar]
- Elias L. A. B., Wang D. D. and Kriegstein A. R. (2007). Gap junction adhesion is necessary for radial migration in the neocortex. Nature 448, 901-907. 10.1038/nature06063 [DOI] [PubMed] [Google Scholar]
- Fushiki S. and Schachner M. (1986). Immunocytological localization of cell adhesion molecules L1 and N-CAM and the shared carbohydrate epitope L2 during development of the mouse neocortex. Dev. Brain Res. 24, 153-167. 10.1016/0165-3806(86)90183-5 [DOI] [PubMed] [Google Scholar]
- Hatanaka Y., Hisanaga S.-I., Heizmann C. W. and Murakami F. (2004). Distinct migratory behavior of early- and late-born neurons derived from the cortical ventricular zone. J. Comp. Neurol. 479, 1-14. 10.1002/cne.20256 [DOI] [PubMed] [Google Scholar]
- Haydar T. F., Ang E. and Rakic P. (2003). Mitotic spindle rotation and mode of cell division in the developing telencephalon. Proc. Natl. Acad. Sci. USA 100, 2890-2895. 10.1073/pnas.0437969100 [DOI] [PMC free article] [PubMed] [Google Scholar]
- Hu Y., Chuang J.-Z., Xu K., McGraw T. G. and Sung C.-H. (2002). SARA, a FYVE domain protein, affects Rab5-mediated endocytosis. J. Cell Sci. 115, 4755-4763. 10.1242/jcs.00177 [DOI] [PMC free article] [PubMed] [Google Scholar]
- Itoh F., Divecha N., Brocks L., Oomen L., Janssen H., Calafat J., Itoh S. and Dijke P. P. (2002). The FYVE domain in Smad anchor for receptor activation (SARA) is sufficient for localization of SARA in early endosomes and regulates TGF-beta/Smad signaling. Genes Cells 7, 321-331. 10.1046/j.1365-2443.2002.00519.x [DOI] [PubMed] [Google Scholar]
- Jossin Y. and Cooper J. A. (2011). Reelin, Rap1 and N-cadherin orient the migration of multipolar neurons in the developing neocortex. Nat. Neurosci. 14, 697-703. 10.1038/nn.2816 [DOI] [PMC free article] [PubMed] [Google Scholar]
- Kamiguchi H., Hlavin M. L. and Lemmon V. (1998). Role of L1 in neural development: what the knockouts tell us. Mol. Cell. Neurosci. 12, 48-55. 10.1006/mcne.1998.0702 [DOI] [PubMed] [Google Scholar]
- Kawauchi T., Sekine K., Shikanai M., Chihama K., Tomita K., Kubo K.-I., Nakajima K., Nabeshima Y.-I. and Hoshino M. (2010). Rab GTPases-dependent endocytic pathways regulate neuronal migration and maturation through N-cadherin trafficking. Neuron 67, 588-602. 10.1016/j.neuron.2010.07.007 [DOI] [PubMed] [Google Scholar]
- Kishimoto T., Itoh K., Umekage M., Tonosaki M., Yaoi T., Fukui K., Lemmon V. P. and Fushiki S. (2013). Downregulation of L1 perturbs neuronal migration and alters the expression of transcription factors in murine neocortex. J. Neu. Res. 91, 42-50. 10.1002/jnr.23141 [DOI] [PMC free article] [PubMed] [Google Scholar]
- Kressmann S., Campos C., Castanon I., Fürthauer M. and González-Gaitán M. (2015). Directional Notch trafficking in Sara endosomes during asymmetric cell division in the spinal cord. Nat. Cell Biol. 17, 333-339. 10.1038/ncb3119 [DOI] [PubMed] [Google Scholar]
- Kriegstein A. R. and Noctor S. C. (2004). Patterns of neuronal migration in the embryonic cortex. Trends Neurosci. 27, 392-399. 10.1016/j.tins.2004.05.001 [DOI] [PubMed] [Google Scholar]
- Kuhn T. B., Stoeckli E. T., Condrau M. A., Rathjen F. G. and Sonderegger P. (1991). Neurite outgrowth on immobilized axonin-1 is mediated by a heterophilic interaction with L1(G4). J. Cell Biol. 115, 1113-1126. 10.1083/jcb.115.4.1113 [DOI] [PMC free article] [PubMed] [Google Scholar]
- Lasiecka Z. M., Yap C. C., Katz J. and Winckler B. (2014). Maturational conversion of dendritic early endosomes and their roles in L1-mediated axon growth. J. Neurosci. 34, 14633-14643. 10.1523/JNEUROSCI.1837-14.2014 [DOI] [PMC free article] [PubMed] [Google Scholar]
- Li A., Saito M., Chuang J.-Z., Tseng Y.-Y., Dedesma C., Tomizawa K., Kaitsuka T. and Sung C.-H. (2011). Ciliary transition zone activation of phosphorylated Tctex-1 controls ciliary resorption, S-phase entry and fate of neural progenitors. Nat. Cell Biol. 13, 402-411. 10.1038/ncb2218 [DOI] [PMC free article] [PubMed] [Google Scholar]
- LoTurco J. J. and Bai J. (2006). The multipolar stage and disruptions in neuronal migration. Trends Neurosci. 29, 407-413. 10.1016/j.tins.2006.05.006 [DOI] [PubMed] [Google Scholar]
- Loubéry S., Seum C., Moraleda A., Daeden A., Fürthauer M. and Gonzalez-Gaitan M. (2014). Uninflatable and Notch control the targeting of sara endosomes during asymmetric division. Curr. Biol. 24, 2142-2148. 10.1016/j.cub.2014.07.054 [DOI] [PubMed] [Google Scholar]
- Maxfield F. R. and McGraw T. E. (2004). Endocytic recycling. Nat. Rev. Mol. Cell Biol. 5, 121-132. 10.1038/nrm1315 [DOI] [PubMed] [Google Scholar]
- Milev P., Friedlander D. R., Sakurai T., Karthikeyan L., Flad M., Margolis R. K., Grumet M. and Margolis R. U. (1994). Interactions of the chondroitin sulfate proteoglycan phosphacan, the extracellular domain of a receptor-type protein tyrosine phosphatase, with neurons, glia, and neural cell adhesion molecules. J. Cell Biol. 127, 1703-1715. 10.1083/jcb.127.6.1703 [DOI] [PMC free article] [PubMed] [Google Scholar]
- Molyneaux B. J., Arlotta P., Menezes J. R. L. and Macklis J. D. (2007). Neuronal subtype specification in the cerebral cortex. Nat. Rev. Neurosci. 8, 427-437. 10.1038/nrn2151 [DOI] [PubMed] [Google Scholar]
- Nagano T., Morikubo S. and Sato M. (2004). Filamin A and FILIP (Filamin A-Interacting Protein) regulate cell polarity and motility in neocortical subventricular and intermediate zones during radial migration. J. Neurosci. 24, 9648-9657. 10.1523/JNEUROSCI.2363-04.2004 [DOI] [PMC free article] [PubMed] [Google Scholar]
- Noctor S. C., Martínez-Cerdeño V., Ivic L. and Kriegstein A. R. (2004). Cortical neurons arise in symmetric and asymmetric division zones and migrate through specific phases. Nat. Neurosci. 7, 136-144. 10.1038/nn1172 [DOI] [PubMed] [Google Scholar]
- Panopoulou E., Gillooly D. J., Wrana J. L., Zerial M., Stenmark H., Murphy C. and Fotsis T. (2002). Early endosomal regulation of Smad-dependent signaling in endothelial cells. J. Biol. Chem. 277, 18046-18052. 10.1074/jbc.M107983200 [DOI] [PubMed] [Google Scholar]
- Roonprapunt C., Huang W., Grill R., Friedlander D., Grumet M., Chen S., Schachner M. and Young W. (2003). Soluble cell adhesion molecule L1-Fc promotes locomotor recovery in rats after spinal cord injury. J. Neurotrauma 20, 871-882. 10.1089/089771503322385809 [DOI] [PubMed] [Google Scholar]
- Runyan C. E., Liu Z. and Schnaper H. W. (2012). Phosphatidylinositol 3-kinase and Rab5 GTPase inversely regulate the Smad anchor for receptor activation (SARA) protein independently of transforming growth factor-β1. J. Biol. Chem. 287, 35815-35824. 10.1074/jbc.M112.380493 [DOI] [PMC free article] [PubMed] [Google Scholar]
- Sachdev P., Menon S., Kastner D. B., Chuang J.-Z., Yeh T.-Y., Conde C., Caceres A., Sung C.-H. and Sakmar T. P. (2007). G protein βγ subunit interaction with the dynein light-chain component Tctex-1 regulates neurite outgrowth. EMBO J. 26, 2621-2632. 10.1038/sj.emboj.7601716 [DOI] [PMC free article] [PubMed] [Google Scholar]
- Schäfer M. K. E., Schmitz B. and Diestel S. (2010). L1CAM ubiquitination facilitates its lysosomal degradation. FEBS Lett. 584, 4475-4480. 10.1016/j.febslet.2010.10.011 [DOI] [PubMed] [Google Scholar]
- Seet L.-F. and Hong W. (2001). Endofin, an endosomal FYVE domain protein. J. Biol. Chem. 276, 42445-42454. 10.1074/jbc.M105917200 [DOI] [PubMed] [Google Scholar]
- Shieh J. C., Schaar B. T., Srinivasan K., Brodsky F. M. and McConnell S. K. (2011). Endocytosis regulates cell soma translocation and the distribution of adhesion proteins in migrating neurons. PLoS ONE 6, e17802 10.1371/journal.pone.0017802 [DOI] [PMC free article] [PubMed] [Google Scholar]
- Shikanai M., Nakajima K. and Kawauchi T. (2011). N-cadherin regulates radial glial fiber-dependent migration of cortical locomoting neurons. Commun. Integr. Biol. 4, 326-330. 10.4161/cib.4.3.14886 [DOI] [PMC free article] [PubMed] [Google Scholar]
- Solecki D. J., Trivedi N., Govek E.-E., Kerekes R. A., Gleason S. S. and Hatten M. E. (2009). Myosin II motors and F-actin dynamics drive the coordinated movement of the centrosome and soma during CNS glial-guided neuronal migration. Neuron 63, 63-80. 10.1016/j.neuron.2009.05.028 [DOI] [PMC free article] [PubMed] [Google Scholar]
- Stenmark H. and Aasland R. (1999). FYVE-finger proteins-effectors of an inositol lipid. J. Cell Sci. 112, 4175-4183. [DOI] [PubMed] [Google Scholar]
- Taverna E., Gotz M. and Huttner W. B. (2014). The cell biology of neurogenesis: toward an understanding of the development and evolution of the neocortex. Annu. Rev. Cell Dev. Biol. 30, 465-502. 10.1146/annurev-cellbio-101011-155801 [DOI] [PubMed] [Google Scholar]
- Tewari M., Quan L. T., O'Rourke K., Desnoyers S., Zeng Z., Beidler D. R., Poirier G. G., Salvesen G. S. and Dixit V. M. (1995). Yama/CPP32 beta, a mammalian homolog of CED-3, is a CrmA-inhibitable protease that cleaves the death substrate poly(ADP-ribose) polymerase. Cell 81, 801-809. 10.1016/0092-8674(95)90541-3 [DOI] [PubMed] [Google Scholar]
- Tsai J.-W., Chen Y., Kriegstein A. R. and Vallee R. B. (2005). LIS1 RNA interference blocks neural stem cell division, morphogenesis, and motility at multiple stages. J. Cell Biol. 170, 935-945. 10.1083/jcb.200505166 [DOI] [PMC free article] [PubMed] [Google Scholar]
- Tsai J.-W., Bremner K. H. and Vallee R. B. (2007). Dual subcellular roles for LIS1 and dynein in radial neuronal migration in live brain tissue. Nat. Neurosci. 10, 970-979. 10.1038/nn1934 [DOI] [PubMed] [Google Scholar]
- Tsukazaki T., Chiang T. A., Davison A. F., Attisano L. and Wrana J. L. (1998). SARA, a FYVE domain protein that recruits Smad2 to the TGFbeta receptor. Cell 95, 779-791. 10.1016/S0092-8674(00)81701-8 [DOI] [PubMed] [Google Scholar]
- Weller S. and Gärtner J. (2001). Genetic and clinical aspects of X-linked hydrocephalus (L1 disease): mutations in the L1CAM gene. Hum. Mutat. 18, 1-12. 10.1002/humu.1144 [DOI] [PubMed] [Google Scholar]
- Wisco D., Anderson E. D., Chang M. C., Norden C., Boiko T., Fölsch H. and Winckler B. (2003). Uncovering multiple axonal targeting pathways in hippocampal neurons. J. Cell Biol. 162, 1317-1328. 10.1083/jcb.200307069 [DOI] [PMC free article] [PubMed] [Google Scholar]
- Yap C. C., Wisco D., Kujala P., Lasiecka Z. M., Cannon J. T., Chang M. C., Hirling H., Klumperman J. and Winckler B. (2008). The somatodendritic endosomal regulator NEEP21 facilitates axonal targeting of L1/NgCAM. J. Cell Biol. 180, 827-842. 10.1083/jcb.200707143 [DOI] [PMC free article] [PubMed] [Google Scholar]
- Yap C. C. C., Lasiecka Z. M., Caplan S. and Winckler B. (2010). Alterations of EHD1/EHD4 protein levels interfere with L1/NgCAM endocytosis in neurons and disrupt axonal targeting. J. Neurosci. 30, 6646-6657. 10.1523/JNEUROSCI.5428-09.2010 [DOI] [PMC free article] [PubMed] [Google Scholar]
- Yip P. M. and Siu C.-H. (2001). PC12 cells utilize the homophilic binding site of L1 for cell-cell adhesion but L1-alphavbeta3 interaction for neurite outgrowth. J. Neurochem. 76, 1552-1564. 10.1046/j.1471-4159.2001.00152.x [DOI] [PubMed] [Google Scholar]
- Zhou P., Porcionatto M., Pilapil M., Chen Y., Choi Y., Tolias K. F., Bikoff J. B., Hong E. J., Greenberg M. E. and Segal R. A. (2007). Polarized signaling endosomes coordinate BDNF-induced chemotaxis of cerebellar precursors. Neuron 55, 53-68. 10.1016/j.neuron.2007.05.030 [DOI] [PMC free article] [PubMed] [Google Scholar]


