Abstract
With the recent development of molecular approaches to species delimitation, a growing number of cryptic species have been discovered in what had previously been thought to be single morpho-species. Molecular methods, such as DNA barcoding, have greatly enhanced our knowledge of taxonomy, but taxonomy remains incomplete and needs a formal species nomenclature and description to facilitate its use in other scientific fields. A previous study using DNA barcoding, geometric morphometrics and mating tests revealed at least two cryptic species in the Encyrtus sasakii complex. (Hymenoptera: Encyrtidae). To describe these two new species formally (Encyrtus eulecaniumiae sp. nov. and Encyrtus rhodococcusiae sp. nov.), a detailed morphometric study of Encyrtus spp. was performed in addition to the molecular analysis and evaluation of biological data. Morphometric analyses, a multivariate ratio analysis (MRA) and a geometric morphometric analysis (GMA) revealed a great number of differences between the species, but reliable characteristics were not observed for diagnosing the cryptic species. We thus diagnosed these three Encyrtus species on the basis of the characteristics that resulted from genetic markers (mitochondrial cytochrome c oxidase subunit I and nuclear 28S rRNA) and biological data. A formal nomenclature and description of cryptic species was provided on the basis of an integrated taxonomy.
Over the past decade, DNA barcoding1 has been broadly used for the species identification of metazoans2,3,4. Unexpectedly, a large number of cryptic species were discovered for those species, which were considered to be a single morpho-species, particularly in the morphologically conserved invertebrate taxa, such as Lepidoptera5,6, Coleoptera7, Diptera8, and Hymenoptera9,10. As far as we know, almost all of these cryptic species were characterized by DNA barcodes. Without a formal nomenclature and description, these “identified species” cannot linked to the Linnaean System and associated with the established biological knowledge11,12,13,14,15; thus, the potential value of these barcodes to various research fields16,17,18 might be limited. Diagnostic characteristics could be provided by the DNA barcodes15,19 but only after scientific names have been given to the barcoded specimens (using morphology or any other means that had previously been used to diagnose the species). After these determinations have been made, diagnosis can continue using barcodes. Moreover, a stable nomenclature at the level of formal species can undoubtedly facilitate effective transfer of knowledge and again provide a foundation for more information associated with it.
Tentative strategies have been proposed and developed to resolve cryptic species and describe them20,21. Brower22 used only DNA barcodes (i.e., the mitochondrial cytochrome oxidase subunit I [COI] gene) for diagnosis and offered no formal morphological description. Recent attempts to integrate DNA and morphological taxonomy to delimitate species have provided a much better approach for cryptic species description23,24,25,26. An increasing number of authors have realized that during the description of cryptic species, morphological characteristics should be rigorously investigated and included in addition to DNA and biological data27,28. Due to similar external anatomical characteristics and continuous and/or overlapping morphological characteristics24,29,30,31,32,33, thorough morphological analyses, such as multivariate ratio analysis (MRA)34 and Geometric Morphometric Analysis (GMA), should be performed to demonstrate the variation among these cryptic species.
Encyrtus is a species-rich genus of Encyrtidae (Hymenoptera: Chalcidoidea) that currently contains approximately 90 described species35. Although many studies have contributed to the identification of these parasitoids, reliable distinctions and identifications are difficult to make because of their small size and similar external morphology, particularly for cryptic species or those in species complexes. In a previous study, a combined analysis of the geometric morphometrics of insect forewings, DNA data and mating tests were used to detect the existence of two cryptic species in the Encyrtus sasakii species complex in China36. For a complete taxonomy of these cryptic species, we obtained samples from six more populations in China (Supplementary Table S1) in addition to the samples described in Chesters et al.36. In this study, we further explored the patterns of morphological variation (e.g., the antenna characteristics and forewing vein dimensions) along with the genetic variation and biological data. Corroboration from independent data, including morphology, molecules and biology, provide a basis for the delimitation and formal nomenclature of these cryptic species.
Results
Approximately 4,000 samples of the E. sasakii species complex were reared from four scale insect species, known as Eulecanium kuwanai (Kuwana), Eulecanium giganteum (Shinji), Takahashia japonica (Cockerell) and Rhodococcus sariuoni Borchsenius. The 167 female specimens were randomly selected from different populations according to their population size (details in Supplementary Table S1). Of these specimens, 135 were used in the Morphometric Analysis and MRA, 125 were used in the GMA (Geometric Morphometric Analysis) and 128 were used in the molecular analyses. Based on the results of the current work and on previous studies36, the specimens that emerged from Takahashia japonica were identified as Encyrtus sasakii, those from Eulecanium kuwanai and E. giganteum were identified as Encyrtus eulecaniumiae sp. nov., and those from Rhodococcus sariuoni were identified as Encyrtus rhodococcusiae sp. nov.
Morphometric analysis
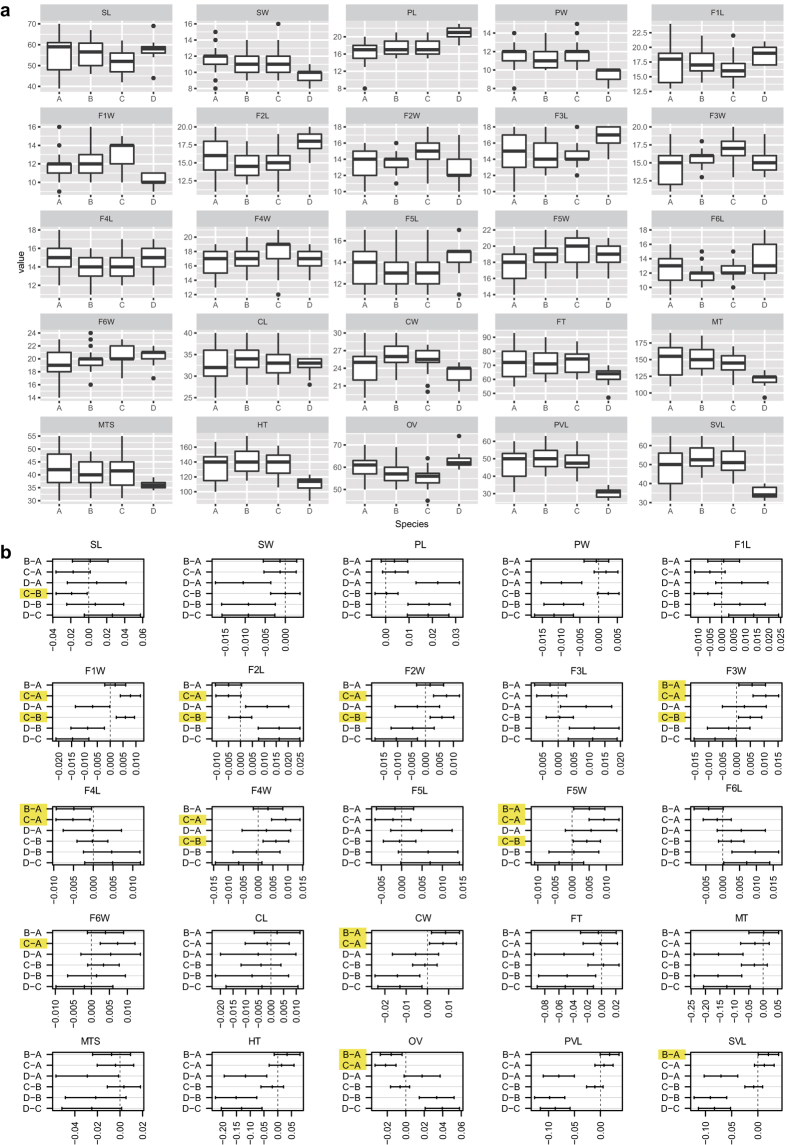
The boxplots (Fig. 1a) show that all 25 of the morphological characteristics (Table 1) are continuous, and they vary from slightly to distinctly overlapping between Encyrtus sasakii, E. eulecaniumiae and E. rhodococcusiae. However, statistical analysis of the variance showed that some of the morphological characteristics of these species are significantly different (Fig. 1b). Six characteristic values (F3W, F4L, F5W, CW, OV and SVL) were significantly different (P < 0.05) between E. eulecaniumiae and E. rhodococcusiae. Ten characteristic values (F1W, F2L, F2W, F3W, F4L, F4W, F5W, F6W, CW and OV) were significantly different (P < 0.05) between E. eulecaniumiae and E. sasakii. Seven characteristic values (SL, F1W, F2L, F2W, F3W, F4W and F5W) were significantly different (P < 0.05) between E. rhodococcusiae and E. sasakii. Moreover, two characteristic values (F3W and F5W) were significantly different among all three species pairs.
Figure 1.
(a) Boxplot of the distribution of the measurements of 25 characters (for Abbreviations of the Character names, see Table 1). The horizontal thick bar represents the median value, the box includes 50% of the data, the whiskers extend to cover 95% of the distribution. (b) Post hoc comparisons of each morphological character using Tukey HSD test at 95% family-wise confidence level (no significant differences if zero included in confidence intervals), significant differences between characteristics of A, B and C are highlighted with yellow. A = E. eulecaniumiae, B = E. rhodococcusiae, C = E. sasakii, and D = E. infelix.
Table 1. The morphological characters and their abbreviations as measured for the morphometric study.
| Abbreviations | Characters |
|---|---|
| CL | The length of the clava |
| CW | The maximum width of the clava |
| F1L | The length of the funicle, segment one |
| F1W | The maximum width of the funicle, segment one |
| F2L | The length of the funicle, segment two |
| F2W | The maximum width of the funicle, segment two |
| F3L | The length of the funicle, segment three |
| F3W | The maximum width of the funicle, segment three |
| F4L | The length of the funicle, segment four |
| F4W | The maximum width of the funicle, segment four |
| F5L | The length of the funicle, segment five |
| F5W | The maximum width of the funicle, segment five |
| F6L | The length of the funicle, segment six |
| F6W | The maximum width of the funicle, segment six |
| FT | The length of the fore tibia |
| HT | The length of the hind tibia |
| MT | The length of the mid tibia |
| MTS | The length of the mid tibial spur |
| OV | The length of the ovipositor. |
| PL | The length of the pedicel |
| PVL | The length of the postmarginal vein. |
| PW | The maximum width of the pedicel |
| SL | The length of the scape |
| SVL | The length of the stigma vein. |
| SW | The maximum width of the scape |
Multivariate ratio analysis (MRA)
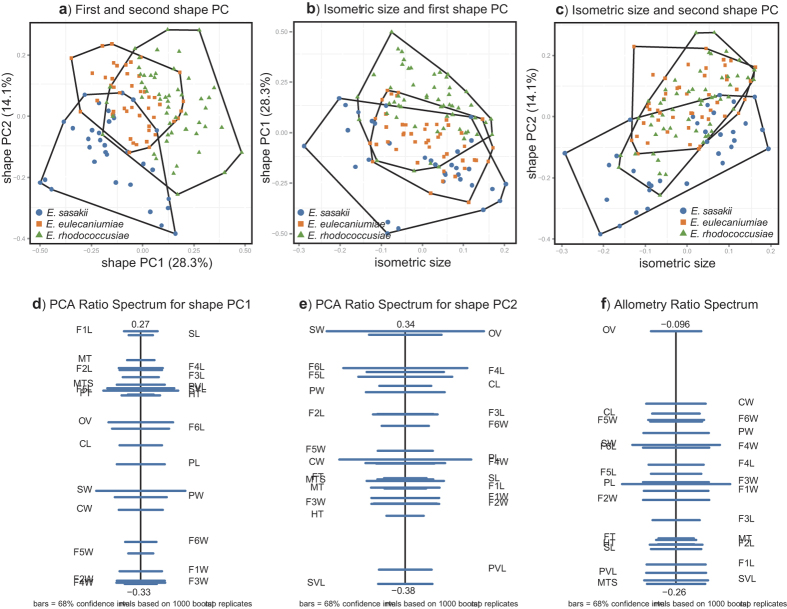
The variables with matrix scatterplots and Pearson product-moment correlation coefficients were checked, and no variables were found to correlate more or less strongly than others (Supplementary Table S2 and Figure S1). Thus, all variables are included in the subsequent analyses. The first eleven principal components (PC) included 84.9% of all informative variations (Supplementary Table S3). The scatterplot of the first two shape PCs (which included 42.4% of all informative variations) showed that the three species were partially overlapping along the forms of the chosen components (Fig. 2a). Figure 2b,c displays results similar to those of Fig. 2a, and this is also the case for the rest of the PCs. In the scatterplots of isosize against the first and second shape PC, E. sasakii was slightly smaller on average than E. eulecaniumiae, and the latter was slightly smaller on average than E. rhodococcusiae, although the size ranges overlapped broadly (Fig. 2b,c).
Figure 2. Results of multivariate ratio analysis (MRA) for females of Encyrtus sasakii, E. eulecaniumiae and E. rhodococcusiae.
a) Scatterplot of a principal component analysis (PCA) in shape space. (b) Isometric size versus first principal component in shape space. (c) Isometric size versus second principal component in shape space. (d) PCA ratio spectrum of the first principal component. (e) PCA ratio spectrum of the second principal component. (f) The allometry ratio spectrum. Confidence intervals [horizontal bars in (d,e,f), were estimated with a bootstrap of the original values of z directly from the empirical distribution.
On the PCA (principal component analysis) ratio spectrum of the first shape PC (Fig. 2d), some of the variation was explained by ratios, such as F1L:F4W and SL:F4W, which corresponded to points located close to the opposite ends of the spectrum. The first PCA ratio spectrum was dominated by ratios relating to relative funicular segment lengths. The second PCA ratio (Fig. 2e) was dominated by the ratios SW/SVL, SW/PVL, OV/SVL, and OV/PVL, and these characteristics were related to the forewing veins (SVL, PVL), antennal scape (SW) and ovipositor (OV). The last two ratios were also among the most important ratios in the allometry ratio spectrum (Fig. 2f).
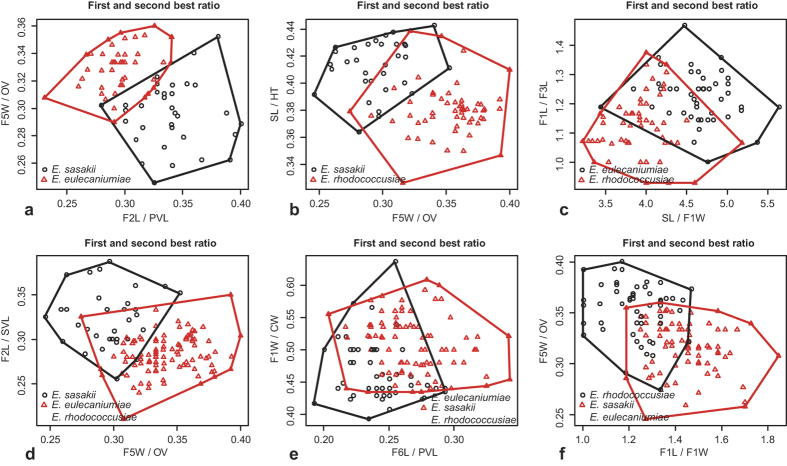
The LDA (linear discriminant analysis) ratio extractor37 was used to determine the optimal body ratios to separate the species, and the results are compiled in Table 2. The ranges of first- and second-best ratios were mostly overlapping between the respective groupings. The F5W/OV ratio was assigned as the best ratio for discriminating among E. sasakii, E. eulecaniumiae and E. rhodococcusiae. For all the comparisons, the δ, which is a measure of how well the shape discriminates in comparison with the size37, was close to 0 (0.01–0.04), indicating that the separation of these three species was due mainly to shape rather than size. However, the ranges of the first- and second-best ratios often overlapped between the respective groupings (Fig. 3a–f), which indicates that those character ratios could not be used to represent important diagnostic features. The standard distances ranged from 2.62 to 4.90, which does not reflect a good separation of these three species, as observed in the shape PCA.
Table 2. First- and second-best ratios found by the LDA ratio extractor for separating the females of three Encyrtus species.
| Group comparison | Best ratios | Range group 1 | Range group 2 | Standard distance | δ |
|---|---|---|---|---|---|
| E. sasakii vs. E. eulecaniumiae | *F2L/PVL | 0.28–0.40 | 0.23–0.34 | 4.26 | 0.03 |
| F5W/OV | 0.25–0.35 | 0.29–0.36 | 3.87 | 0.03 | |
| E. sasakii vs. E. rhodococcusiae | *F5W/OV | 0.25–0.35 | 0.27–0.40 | 4.92 | 0.04 |
| SL/HT | 0.36–0.44 | 0.33–0.44 | 4.36 | 0.04 | |
| E. eulecaniae vs. E. rhodococcusiae | SL/F1W | 3.43–5.64 | 3.21–5.18 | 3.13 | 0.02 |
| F1L/F3L | 1.00–1.47 | 0.93–1.38 | 2.55 | 0.03 | |
| E. sasakii vs.(E. eulecaniumiae + E. rhodococcusiae) | F5W/OV | 0.25–0.35 | 0.27–0.40 | 4.35 | 0.04 |
| F2L/SVL | 0.21–0.31 | 0.21–0.35 | 3.87 | 0.05 | |
| E. eulecaniumiae vs.(E. sasakii + E. rhodococcusiae) | F6L/PVL | 0.19–0.29 | 0.20–0.34 | 2.41 | 0.01 |
| F1W/CW | 0.39–0.64 | 0.43–0.61 | 2.18 | 0.01 | |
| E. rhodococcusiae vs.(E. sasakii + E. eulecaniumiae) | F1L/F1W | 1.00–1.47 | 1.20–1.85 | 2.89 | 0.04 |
| F5W/OV | 0.27–0.40 | 0.25–0.36 | 2.28 | 0.05 |
*Ratios with less overlapping.
Figure 3. Scatterplots of the two most discriminating ratios for females of Encyrtus sasakii, E. eulecaniumiae and E. rhodococcusiae.
Plots (a–f) show the first versus second ratio for each comparison of the three Encyrtus species.
Geometric morphometric analysis (GMA)
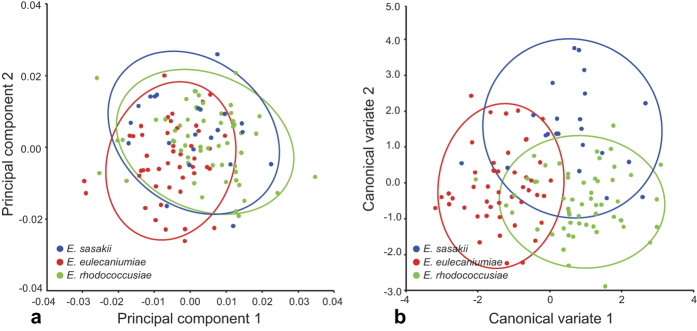
A total of 125 specimens were prepared for GMA (Supplementary Table S1). The partial or fuzzy separation of the populations was observed for specimens on the first two principal axes (Fig. 4a,b). The first two components contributed to 47.32% of the total variance (PC1 = 25.50% and PC2 = 21.82%). The third, fourth and fifth components contributed to 18.20%, 10.60%, and 8.43% of the total variance, respectively, which did not improve the separation of the populations.
Figure 4.
(a) Scatter plots constructed from principal component analyses (PCA) of the data set of seven landmarks from the forewings of the three Encyrtus species. In the scatter plots, the first and second principal components are plotted on the x and y axis, respectively. (b) Scatter plots constructed from canonical variate analysis (CVA) of the landmark data set.
Analysis of molecular data
In this study, we employed 120 sequences of the mitochondrial cytochrome oxidase subunit I (COI) gene and 76 sequences of the 28S ribosomal gene (including the 69 samples used in Chesters et al.36; Supplementary Table S1). After edge trimming, the data matrix consisted of 557 bp for COI and 503 bp for 28S. As mentioned in a previous study, the 28S sequences of these three provisional species have a minor divergence from one another. E. rhodococcusiae has a one-bp difference, with the other two at position 217 (“C” compared with “T”), and E. eulecaniumiae has a one-bp difference, with the other two at position 451 (“A” compared with “G”). Conversely, the COI degree of genetic divergence was particularly high. A barcode gap was discovered between the maximum intraspecific variation (K2P distance: 3.33%; p-distance: 3.23%) and the minimum interspecific divergence (K2P distance: 8.81%; p-distance: 8.26%) (Table 3). The application of character-based methods can provide a combination of diagnostic nucleotides that can be used to identify the three cryptic species correctly. The species-specific nucleotide positions of COI (pure diagnostic barcode characters) for the three cryptic species are listed in Table 4.
Table 3. Genetic distance of three cryptic species of Encyrtus using COI haplotype data (Mean ± SE).
| E. sasakii | E. eulecaniumiae | E. rhodococcusiae | |
|---|---|---|---|
| E. sasakii | 1.24% ± 0.30%/1.23% ± 0.26% | 9.31% ± 1.11% | 9.84% ± 1.03% |
| 0.00~2.38%/0.00~2.33% | 8.26%~10.41% | 8.98%~10.77% | |
| E. eulecaniumiae | 10.04% ± 1.28% | 1.74% ± 0.32%/1.70% ± 0.31% | 9.38% ± 1.11% |
| 8.81%~11.36% | 0.00~3.33%/0.00~3.23% | 8.62%~10.23% | |
| E. rhodococcusiae | 10.60% ± 1.30% | 10.13% ± 1.30% | 0.96% ± 0.21%/0.95% ± 0.21% |
| 9.59%~11.72% | 9.22%~11.16% | 0.00~2.38%/0.00~2.33% |
(K2P distances are shown under the diagonal, and p distances are above the diagonal; grey shading indicates intra-specific divergences, the values on the left are K2P distances, and the values on the right are p distances).
Table 4. Character-based DNA barcodes (COI) for three cryptic species of Encyrtus.
| Position | 14 | 26 | 32 | 47 | 53 | 68 | 102 | 122 | 134 | 149 | |
| E. sasakii | G | G | G | T | A | G | G | A | G | T | |
| E. eulecaniumiae | A | G | A | G | G | A | G | T | A | T | |
| E. rhodococcusiae | T | A | A | T | A | G | A | T | G | A | |
| Position | 161 | 176 | 203 | 215 | 224 | 227 | 233 | 236 | 245 | 254 | |
| E. sasakii | T | A | A | A | G | G | A | A | G | A | |
| E. eulecaniumiae | T | A | G | A | A | A | T | G | A | T | |
| E. rhodococcusiae | C | G | A | G | A | A | T | A | A | T | |
| Position | 266 | 269 | 271 | 281 | 284 | 290 | 320 | 335 | 341 | 389 | |
| E. sasakii | A | T | A | G | T | G | G | A | T | G | |
| E. eulecaniumiae | G | T | T/G | A | A | A | A | T | A | G | |
| E. rhodococcusiae | T | A | T | T | A | A | A | T | T | A | |
| Position | 431 | 443 | 446 | 461 | 467 | 468 | 470 | 494 | 521 | 530 | 533 |
| E. sasakii | G | A | G | G | A | T | G | G | A | A | G |
| E. eulecaniumiae | A | G | G | A | G | T | A | A | A | A | A |
| E. rhodococcusiae | A | G | A | G | G | C | T | A | T | G | G |
Pure diagnostic characters for discriminating all the individuals at 41 selected nucleotide positions for COI except at position 271 for E. eulecaniumiae are shown in bold.
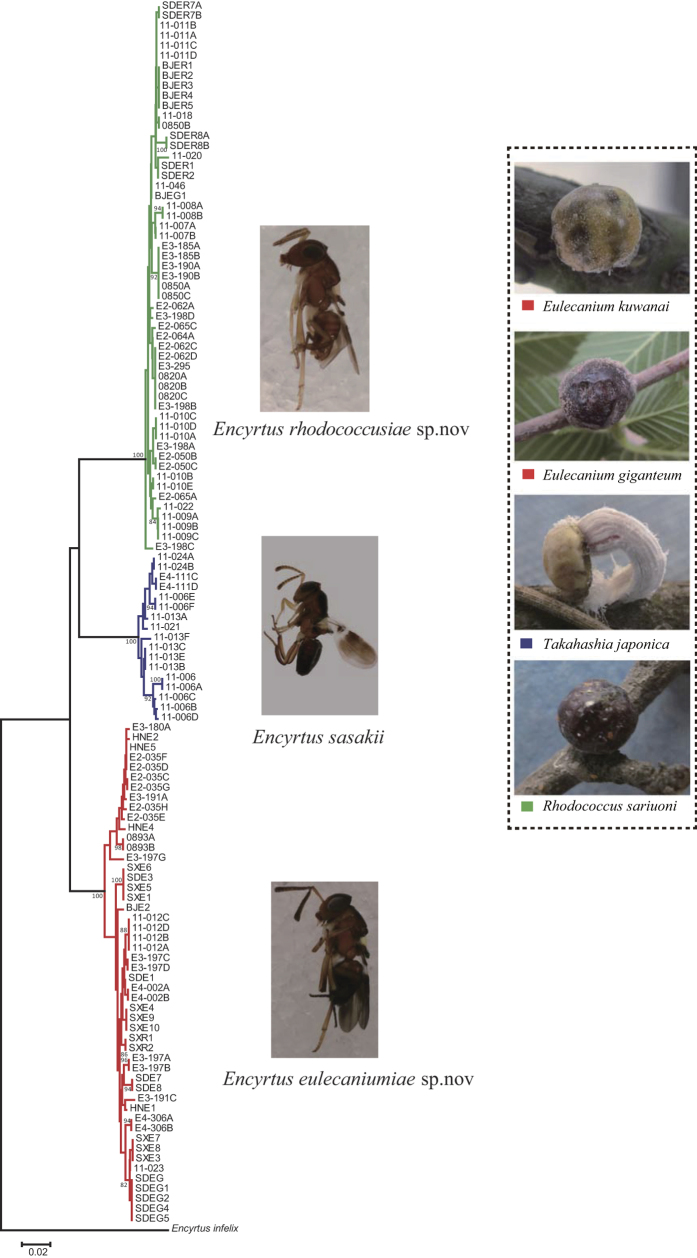
An NJ tree was constructed on the basis of COI data in MEGA 6 using the K2P model with 1,000 bootstraps. The NJ analysis revealed three clusters according to the node supports and topologies, and they corresponded to E. rhodococcusiae, E. eulecaniumiae and E. sasakii (Fig. 5). The three species can be easily grouped into three lineages though Bayesian inference analysis, which shows that E. rhodococcusiae may be closer to E. sasakii than to E. eulecaniumiae (Supplementary Figure S2).
Figure 5. NJ tree based on maximum likelihood analysis of sequences of the COI gene.
Bootstrap = 1000, and bootstrap values < 75% are omitted. Encyrtus infelix was selected as the outgroup. Colours of branches and letters indicate used hosts (shown on the right site) in China. Photos of Encyrtus spp. were taken by author Ying Wang, and photos of soft scale hosts by author Xu-Bo Wang.
Taxonomy of the Encyrtus species
Encyrtus eulecaniumiae sp. nov. Wang & Zhang
Diagnosis
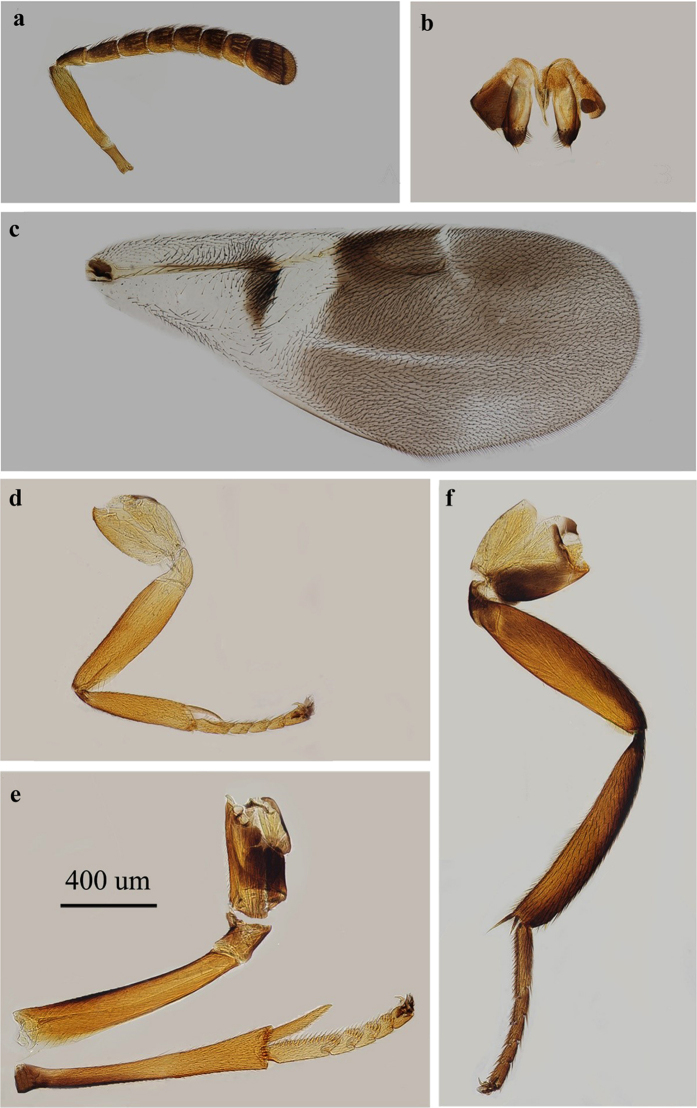
Females of E. eulecaniumiae are similar in appearance to those of E. sasakii and E. rhodococcusiae. Figure 6.
Figure 6. Encyrtus eulecaniumiae.
(a) antenna; (b) ovipositor; (c) fore wing; (d) fore leg; (e) mid leg; (f) hind leg. Photos were taken by author Ying Wang.
Molecular diagnostic characteristics of E. eulecaniumiae. The divergence of mtDNA COI sequences between populations of E. eulecaniumiae and E. sasakii is approximately 10.04% (K2P model), and that between populations of E. eulecaniumiae and E. rhodococcusiae is approximately 10.60% (K2P model). The diagnostic characteristics of the COI sequences (GenBank accession numbers KX242564–KX242611) are as follows: 14, A; 47, G; 53, G; 68, G; 134, A; 203, G; 236, G; 266, G; 271, G; 281, A; 341, A; 461, A; 470, A; and 533, A. The diagnostic characteristics of the 28S sequences (GenBank accession numbers KX242678–KX242711) are 217, T and 451, A.
Biological diagnostic characteristics: E. eulecaniumiae uses Eulecanium kuwanai (Kuwana) and Eulecanium giganteum (Shinji) as hosts.
Description
Host
Eulecanium kuwanai, E. giganteum (Hemiptera: Coccidae).
Distribution
China (Beijing, Heilongjiang, Henan, Inner Mongolia, Shandong, Shanxi) (Supplementary Figure S3).
Etymology
The specific epithet is derived from the host of the new species.
Holotype
♀: China, Beijing, Shijingshan (Badachu Park), 15. V. 2014, Col. Ying Wang, ex. Eulecanium kuwanai on Ulmus pumila (on slide of CODE E4-306A, DNA material CODE E4-306A. IZCAS).
Paratypes
2♀, Beijing, Shijingshan (Badachu Park), 2014-V-15, Col. Ying Wang, ex. Eulecanium kuwanai on Ulmus pumila; 4♀♀, 2♂♂, Heilongjiang, Harbin, 2011-VI-9, Col. Ying Wang, ex. Eulecanium kuwanai on Ulmus pumila; 16♀♀, 5♂♂, Henan, Zhengzhou, 2007-V-4, Col. Xiong Wang, ex. Eulecanium kuwanai on Sophora japonica; 221♀♀, 72♂♂ Inner Mongolia, Hohhot, 2012-V-26, Col. Haibin Li, ex. Encyrtus giganteum on Sophora japonica; 62♀♀, 40♂♂, Shanxi, Taiyuan, 2007-V-1, Col. Jie Li, ex. Eulecanium kuwanai on Sophora japonica; 85♀♀, 33♂♂, Shandong, Taian, 2008-V-11, Col. Yanzhou Zhang, ex. Eulecanium kuwanai on Sophora japonica.
Non type material. 3♀♀, Beijing, Haidian, 2008-VI-1, Col. Yanzhou Zhang, ex. Eulecanium kuwanai on Ulmus pumila; 5♀♀, 2♂♂, Beijing, Haidian (Xiangshan), 2010-VI-1, Col. Yanzhou Zhang, ex. Eulecanium kuwanai on Sophora japonica; 62♀♀, 14♂♂, Beijing, Haidian, 2012-V-9, Col. Ying Wang, ex. Eulecanium kuwanai on Ulmus pumila; 4♀♀, Beijing, Haidian (Xiangshan), 2013-V-11, Col. Ying Wang, Linlin Zheng, Xubo Wang, ex. Eulecanium kuwanai on Juglans sp.; 1♂, Beijing, Haidian, 2014-IV-16, Col. Xubo Wang, Xu Zhang, Yaoguang Qin, ex. Eulecanium kuwanai on Sophora japonica; 3♀♀, 2♂♂, Beijing, Haidian, 2014-IV-16, Col. Xubo Wang, Xu Zhang, Yaoguang Qin, ex. Eulecanium kuwanai on Koelreuteria paniculata; 77♀♀, 22♂♂, Heilongjiang, Harbin, 2011-VI-28, Col. Ying Wang, ex. Eulecanium kuwanai on Ulmus pumila; 43♀♀, 34♂♂, Heilongjiang, Harbin, 2012-VI-1, Col. Xiuwei Liu, ex. Eulecanium kuwanai on Rosa davurica; 4♀♀, 2♂♂, Heilongjiang, Harbin, 2012-VI-1, Col. Xiuwei Liu, ex. Eulecanium kuwanai on Ulmus pumila; 80♀♀, 50♂♂, Inner Mongolia, Baotou, 2013-V-22, Col. Xu Zhang, Haibin Li, Xubo Wang, ex. Eulecanium kuwanai on Sophora japonica; 52♀♀, 41♂♂, Inner Mongolia, Hohhot, 2012-V-26, Col. Haibin Li, ex. Eulecanium kuwanai on Sophora japonica; 11♀♀, 4♂♂ Inner Mongolia, Hohhot, 2012-V-26, Col. Haibin Li, ex. Eulecanium giganteum on Ulmus pumila; 2♀♀, 1♂, Shanxi, Linfen, 2007-V, Col. Jie Li, ex. Eulecanium kuwanai on Sophora japonica; 24♀♀, 10♂♂, Shandong, Taian, Taishan, 2008-V-10, Col. Yanzhou Zhang, ex. Eulecanium kuwanai on Albizzia julibrissn.
Encyrtus rhodococcusiae sp. nov. Wang & Zhang
Diagnosis
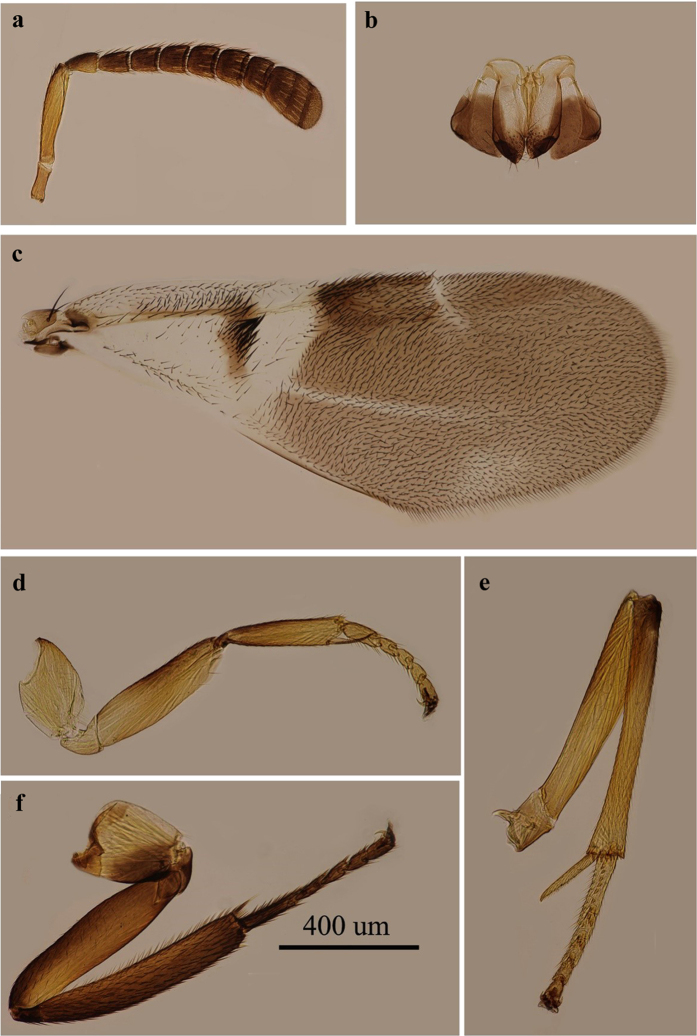
E. rhodococcusiae females are similar in appearance to those of E. sasakii and E. eulecaniumiae. Figure 7.
Figure 7. Encyrtus rhodococcusiae.
(a) antenna; (b) ovipositor; (c) fore wing; (d) fore leg; (e) mid leg; (f) hind leg. Photos were taken by author Ying Wang.
Molecular diagnostic characters of Encyrtus rhodococcusiae. The divergence between the mtDNA COI sequences of populations of E. rhodococcusiae and E. sasakii is approximately 10.60% (K2P model), and that between populations of E. rhodococcusiae and E. eulecaniumiae is approximately 10.13% (K2P model). The diagnostic characteristics of the COI sequences (GenBank accession numbers KX242612–KX242666) are as follows: 14, T; 26, A; 102, A; 149, A; 161, C; 176, G; 215, G; 266, T; 269, A; 281, T; 389, A; 446, A; 468, C; 470, T; 521, T; and 530, G. The diagnostic characteristics of the 28S sequences (GenBank accession numbers KX242712–KX242742) are those of 217, C; and 451, G.
Biological diagnostic characteristics: Encyrtus rhodococcusiae uses Rhodococcus sariuoni as a host.
Description
Host
Rhodococcus sariuoni (Hemiptera: Coccidae).
Distribution
In China, it is recorded as being from Beijing, Heilongjiang, Jilin, Qinghai, Shaanxi, and Shandong provinces (Supplementary Figure S3).
Etymology
The specific epithet is derived from the host of the new species.
Holotype
♀, Shandong, Linyi, 2011-V-9, Col. Xuemei Yang, ex. Rhodococcus sariuoni on Crataegus pinnatifida (on slide of CODE 11-009A, DNA material CODE 11-009A. IZCAS).
Paratypes
2♀♀, Beijing, Haidian, 2006-V-15, Col. Yanzhou Zhang, ex. Rhodococcus sariuoni on Malus spectabilis; 3♀♀, Heilongjiang, Harbin, 2007-VI-15, Col. Yanzhou Zhang, ex. Rhodococcus sariuoni on Prunus persica; 6♀♀, 1♂, Jilin, Changchun, 2011-VI-9, Col. Ying Wang, ex. Rhodococcus sariuoni on Prunus persica; 2♀♀, 2♂♂, Qinghai, Xining, 2013-VI-28, Col. Haibin Li, Xubo Wang, Xu Zhang, ex. Rhodococcus sariuoni on Prunus cerasifera; 7♀♀, 2♂♂, Shandong, Taian, 2008-V-9, Col. Yanzhou Zhang, ex. Rhodococcus sariuoni on Prunus cerasifera; 2♀♀, Shaanxi, Xianyang, 2011-V-9~15, Col. Feng Yuan, ex. Rhodococcus sariuoni on Malus sieversii.
Non type material. 1♀, Beijing, Haidian, 2008-V-15, Col. Yanzhou Zhang, ex. Rhodococcus sariuoni on Malus spectabilis; 25♀♀, 3♂♂, Beijing, Haidian, 2011-V-15, Col. Yanzhou Zhang, ex. Rhodococcus sariuoni on Malus spectabilis; 1♀, Beijing, Mentougou, 2011-VI-4, Col. Yanzhou Zhang, ex. Rhodococcus sariuoni on Malus pumila; 3♀♀, 3♂♂, Beijing, Mentougou, 2012-V-15, Col. Feng Yuan, Xu Zhang, ex. Rhodococcus sariuoni on Malus spectabilis; 165♀♀, 57♂♂, Heilongjiang, Harbin, 2012-VI-6, Col. Xiuwei Liu, ex. Rhodococcus sariuoni on Cerasus tomentosa; 1714♀♀, 620♂♂, Heilongjiang, Harbin, 2012-VI-6, Col. Xiuwei Liu, ex. Rhodococcus sariuoni on Amygdalus triloba; 3♀♀, Heilongjiang, Harbin, 2012-VI-6, Col. Xiuwei Liu, ex. Rhodococcus sariuoni on Prunus cerasifera; 2♀♀, 1♂, Heilongjiang, Harbin, 2012-VI-6, Col. Xiuwei Liu, ex. Rhodococcus sariuoni on Ulmus pumila; 1♀, 1♂, Heilongjiang, Harbin, 2014-V-27, Col. Ying Wang, ex. Rhodococcus sariuoni on Padus racemosa; 9♀♀, 9♂♂, Heilongjiang, Suihua, 2014-V-28, Col. Ying Wang, ex. Rhodococcus sariuoni on Padus racemosa; 1♀, Qinghai, Xining, 2007-VI-22, Col. Yanzhou Zhang, ex. Rhodococcus sariuoni on Prunus persica; 6♀♀, 1♂, Qinghai, Xining, 2013-VI-26, Col. Haibin Li, Xubo Wang, Xu Zhang, ex. Rhodococcus sariuoni on Armeniaca vulgaris; 2♂♂, Shandong, Taian, 2008-V-16, Col. Yanzhou Zhang, ex. Rhodococcus sariuoni on Prunus cerasifera; 39♀♀, 8♂♂, Shandong, Taian, 2010-V-16, Col. Jun Deng, Yanzhou Zhang, ex. Rhodococcus sariuoni on Prunus cerasifera; 14♀♀, 2♂♂, Shandong, Linyi, 2011-V-9, Col. Xuemei Yang, ex. Rhodococcus sariuoni on Crataegus pinnatifida; 3♀♀, Shandong, Linyi, 2011-IV-30, Col. Xuemei Yang, ex. Rhodococcus sariuoni on Crataegus pinnatifida; 16♀♀, 1♂, Shandong, Weifang, 2011-V-9, Col. Jun Deng, Yanzhou Zhang, ex. Rhodococcus sariuoni on Prunus persica; 1♀, Shandong, Weifang, 2011-V-9, Col. Jun Deng, Yanzhou Zhang, ex. Rhodococcus sariuoni on Malus sieversii; 4♀♀, 1♂, Shandong, Weifang, 2011-V-9, Col. Yanzhou Zhang, ex. Rhodococcus sariuoni on Prunus cerasifera.
Encyrtus sasakii Ishii
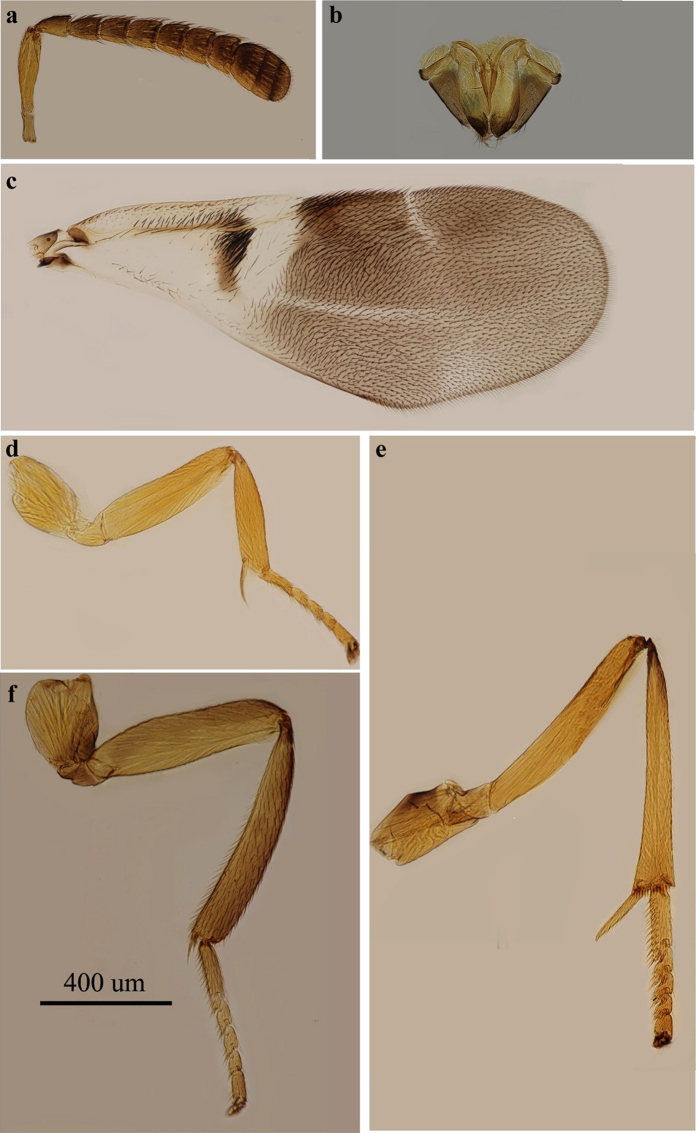
Encyrtus sasakii Ishii37. Holotype ♀, Japan. Figure 8.
Figure 8. Encyrtus sasakii.
(a) antenna; (b) ovipositor; (c) fore wing; (d) fore leg; (e) mid leg; (f) hind leg. Photos were taken by author Ying Wang.
Diagnosis
Encyrtus sasakii females are similar in appearance to those of Encyrtus eulecaniumiae and E. rhodococcusiae.
Molecular diagnostic characteristics of Encyrtus sasakii. The divergence of the mtDNA COI sequences between populations of E. sasakii and E. rhodococcusiae is approximately 10.60% (K2P model), and that between populations of E. sasakii and E. eulecaniumiae is approximately 10.04% (K2P model). The diagnostic characteristics of the mitochondrial COI sequences (GenBank accession numbers KX242547–KX242563) are as follows: 14, G; 32, G; 122, A; 224, G; 227, G; 233, A; 245, G; 254, A; 266, A; 271, A; 281, G; 284, T; 290, G; 320, G; 335, A; 431, G; 443, A; 467, A; 470, G; and 494, G; and for nuclear 28S sequences (GenBank accession numbers KX242667–KX242677), they were 217, T; and 451, G.
Biological diagnostic characteristics: Encyrtus sasakii is hosted by Takahashia japonica.
Description
Host
Takahashia japonica (Hemiptera). The recorded host Kermes sp. needs confirmation.
Distribution
It is recorded as being from Anhui, Jiangsu, Jiangxi, and Zhejiang provinces in China (Supplementary Figure S3) and seems to be restricted to subtropical areas. It is also distributed in Japan.
Material examined
12♀♀, 1♂, Jiangsu, Nanjing, 2011-IV-16, Col. Liang Ding, ex. Takahashia japonica on Albizzia julibrissn; 1♀, Jiangsu, Nanjing, 2011- IV-26, Col. Liang Ding, ex. Takahashia japonica on Albizzia julibrissn; 5♀♀, 3♂♂, Jiangsu, Nanjing, 2011- IV-28, Col. Liang Ding, ex. Takahashia japonica on Albizzia julibrissn; 1♀, 1♂, Jiangsu, Nanjing, 2011-V-7, Col. Liang Ding, ex. Takahashia japonica on Albizzia julibrissn; 4♀♀, Anhui, Wuhu, 2011-IV-27, Col. Huizi Ye, ex. Takahashia japonica on Robinia pseudoacacia; 14♀♀, Zhejiang, Ningbo, 2011-IV-29~2011-V-9, Col. Tongxin Zhang, ex. Takahashia japonica on Lorpetalum chinense; 4♀♀, Jiangxi, Nanchang, 2014-IV-21, Col, Jun Deng & Yanzhou Zhang, Takahashia japonica on Acer buergerianum.
Discussion
Traditional taxonomy and cryptic species
Morphological data have traditionally been used to delimit species, and the morphology-based taxonomy is still the most important discipline for assigning taxonomically valid names on the basis of typing specimen(s)12,38. Thus, a thorough morphological study of cryptic species is necessary before nomenclature and description. This process will not only provide us with a better estimate for species delimitation by comparing with other sources of data but will also undoubtedly help us to understand the morphological processes of speciation and to discover the characteristics upon which natural selection acts16. The quantitative and statistical analyses of morphological variations in cryptic species should reduce the subjectivity of traditional taxonomy39,40,41. In the current study, though nearly all the morphological characteristics of cryptic species are continuous and/or overlapping (a morphological character distribution trait that may be present in all cryptic species), morphometric analysis shows that some characteristics, such as F1W and F2L (Fig. 1), display significant differences between cryptic species and provide a taxonomic background to distinguish among them. It is also worth mentioning that the two characters F3W and F5W are significantly different among the cryptic species, and both antenna components are important organs in the host location and mating processes of parasitoids42. The significant difference between F3W and F5W is probably related to the diversification of biological elements (such as host use) and genetic markers. Such significant differences in different morphological traits were also found for cryptic species in other animal groups43,44,45.
Although the scatterplot of the shape PCA through MRA was barely satisfactory in this study (Fig. 2a), it did indicate that divergence of the morphological characters among the cryptic species has occurred, particularly when analysing the most discriminating ratios between the cryptic species (Fig. 2a). The LDA ratio extractor may help in the search for good characteristics for the diagnosis of other species46,47,48. However, in the present study, this extractor did not generated any characteristic that can be reliably to separate these three cryptic species (Table 2), and there is still a possibility that distinguishing morphological characters are not addressed in these cryptic species.
GMA have been used to study various insect taxa, ranging from the species level to superfamily analysis49,50, and it was proven to be useful for the delimitation of cryptic taxa in various arthropod groups51,52,53. Similar to MRA, GMA helped us to understand the variations of the forewing in cryptic species that may be newly speciated, but it did not reveal significantly different characteristics for species diagnosis.
Molecular analyses
Molecular analyses revealed three distinct clusters that corresponded to species delineation based on biological characteristics (i.e., host range and mating tests). These results are consistent with the study by Chesters et al.38 that was based on a smaller sample size. Although many cryptic species have been found by using mitochondrial DNA barcodes (COI), we found that 28S-D2 nuclear rDNA sequences are useful for identifying these three cryptic species (with only one bp of change, but stable), and the diagnosis characteristics are also used in their description. Nuclear genes (such as 28S) are thought to be less sensitive for detecting recent speciation events when compared with mtDNA genes, although they have been used for distinguishing species54,55,56,57. The present study shows that 28S-D2 could be an important marker for the identification of cryptic species, although more groups of cryptic species should be tested. Once the researcher reaches a conclusion concerning species differences, DNA barcoding data can be used afterwards to more easily indicate the differences either using tree-, distance- or character-based methods as performed in the present study. The frequency with which cryptic species are uncovered with DNA sequence data suggests that molecular data should be incorporated into the routine taxonomy procedure, particularly when the research indicates that morphological analysis can take us no further24,25. Moreover, descriptions of each species should include the molecular features that are actually diagnostic of the species58,59. Genetic material (including that of the Holotype if possible) should be preserved as a reference material so that subsequent molecular analysis is possible for future studies.
Biological elements
In our study, the host species was directly related to the three species of the E. sasakii complex. The individuals of E. eulecaniumiae were all reared from Eulecanium kuwanai and Eulecanium giganteum. E. rhodococcusiae were all reared from Rhodococcus sariuoni, and E. sasakii was reared from Takahashia japonica. Given the high host specificity revealed by these three species, each was collected within the distribution of their hosts. E. eulecaniumiae is usually distributed over northern China, and it closely overlaps the E. rhodococcusiae distribution. In contrast, E. eulecaniumiae is parapatric with E. sasakii. In many cases, additional data, such as the host range, geographic locations or mating tests, might also help to distinguish among cryptic species9,10,36,60,61,62, and such information should also be incorporated into the description.
Conclusions
The present study demonstrated that integrating multiple data resources in taxonomy, particularly when associated with formal species description, is a practical way to improve the quality of species hypotheses and their associated descriptions. The study also highlights the difficulty in drawing objective morphological limits between cryptic species. Although the morphological characteristics are highly similar and continuous and/or overlapping for cryptic species, such as Encyrtus sasakii, E. eulecaniumiae and E. rhodococcusiae, statistical analyses show that some morphological characteristics have significantly differentiated, which is congruent with the results generated from molecular and biological data. Molecular character tools (DNA barcoding) are powerful for the identification and delimitation of cryptic species, and thus the molecular characteristics should be provided in their description and diagnosis. It is also worth emphasizing that multiple sources of diagnosis, including biological and possibly reproductive information, are important during the process of identifying cryptic species.
Materials and Methods
Host population collection and data acquisition
From 2006 to 2014, we surveyed soft scale hosts and their Encyrtus parasitoid wasps in mainland China (Supplementary Figure S3). The rearing and preservation of parasitoids was performed in the same way as by Chesters et al.36. Representative specimens of the Encyrtus complex were used in the MRA, geometric morphometric analysis and molecular sequencing. Female specimens were randomly sampled from different populations according to the population size. The head (with antennae), the wings and the gaster were removed from the body, mounted on slides and uniquely coded; the thorax with the same code was used for DNA extraction and then mounted on the same slide for morphological study. Soft scale insects were identified by Prof. San-An Wu (Beijing Forestry University).
Morphometric analysis (GMA)
We measured the morphometric variables in female specimens using an eyepiece micrometre under a Leitz Dialux 20 (Ernst Leitz, GMBH, Wetzler, Germany) microscope. Measurements were taken in accordance with Noyes63 and Wang et al.64. All the chosen characters (Table 1) are considered diagnostic and have frequently been used in Encyrtidae taxonomy65,66.
Boxplots were made to show the distribution of measurements for each character. Post-hoc comparisons of each morphological character were conducted using Tukey’s HSD test at a 95% family-wise confidence level. All statistical analyses and plots were obtained with R67.
Multivariate ratio analysis (MRA)
We performed a shape principal component analysis (shape PCA) and plotted its isometric size against the first two shape PCs. We also calculated the PCA ratio spectrum for each shape PC as well as the allometry ratio spectrum. The PCA ratio spectrum is a graphical tool that aims to interpret the principal components of shape in terms of body ratios. In a similar manner, the allometry ratio spectrum reveals the allometric behaviour of the ratios. The linear discriminant analysis (LDA) ratio extractor reveals the best ratios for separating two or more groups with the help of an LDA. The measurements were calculated to determine how much of the total difference was due to the size and how much was due to the shape. These methods allow for the interpretation of the results of the frequently used PCA and LDA by body ratios, which can then be directly incorporated into species identification diagnostics. MRAs were implemented using R67 with scripts provided by Baur & Leuenberger34 (under ‘File S1’) and by Baur et al.48 Scatterplots were generated with the package ‘ggplot2’68.
Geometric morphometric analysis (GMA)
Photomicrographs were acquired from slide-mounted specimens using an EVOS f1 inverted microscope (AMG, U.S.A.). Seven landmarks were selected to describe the variations in wing morphology (Fig. 9). The landmarks were as follows: 1, beginning of submarginal vein; 2, end of submarginal vein/beginning of marginal vein; 3, end of marginal vein/beginning of post marginal vein/beginning of stigmal vein; 4, end of postmarginal vein; 5, end of stigma vein; 6, tip of forewing; and 7, tip of posterior margin of forewing. The Cartesian coordinates of the landmarks were digitized with tps-DIG 2.0569.
Figure 9. Photograph of forewing (Encyrtus eulecaniumiae sp. nov., Sample ID: 11-012A) marked by seven landmarks.
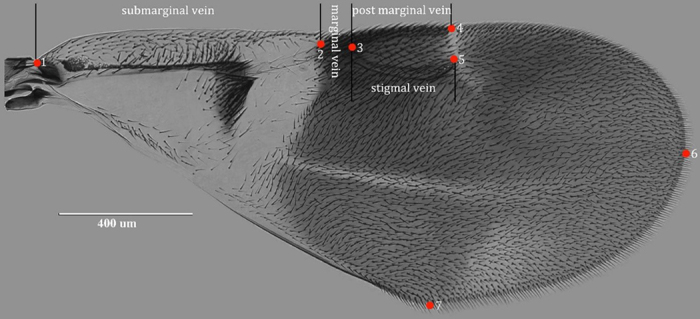
Photo taken by author Ying Wang. The number of landmarks are as follows: (1), the beginning of the submarginal vein; (2), the ending of the submarginal vein/ beginning of the marginal vein; (3), the ending of the marginal vein/ beginning of he post marginal vein/ beginning of the stigma vein; (4), the ending of the postmarginal vein; (5), the ending of the stigma vein; (6), the tip of the fore wing; (7), and the tip of the posterior margin of the fore wing.
We first performed a generalized least squares Procrustes analysis on data acquired from tps-DIG 2.05, and we quantified the similarity in covariance structures at different levels. Next, we computed the matrix correlations between the corresponding covariance matrices. The matrix correlations were tested with a matrix permutation test that was adapted for geometric morphometrics by using PCA with 10,000 permutations. All analyses were performed in MorphoJ70.
Genetic analyses
For DNA extraction, amplification and sequencing, we followed the protocols described by Chesters et al.36. Forward and reverse sequences were assembled and reciprocally edited with BioEdit v7.1.3.071. Neighbour-joining (NJ) tree reconstruction was performed by MEGA672 using the Kimura 2-parameter (K2P) model73. Genetic distances were calculated using both K2P distances and the uncorrected p-distance. Bayesian analyses using COI sequences were conducted with MrBayes v3.274 consisting of two Markov chain Monte Carlo (MCMC) analyses run for 4 000 000 generations, sampling trees every 100 generations and using four chains and default priors. The convergence between the two runs was assessed using the average standard deviation of the split frequencies (below 0.01). The two runs were combined after the removal of the first 1 000 000 generations from each run as a burn-in. The HKY + I + G model of evolution for the COI gene was estimated using jModelTest v2.1.375, and it was selected on the basis of Akaike information criterion (AIC), as suggested by Posada and Buckley76. The identification of diagnostic characters within COI sequences was performed in the Characteristic Attribute Organization System (CAOS)77,78. When all members of a species share these characters, they are termed ‘simple pure characters’77.
Additional Information
How to cite this article: Wang, Y. et al. Formal nomenclature and description of cryptic species of the Encyrtus sasakii complex (Hymenoptera: Encyrtidae). Sci. Rep. 6, 34372; doi: 10.1038/srep34372 (2016).
Supplementary Material
Acknowledgments
We are indebted to Hannes Baur (Department of Invertebrates, Natural History Museum Bern, Switzerland) for research guidance and valuable discussions and to Dr. Marco Gebiola (CNR – Istituto per la Protezione Sostenibile delle Plante, UOS di Portici, Italy) for valuable comments. This research was supported by the National Natural Science Foundation of China (NSFC grant NO. 31071950, 31272350) and the Programs of Ministry of Science and Technology of the People’s Republic of China (2011FY120200, 2012FY111100).
Footnotes
Author Contributions Y.W., Q.-S.Z. and Y.-Z.Z. wrote the paper. Y.-Z.Z. arranged the sample collection. Y.W., Q.-S.Z., Y.-Z.Z., H.-J.Q. F.Y., A.-B.Z. and X.-B.W. analysed the samples. Y.W., Q.-S.Z., Y.-Z.Z. C.-D.Z. and A.-B.Z. performed data interpretation.
References
- Hebert P. D. et al. Biological identifications through DNA barcodes. Proc. Roy. Soc. Lond. Biol. 270, 313–321 (2003). [DOI] [PMC free article] [PubMed] [Google Scholar]
- Vences M. et al. Deciphering amphibian diversity through DNA barcoding: chances and challenges. Philos. Trans. R. Soc. Lond. [Biol] 360, 1859–1868 (2005). [DOI] [PMC free article] [PubMed] [Google Scholar]
- Rubinoff D. Utility of mitochondrial DNA barcodes in species conservation. Conserv. Biol. 20, 1026–1033 (2006).Waugh, J. DNA barcoding in animal species: progress, potential and pitfalls BioEssays 29, 188–19 (2007). [DOI] [PubMed] [Google Scholar]
- Bucklin A., Steinke D. & Blanco-Bercial L. DNA Barcoding of Marine Metazoa. Annu. Rev. Mar. Sci. 3, 471–508 (2011). [DOI] [PubMed] [Google Scholar]
- Hebert P. D. et al. Ten species in one: DNA barcoding reveals cryptic species in the neotropical skipper butterfly Astraptes fulgerator. Proc. Natl. Acad. Sci. USA 101, 14812–14817 (2004). [DOI] [PMC free article] [PubMed] [Google Scholar]
- Silva-Brandão K. L., Lyra M. L. & Freitas A. V. Barcoding lepidoptera: current situation and perspectives on the usefulness of a contentious technique. Neotrop. Entomol. 38, 441–5 (2009). [DOI] [PubMed] [Google Scholar]
- Monaghan M. T. et al. Accelerated species inventory on Madagascar using coalescent-based Models of species delineation. Syst. Biol. 58, 298–311 (2009). [DOI] [PubMed] [Google Scholar]
- Smith M. A. et al. DNA barcodes reveal cryptic host-specificity within the presumed polyphagous members of a genus of parasitoid flies (Diptera: Tachinidae). Proc. Natl. Acad. Sci. USA 103, 3657–3662 (2006). [DOI] [PMC free article] [PubMed] [Google Scholar]
- Schlick-Steiner B. C. et al. Queen size dimorphism in the ant Tetramorium moravicum (Hymenoptera, Formicidae): Morphometric, molecular genetic and experimental evidence. Insectes sociaux 52, 186–193 (2005). [Google Scholar]
- Smith M. A. et al. Extreme diversity of tropical parasitoid wasps exposed by iterative integration of natural history, DNA barcoding, morphology, and collections. Proc. Natl. Acad. Sci. USA 105, 12359–12364 (2008). [DOI] [PMC free article] [PubMed] [Google Scholar]
- Ebach M. C. & Holdrege C. DNA barcoding is no substitute for taxonomy. Nature, 434, 697 (2005). [DOI] [PubMed] [Google Scholar]
- Schlick-Steiner B. C. et al. Without morphology, cryptic species stay in taxonomic crypsis following discovery. Trends Ecol. Evol. 22, 391–392 (2007). [DOI] [PubMed] [Google Scholar]
- Patterson D. J. et al. Names are key to the big new biology. Trends Ecol. Evol. 25, 686–691 (2010). [DOI] [PubMed] [Google Scholar]
- Satler J. D., Carstens B. C. & Hedin M. Multilocus species delimitation in a complex of morphologically conserved trapdoor spiders (Mygalomorphae, Antrodiaetidae, Aliatypus). Syst. Biol. 62, 805–823 (2013). [DOI] [PubMed] [Google Scholar]
- Goldstein P. Z. & DeSalle R. Integrating DNA barcode data and taxonomic practice: determination, discovery, and description. Bioessays 33, 135–147 (2011). [DOI] [PubMed] [Google Scholar]
- Bickford D. et al. Cryptic species as a window on diversity and conservation. Trends Ecol. Evol. 22, 148–155(2007). [DOI] [PubMed] [Google Scholar]
- Nikinmaa M. What is biodiversity ? Stepping forward from barcoding to understanding biological differences. Mar. Genom. 17, 65–67 (2014). [DOI] [PubMed] [Google Scholar]
- Vodă R. et al. Cryptic matters: overlooked species generate most butterfly beta-diversity. Ecography 38, 405–409 (2015). [Google Scholar]
- Desalle R., Egan M. G. & Siddall. M. The unholy trinity: taxonomy, species delimitation, and DNA barcoding. Philos. Trans. R. Soc. Lond. [Biol] 360, 1905–1916 (2005). [DOI] [PMC free article] [PubMed] [Google Scholar]
- Cook L. G. et al. Need morphology always be required for new species descriptions ? Invertebr. Syst. 24, 322–326 (2010) [Google Scholar]
- Pante E., Schoelinck C. & Puillandre N. From integrative taxonomy to species description: one step beyond. Syst. Biol. 64, 152–160(2015). [DOI] [PubMed] [Google Scholar]
- Brower A. V. Z. Alleviating the taxonomic impediment of DNA barcoding and setting a bad precedent: names for ten species of ‘Astraptes fulgerator’ (Lepidoptera: Hesperiidae: Eudaminae) with DNA-based diagnoses. Syst. Biodivers. 8, 485–491 (2010). [Google Scholar]
- Vaglia T. et al. Morphology and DNA barcoding reveal three cryptic species within the Xylophanes neoptolemus and loelia species-groups (Lepidoptera: Sphingidae). Zootaxa 1923, 18–36 (2008). [Google Scholar]
- Oliveira D. A. S. et al. An integrative approach to characterize cryptic species in the Thoracostoma trachygaster Hope, 1967 complex (Nematoda: Leptosomatidae) Zool. J. Linn. Soc. 164, 18–35 (2012). [Google Scholar]
- Jörger K. M. &Schrödl M. How to describe a cryptic species ? Practical challenges of molecular taxonomy. Front. Zool. 10, 1742–9994 (2013). [DOI] [PMC free article] [PubMed] [Google Scholar]
- Steiner F. M. et al. A multisource solution for a complex problem in biodiversity research: Description of the cryptic ant species Tetramorium alpestre sp. n. (Hymenoptera: Formicidae). Zoologischer Anzeiger-A Journal of Comparative Zoology 249, 223–254 (2010). [Google Scholar]
- Navia D. et al. Cryptic diversity in Brevipalpus mites (Tenuipalpidae). Zool. Scripta 42, 406–426 (2013). [Google Scholar]
- Burns J. M. et al. DNA barcodes and cryptic species of skipper butterflies in the genus Perichares in Area de Conservación Guanacaste, Costa Rica. Proc. Natl. Acad. Sci. USA 105, 6350–6355 (2008). [DOI] [PMC free article] [PubMed] [Google Scholar]
- Padial J. M. & De La Riva I. Integrative taxonomy reveals cryptic Amazonian species of Pristimantis (Anura: Strabomantidae). Zool. J. Linnean Soc. 155, 97–122 (2009). [Google Scholar]
- Schlick-Steiner B. C. et al. Integrative taxonomy: a multisource approach to exploring biodiversity. Annu. Rev. Entomol. 55, 421–438 (2010). [DOI] [PubMed] [Google Scholar]
- Katz A. D., Giordano R. & Soto-Adames F. N. Operational criteria for cryptic species delimitation when evidence is limited, as exemplified by North American Entomobrya (Collembola: Entomobryidae). Zool. J. Linnean Soc. 173, 818–840 (2015). [Google Scholar]
- Blaimer B. B. Untangling complex morphological variation: taxonomic revision of the subgenus Crematogaster (Oxygyne) in Madagascar, with insight into the evolution and biogeography of this enigmatic ant clade (Hymenoptera: Formicidae). Sys. Entomol. 37, 240–260 (2012). [Google Scholar]
- Dawson M. N. Macro-morphological variation among cryptic species of the moon jelly fish, Aurelia (Cnidaria: Scyphozoa). Mar. Biol. 143, 369–379(2003). [Google Scholar]
- Baur H. & Leuenberger C. Analysis of ratios in multivariate morphometry. Syst. Biol. 60, 813–825 (2011). [DOI] [PMC free article] [PubMed] [Google Scholar]
- Noyes J. S. Universal Chalcidoidea Database. World Wide Web electronic publication. http://www.nhm.ac.uk/chalcidoids. [Accessed August 2015].
- Chesters D. et al. The integrative taxonomic approach reveals host specific species in an Encyrtid parasitoid species complex. Plos One 7(5), e37655 (2012). [DOI] [PMC free article] [PubMed] [Google Scholar]
- Ishii T. The Encyrtinae of Japan. I. Bulletin of the Imperial Agricultural Experiment Station of Japan 3, 79–160 (1928). [Google Scholar]
- Will K. W. & Rubinoff D. Myth of the molecule: DNA barcodes for species cannot replace morphology for identification and classification. Cladistics, 20, 47–55 (2004). [DOI] [PubMed] [Google Scholar]
- Wiens J. J. & Penkrot T. A. Delimiting species using DNA and morphological variation and discordant species limits in spiny lizards (Sceloporus). Syst. Biol. 51, 69–91 (2002). [DOI] [PubMed] [Google Scholar]
- Mutanen M. Delimitation difficulties in species splits: a morphometric case study on the Euxoa tritici complex (Lepidoptera, Noctuidae). Sys. Entomol. 30, 632–643 (2005). [Google Scholar]
- Lumley L. M. & Sperling F. A. H. Integrating morphology and mitochondrial DNA for species delimitation within the spruce budworm (Choristoneura fumiferana) cryptic species complex (Lepidoptera: Tortricidae). Sys. Entomol. 35, 416–428 (2010). [DOI] [PubMed] [Google Scholar]
- Vinson S. B. Host selection by insect parasitoids. Annu. Rev. Entomol. 21, 109–133 (1976). [Google Scholar]
- Dawson M. N. Cyanea capillata is not a cosmopolitan jellyfish: morphological and molecular evidence for C. annaskala and C. rosea (Scyphozoa: Semaeostomeae: Cyaneidae) in south-eastern Australia. Invertebr. Syst. 19, 361–370 (2005). [Google Scholar]
- Damm S., Schierwater B. & Hadrys H. An integrative approach to species discovery in odonates: from character-based DNA barcoding to ecology. Mol. Ecol. 19, 3881–3893 (2010). [DOI] [PubMed] [Google Scholar]
- Priti H. et al., Integrative taxonomic approach for describing a new cryptic species of bush frog (Raorchestes: Anura: Rhacophoridae) from the Western Ghats, India. PLoS One 11, e0149382 (2016). [DOI] [PMC free article] [PubMed] [Google Scholar]
- Peters R. S. & Baur H. A revision of the Dibrachys cavus species complex (Hymenoptera: Chalcidoidea: Pteromalidae). Zootaxa 2937, 1–30 (2011). [Google Scholar]
- László Z., Baur H. & Tóthmérész B. Multivariate ratio analysis reveals Trigonoderus pedicellaris Thomson (Hymenoptera, Chalcidoidea, Pteromalidae) as a valid species. Sys. Entomol. 38, 753–762 (2013). [Google Scholar]
- Baur H. et al. Morphometric analysis and taxonomic revision of Anisopteromalus Ruschka (Hymenoptera: Chalcidoidea: Pteromalidae) – an integrative approach. Sys. Entomol. 39, 691–709(2014). [DOI] [PMC free article] [PubMed] [Google Scholar]
- Villemant C., Simbolotti G. & Kenis M. Discrimination of Eubazus (Hymenoptera, Braconidae) sibling species using geometric morphometrics analysis of wing venation. Sys. Entomol. 32, 625–634 (2007). [Google Scholar]
- Pretorius E. & Scholtz C. H. Geometric morphometrics and the analysis of higher taxa: a case study based on the metendosternite of the Scarabaeoidea (Coleoptera). Biol. J. Linn. Soc. 74, 35–50 (2001). [Google Scholar]
- Baylac M., Villemant C. & Simbolotti G. Combining geometric morphometrics with pattern recognition for the investigation of species complexes. Biol. J. Linn. Soc. 80, 89–98 (2003). [Google Scholar]
- Milankov V. et al. High molecular and phenotypic diversity in the Merodon avidus complex (Diptera, Syrphidae): Cryptic speciation in a diverse insect taxon. Zool. J. Linn. Soc. 155, 819–833 (2009). [Google Scholar]
- Mottern J. L. & Heraty J. M. The dead can talk: Museum specimens showthe origins of a cryptic species used in biological control. Biol. Control. 71, 30–39 (2014). [Google Scholar]
- Babcock C. S. & Heraty J. M. Molecular markers distinguishing Encarsia mosa and Encarsia luteola (Hymenoptera: Aphelinidae). Ann. Entomol. Soc. Am. 93, 738–744 (2000). [Google Scholar]
- Monaghan M. T., Balke N., Gregory T. R. & Vogler A. P. DNA-based species delineation in tropical beetles using mitochondrial and nuclear markers. Philos. Trans. R. Soc. Lond. [Biol] 360, 1925–1933 (2005). [DOI] [PMC free article] [PubMed] [Google Scholar]
- Derycke S. et al. Disentangling taxonomy within the Rhabditis (Pellioditis) marina (Nematoda, Rhabditidae) species complex using molecular and morphological tools. Zool. J. Linnean Soc. 152, 1–15 (2008). [Google Scholar]
- Raupach M. J. et al. Molecular species identification of Central European ground beetles (Coleoptera: Carabidae) using nuclear rDNA expansion segments and DNA barcodes. Front. Zool. 7, 26 (2010). [DOI] [PMC free article] [PubMed] [Google Scholar]
- Dayrat B. Towards integrative taxonomy. Biol. J. Linn. Soc. 85, 407–415 (2005). [Google Scholar]
- Padial J. M. et al. The integrative future of taxonomy. Front. Zool. 7, 16 (2010). [DOI] [PMC free article] [PubMed] [Google Scholar]
- Gebiola M. et al. Integration of molecular, ecological, morphological and endosymbiont data for species delimitation within the Pnigalio soemius complex (Hymenoptera: Eulophidae). Mol. Ecol. 21, 1190–1208 (2012). [DOI] [PubMed] [Google Scholar]
- Rissler L. J. & Apodaca J. J. Adding more ecology into species delimitation: ecological niche models and phylogeography help define cryptic species in the black salamander (Aneides flavipunctatus). Syst. Biol. 56, 924–942 (2007). [DOI] [PubMed] [Google Scholar]
- Tan D. S. et al. From ‘cryptic species’ to integrative taxonomy: an iterative process involving DNA sequences, morphology, and behaviour leads to the resurrection of Sepsis pyrrhosoma (Sepsidae: Diptera). Zool. Scripta 39, 51–61 (2010). [Google Scholar]
- Noyes J. S. Encyrtidae of Costa Rica (Hymenoptera: Chalcidoidea), 1.The subfamily Tetracneminae, parasitoids of mealybugs (Homoptera: Pseudococcidae). Memoirs of the American Entomological Institute 62, 1–355 (2000). [Google Scholar]
- Wang Y., Li C. D. & Zhang Y. Z. A Taxonomic Study of Chinese Species of alberti Group in Metaphycus (Hymenoptera: Encyrtidae). Zookeys 285, 53–88 (2013). [DOI] [PMC free article] [PubMed] [Google Scholar]
- Noyes J. S. & Hayat M. Oriental mealybug parasitoids of the Anagyrini (Hymenoptera: Encyrtidae). CAB International, Oxon, UK, 554 pp (1994). [Google Scholar]
- Noyes J. S. Encyrtidae of Costa Rica (Hymenoptera: Chalcidoidea), 3. Subfamily Encyrtinae: Encyrtini, Echthroplexiellini, Discodini, Oobiini and Ixodiphagini, parasitoids associated with bugs (Hemiptera), insect eggs (Hemiptera, Lepidoptera, Coleoptera, Neuroptera) and ticks (Acari). Memoirs of the American Entomological Institute 84, 848 pp (2010). [Google Scholar]
- R Development Core Team. R: A language and environment for statistical computing: R Foundation for Statistical Computing, Vienna, Austria (2014).
- Wickham H. ggplot2: Elegant Graphics for Data Analysis (Use R!). Springer, New York, NY (2010). [Google Scholar]
- Rohlf F. J. tps-DIG, Digitize Landmarks and Outlines, Version 2.05. [Software and Manual]. New York: Department of Ecology and Evolution. State University of New York at Stony Brook (2006). [Google Scholar]
- Klingenberg C. P. MorphoJ. Faculty of life sciences, University of Manchester, UK. Website http://www. flywings.org.uk/MorphoJ_page.htm (2008).
- Hall T. A. BioEdit: a user-friendly biological sequence alignment editor and analysis program for Windows 95/98/NT. Nucleic Acids Symp. Ser. 41, 95–98 (1999). [Google Scholar]
- Tamura K. et al. MEGA6: Molecular Evolutionary Genetics Analysis version 6.0. Mol. Biol. Evol. 30, 2725–2729 (2013). [DOI] [PMC free article] [PubMed] [Google Scholar]
- Kimura M. A simple method for estimating evolutionary rates of base substitutions through comparative studies of nucleotide sequences. J. Mol. Evol. 16, 111–120 (1980). [DOI] [PubMed] [Google Scholar]
- Ronquist F. et al. MrBayes 3.2: efficient Bayesian phylogenetic inference and model choice across a large model space. Syst. Biol. 61, 539–542 (2012). [DOI] [PMC free article] [PubMed] [Google Scholar]
- Darriba D. et al. jModelTest 2: more models, new heuristics and parallel computing. Nature Methods 9, 772–772 (2012). [DOI] [PMC free article] [PubMed] [Google Scholar]
- Posada D. & Buckley T. R. Model selection and model averaging in phylogenetics: advantages of Akaike information criterion and Bayesian approaches over likelihood ratio tests. Syst. Biol. 53, 793–808 (2004). [DOI] [PubMed] [Google Scholar]
- Sarkar I. N. et al. Systematic method for classification of novel homeoboxes. Mol. Phylogenet. Evol. 24, 388–399 (2002). [DOI] [PubMed] [Google Scholar]
- Sarkar I. N., Planet P. J. & DeSalle R. CAOS software for use in character-based DNA barcoding. Mol. Ecol. Resour. 8, 1256–1259 (2008). [DOI] [PubMed] [Google Scholar]
Associated Data
This section collects any data citations, data availability statements, or supplementary materials included in this article.


