Abstract
Recent studies have linked human gut microbes to obesity and inflammatory bowel disease, but consistent signals have been difficult to identify. Here we test for indicator taxa and general features of the microbiota that are generally consistent across studies of obesity and of IBD, focusing on studies involving high-throughput sequencing of the 16S rRNA gene (which we could process using a common computational pipeline). We find that IBD has a consistent signature across studies and allows high classification accuracy of IBD from non-IBD subjects, but that although subjects can be classified as lean or obese within each individual study with statistically significant accuracy, consistent with the ability of the microbiota to experimentally transfer this phenotype, signatures of obesity are not consistent between studies even when the data are analyzed with consistent methods. The results suggest that correlations between microbes and clinical conditions with different effect sizes (e.g. the large effect size of IBD versus the small effect size of obesity) may require different cohort selection and analysis strategies.
Introduction
Recent advances in our ability to characterize the gut microbiota have led to tremendous interest in identifying organisms associated with different human diseases. Two general categories of disease that have attracted widespread interest are obesity, diabetes and metabolic syndrome, and inflammatory bowel disease including Crohn's disease and ulcerative colitis. In both cases, significant associations with disease have been reported by different studies. However, conflicting signals have been seen in the taxa associated with each disorder (as described in more detail below).
A major issue with comparing the results of different studies of the gut microbiota is that technical differences, including differences in DNA extraction protocols, PCR primers, etc. can often outweigh biological differences in the samples, especially when biological effect sizes are small [1]. Even computational differences, including which taxonomy database is used and which taxonomy assignment algorithm is used, can have surprisingly large effects [2]. These issues can be partially overcome for 16S rRNA amplicon studies by downloading all the relevant data and analyzing them with consistent methods [1].
Accordingly, for studies of obesity and IBD, we utilized recent studies identifying microbial association with disease using amplicon sequencing, and analyzed the raw sequence data using a consistent set of methods to test whether these diseases, widely reported as having associations with the human gut microbiome, harbored consistent signatures associated with disease.
Methods
To test which trends at the broad phylogenetic level or at finer taxonomic resolution were consistent across 16S amplicon survey studies, we performed a meta-analysis of high-throughput amplicon sequencing studies. We processed demultiplexed data (i.e. sequences already assigned to their samples by barcode, downloaded from each study from the QIIME database, http://www.microbio.me/qiime/) using QIIME 1.8.0. Mapping files containing clinical information were also downloaded from the QIIME database. Samples lacking BMI or IBD data were filtered out, and BMI data were binned into categories of normal or obese based upon CDC BMI criteria (http://www.cdc.gov/healthyweight/assessing/bmi/adult_bmi/index.html). The data were clustered at 97% identity against the Greengenes database (August 2013 release) [3]using UCLUST [4] v1.2.22q, discarding reads that failed to match the reference sequences, which is referred to as a “closed reference” approach to clustering. Taxonomies came directly from the reference database based upon the identity of the reference sequence clustered against. The 97% OTUs phylogenetic tree supplied with Greengenes was used for UniFrac [5] metrics. OTU tables were rarefied at 1000 sequences per sample for beta diversity (UniFrac), Kruskal-Wallis tests, and supervised learning. Unrarefied tables were repeatedly (×10) subsampled at 1000 sequences per sample for alpha diversity metrics (Observed Species, Shannon, and Phylogenetic Diversity). Data were not rarefied for taxonomic abundance comparisons (ratios of Firmicutes:Bacteroidetes), but low-abundance (<1000 sequences per sample) samples were filtered out to remove samples with questionable PCR or sequencing yields. The reason for taking the closed-reference approach is due to the various PCR primers used in different studies, which covered different regions of the 16S amplicon, so sequences from the same 16S gene would fall into different clusters because of the lack of overlap in the sequences if data were clustered de novo.
Results
Microbes associated with obesity
Obesity, and its related comorbidities, is a globally prevalent issue, and is expected to affect over half a billion people by 2030 [6]. Although microbes are by no means the sole factor in the obesity epidemic, alterations in the gut microbiota have been observed in obese humans [7, 8], microbial differences have been reported to classify people as lean or obese with ∼90% accuracy [9, 10], and in mouse models the obesity phenotype is partially transmissible via transmitting the microbes[11, 12], establishing that microbes can contribute to obesity. However, the nature of the microbial changes associated with obesity is less clear, unlike the more obvious differences that are present in the case of IBD. Conflicting reports exist regarding broad, phyla-level shifts in obese human guts. Many studies show an increased ratio of Firmicutes:Bacteroidetes [8, 13-19] although some other studies show no trend, or even the opposite trend [20-24]. However these studies vary in their methodology for sequencing and quantifying taxa (including amplicon sequencing, qPCR, rtPCR, PhyloChip, and HITChip). These studies have shown significant (and occasionally contradictory) enrichment for more specific taxa (Table 1). The sequencing data utilized in this study are the subset of studies with high-throughput amplicon sequencing data, and these are summarized in Table 2. The relative abundance of dominant gut taxa in each study is shown in Figure 1. Variation on a per-study basis is considerable even at the phylum level. To address the question of whether the Firmicutes:Bacteroidetes ratio increase is significantly associated with obesity, we compared the means of the ratios for subjects with normal versus obese BMI (BMI category is determined using criteria from the Centers for Disease Control). These ratios are shown in Figure 2. In all studies except one [25], there is a trend showing an increase in the ratio of Firmicutes:Bacteroidetes in obese over lean subjects. However, no significant differences overall between obese and lean categories were found using Wilcoxon rank-sum tests in R 3.1.0 [26], nor was the difference in Firmicutes:Bacteroidetes ratio statistically significant using Fisher's Method for combining multiple independent tests of a hypothesis [27]. Because several studies [8, 25, 28] used the same PCR primers yet had opposite trends between lean and obese subjects in their respective populations, primer bias cannot drive the differences in observed Firmicutes:Bacteroidetes ratio or in the overall taxa summaries in Figure 1. Differences in sample handling and extraction, or differences among the populations studied, could account for the contradictory observations. In any case, the ratio changes between normal and obese individuals are not statistically significant overall and therefore should not be considered a general feature distinguishing normal and obese human gut microbiota across populations.
Table 1. Reported taxon enrichment and depletion in the obese gut as reported in prior studies.
| Abundance shifts in obese guts | |||
|---|---|---|---|
| Taxa | Increased | Decreased | Citation |
| Actinobacteria | |||
| Bifidobacterium (genus) | + | [23] | |
| Bifidobacterium animalis | + | [46] | |
| Euryarchaeota | |||
| Methanobrevibacter smithii | + | + | [22, 23] |
| Firmicutes | |||
| Oscillospira [sp] | + | [24] | |
| Clostridium cluster XIVa | + | [18] | |
| Roseburia intestinalis | + | [18, 24] | |
| Eubacterium rectale | + | [15, 24] | |
| Faecalibacterium prausnitzii | + | [16, 18] | |
| Lactobacillus (genus) | + | [13, 47] | |
| Lactobacillus casei/paracasei | + | [46] | |
| Lactobacillus reuteri | + | [46] | |
| Bacteroidetes | |||
| Bacteroides (genus) | + | [15, 22] | |
| Bacteroides vulgates | + | [13, 18] | |
| Bacteroides uniforms | + | [18] | |
| Alistipes (genus) | + | [18] | |
Table 2. Studies used for BMI component of meta-analysis.
| Study | Sequencing Platform | Observations |
|---|---|---|
| Zupancic [25] | 454 | Lack of correlations to BMI, however, certain taxa were positively (e.g B. ovatus, R. torques) or negatively (e.g. F. prausnitzii, Clostridium glycolicum) correlated to metabolic syndrome traits |
| Turnbaugh [8] | 454 | Reduced diversity in obese microbiome, shift to higher Firmicutes abundance in obese subjects |
| Human Microbiome Project [44] | 454 | Modest association of oral Pseudomonadaceae with BMI, not associations reported with gut microbiome. |
| Wu [28] | 454 | Oscillibacter genus negatively correlated to BMI, Veillonellaceae positively correlated to BMI. Long-term diet shaped the Prevotella (high fiber) versus Bacteroides (high fat) abundances in the subjects. |
| Yatsunenko [45] | Illumina HiSeq | Reported results did not discuss BMI, although diet-specific metabolism differences were detected across populations |
Figure 1. Relative abundance of phylum-level gut microbial taxa.
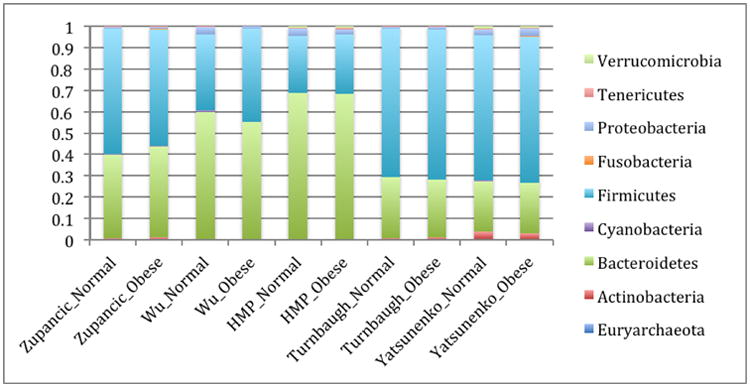
Studies listed below are Zupancic [25], Wu [28], Human microbiome project [44], Turnbaugh [8], and Yatsunenko[45].
Figure 2.
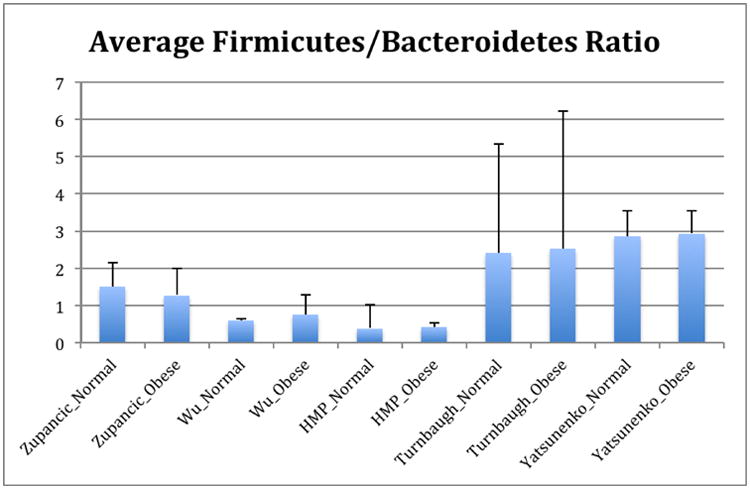
Ratios of Firmicutes:Bacteroidetes in normal versus obese BMI subjects. Means of ratios for each study/BMI category are shown. Error bars are standard error of the mean. The Turnbaugh study includes a number of samples with extremely low Bacteroidetes, leading to large standard error values.
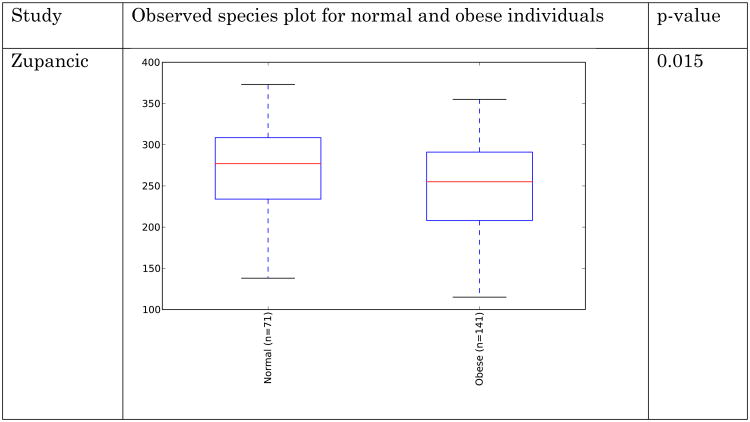
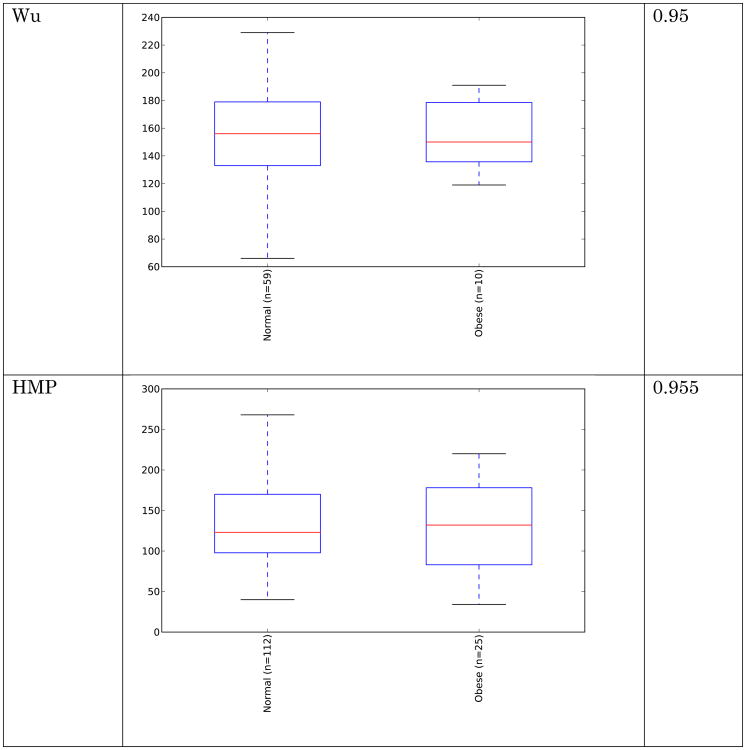
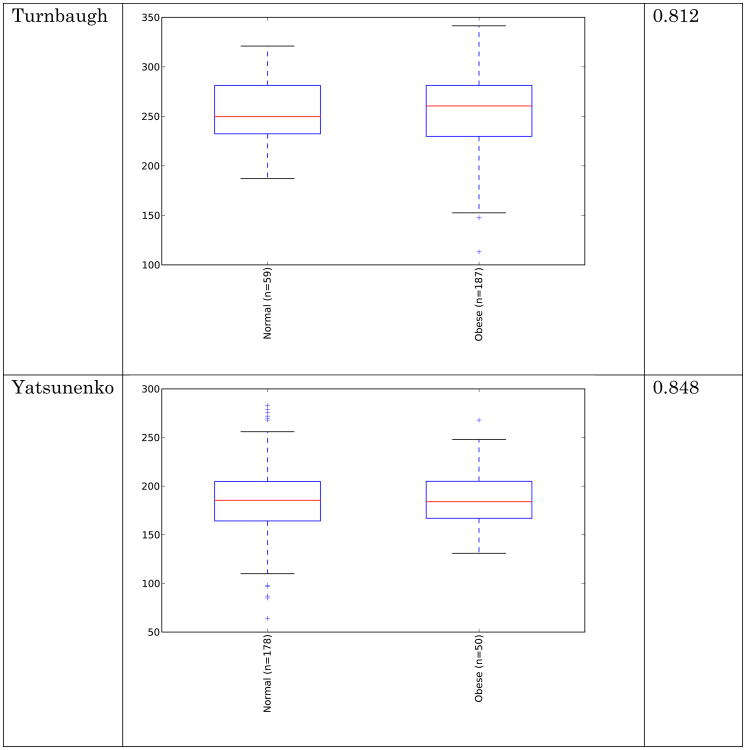
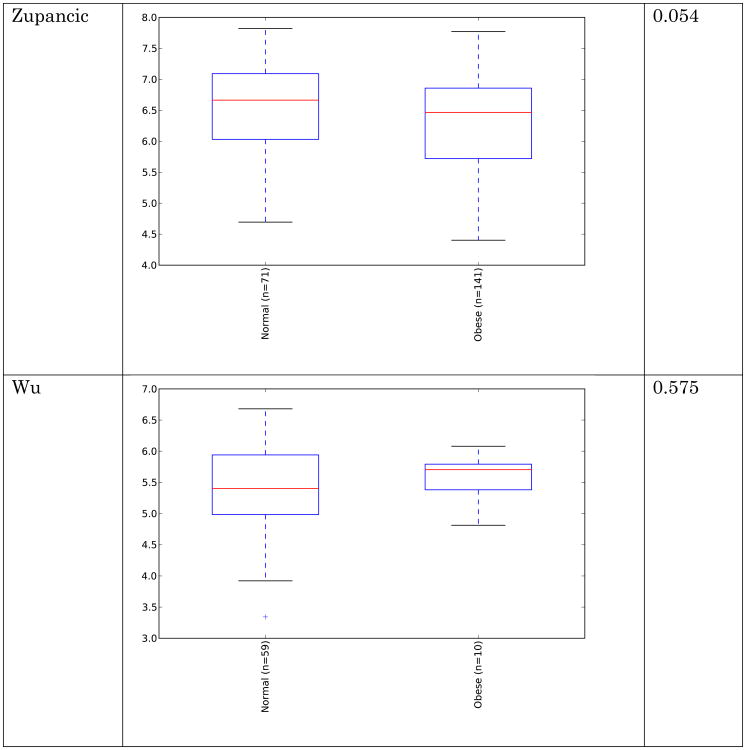
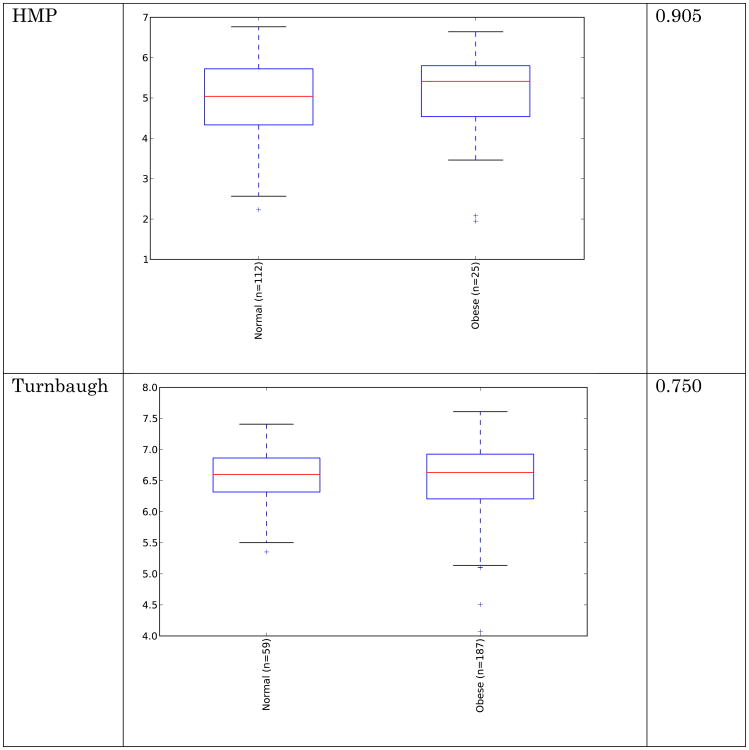
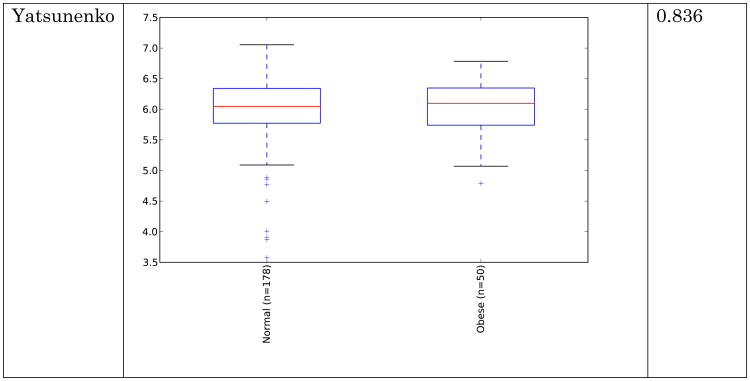
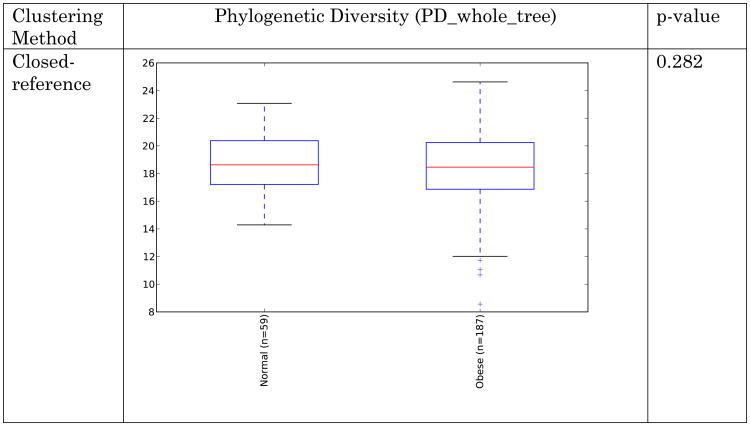
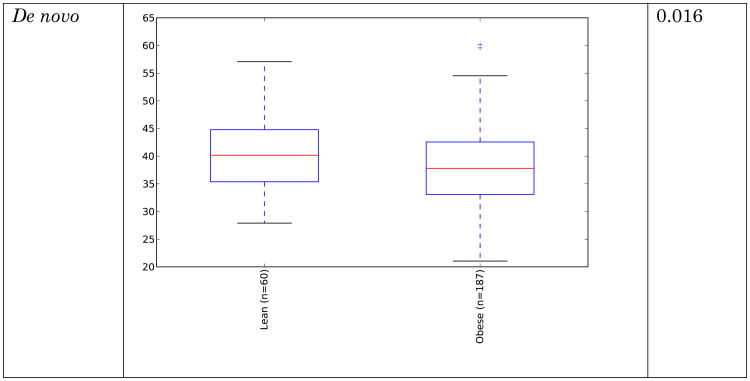
Obese individuals have also been reported to have less diverse gut microbiota than normal weight individuals [8, 10]. Differences are shown in Figure 3 and Figure 4 below for observed species (count of unique species) and the Shannon metric [29], a measure of species abundance and evenness, for each of the studies. As Figures 3 and 4 show, there is no consistent alpha diversity trend across 16S amplicon surveys of human BMI, and only one study showed significant differences with the observed species metric. In addition to the OTU-level alpha diversity calculations, significance was tested with taxonomic levels from phylum to species across each study with the Shannon and observed species metric. Only the phylum level Wu et al data have a significant difference (p-value 0.039) with the Shannon metric. Turnbaugh et al. detected increased phylogenetic diversity (QIIME's PD_whole_tree metric) in lean samples versus obese samples (supplementary figure 1C of [8]). The closed-reference data generated during this analysis did not yield significantly different alpha diversity with the phylogenetic diversity metric, although the Turnbaugh data processed in a de novo fashion (pick_otus script with default settings, using UCLUST v1.2.22q, followed by alignment of representative sequences with PyNast 1.2, filtering, and phylogenetic tree construction with FastTree 2.1.3, all using default QIIME parameters) shows a significant difference in diversity, replicating the observation of Turnbaugh et al 2009, as shown in Figure 5. The observed species and Shannon metric did not yield significant differences with the de novo processed data (not shown).
Figure 3.
Alpha diversity (observed species) across studies. Metric is observed species (counts of unique OTUs). Sequence depth is 1000 sequences per sample, and subsampling was performed 10 times. P-values were calculated by using a Monte Carlo simulation with 999 permutations
Figure 4.
Alpha diversity (Shannon) across studies. Metric is Shannon (abundance and evenness). Sequence depth is 1000 sequences per sample, and subsampling was performed 10 times. P-values were calculated by using a Monte Carlo simulation with 999 permutations
Figure 5.
Alpha diversity (PD) for Turnbaugh et al data [8] across clustering methods. Metric is phylogenetic diversity (a measure of branch length of the phylogenetic tree occupied by the sequences present in the samples). Sequence depth is 1000 sequences per sample, and subsampling was performed 10 times. P-values were calculated by using a Monte Carlo simulation with 999 permutations
These results indicate that the overall diversity of the community, at least by 16S amplicon surveys, does not generally distinguish communities when closed-reference OTU picking is employed (requiring sequences to match what is already in the sequence database), although the difference seen in the de novo approach could indicate that novel taxa, not represented in the reference database, may differentiate these communities. Additionally, overall genomic content, as observed by Le Chatelier et al [10], but not by Turnbaugh et al. [8], could still be more diverse in lean communities due to genomic variation that is not detected using the 16S amplicon survey approach.
Clustering of the data showed no trend based upon BMI (the data clustered strongly by study, but no trends were observed within each study according to BMI). The PCoA plot (using unweighted UniFrac distances) in Figure 6 shows clustering colored by study and by normal/obese BMI categories (BMI categories not significantly different via PERMANOVA test). These results indicate that per-study effects are much larger than the biological effects separating lean from obese individuals, and point to a need to control for variation among studies.
Figure 6. Clustering of BMI samples with unweighted UniFrac.
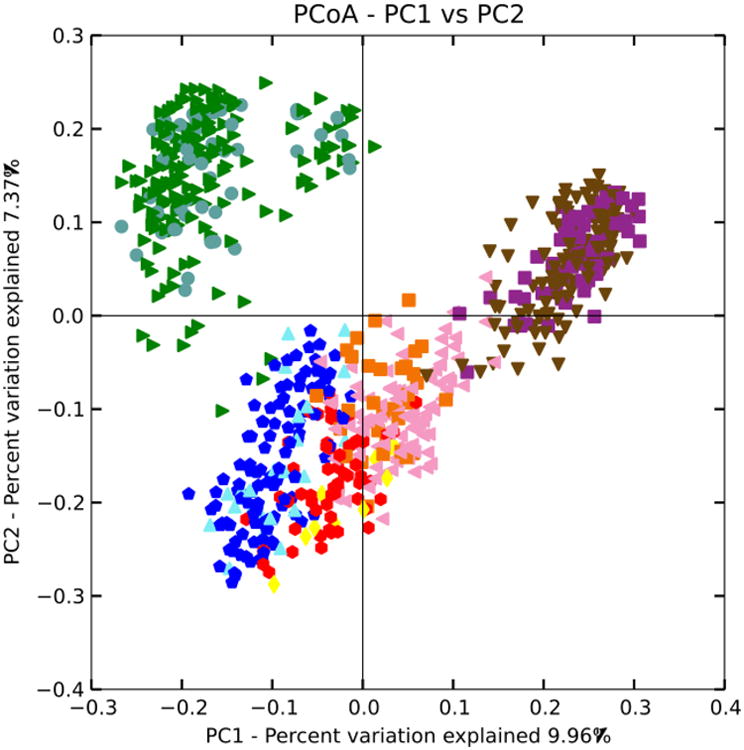
Shape/Color: Study/BMI category
Purple square: Zupancic normal
Brown triangle: Zupancic obese
Orange square: Turnbaugh normal
Pink triangle: Turnbaugh obese
Red circle: Wu normal
Yellow diamond: Wu obese
Dark blue circle: HMP normal
Light blue triangle: HMP obese
Green triangle: Yatsunenko normal
Grey circle: Yatsunenko obese
Next, differences between taxa (examining all taxonomic levels from phylum down to species) within the studies were tested using a Kruskal-Wallis test. These are shown in Table 3. The depletion of Faecalibacterium prausnitzii in the gut microbiota of obese individuals is consistent with prior studies. The species of Megasphaera that is increased in obese subjects is unknown, but it may fill the same niche in the obese gut as the short-chain fatty acid producers Eubacterium and Roseburia (fermenting excess carbohydrates into fatty acids absorbed by the host) [30] that were previously observed to be increased in obese human fecal microbiota (Table 1). There is a slight, but significant depletion of an unclassified OTU (Clostridiaceae family) for obese subjects in the Yatsunenko study. The nearest NCBI blast matches of cultured taxa include members of Clostridium cluster XI, which do not have unified metabolic properties. The failure to replicate the prior results may be due to actual population differences or alternative detection/quantification methods (e.g. amplicon sequencing versus qPCR) yielding different results.
Table 3. Significant taxa associated with BMI via Kruskal-Wallis test.
FDR multiple comparison correction used. Only taxa with at least 0.5% relative abundance in at least one of the BMI categories were included.
| Study | Taxa | Obese mean | Normal Mean | p-value |
|---|---|---|---|---|
| Zupancic | Faecalibacterium prausnitzii | 0.031914894 | 0.0447 | 0.023 |
| Turnbaugh | Megasphaera [sp] | 0.006372549 | 3.13 × 10⁻⁵ | 0.004 |
| Yatsunenko | Clostridiaceae | 0.00214 | 0.005011236 | 0.022 |
Application of supervised learning (a form of machine learning where each sample is placed into a category that is used to create a training data set) with the random forest algorithm [31], i.e. decision trees based upon features, such as abundance of particular taxa, were used to build a model for placement of samples into categories for each study (across multiple levels of taxa, from phylum to the OTU level) for the normal and obese BMI categories. These had limited predictive power over random guessing (data not shown) using the QIIME supervised_learning.py script with default settings. Previous work [9] showed that one was able to classify the samples from the Turnbaugh dataset [8] into lean or obese subjects with the highest accuracies when clustering was done at lower thresholds than the standard 97% OTU threshold (the optimal threshold was ∼82%). To replicate this approach, we clustered the demultiplexed sequence data using the pick_otus.py script utilizing UCLUST [4] v1.2.22q as the algorithm, and specified an identity of clustering of 0.600 to 0.995 in 0.05 % increments, which is a finer gradation but includes the original percent identities utilized by Knights [9]. These analyses revealed that the current implementation of supervised learning in QIIME has an important limitation for datasets which have categories whose composition are highly similar, such as lean and obese humans: the classifier is quite sensitive to disparities in the sample sizes, as shown below. The Turnbaugh data were evenly sampled at 1000 sequences per sample, and processed with QIIME's supervised_learning.py (which uses random forests as its method) using 10× cross-fold validation for error estimation. Predicted error ratios are shown below in Figure 7, which show far better results for an even subset of the data matching the samples utilized originally by Knights (61 lean samples and 61 obese samples, identified in Appendix A), and marginally better results for a random subset (30 lean versus 30 obese samples randomly chosen 10× for each percent identity, with the average error ratio plotted) versus the entirety of the data (61 lean samples versus 196 obese samples).
Figure 7. Comparison of supervised learning error ratios to clustering identity of data.
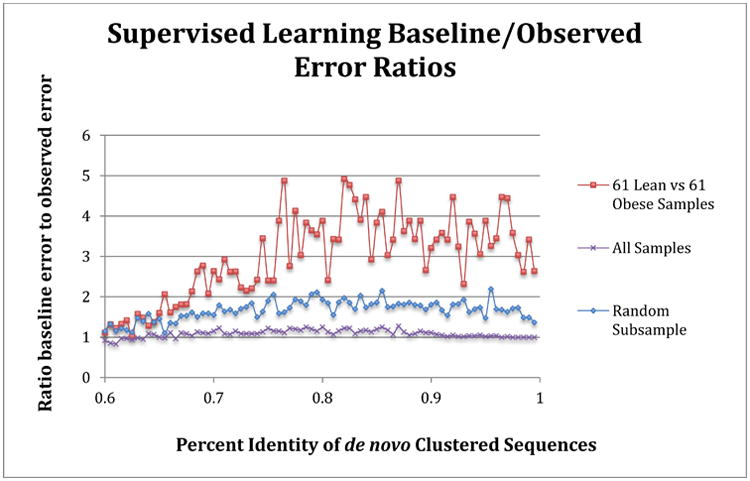
Samples matching those used in Knights et al [9] replicated the improved classifications relative to random guessing (value of 1) for lean and obese subjects in the Turnbaugh [8] study, and are shown as the red line. The average error ratio for a random subsample of 30 obese and lean samples (10× sample at each percent identity, average ratio is shown) is depicted in blue. The purple line shows the classification error ratio when all samples (61 lean versus 196 obese samples), which is essentially no better than random guess for any clustering identity. The sequences were clustered using a de novo approach for each percent identity listed.
To handle uneven sample abundances with data that are highly similar, such as in the obese versus lean human fecal 16S sequence, and still generate models that can accurate classify samples into categories, we used the receiver operator characteristic (ROC) curve approach. This approach uses an area under the curve (AUC) calculation to optimize feature (in this case OTU) selection, which maximizes sensitivity and specificity for categorization of samples into lean and obese groups. The commands are listed in Appendix B (the R scripts are provided as supplementary files). In contrast to the results in figure 7, when ROC-based optimization was used, the entire Turnbaugh dataset can be classified with over 80% accuracy at a range of OTU thresholds, as shown in Figure 8. A ROC AUC value of 0.5 is no better than random guess, and 1.0 corresponds to perfect sensitivity and specificity. The OTU threshold identities that resulted in the best classification ranged from 77.5% to 98.0%.
Figure 8. Receiver operator characteristic curve values for all Turnbaugh lean and obese subjects.
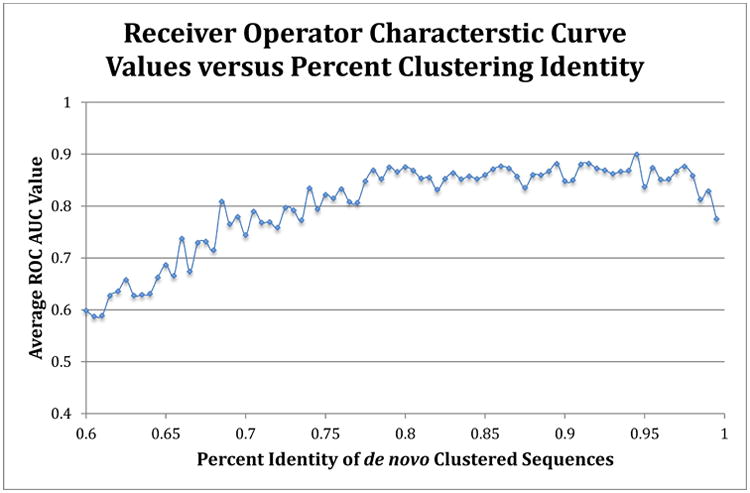
The average ROC area under the curve value (using random forest method) for each clustering identity was calculated by the averaging the 5× repeated (with 10-fold cross-validation) optimized ROC values. A 0.5 value indicates no better than random guess, while 1.0 indicates perfect sensitivity and specificity. The sequences were clustered using a de novo approach for each percent identity listed.
Application of the ROC-based supervised learning approach to the closed-reference 97% OTUs across each BMI study resulted in classification that was better than random, although only marginally in some cases. The ROC values are listed in Table 4, and the confusion matrices for each study are shown in Table S1.
Table 4. Receiver operator characteristic curve values for 97% closed-reference OTUs by study.
Values listed are average values of 5× repeated ROC analyses, using random forest method, with 10-fold cross validation.
| Study | ROC AUC Values | Standard Deviation |
|---|---|---|
| Turnbaugh | 0.7250379 | 0.1488683 |
| Amish | 0.6077041 | 0.1103585 |
| HMP | 0.6656818 | 0.1295004 |
| Wu | 0.8623333 | 0.1638126 |
| Yatsunenko | 0.6259477 | 0.1033857 |
Taken together, examination of the broad taxonomic shifts (e.g. the Firmicutes:Bacteroidetes ratios), alpha diversity of communities, clustering of obese versus lean individuals, and shifts of taxa within communities, suggests that there are only weak and, for the most part, non-significant associations of particular taxa or overall diversity with the obese human gut that hold true across different studies. However, using supervised learning with receiver operator curves to maximize sensitivity and specificity, one can categorize subjects according to lean and obese states with in some cases considerable accuracy, indicating that there are features present that discriminate between the lean and obese human fecal microbiota within each study but that are not consistent across different studies. As these features are not detected by other significance tests, this indicates that numerous small differences are present in the communities, rather than large differences in a few microbial taxa.
The methodologies for sample handling, extraction, PCR amplification, and sequencing technologies could all contribute to the differences observed between studies (Figures 1-2). However, any prior observed differences due to algorithms or reference databases have been eliminated in this analysis. It is clear that the obesity phenotype is transmissible via microbes [12, 32] and hence there exist real differences between these microbial communities that confer physiologically relevant effects. The actual differences, if detectable with 16S surveys, are likely to be found with indicator taxa, such as Faecalibacterium prausnitzii, or alternatively, by measurements of minute changes over the community.
Microbes associated with IBD
Inflammatory bowel disease (IBD), which includes Crohn's Disease and Ulcerative Colitis [33], has clearer reported taxonomic shifts than obesity, including a depletion of Firmicutes and Bacteroides and enrichment in Proteobacteria and Actinobacteria [34]. Epithelial-associated microbes of the small and large intestine are different than fecal microbiota [35, 36], and are more likely to be key players in the etiology of IBD because of their more direct interaction with the affected tissues and the mucosal immune system. Despite the disparity in the fecal and epithelial-associated microbiota, detectable changes in fecal microbiota are still present in individuals with IBD [37]. This raises two clinically important questions: can particular forms of IBD be diagnosed from fecal samples alone (and avoid invasive medical procedures), and are such potential diagnostics consistent across populations studied (i.e., what dataset, if any, can be used to test an incoming sample from a random individual and have reasonably high accuracy in predicting if the subject has a particular form of IBD)? To address these questions, we examined studies of IBD based on human fecal 16S high-throughput sequencing surveys [37-40] plus a study of a Swedish cohort led by Gina Lamendella that is currently unpublished (summarized in Table 5). These data were processed with QIIME 1.8.0, using the same software packages/settings with the closed-reference approach described in Methods above, except for the even sampling depth used for beta diversity, Kruskal-Wallis tests, and supervised learning, which was 1004 sequences per sample.
Table 5. Studies used for IBD component of meta-analysis.
| Study | Sequencing Platform | Observations |
|---|---|---|
| Papa [37] | 454 | The authors observed decreased diversity in IBD patients, depletion in Firmicutes, increased Proteobacteria and Actinobacteria in IBD subjects. |
| Momozawa [38] | 454 | The purpose of study was to examine the differences between the microbiome of intestinal biopsies and stool and how extraction techniques altered the microbiome. A subset of subjects, with IBD, were present and used for this meta-analysis, but no conclusions regarding IBD itself were reported in this study. |
| Morgan [39] | 454 | The authors observed decreased Firmicutes abundance and increase Proteobacteria abundance in IBD subjects. |
| Willing [40] | 454 | The authors found differences among categories of IBD (e.g. ulcerative colitis and ileal Crohn's disease) versus healthy controls. The smallest differences were observed in ulcerative colitis, and the largest in small intestinal forms of IBD. |
| Lamendella (unpublished) | Illumina MiSeq | This study is a Swedish cohort, with longitudinal stool samples along with flare-up and remission data. |
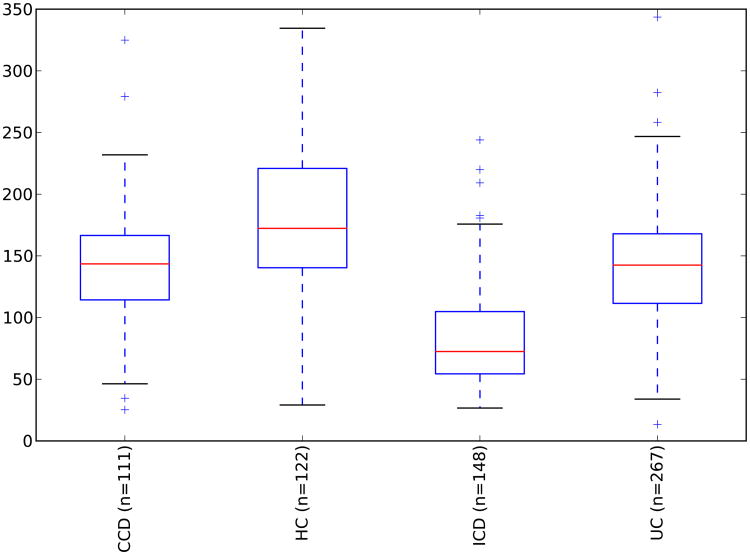
These resulting taxonomic distributions for the three variants of IBD (UC=ulcerative colitis, CCD=colonic Crohn's disease, ICD=ileal Crohn's disease) and healthy controls (HC) are shown in Figure 9, and match the expected enrichment (Actinobacteria, Proteobacteria) and depletion (Bacteroidetes, Firmicutes) previously observed.
Figure 9. Phylum-level taxa plots for IBD subjects versus healthy controls.
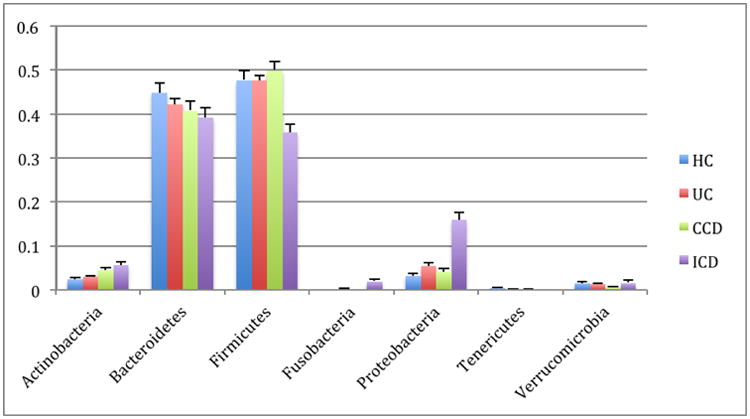
Seven most abundant phyla shown. HC=healthy controls, UC=ulcerative colitis, CCD=colonic Crohn's disease, ICD=ileal Crohn's disease. Error bars indicate standard error of the mean.
Clustering of healthy controls versus IBD samples are significantly different with a p-value < 0.050 with PERMANOVA tests of unweighted UniFrac distances. These PCoA plots are shown in Figure 10. A study effect is also apparent, which is seen in other PCoA axes (not shown). The small intestinal Crohn's disease samples clustered the most distinctly from the healthy controls, and there was substantially more overlap between healthy subjects and ulcerative colitis samples, which again reflects previous observations including a recent large cross-cohort analysis [41]. Next, the significant taxa associated with IBD states were tested using the Kruskal-Wallis test. These taxa are listed in Table 6. These taxa appear generally consistent with prior observations of enrichment, although there is a interesting result of increased Bifidobacterium adolescentis and Lactobacillus in ICD and CCD samples, as these taxa have been used to treat chemically induced colitis [42]. Most of the prior studies recorded decreases in the overall abundance of the Bacteroidetes phylum, which was observed in this analysis as well (Figure 9), although these were not detected as significantly different at the phylum level with Kruskal-Wallis tests.
Figure 10. PCoA plots of healthy controls versus subjects with IBD.
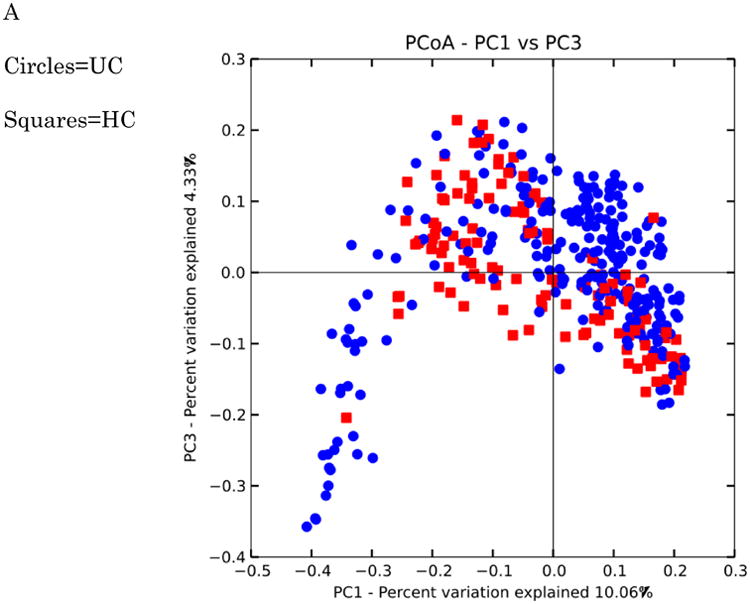
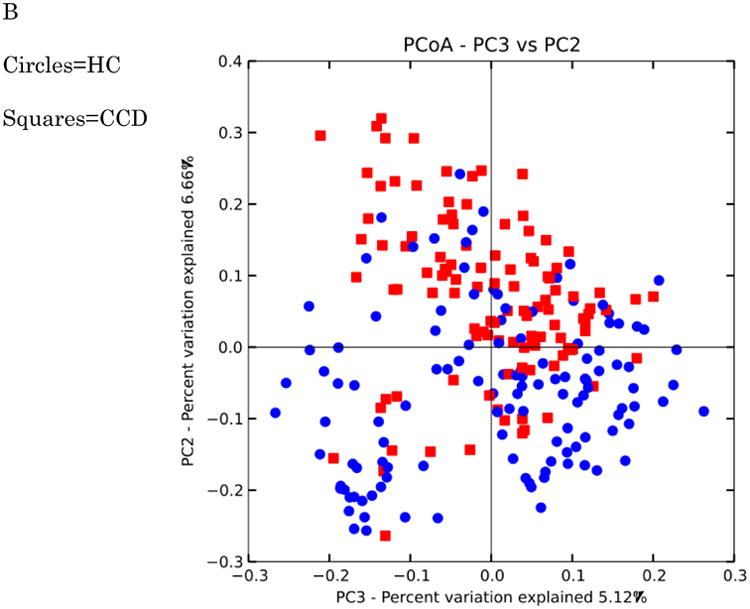
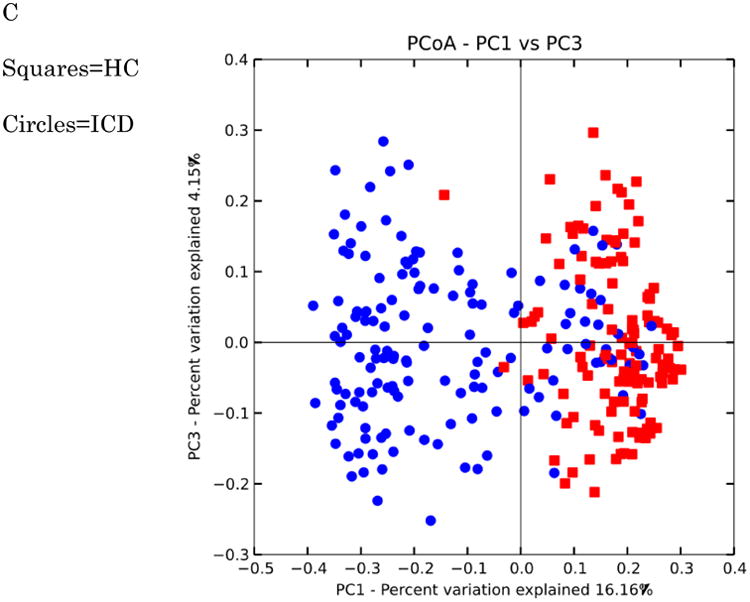
Distances were calculated with unweighted UniFrac. A-HC vs UC samples B. HC vs CCD samples C. HC vs ICD samples. Distances between healthy controls and all IBD categories are significantly different (p-value < 0.050 with PERMANOVA tests (999 permutations). Data were evenly sampled at 1004 sequences per sample.
Table 6. Taxa associated with IBD.
+ or − indicates that taxa were significantly enriched or depleted relative to healthy controls with a Kruskal-Wallis test and Bonferroni multiple comparisons correction. Only taxa that were present in at least 0.5% of one of the categories (HC, UC, CCD, or ICD) were included. Data were rarefied to 1004 sequences per sample. The ‘Matches Study” column includes a reference with consistent observations to the abundance results reported in this study.
| Taxonomy | UC | CCD | ICD | Matches Study |
|---|---|---|---|---|
| Actinobacteria | + | + | [34,37,40] | |
| Bifidobacterium [sp] | + | + | [40] | |
| Bifidobacterium adolescentis | + | + | ||
| Bacteroidetes | ||||
| Bacteroides eggerthii | - | |||
| Parabacteroides distasonis | - | |||
| Parabacteroides [sp] | - | - | ||
| Bacteroides uniformis | - | |||
| Bacteroides [sp] | + | + | ||
| Paraprevotella [sp] | + | |||
| Prevotella [sp] | - | - | - | [40] |
| Prevotella copri | - | - | ||
| Rikenellaceae | - | |||
| Barnesiellaceae [unknown genus] | - | |||
| Firmicutes | - | [37,39] | ||
| Faecalibacterium prausnitzii | - | + | - | [34,40] |
| Oscillospira [sp] | - | - | ||
| Clostridiales (unknown family) | - | [37,41] | ||
| Clostridium [sp] | - | - | - | |
| Roseburia [sp] | - | [39,40] | ||
| Lachnospiraceae (unknown genus) | - | [34] | ||
| Coprococcus [sp] | - | [37] | ||
| Ruminococcus gnavus | + | |||
| Ruminococcus [sp] | - | - | [37,39] | |
| Lachnospira [sp] | - | [34,37] | ||
| Blautia [sp] | + | |||
| Blautia producta | + | |||
| Dialister [sp] | + | |||
| Veillonella dispar | + | [40] | ||
| Phascolarctobacterium [sp] | - | - | [39] | |
| Lactobacillus [sp] | + | [37,40] | ||
| Fusobacteria | + | [41] | ||
| Fusobacterium [sp] | + | [41] | ||
| Gamma-Proteobacteria | + | [34,37,39,40,41] | ||
| Enterobacteriaceae | + | [37,39,40,41] | ||
| Verrucomicrobia | - | - | ||
| Akkermansia muciniphila | - |
Mycobacterium avium subspecies paratuberculosis has been implicated in IBD [43]. Two subjects in this analysis had detectable Mycobacterium sequences, but these were exceedingly rare (19 out of 496038 sequences in a subject with ileal Crohn's disease, and 1 out of 252119 sequences in a subject with ulcerative colitis). The PCR primers used are a perfect match for Mycobacterium avium, and hence should have amplified this taxon. If Mycobacterium species are present in these IBD patients, they are not detectable in the feces of the subjects. Case studies of fecal microbiota transplant treatment of recalcitrant IBD show a considerable success rate [46], indicating a causal role for gut microbiota in causing or exacerbating the symptoms of IBD. The microbes may be shifted to a state of dysbiosis by various factors (e.g. antibiotic usage or host immune system) in the IBD subjects. Depletion of certain commensal taxa (Akkermansia muciniphila, Faecalibacterium prausnitzii, Bacteroides uniforms) in IBD (the trend is different according to disease type) could be responsible for inappropriate immune responses in the host [47, 48, 49], and open up niches for occupation by invasive or pro-inflammatory species. Increased Proteobacteria and Fusobacteria (and a related decrease of less oxygen tolerant taxa, including many of the Firmicutes) could be due to increased available oxygen in the intestinal lumen of subjects with IBD. These increased oxygen-tolerant taxa have the potential to produce pro-inflammatory responses in the host through flagellin or lipopolysaccharides [50, 51]. Bifidobacterium may be increased in abundance due to oxygen tolerance relative to other taxa [52]. Previous proteomic data suggests that certain opportunistic Bacteroides sp. pathogens are increased in IBD subjects, at the expense of Prevotella species, which could explain the shifts within Bacteroidetes in our observations [53].
Alpha diversity between IBD categories was also consistent with prior observations (i.e. lower in subjects with IBD relative to healthy controls), and is shown in Figure 11.
Figure 11. Alpha diversity for IBD subjects and healthy controls.
Y-axis indicates observed species value. Healthy control samples are significantly different from all inflammatory bowel disease categories with a p-value of < 0.05 (Monte Carlo permutation test, permutations = 999). The samples were repeatedly sampled (10×) at 1000 sequences/sample.
Predicted disease states via fecal sequencing
The question of whether the combined IBD microbiota data can provide an accurate training dataset for predicting disease states was tested using supervised learning (with the same ROC based approach described above for BMI samples). All levels of taxonomy (phylum to species) were tested, with 10-fold cross validation for error rate prediction. The species level table performed best for almost all comparisons between healthy controls and individual disease states and all disease states combined, which are shown in Table 7, with one exception-the family level had a slightly higher AUC ROC value (only 0.00326 higher) for healthy controls versus ICD samples, but this is much smaller than the accuracy that would be lost for each of the other categories when using the family level versus the species level. When all four classes of samples are combined, the supervised learning accuracy drops (68.6%). The confusion matrix for the combined four class data is shown in Table S2.
Table 7. Predicting IBD state via supervised learning.
Values listed are average values of 5× repeated ROC analyses, using random forest method, with 10-fold cross validation. Healthy controls versus each individual category of disease are shown as well as healthy controls versus all IBD categories combined. A ROC AUC value of 0.5 is no better than random guess, whereas 1.0 indicates perfect specificity and sensitivity.
| Categories Compared | ROC AUC value | ROC AUC stdev |
|---|---|---|
| Healthy controls versus ulcerative colitis | 0.92258803 | 0.04239816 |
| Healthy controls versus colonic Crohn's disease | 0.87879176 | 0.07375804 |
| Healthy controls versus ileal Crohn's disease | 0.96996245 | 0.0378 |
| Healthy controls versus all IBD categories | 0.92404109 | 0.04297096 |
These tests indicate that the combined inflammatory bowel disease sequence sets are accurate at placing individuals into an IBD/healthy category. These tests could therefore serve as a complement to other, non-invasive diagnoses of symptoms (serological markers, bowel movement frequency, bloody diarrhea, rectal lesions, and a variety of non-gastrointestinal tract symptoms, which by themselves also suffer from a lack of sensitivity/specificity in diagnoses) and minimize risks (e.g. nosocomial infections) to patients. The AUC ROC approach requires a two class comparison, so applications of this would be most optimal for an initial diagnosis to determine if the subject likely has IBD or not, or to complement other diagnostics that suggest a particular IBD type.
Conclusions
Our meta-analyses show that studies of inflammatory bowel disease reveal clear, consistent differences between healthy and diseased individuals that replicate across studies and where the biological effects between clinical states exceed per-study effects. In contrast, the differences between obese and lean individuals, even though these differences can be transmitted to recipient gnotobiotic mice [32], are much less consistent. The ratio of Firmicutes:Bacteroidetes is not a consistent feature distinguishing lean from obese human microbiota generally (although it has frequently been observed in animal studies in a range of taxa from reptiles to rodents), and previous studies did not find this pattern consistently when comparing human obese and lean fecal 16S amplicon data. However, in these previous studies, assessment of taxon abundance was not performed consistently with respect the clustering and taxonomic assignment of sequences between studies. The approach to clustering and quality control (i.e., “closed reference”) used here is a conservative one, as it limits the potential for sequencing noise and chimeras to interfere with the results at the cost of perhaps discarding real, novel reads. However, as human-associated microbiota have been sequenced with considerable coverage, and the most up to date Greengenes reference database was used, the potential for large numbers of novel reads being discarded is minimal. As shown in the gnotobiotic mouse transplant systems, microbes can have an impact on obesity, so the limited significant differences observed in the taxa (Kruskal-Wallis tests) are surprising. It is possible that the differences between the lean and obese microbiota are present in the pan-genome of the microbes (not detectable by amplicon sequencing), that low-abundance taxa in the fecal samples are colonizing other locations in the colon (e.g. the proximal colon or the cecum) of the recipient animals and driving the differences observed in the hosts' physiology, and hence are not apparent in the fecal communities of the human subjects being studied, or that the differences may be multiple, small shifts in the community that escape detection with significance tests, but when combined can differentiate lean and obese communities with an approach like supervised learning.
To determine whether a consistent pattern was observable across multiple studies with IBD and normal versus obese individuals, all available datasets were reprocessed using the latest reference 16S rRNA gene database. For clinical utility, such as evaluating a particular form of Crohn's disease, a taxonomic signature needs to be consistent across populations. In the BMI data analysis, there was no significant signal in the Firmicutes:Bacteroidetes ratio or in overall diversity of the samples to differentiate obese and normal weight subjects. Indicator taxa were found within studies to be significant, although these were not found to be consistently significant across studies (a trait also frequently seen with host genetic markers in GWAS, and also potentially due to differences in clinical phenotypes for obesity in the different studies). The taxa found to be significantly different in each of the BMI analyses may be linked to increased inflammation in individuals with high BMI (decreased Faecalibacterium prausnitzii) or increased extraction of energy from dietary polysaccharides (Megasphaera sp). In contrast, many consistent, significant shifts were detected in IBD subjects, which may be related to a dysregulated immune system or altered environment (luminal oxygen content or antibiotics). Judicious use of supervised learning, optimized to maximize sensitivity and minimize noise, can be used to distinguish lean and obese individuals with some degree of accuracy. The inflammatory bowel disease studies showed clearer patterns: many taxa are significantly enriched or depleted in subjects with IBD, significantly reduced overall diversity is present in subjects with inflammatory bowel disease, and significant differences are detecting when clustering IBD samples and healthy controls. Using the combined IBD data as a training set, a reasonably accurate assignment of subjects between healthy and particular IBD state is possible, but would need to complement other diagnostics in a clinical setting.
Supplementary Material
Acknowledgments
This work was supported in part by the National Institutes of Health, the Crohns and Colitis Foundation of America, and the Howard Hughes Medical Institute. We would also like to thank Dan Knights for his insight and assistance with the supervised learning analyses.
Footnotes
Publisher's Disclaimer: This is a PDF file of an unedited manuscript that has been accepted for publication. As a service to our customers we are providing this early version of the manuscript. The manuscript will undergo copyediting, typesetting, and review of the resulting proof before it is published in its final citable form. Please note that during the production process errors may be discovered which could affect the content, and all legal disclaimers that apply to the journal pertain.
Bibliography
- 1.Lozupone CA, Stombaugh J, Gonzalez A, Ackermann G, Wendel D, Vazquez-Baeza Y, Jansson JK, Gordon JI, Knight R. Meta-analyses of studies of the human microbiota. Genome research. 2013;23:1704–14. doi: 10.1101/gr.151803.112. [DOI] [PMC free article] [PubMed] [Google Scholar]
- 2.Liu Z, DeSantis TZ, Andersen GL, Knight R. Accurate taxonomy assignments from 16S rRNA sequences produced by highly parallel pyrosequencers. Nucleic acids research. 2008;36:e120. doi: 10.1093/nar/gkn491. [DOI] [PMC free article] [PubMed] [Google Scholar]
- 3.DeSantis TZ, Hugenholtz P, Larsen N, Rojas M, Brodie EL, Keller K, Huber T, Dalevi D, Hu P, Andersen GL. Greengenes, a chimera-checked 16S rRNA gene database and workbench compatible with ARB. Applied and environmental microbiology. 2006;72:5069–72. doi: 10.1128/AEM.03006-05. [DOI] [PMC free article] [PubMed] [Google Scholar]
- 4.Edgar RC. Search and clustering orders of magnitude faster than BLAST. Bioinformatics. 2010;26:2460–1. doi: 10.1093/bioinformatics/btq461. [DOI] [PubMed] [Google Scholar]
- 5.Lozupone C, Knight R. UniFrac: a new phylogenetic method for comparing microbial communities. Applied and environmental microbiology. 2005;71:8228–35. doi: 10.1128/AEM.71.12.8228-8235.2005. [DOI] [PMC free article] [PubMed] [Google Scholar]
- 6.Kelly T, Yang W, Chen CS, Reynolds K, He J. Global burden of obesity in 2005 and projections to 2030. International journal of obesity. 2008;32:1431–7. doi: 10.1038/ijo.2008.102. [DOI] [PubMed] [Google Scholar]
- 7.Ley RE, Turnbaugh PJ, Klein S, Gordon JI. Microbial ecology: human gut microbes associated with obesity. Nature. 2006;444:1022–3. doi: 10.1038/4441022a. [DOI] [PubMed] [Google Scholar]
- 8.Turnbaugh PJ, Hamady M, Yatsunenko T, Cantarel BL, Duncan A, Ley RE, Sogin ML, Jones WJ, Roe BA, Affourtit JP, Egholm M, Henrissat B, Heath AC, Knight R, Gordon JI. A core gut microbiome in obese and lean twins. Nature. 2009;457:480–4. doi: 10.1038/nature07540. [DOI] [PMC free article] [PubMed] [Google Scholar]
- 9.Knights D, Parfrey LW, Zaneveld J, Lozupone C, Knight R. Human-associated microbial signatures: examining their predictive value. Cell host & microbe. 2011;10:292–6. doi: 10.1016/j.chom.2011.09.003. [DOI] [PMC free article] [PubMed] [Google Scholar]
- 10.Le Chatelier E, Nielsen T, Qin J, Prifti E, Hildebrand F, Falony G, Almeida M, Arumugam M, Batto JM, Kennedy S, Leonard P, Li J, Burgdorf K, Grarup N, Jorgensen T, Brandslund I, Nielsen HB, Juncker AS, Bertalan M, Levenez F, Pons N, Rasmussen S, Sunagawa S, Tap J, Tims S, Zoetendal EG, Brunak S, Clement K, Dore J, Kleerebezem M, Kristiansen K, Renault P, Sicheritz-Ponten T, de Vos WM, Zucker JD, Raes J, Hansen T, Meta, H. I. T. c. Bork P, Wang J, Ehrlich SD, Pedersen O. Richness of human gut microbiome correlates with metabolic markers. Nature. 2013;500:541–6. doi: 10.1038/nature12506. [DOI] [PubMed] [Google Scholar]
- 11.Turnbaugh PJ, Ley RE, Mahowald MA, Magrini V, Mardis ER, Gordon JI. An obesity-associated gut microbiome with increased capacity for energy harvest. Nature. 2006;444:1027–31. doi: 10.1038/nature05414. [DOI] [PubMed] [Google Scholar]
- 12.Vijay-Kumar M, Aitken JD, Carvalho FA, Cullender TC, Mwangi S, Srinivasan S, Sitaraman SV, Knight R, Ley RE, Gewirtz AT. Metabolic syndrome and altered gut microbiota in mice lacking Toll-like receptor 5. Science. 2010;328:228–31. doi: 10.1126/science.1179721. [DOI] [PMC free article] [PubMed] [Google Scholar]
- 13.Bervoets L, Van Hoorenbeeck K, Kortleven I, Van Noten C, Hens N, Vael C, Goossens H, Desager KN, Vankerckhoven V. Differences in gut microbiota composition between obese and lean children: a cross-sectional study. Gut pathogens. 2013;5:10. doi: 10.1186/1757-4749-5-10. [DOI] [PMC free article] [PubMed] [Google Scholar]
- 14.Colson P, Fancello L, Gimenez G, Armougom F, Desnues C, Fournous G, Yoosuf N, Million M, La Scola B, Raoult D. Evidence of the megavirome in humans. Journal of clinical virology : the official publication of the Pan American Society for Clinical Virology. 2013;57:191–200. doi: 10.1016/j.jcv.2013.03.018. [DOI] [PubMed] [Google Scholar]
- 15.Ferrer M, Ruiz A, Lanza F, Haange SB, Oberbach A, Till H, Bargiela R, Campoy C, Segura MT, Richter M, von Bergen M, Seifert J, Suarez A. Microbiota from the distal guts of lean and obese adolescents exhibit partial functional redundancy besides clear differences in community structure. Environmental microbiology. 2013;15:211–26. doi: 10.1111/j.1462-2920.2012.02845.x. [DOI] [PubMed] [Google Scholar]
- 16.Furet JP, Kong LC, Tap J, Poitou C, Basdevant A, Bouillot JL, Mariat D, Corthier G, Dore J, Henegar C, Rizkalla S, Clement K. Differential adaptation of human gut microbiota to bariatric surgery-induced weight loss: links with metabolic and low-grade inflammation markers. Diabetes. 2010;59:3049–57. doi: 10.2337/db10-0253. [DOI] [PMC free article] [PubMed] [Google Scholar]
- 17.Ley RE, Peterson DA, Gordon JI. Ecological and evolutionary forces shaping microbial diversity in the human intestine. Cell. 2006;124:837–48. doi: 10.1016/j.cell.2006.02.017. [DOI] [PubMed] [Google Scholar]
- 18.Verdam FJ, Fuentes S, de Jonge C, Zoetendal EG, Erbil R, Greve JW, Buurman WA, de Vos WM, Rensen SS. Human intestinal microbiota composition is associated with local and systemic inflammation in obesity. Obesity. 2013;21:E607–15. doi: 10.1002/oby.20466. [DOI] [PubMed] [Google Scholar]
- 19.Xu P, Li M, Zhang J, Zhang T. Correlation of intestinal microbiota with overweight and obesity in Kazakh school children. BMC microbiology. 2012;12:283. doi: 10.1186/1471-2180-12-283. [DOI] [PMC free article] [PubMed] [Google Scholar]
- 20.Duncan SH, Lobley GE, Holtrop G, Ince J, Johnstone AM, Louis P, Flint HJ. Human colonic microbiota associated with diet, obesity and weight loss. International journal of obesity. 2008;32:1720–4. doi: 10.1038/ijo.2008.155. [DOI] [PubMed] [Google Scholar]
- 21.Jumpertz R, Le DS, Turnbaugh PJ, Trinidad C, Bogardus C, Gordon JI, Krakoff J. Energy-balance studies reveal associations between gut microbes, caloric load, and nutrient absorption in humans. The American journal of clinical nutrition. 2011;94:58–65. doi: 10.3945/ajcn.110.010132. [DOI] [PMC free article] [PubMed] [Google Scholar]
- 22.Patil DP, Dhotre DP, Chavan SG, Sultan A, Jain DS, Lanjekar VB, Gangawani J, Shah PS, Todkar JS, Shah S, Ranade DR, Patole MS, Shouche YS. Molecular analysis of gut microbiota in obesity among Indian individuals. Journal of biosciences. 2012;37:647–57. doi: 10.1007/s12038-012-9244-0. [DOI] [PubMed] [Google Scholar]
- 23.Schwiertz A, Taras D, Schafer K, Beijer S, Bos NA, Donus C, Hardt PD. Microbiota and SCFA in lean and overweight healthy subjects. Obesity. 2010;18:190–5. doi: 10.1038/oby.2009.167. [DOI] [PubMed] [Google Scholar]
- 24.Tims S, Derom C, Jonkers DM, Vlietinck R, Saris WH, Kleerebezem M, de Vos WM, Zoetendal EG. Microbiota conservation and BMI signatures in adult monozygotic twins. The ISME journal. 2013;7:707–17. doi: 10.1038/ismej.2012.146. [DOI] [PMC free article] [PubMed] [Google Scholar]
- 25.Zupancic ML, Cantarel BL, Liu Z, Drabek EF, Ryan KA, Cirimotich S, Jones C, Knight R, Walters WA, Knights D, Mongodin EF, Horenstein RB, Mitchell BD, Steinle N, Snitker S, Shuldiner AR, Fraser CM. Analysis of the gut microbiota in the old order Amish and its relation to the metabolic syndrome. PloS one. 2012;7:e43052. doi: 10.1371/journal.pone.0043052. [DOI] [PMC free article] [PubMed] [Google Scholar]
- 26.Team, R. D. C. R: A language and environment for statistical computing. Vienna, Austria: 2008. [Google Scholar]
- 27.Fisher RA. Statistical Methods for Research Workers. Oliver and Boyd; Edinburgh: 1925. [Google Scholar]
- 28.Wu GD, Chen J, Hoffmann C, Bittinger K, Chen YY, Keilbaugh SA, Bewtra M, Knights D, Walters WA, Knight R, Sinha R, Gilroy E, Gupta K, Baldassano R, Nessel L, Li H, Bushman FD, Lewis JD. Linking long-term dietary patterns with gut microbial enterotypes. Science. 2011;334:105–8. doi: 10.1126/science.1208344. [DOI] [PMC free article] [PubMed] [Google Scholar]
- 29.Shannon CE. A MathematicalTheory of Communication. Bell Systems Technical Journal. 1948;27:379–473. [Google Scholar]
- 30.Holt JG. Bergey's Manual of Determinative Bacteriology. Lippincott Williams & Wilkins; London: 1994. [Google Scholar]
- 31.Breimann L. Random Forests. Machine Learning. 2001;45:5–32. [Google Scholar]
- 32.Ridaura VK, Faith JJ, Rey FE, Cheng J, Duncan AE, Kau AL, Griffin NW, Lombard V, Henrissat B, Bain JR, Muehlbauer MJ, Ilkayeva O, Semenkovich CF, Funai K, Hayashi DK, Lyle BJ, Martini MC, Ursell LK, Clemente JC, Van Treuren W, Walters WA, Knight R, Newgard CB, Heath AC, Gordon JI. Gut microbiota from twins discordant for obesity modulate metabolism in mice. Science. 2013;341:1241214. doi: 10.1126/science.1241214. [DOI] [PMC free article] [PubMed] [Google Scholar]
- 33.Baumgart DC, Carding SR. Inflammatory bowel disease: cause and immunobiology. Lancet. 2007;369:1627–40. doi: 10.1016/S0140-6736(07)60750-8. [DOI] [PubMed] [Google Scholar]
- 34.Mazmanian SK, Sartor RB. Intestinal Microbes in Inflammatory Bowel Diseases. The American Journal of Gastroenterology Supplements. 2012;1:15–21. [Google Scholar]
- 35.Eckburg PB, Bik EM, Bernstein CN, Purdom E, Dethlefsen L, Sargent M, Gill SR, Nelson KE, Relman DA. Diversity of the human intestinal microbial flora. Science. 2005;308:1635–8. doi: 10.1126/science.1110591. [DOI] [PMC free article] [PubMed] [Google Scholar]
- 36.Frank DN, St Amand AL, Feldman RA, Boedeker EC, Harpaz N, Pace NR. Molecular-phylogenetic characterization of microbial community imbalances in human inflammatory bowel diseases. Proceedings of the National Academy of Sciences of the United States of America. 2007;104:13780–5. doi: 10.1073/pnas.0706625104. [DOI] [PMC free article] [PubMed] [Google Scholar]
- 37.Papa E, Docktor M, Smillie C, Weber S, Preheim SP, Gevers D, Giannoukos G, Ciulla D, Tabbaa D, Ingram J, Schauer DB, Ward DV, Korzenik JR, Xavier RJ, Bousvaros A, Alm EJ. Non-invasive mapping of the gastrointestinal microbiota identifies children with inflammatory bowel disease. PloS one. 2012;7:e39242. doi: 10.1371/journal.pone.0039242. [DOI] [PMC free article] [PubMed] [Google Scholar]
- 38.Momozawa Y, Deffontaine V, Louis E, Medrano JF. Characterization of bacteria in biopsies of colon and stools by high throughput sequencing of the V2 region of bacterial 16S rRNA gene in human. PloS one. 2011;6:e16952. doi: 10.1371/journal.pone.0016952. [DOI] [PMC free article] [PubMed] [Google Scholar]
- 39.Morgan XC, Tickle TL, Sokol H, Gevers D, Devaney KL, Ward DV, Reyes JA, Shah SA, LeLeiko N, Snapper SB, Bousvaros A, Korzenik J, Sands BE, Xavier RJ, Huttenhower C. Dysfunction of the intestinal microbiome in inflammatory bowel disease and treatment. Genome biology. 2012;13:R79. doi: 10.1186/gb-2012-13-9-r79. [DOI] [PMC free article] [PubMed] [Google Scholar]
- 40.Willing BP, Dicksved J, Halfvarson J, Andersson AF, Lucio M, Zheng Z, Jarnerot G, Tysk C, Jansson JK, Engstrand L. A pyrosequencing study in twins shows that gastrointestinal microbial profiles vary with inflammatory bowel disease phenotypes. Gastroenterology. 2010;139:1844–1854 e1. doi: 10.1053/j.gastro.2010.08.049. [DOI] [PubMed] [Google Scholar]
- 41.Gevers D, Kugathasan S, Denson LA, Vazquez-Baeza Y, Van Treuren W, Ren B, Schwager E, Knights D, Song SJ, Yassour M, Morgan XC, Kostic AD, Luo C, Gonzalez A, McDonald D, Haberman Y, Walters T, Baker S, Rosh J, Stephens M, Heyman M, Markowitz J, Baldassano R, Griffiths A, Sylvester F, Mack D, Kim S, Crandall W, Hyams J, Huttenhower C, Knight R, Xavier RJ. The treatment-naive microbiome in new-onset Crohn's disease. Cell host & microbe. 2014;15:382–92. doi: 10.1016/j.chom.2014.02.005. [DOI] [PMC free article] [PubMed] [Google Scholar]
- 42.Sheil B, Shanahan F, O'Mahony L. Probiotic effects on inflammatory bowel disease. The Journal of nutrition. 2007;137:819S–24S. doi: 10.1093/jn/137.3.819S. [DOI] [PubMed] [Google Scholar]
- 43.Pierce ES. Ulcerative colitis and Crohn's disease: is Mycobacterium avium subspecies paratuberculosis the common villain? Gut pathogens. 2010;2:21. doi: 10.1186/1757-4749-2-21. [DOI] [PMC free article] [PubMed] [Google Scholar]
- 44.Human Microbiome Project C. Structure, function and diversity of the healthy human microbiome. Nature. 2012;486:207–14. doi: 10.1038/nature11234. [DOI] [PMC free article] [PubMed] [Google Scholar]
- 45.Yatsunenko T, Rey FE, Manary MJ, Trehan I, Dominguez-Bello MG, Contreras M, Magris M, Hidalgo G, Baldassano RN, Anokhin AP, Heath AC, Warner B, Reeder J, Kuczynski J, Caporaso JG, Lozupone CA, Lauber C, Clemente JC, Knights D, Knight R, Gordon JI. Human gut microbiome viewed across age and geography. Nature. 2012;486:222–7. doi: 10.1038/nature11053. [DOI] [PMC free article] [PubMed] [Google Scholar]
- 46.Brandt LJ, Aroniadis OC. An overview of fecal microbiota transplantation: techniques, indications, and outcomes. Gastrointestinal Endoscopy. 2013;78:240–249. doi: 10.1016/j.gie.2013.03.1329. [DOI] [PubMed] [Google Scholar]
- 47.Collado MC, Derrien M, Isolauri E, Vos WM de, Salminen S. Intestinal Integrity and Akkermansia muciniphila, a Mucin-Degrading Member of the Intestinal Microbiota Present in Infants, Adults, and the Elderly. Appl Environ Microbiol. 2007;73:7767–7770. doi: 10.1128/AEM.01477-07. [DOI] [PMC free article] [PubMed] [Google Scholar]
- 48.Miquel S, Martín R, Rossi O, Bermúdez-Humarán LG, Chatel JM, Sokol H, Thomas M, Wells JM, Langella P. Faecalibacterium prausnitzii and human intestinal health. Curr Opin Microbiol. 2013;16:255–261. doi: 10.1016/j.mib.2013.06.003. [DOI] [PubMed] [Google Scholar]
- 49.Gauffin Cano P, Santacruz A, Moya Á, Sanz Y. Bacteroides uniformis CECT 7771 Ameliorates Metabolic and Immunological Dysfunction in Mice with High-Fat-Diet Induced Obesity. PLoS ONE. 2012;7:e41079. doi: 10.1371/journal.pone.0041079. [DOI] [PMC free article] [PubMed] [Google Scholar]
- 50.Strauss J, Kaplan GG, Beck PL, Rioux K, Panaccione R, Devinney R, Lynch T, Allen-Vercoe E. Invasive potential of gut mucosa-derived Fusobacterium nucleatum positively correlates with IBD status of the host. Inflamm Bowel Dis. 2011;17:1971–1978. doi: 10.1002/ibd.21606. [DOI] [PubMed] [Google Scholar]
- 51.Vijay-Kumar M, Gewirtz AT. Flagellin: key target of mucosal innate immunity. Mucosal Immunol. 2009;2:197–205. doi: 10.1038/mi.2009.9. [DOI] [PubMed] [Google Scholar]
- 52.Shimamura S, Abe F, Ishibashi N, Miyakawa H, Yaeshima T, Araya T, Tomita M. Relationship Between Oxygen Sensitivity and Oxygen Metabolism of Bifidobacterium Species. Journal of Dairy Science. 1992;75:3296–3306. doi: 10.3168/jds.S0022-0302(92)78105-3. [DOI] [PubMed] [Google Scholar]
- 53.Juste C, Kreil DP, Beauvallet C, Guillot A, Vaca S, Carapito C, Mondot S, Sykacek P, Sokol H, Blon F, Lepercq P, Levenez F, Valot B, Carré W, Loux V, Pons N, David O, Schaeffer B, Lepage P, Martin P, Monnet V, Seksik P, Beaugerie L, Ehrlich SD, Gibrat JF, Van Dorsselaer A, Doré J. Bacterial protein signals are associated with Crohn's disease. Gut. 2014 doi: 10.1136/gutjnl-2012-303786. [DOI] [PMC free article] [PubMed] [Google Scholar]
Associated Data
This section collects any data citations, data availability statements, or supplementary materials included in this article.


