

Higher temperatures will make megadroughts more likely in the American Southwest, but cutting emissions reduces risk.
Keywords: Megadrought, climate change, mitigation, hydroclimate, climate risk
Abstract
Megadroughts are comparable in severity to the worst droughts of the 20th century but are of much longer duration. A megadrought in the American Southwest would impose unprecedented stress on the limited water resources of the area, making it critical to evaluate future risks not only under different climate change mitigation scenarios but also for different aspects of regional hydroclimate. We find that changes in the mean hydroclimate state, rather than its variability, determine megadrought risk in the American Southwest. Estimates of megadrought probabilities based on precipitation alone tend to underestimate risk. Furthermore, business-as-usual emissions of greenhouse gases will drive regional warming and drying, regardless of large precipitation uncertainties. We find that regional temperature increases alone push megadrought risk above 70, 90, or 99% by the end of the century, even if precipitation increases moderately, does not change, or decreases, respectively. Although each possibility is supported by some climate model simulations, the latter is the most common outcome for the American Southwest in Coupled Model Intercomparison 5 generation models. An aggressive reduction in global greenhouse gas emissions cuts megadrought risks nearly in half.
INTRODUCTION
Megadroughts are periods of aridity as severe as the worst multiyear droughts of the 20th century and persist for decades. These droughts are known to have occurred in the American Southwest (1, 2) and other parts of the world (3, 4) during the past millennium, and they have been linked to the demise of several preindustrial civilizations (3, 5, 6). A megadrought occurring again in the Southwest in the coming decades would impose unprecedented stresses on water resources of the region, and recent studies have shown that they are far more likely to occur this century because of climate change compared to past centuries (7, 8).
Estimating the probability of a megadrought under different climate change scenarios is critical for effectively evaluating risk and managing water resources, but recent studies have disagreed on the relative odds of these events. For example, on the basis of precipitation projections and paleoclimate data, Ault et al. (8) argued that the risk of multidecadal megadrought in the American Southwest would increase at least twofold from 5 to 15% over the last millennium to between 20 and 50% this century; Cook et al. (7) estimated those risks to be much higher in an analysis of a wider range of soil moisture indicators of varying levels of complexity. Further complicating this picture is that certain regions (for example, much of the American West) are expected to become drier, on average, even with a predicted increase in precipitation because of the increased demand for moisture by the atmosphere and consequent increases in evapotranspiration (9, 10). It is therefore critical to clarify the relative contributions of precipitation and temperature to future megadrought risk.
Here, we focus on characterizing megadrought risk as a function of variables that govern the balance of moisture at the land surface during climate change. At decadal and longer time scales, these variables are primarily precipitation, which supplies moisture, and temperature and vegetation, which modulate evapotranspiration (9, 11). Although climate change projections of higher temperatures are robust and broadly consistent across different model simulations, projections of precipitation change are subject to considerably more uncertainty. Moreover, megadroughts are extreme events that unfold over decades, implying that even state-of-the-art multimodel ensembles used for the Intergovernmental Panel on Climate Change (IPCC) will have only a handful of realizations of these intervals at best. This small sample size inherently makes estimating the probability of a megadrought challenging because any empirical probability density function (PDF) of its occurrence will be finite and incomplete. For example, imagine two simulations run with a model that predicts overall drying: In the first realization, there is a megadrought, and in the second, there is none. The model-predicted probability would appear to be 50% regardless of the true megadrought PDF. As an alternative, we characterize the megadrought PDF by asking the following: (i) What are the changes in regional hydroclimate that elevate (or lower) megadrought risk? (ii) How do state-of-the-art general circulation models (GCMs) simulate the variables that govern megadrought risk?
We adopt a probabilistic framework for quantifying the risk of future events under a broad range of possible climate outcomes and then compare GCMs against these possibilities. Although there are a number of objective methods for identifying periods of megadrought in a hydroclimate time series (12–16), here we define a megadrought as a multidecadal (35-year) period of aridity as bad as, if not worse than, the worst droughts of the 20th century (−0.5 of an SD on average; Materials and Methods). By megadrought “risk,” we refer to the probability of an event occurring this century, acknowledging that the statistics of regional hydroclimate in the future will likely be different from past statistics. This notion of risk accommodates the possibility that an event might not unfold even if megadroughts are generally more likely to occur (for example, a few fortuitous wet years in a drier climate with higher megadrought risk could prevent an event from fully unfolding).
Quantifying megadrought risk over a wide range of plausible climate change outcomes allows us to assess how deterministic GCMs, forced with rising greenhouse gas (GHG) concentrations, simulate changes in temperature and precipitation associated with different levels of risk (see Materials and Methods). We apply this framework to characterize the chances of a megadrought defined by precipitation and multiple soil moisture metrics in output from the Coupled Model Intercomparison Project Phase 5 (CMIP5) multimodel ensemble (17), as well as a single-model [Community Earth System Model (CESM)] “large” ensemble (18). Although structural uncertainty and internal variability are conflated in the CMIP5 ensemble, diagnosis of a single-model ensemble allows us to delineate the role of internal variability alone in shaping future megadrought risk.
RESULTS
We express megadrought risk as a two-dimensional (2D) PDF of both changes in mean hydroclimate state (denoted Δμ, Materials and Methods) and changes in hydroclimate variability (δσ) relative to the historical period (1951–2000). This framework reveals that risks are dominated by changes in the mean state of a given hydroclimate variable (Δμ), although there are some exceptions, as seen in the shading of Fig. 1 and fig. S1. For example, decreases in the mean (Δμ < 0) can be compensated by decreases in variance (δσ > 1), maintaining low megadrought risk in the light-colored triangle-shaped region of negative Δμ (between the dark shading and the dashed line on all panels of Fig. 1). Likewise, increases in hydroclimate mean values (Δμ > 0) do not necessarily correspond to lower megadrought risk if those changes are accompanied by increases in variance (dark gray shading to the right of the dashed line on all panels in Fig. 1). Herein, we will adopt the language of the IPCC to characterize probabilities (19): The black region of the 2D PDF in Fig. 1 identifies areas where megadroughts are “virtually certain” (>99% probability of occurrence), whereas the white region shows combinations of mean state and variability changes that would make these events “exceptionally unlikely” (<1% probability). Note that the regions shaded in black depict probabilities in excess of 99.9% and hence would correspond to a climate that is drier, on average, than the worst droughts of the past 1000 years (7). For reference, megadroughts in the preindustrial era only occurred once or twice per millennium on average (2, 8, 20); thus, without climate change, these events would be “very unlikely” (0 to 10% probability) (8).
Fig. 1. Megadrought risk estimates for the American Southwest shown with model-projected changes in mean hydroclimate.

(A to C) Megadrought risk estimates for the American Southwest (shading) shown with model-projected changes in mean hydroclimate under the RCP 8.5 (high emissions) scenario for (A) annual precipitation and JJA soil moisture (PDSI, 30-cm soil moisture, and 2-m soil moisture) in the CESM LENS, (B) annual precipitation from all CMIP5 models, and (C) JJA soil moisture indicators derived from a 17-model subset of CMIP5 for which all variables needed to compute these quantities were available (7). In all panels, the interquartile range of the ensemble is shown (the full range is shown in the Supplementary Materials). Model-based variables are normalized to unit variance over a historical reference period (1951–2000) and compared with midcentury changes (2051–2080). The shading shows the 2D PDF of megadrought risk for combinations of changes in the mean (Δμ) and variability (δσ) of a normalized drought indicator time series [z′(t)].
Although some studies have relied on precipitation alone to identify prolonged drought or megadrought conditions (13, 21, 22), our results show that this approach tends to underestimate risk in a changing climate (Fig. 1). On each panel, changes in normalized drought indicators [annually averaged precipitation, June-July-August (JJA) soil moisture at 2 m and 30 cm, and JJA Palmer Drought Severity Index (PDSI)] are overlaid on the 2D PDF of megadrought risk, expressed again as a function of δσ and Δμ. We focus on JJA for soil moisture and PDSI because it is the driest, hottest part of the year in much of the Southwest and also for compatibility with paleoclimate reconstructions of JJA aridity (7, 12). By midcentury (2051–2080), under a business-as-usual emissions scenario, the “large ensemble” (LENS) from one model (CESM) simulates increases in annual precipitation, which decreases megadrought risk according to estimates solely based on this variable (Fig. 1A, blue circles). The CMIP5 multimodel ensemble shows a similar pattern, although (on average) regional annual precipitation decreases, slightly increasing megadrought risk (Fig. 1B). Nonetheless, models within the CMIP5 archive also support decreases in average normalized annual precipitation of nearly one full SD and increases of more than 1 SD (Fig. 1B and fig. S1). These projected changes encompass megadrought probabilities that range from virtually certain (>99.9%) to exceptionally unlikely (<0.1%) if precipitation alone is used to assess its risk.
In contrast to precipitation, indicators of JJA soil moisture depict a more consistent picture of drying (Δμ < 0) and correspondingly higher megadrought risks (orange symbols in Fig. 1, A and C). Most simulations in both the CESM and CMIP5 ensembles plot into a region of the megadrought risk PDF where events are virtually certain (>99.9% probability) by midcentury (Fig. 1C and figs. S1 and S2). Note that Cook et al. (7) estimated regional risks to be closer to 80% because that study derived risks from the CMIP5 ensemble itself (which includes models that simulate both low and high risks), whereas here we are plotting where each ensemble member falls in the 2D megadrought PDF. The contrasting estimates of risk between precipitation and soil moisture hint at the role that temperature might play in elevating megadrought probabilities by altering the mean regional moisture balance during climate change. They further imply that this tendency is generally independent of the particular soil moisture metric targeted for analysis, as also shown in earlier studies (7, 23).
Not all variables from all models plot into the portion of the 2D PDF shown here (fig. S2). For example, one model (CanESM2) simulates average 2-m soil moisture conditions (Δμ) that are approximately 3σ wetter by midcentury than over the historical period (1951–2000). We therefore cannot completely rule out the possibility that moisture will increase in deeper soil layers despite warming temperatures (22), but this possibility is inconsistent with near-surface conditions in most of the models, some of which support mean conditions far worse than the worst years of drought during the historical period. Moreover, variables from four models (MIROC-ESM-CHEM 2-m soil moisture, MIROC-ESM 2-m soil moisture, NorESM1-M 30-cm soil moisture, and GFDL-CM3 2-m soil moisture) fall to levels below −3σ (much drier), three of which are associated with the deep soil layer. Nonetheless, these uncertainties motivate a closer look at the relative contributions of mean temperature and precipitation change to regional megadrought risk.
Because changes in the mean state largely determine megadrought risk (Fig. 1), the second 2D PDF that we consider (Fig. 2) is generated using the JJA PDSI calculated from resampled and rescaled observational and reanalysis data over a wide range of plausible changes in mean precipitation and temperature (Materials and Methods). These values are “plausible” in the sense that they are supported by the range of estimates derived from the CMIP5 ensemble (Materials and Methods). This PDF shows a strong risk dependence on both variables, with decreasing precipitation and/or increasing temperature linked to a higher probability of megadrought (Fig. 2). At a constant temperature relative to the 1951–2000 baseline (ΔT = 0), reductions in precipitation are associated with increases in risk. Likewise, increases in temperature elevate risk if precipitation is held constant (for example, ΔP = 0%). This effect is stronger for higher regional temperature change, such that even without any reduction in precipitation, the probability of megadrought is close to 100% if Southwest temperatures rise by 5°C or more, a possibility encompassed by the CMIP5 multimodel distribution under business-as-usual forcing (Fig. 2C). Moreover, the general characteristics of this 2D PDF, including its strong dependence on temperature, are robust even if temperature and precipitation only change during certain seasonal windows (fig. S3).
Fig. 2. Megadrought risk expressed as a function of both mean precipitation and temperature for the American Southwest compared with projected changes in temperature and precipitation.
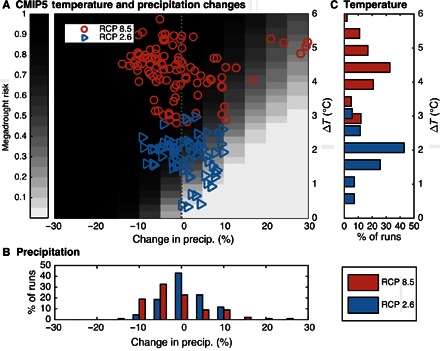
(A) Megadrought risk expressed as a function of both mean precipitation and temperature for the American Southwest (shading) compared with projected changes in temperature and precipitation (symbols) for two scenarios: RCP 2.6 (low emissions, blue triangles) and RCP 8.5 (high emissions, red circles). CMIP5 estimates of change are expressed as the difference between the historical reference period (1951–2000) and the midcentury average (2051–2080). The megadrought risk surface (shading) is the average of all 2D PDFs calculated at each grid point in the Southwest for each combination of temperature and precipitation change. JJA PDSI is used as the reference normalized drought indicator time series [z′(t)]. The vertical dashed line marks no change in precipitation. (B) Marginal distribution of precipitation change in CMIP5 models, binned at 5% intervals from −30 to +30% of historical climatology. (C) Marginal distribution of temperature changes, binned at 0.5°C intervals from zero to six.
Model-based projections of mean Southwest temperature and precipitation change are plotted as symbols in Fig. 2A (model IDs are provided in fig. S1). Because megadrought risk largely depends on these mean changes, we evaluate the effect of climate mitigation on megadrought risk. We consider the two experiments that bracket a large number of possible mitigation outcomes from the “low-emission” Representative Concentration Pathway 2.6 (RCP 2.6) (blue triangles) to the “high-emission” RCP 8.5 (orange circles) scenarios. Marginal distributions of mean precipitation and temperature change from the CMIP5 archive are also shown in Fig. 2 (B and C, respectively). There is clearly more ambiguity about the direction and magnitude of precipitation change in the Southwest as compared to temperature: The distribution of RCP 2.6 precipitation is nearly unchanged from the historical period (median precipitation change of +0.7%), whereas the RCP 8.5 scenario is only moderately drier (median of −3%), albeit with greater spread (Fig. 2, A and B).
In contrast to precipitation, the temperature distributions are universally of the same sign (positive), but the RCP 2.6 and RCP 8.5 scenarios are distinct from one another (Fig. 2C). It is clear that the combined projections of ΔT and ΔP from the two scenarios do not overlap appreciably because RCP 8.5 projects a higher regional temperature change than RCP 2.6. These warmer temperatures shift the entire RCP 8.5 distribution into a region of the 2D PDF where megadrought risks are much higher. Even in the case where one model (CanESM2; fig. S2) predicts a 30% increase in precipitation, this amount is insufficient to overcome the effects of higher temperature—the projection still plots into a region of elevated megadrought risk (30 to 40%) despite the precipitation increase. On the other hand, some RCP 2.6 simulations project a net increase of precipitation (blue triangles to the lower right of the gray shading in Fig. 2A), and these simulations map onto a region of megadrought risk that is either similar to (5 to 10%) or lower than (<1%) the preindustrial period (8). This reduction in risk occurs largely because increases in precipitation are accompanied by only modest temperature shifts that stay below 2°C.
In Figs. 3 and 4, we further highlight the role that temperature plays in “loading the dice” to make megadroughts more probable through its effect on the moisture balance of the region. In Fig. 3, megadrought risks estimated for fixed values of mean precipitation change are shown with the median temperature increases simulated by RCP 2.6 (1.9°C) and RCP 8.5 (4.5°C) over the period 2051–2100 compared to 1951–2000. Here, we focus on the second half of the 21st century to emphasize the outcomes of mitigation on mean regional temperature. Two features of Fig. 3 are important to note. First, unless mean precipitation increases, megadroughts are likely (>66% probability) to occur for a regional temperature change above 2°C (dashed line). Second, median regional warming simulated for RCP 8.5 (4.5°C; dotted line) would make megadroughts very likely (>90% probability) by the end of the century if average precipitation does not increase. This risk remains above 50% unless precipitation increases by 10 to 20%, which is not typical of models in the CMIP5 archive. These estimates of risk would be even higher, and the required increases in precipitation would be even greater, if regional warming exceeds 4.5°C, which itself is a possibility supported by many of the individual model simulations (Fig. 2C).
Fig. 3. Megadrought risk estimates for fixed mean precipitation changes, shown as a function of mean annual temperature and compared with CMIP5 projections of mean warming from 2051 to 2100 compared to 1951 to 2000.

Contours show risks for constant levels of mean precipitation change (ΔP), derived from the 2D PDF in Fig. 2. The dashed lines denote the median warming (again comparing 2051–2100 to 1951–2000) from RCP 2.6 (1.9°C) and RCP 8.5 (4.5°C) and their corresponding risks assuming no change in precipitation (ΔP = 0%).
Fig. 4. Maps of megadrought risk for the American Southwest under different levels of warming, and the required increase in precipitation to compensate for that warming.

(A to C) Maps of megadrought risk for the entire American Southwest domain at constant (historical) precipitation climatology (ΔP = 0%) and various levels of warming. These estimates are based on the Monte Carlo procedure of observational and reanalysis data, not on CMIP5 (see Materials and Methods). (D to F) Increases in precipitation (blue shading) needed to maintain megadrought risks below 50% for different levels of regional warming. Contours map the projected changes in precipitation derived from the multimodel CMIP5 mean and are shown for reference at each level of temperature change.
Whereas the estimates above are based on the average 2D PDFs of megadrought risk for the entire American Southwest, our approach allows us to make similar estimates for each grid point in the domain (Fig. 4, A to C). These estimates are not based on CMIP5 output but instead are derived from probabilistic modeling of megadrought risk as a function of rescaled historical temperature and precipitation climatologies. Our results clarify the effects of these two variables on PDSI throughout the region. For temperature change below 1° and no change in precipitation, most of the domain is exposed to levels of risk below 20% (yellow regions in Fig. 4, A to C). As temperatures reach 2°C and above, increasing fractions of the domain see megadrought risks above 90%, with nearly the entire domain doing so at 6°C of warming.
For each warming threshold in Fig. 4 (A to C), we have also calculated the amount by which precipitation would need to increase to keep megadrought risks below 50% (Fig. 4, D to F, blue shading). For levels of warming below 2°C, most of the region would only need modest (<10%) increases in precipitation to keep megadrought risk levels under this threshold. As warming reaches 4°C, increases of 10 to 30% are needed throughout Nevada and the four-corner region, and at 6°C, these required increases reach 40 to 50%. For reference, the changes in precipitation projected by the RCP 8.5 CMIP5 multimodel ensemble mean at each level of warming (for example, 2°, 4°, and 6°C) are shown in contours on Fig. 4 (D to F). These projected precipitation changes are negative (dashed contours) for much of the domain, with the CMIP5 ensemble average predicting a 5 to 15% reduction in precipitation in the southernmost areas considered here for levels of warming between 2° and 6°C. Furthermore, projected precipitation change is close to zero, on average, in regions where a 40 to 50% increase is needed to keep risks below 50% by the end of the century when warming levels approach 6°C.
DISCUSSION
Our findings have important implications for both mitigation and adaptation. With regard to mitigation, the dependence of megadrought risk on mean temperature highlights a relative advantage of keeping GHG emissions low. In a business-as-usual world (RCP 8.5), rising temperatures alone are sufficient to drive megadrought risks to unprecedented levels. On the other hand, if regional warming remains below 2°C, megadrought risks will correspondingly remain below 66% for a wide range of precipitation changes [for example, below the IPCC-defined threshold for likely (19)]. Further emission reductions, and hence smaller temperature increases, would have even greater benefits in reducing megadrought risks, thus highlighting the fact that global efforts aimed at mitigating climate change through GHG emission reductions will also help minimize prolonged drought probabilities (24).
Our results also provide insight into how much additional moisture supply is needed in the Southwest on average to keep megadrought levels below certain thresholds. In our case, we again focus on the 50% threshold, though, in principle, this could be lowered. We find that even for this fairly high tolerance of risk, most of the region would need to see at least a 40 to 50% increase in precipitation (Fig. 4, D to F, shading), which, according to the CMIP5 projections, is unlikely for the area (Fig. 4, D to F, contours) (8, 25). A constellation of adaptation policies, such as demand reduction and increased efficiency strategies, interbasin water transfers, shifts to groundwater reliance, increased surface irrigation, and other management measures, could serve to offset some of this increased moisture requirement. However, the feasibility, sustainability, and implementation of these measures and the extent to which they could reduce megadrought risk remain critical open questions.
Both structural differences between GCMs and natural variability introduce uncertainty into projected changes in precipitation (Fig. 1). These uncertainties in precipitation play out in terms of both the mean state and the variability of the Southwest, although most models simulate drying in general (Fig. 1B) (8, 25, 26). Our analysis of a LENS of one model (CESM) suggests that the role of natural variability in generating precipitation uncertainty is relatively small compared to structural differences between models, which simulate regional responses to warming between −1 and more than 1 full SD. Notwithstanding these uncertainties, higher temperatures shift the moisture balance toward conditions that are drier on average, as evidenced by multiple soil moisture metrics (Fig. 1C) (7). This shift consequently makes megadrought conditions much more likely than they are today, even if precipitation increases. Consideration of soil moisture therefore reduces the uncertainty in megadrought risk estimates stemming from natural variability and model differences because it integrates the effects of moisture supply, storage, and atmospheric demand under higher temperatures.
Several features of our approach make it easily extensible to other drought indicators, other parts of the world, and other global climate model data sets. For example, land surface model (LSM) components of GCMs could be forced with similar ranges of temperature and precipitation change to generate LSM-based 2D PDFs of risk, as we have done for PDSI. This would facilitate sensitivity tests of LSM components under a wide range of future possible climates, akin to “stress tests” in engineering (27), and could even be extended to include the relative impacts of CO2 “fertilization” on megadrought risk (11). Additionally, the 2D PDFs developed here are particularly useful in the context of IPCC climate model assessments because a new generation of simulations is released for analysis every few years. Although the details of regional hydroclimate in these simulations might change, the PDFs we generate as a function of mean state and variability (Fig. 1), or temperature and precipitation (Fig. 2), will not change, because they are generated from the observed climatology. Further work could also extend risk estimates to other aspects of hydroclimate beyond soil moisture (for example, reservoir levels, snowpack, and streamflow) and other parts of the world.
Finally, the dependence of megadrought risk on temperature makes the probability of these events in the future very distinct from such intervals in the past. Historically, megadroughts were extremely rare phenomena occurring only once or twice per millennium, possibly from internal variability (28) or weak external forcing (29). According to our analysis of modeled responses to increased GHGs, these events could become commonplace if climate change goes unabated. This appears to arise not because of any particular change in the dynamic circulation of the atmosphere but because the projected increase in atmospheric demand for moisture from the land surface will shift the baseline of soil moisture balance, making megadroughts far more likely than they have been for at least the last millennium (7).
MATERIALS AND METHODS
Drought indicators, including precipitation, surface (30-cm) soil moisture, full column–integrated soil moisture (2 m), and the PDSI, were obtained or calculated from the following sources:
(1) Output from a recent LENS experiment (18) conducted using a single model (CESM) to address the relative importance of internal climate variability as opposed to its combination with structural differences between models. Annual precipitation, JJA 30-cm soil moisture, JJA 2-m soil moisture, and JJA PDSI were either obtained or computed from the “historical” (1920–2005) and RCP 8.5 (2005–2080) experiments in the LENS data set.
(2) GCM data from two RCPs included in the CMIP5 archive: RCP 2.6, which assumes aggressive cuts in emissions for the coming decades, generally preventing global mean temperatures from exceeding 2°C of total warming (17, 30); and RCP 8.5, which assumes that anthropogenic emissions of GHGs will continue to increase and contribute 8.5 W/m2 of average net radiative forcing by the year 2100. As in the study by Cook et al. (7), we computed PDSI from a 17-model subset of the CMIP5 archive for which all fields were available to calculate the Penman-Monteith estimates of evapotranspiration, and for which soil moisture fields were also available. Annual precipitation averages were used as the normalized drought indicators in Fig. 1, whereas JJA averages of soil moisture (30 cm and 2 m) and PDSI were used from the 17-model subset for consistency with earlier studies (7, 12) and to focus on the hottest, driest part of the year in the Southwest. In contrast to the earlier study (7), we also included the remaining GCMs in our analysis of risk arising from changes in precipitation and temperature (Fig. 2), although PDSI and soil moisture were not always available from these products. In this case, annual temperature and precipitation were used.
(3) Observational temperature and precipitation fields, used in the Monte Carlo procedure described below, originated from the University of East Anglia’s Climate Research Unit’s “TS2.1” data product (31). These fields are produced at 0.5° native resolution but were linearly interpolated to 1° for the megadrought risk estimates computed here. Net radiation, relative humidity, and surface pressure fields used for calculating PDSI with the Penman-Monteith method for estimating evapotranspiration are from the National Centers for Environmental Prediction reanalysis data (32). Climatological values of these fields were all averaged for the Southwest domain (125°W to 105°W; 32°N to 41°N) and used to compute both historical and future estimates of JJA PDSI with bootstrap resampling procedures described below. The use of climatological values for all fields other than temperature and precipitation was motivated by the goal of isolating the effects of temperature and precipitation alone on future JJA PDSI values; changes in megadrought risk were therefore constrained to arise solely from changes in either of these two variables.
Precipitation and soil moisture are physical quantities, whereas the PDSI is a normalized index of aridity (though its local SD is not necessarily unity). Negative and positive PDSI values correspond to drought or wet conditions, respectively (33, 34). PDSI can be computed “offline” from model output and presents an internally consistent measure of drought across space, through time, and among models with different land surface schemes.
There are a number of plausible objective methods for identifying periods of megadrought in hydroclimate time series (12–16), but we adopted a simple and relatively transparent definition recently used by Cook et al. (7) and Ault et al. (8). Namely, for a given time series (yt), we are interested in finding intervals when the running mean (of length w) falls below a certain threshold (q). This definition has recently been shown to reliably identify decadal droughts in the historical record (with w = 11 and q = −0.5) and multidecadal megadroughts in the paleoclimate record (with w = 35 and q = −0.5) (8). These definitions were also applied to characterize 21st-century prolonged drought risk arising primarily from climate change (7, 8). We adopt the latter definition to assess multidecadal (35-year) megadrought risk in the projections.
Identifying megadroughts across a wide range of hydroclimatic time series that might include precipitation, soil moisture, drought indices, and paleoclimate records required us to normalize data in ways that would allow objective comparisons across results. We therefore considered a “modified z score” (zt′) defined as
where yt is the original variable and μref and σref are the mean and SD, respectively, of that variable over a reference time period (in our case, 1951–2000). The modified z score is then smoothed using a moving average of length w to produce a new time series [Xw(t)]
Fundamentally, we were interested in the probability that any element of Xw(t) falls below the threshold q for different combinations of shifts in the mean values of zt′ (Δμ) and changes in the SD (δσ = σnew/σref). The parameters Δμ and δσ were interpreted as being estimates of the influence of climate change on the mean and SD of some particular drought indicator (yt). The quantity of interest was the 2D PDF of megadrought: Pr{Xw ≤ q | δσ,Δμ}, which depends on both changes in the mean (Δμ) and the SD (δσ) of the modified z score (zt′).
The 2D PDF of megadrought risk (Pr{Xw ≤ q | δσ,Δμ}) was estimated using a Monte Carlo procedure as in Ault et al. (8) and Cook et al. (7) and checked analytically (see figs. S4 and S5). Because we were interested in relative changes in megadrought risk as a function of shifts in the mean and different variance ratios, we would assume that the reference time series (zt′) has zero mean and unit variance over the reference period. This assumption is analogous to the approach used by Ault et al. (8) and Cook et al. (7), which looked at modified z scores computed from precipitation and soil moisture indicators, respectively. The difference herein is that we prescribed changes in Δμ and δσ directly, rather than computing these parameters from GCM output. We generated random (Monte Carlo) realizations () from a Gaussian (temporally white) distribution of changes in Δμ mean and δσ SD to represent changes in megadrought risk as a function of these two parameters (Fig. 1). Note that using Monte Carlo realizations with built-in sources of temporal persistence elevated risks in the “gray area” (values between 0.1 and 0.8) in Fig. 1 (see fig. S6). Accordingly, the PDF shown in Fig. 1 is “conservative” in the sense that true risks for certain types of drought indicators with interannual autocorrelation might be even higher than those depicted. CMIP5-based estimates of Δμ and δσ were computed from annual precipitation, JJA soil moisture (at 30 cm and 2 m), and JJA PDSI by normalizing each of these indices over the historical period (1951–2000) and computing their normalized means and SDs at midcentury (2051–2080). These model-based estimates were then overlaid on the 2D PDF in Fig. 1.
We estimated the 2D PDF of megadrought risk as a function of changes in both temperature and precipitation (Fig. 2) using PDSI as a proxy for the surface moisture balance. To do so, the following four steps were repeated 100 times for each grid point in the American Southwest. First, the joint distribution of precipitation and temperature was generated for each month from observations. Second, temperature and precipitation values were drawn from this distribution (with replacement) to generate 100 “bootstrap” years (1200 months). Third, changes in temperature (ΔT) were then added to each month of these realizations, and precipitation was likewise scaled between −30 and +30% of climatology [that is, the range encompassed by the GCMs; see the studies by Cook et al. (7), Ault et al. (8), and Diffenbaugh and Giorgi (25)]. Fourth, these bootstrap realizations were used to compute PDSI for each unique combination of change in precipitation and change in temperature. Climatological values were used for all other variables (surface pressure, net radiation, and humidity) required by the Penman-Monteith model of evapotranspiration. As in the study by Cook et al. (7), the 1931–1990 period was used for calibrating the PDSI, and JJA average values were used to identify megadroughts.
The process above generated bootstrap realizations of PDSI with different combinations of change in temperature (ΔT) and precipitation imposed on the historical period. We estimated a 2D PDF of megadrought risk for JJA PDSI at each grid point by normalizing each realization by the mean and SD of the 1951–2000 period, applying a 35-year averaging window, and identifying periods where this running mean dropped below −0.5σ. This step yielded one 2D PDF per grid point. PDFs from all grid points were averaged together for the American Southwest to produce a “master” PDF of megadrought risk, against which changes in temperature and precipitation from the entire CMIP5 multimodel ensemble were compared [for example, even from members that did not have sufficient data for computing the soil moisture quantities or PDSI in the study by Cook et al. (7)]. This 2D PDF is shown in Fig. 2.
Last, in Fig. 2, CMIP5-based estimates of changes in temperature and precipitation were computed as the difference (ΔT), or ratio (%), between midcentury (2051–2080) and historical (1951–2000) periods. These differences were calculated independently from each run; thus, the symbols in Fig. 2 represent internally consistent (with respect to each simulation) estimates (as opposed to comparisons of model simulations to historical values).
Supplementary Material
Acknowledgments
We thank the World Climate Research Program’s Working Group on Coupled Modeling, which oversees CMIP, and the individual model groups (listed in the caption of fig. S1) for making their data available. Funding: This material is based on work partially supported by NSF EaSM2 (Earth System Model 2) grants (AGS1243125 and AGS1243204) and NSF grants AGS1602564 and AGS1401400. Author contributions: T.R.A., J.E.S., J.S.M., and B.I.C. conceived the study. T.R.A. wrote the paper and produced all figures. B.I.C. calculated PDSI values from CMIP5 data, J.S.M. calculated PDSI values from LENS, and T.R.A. conducted the rest of the calculations. J.E.S., J.S.M., and B.I.C. contributed feedback and helped refine the writing. Competing interests: The authors declare that they have no competing interests. Data and materials availability: All methods needed to evaluate the conclusions in the paper are present in the paper and/or the Supplementary Materials. Additional data related to this paper may be requested from the authors. All data for computing changes in mean and variance as well as PDSI from CMIP5 models and LENS are available through the Earth System Grid Federation. Lamont-Doherty Earth Observatory contribution no. 8056.
SUPPLEMENTARY MATERIALS
Supplementary material for this article is available at http://advances.sciencemag.org/cgi/content/full/2/10/e1600873/DC1
Analytical PDF of megadrought
fig. S1. Joint (2D) PDF of Southwest megadrought risk for a normalized drought indicator time series [z′(t)] with various changes in the mean (Δμ) and changes in the variance (δσ).
fig. S2. Full range of changes in mean (Δμ) and variability (δσ) simulated by a CMIP5 model subset.
fig. S3. Megadrought PDF for various combinations of seasonal changes.
fig. S4. Reduction of variance in smoothed time series (Xw) as a function of smoothing window length (w).
fig. S5. Two-dimensional PDF of prolonged drought risk computed from the analytical expression for megadrought probability.
fig. S6. Megadrought 2D PDF for changes in mean and variance but for different autocorrelation characteristics of the underlying data.
REFERENCES AND NOTES
- 1.Acuna-Soto R., Stahle D. W., Cleaveland M. K., Therrell M. D., Megadrought and megadeath in 16th century Mexico. Emerg. Infect. Dis. 8, 360–362 (2002). [DOI] [PMC free article] [PubMed] [Google Scholar]
- 2.Woodhouse C. A., Overpeck J. T., 2000 years of drought variability in the central United States. Bull. Am. Meteorol. Soc. 79, 2693–2714 (1998). [Google Scholar]
- 3.Buckley B. M., Anchukaitis K. J., Penny D., Fletcher R., Cook E. R., Sano M., Le C. N., Wichienkeeo A., Minh T. T., Hong T. M., Climate as a contributing factor in the demise of Angkor, Cambodia. Proc. Natl. Acad. Sci. U.S.A. 107, 6748–6752 (2010). [DOI] [PMC free article] [PubMed] [Google Scholar]
- 4.Shanahan T. M., Overpeck J. T., Anchukaitis K. J., Beck J. W., Cole J. E., Dettman D. L., Peck J. A., Scholz C. A., King J. W., Atlantic forcing of persistent drought in West Africa. Science 324, 377–380 (2009). [DOI] [PubMed] [Google Scholar]
- 5.Benson L., Petersen K., Stein J., Anasazi (pre-Columbian Native-American) migrations during the middle-12th and late-13th centuries—Were they drought induced? Clim. Change 83, 187–213 (2007). [Google Scholar]
- 6.Hodell D. A., Curtis J. H., Brenner M., Possible role of climate in the collapse of Classic Maya civilization. Nature 375, 391–394 (1995). [Google Scholar]
- 7.Cook B. I., Ault T. R., Smerdon J. E., Unprecedented 21st century drought risk in the American Southwest and Central Plains. Sci. Adv. 1, e1400082 (2015). [DOI] [PMC free article] [PubMed] [Google Scholar]
- 8.Ault T. R., Cole J. E., Overpeck J. T., Pederson G. T., Meko D. M., Assessing the risk of persistent drought using climate model simulations and paleoclimate data. J. Clim. 27, 7529–7549 (2014). [Google Scholar]
- 9.Cook B. I., Smerdon J. E., Seager R., Coats S., Global warming and 21st century drying. Clim. Dyn. 43, 2607–2627 (2014). [Google Scholar]
- 10.Smerdon J. E., Coats S., Ault T. R., Model-dependent spatial skill in pseudoproxy experiments testing climate field reconstruction methods for the Common Era. Clim. Dyn. 46, 1921–1942 (2016). [Google Scholar]
- 11.Milly P. C. D., Dunne K. A., Potential evapotranspiration and continental drying. Nat. Clim. Change 10.1038/nclimate3046 (2016). [Google Scholar]
- 12.Cook E. R., Woodhouse C. A., Eakin C. M., Meko D. M., Stahle D. W., Long-term aridity changes in the western United States. Science 306, 1015–1018 (2004). [DOI] [PubMed] [Google Scholar]
- 13.Meehl G. A., Hu A. X., Megadroughts in the Indian monsoon region and southwest North America and a mechanism for associated multidecadal Pacific sea surface temperature anomalies. J. Clim. 19, 1605–1623 (2006). [Google Scholar]
- 14.Meko D. M., Woodhouse C. A., Baisan C. A., Knight T., Lukas J. J., Hughes M. K., Salze M. W., Medieval drought in the upper Colorado River Basin. Geophys. Res. Lett. 34, L10705 (2007). [Google Scholar]
- 15.Hunt B. G., Global characteristics of pluvial and dry multi-year episodes, with emphasis on megadroughts. Int. J. Climatol. 31, 1425–1439 (2011). [Google Scholar]
- 16.Coats S., Smerdon J. E., Seager R., Cook B. I., González-Rouco J. F., Megadroughts in Southwestern North America in ECHO-G millennial simulations and their comparison to proxy drought reconstructions. J. Climate 26, 7635–7649 (2013). [Google Scholar]
- 17.Knutti R., Sedlacek J., Robustness and uncertainties in the new CMIP5 climate model projections. Nat. Clim. Change 3, 369–373 (2013). [Google Scholar]
- 18.Kay J. E., Deser C., Phillips A., Mai A., Hannay C., Strand G., Arblaster J. M., Bates S. C., Danabasoglu G., Edwards J., Holland M., Kushner P., Lamarque J.-F., Lawrence D., Lindsay K., Middleton A., Munoz E., Neale R., Oleson K., Polvani L., Vertenstein M., The Community Earth System Model (CESM) Large Ensemble Project: A community resource for studying climate change in the presence of internal climate variability. Bull. Am. Meteorol. Soc. 96, 1333–1349 (2015). [Google Scholar]
- 19.IPPC, Summary for policymakers, in Climate Change 2013: The Physical Science Basis. Contribution of Working Group I to the Fifth Assessment Report of the Intergovernmental Panel on Climate Change (Cambridge Univ. Press, Cambridge, 2013), p. 33; www.ipcc.ch/pdf/assessment-report/ar5/wg1/WG1AR5_SPM_FINAL.pdf [accessed 12 September 2016].
- 20.Cook B. I., Cook E. R., Smerdon J. E., Seager R., Williams A. P., Coats S., Stahle D. W., Villanueva Díaz J., North American megadroughts in the Common Era: Reconstructions and simulations. Wiley Interdiscip. Rev. Clim. Change 7, 411–432 (2016). [Google Scholar]
- 21.Ault T. R., Zurita-Milla R., Schwartz M. D., A Matlab© toolbox for calculating spring indices from daily meteorological data. Comput. Geosci. 83, 46–53 (2015). [Google Scholar]
- 22.Cheng L., Hoerling M., AghaKouchak A., Livneh B., Quan X.-W., Eischeid J., How has human-induced climate change affected California drought risk? J. Climate 10.1175/JCLI-D-15-0260.1 (2016). [Google Scholar]
- 23.Smerdon J. E., Cook B. I., Cook E. R., Seager R., Bridging past and future climate across paleoclimatic reconstructions, observations, and models: A hydroclimate case study. J. Climate 28, 3212–3231 (2015). [Google Scholar]
- 24.Kunreuther H., Heal G., Allen M., Edenhofer O., Field C. B., Yohe G., Risk management and climate change. Nat. Clim. Change 3, 447–450 (2013). [Google Scholar]
- 25.Diffenbaugh N., Giorgi F., Climate change hotspots in the CMIP5 global climate model ensemble. Clim. Change 114, 813–822 (2012). [DOI] [PMC free article] [PubMed] [Google Scholar]
- 26.Seager R., Ting M., Held I., Kushnir Y., Lu J., Vecchi G., Huang H.-P., Harnik N., Leetmaa A., Lau N.-C., Li C., Velez J., Naik N., Model projections of an imminent transition to a more arid climate in southwestern North America. Science 316, 1181–1184 (2007). [DOI] [PubMed] [Google Scholar]
- 27.W. Nelson, Accelerated Testing: Statistical Models, Test Plans, and Data Analysis (John Wiley & Sons Inc., 2004). [Google Scholar]
- 28.Hunt B. G., Global characteristics of pluvial and dry multi-year episodes, with emphasis on megadroughts. Int. J. Climatol. 31, 1425–1439 (2010). [Google Scholar]
- 29.Hodell D. A., Brenner M., Curtis J. H., Guilderson T., Solar forcing of drought frequency in the Maya lowlands. Science 292, 1367–1370 (2001). [DOI] [PubMed] [Google Scholar]
- 30.Peters G. P., Andrew R. M., Boden T., Canadell J. G., Ciais P., Le Quéré C., Marland G., Raupach M. R., Wilson C., The challenge to keep global warming below 2°C. Nat. Clim. Change 3, 4–6 (2012). [Google Scholar]
- 31.Mitchell T. D., Jones P. D., An improved method of constructing a database of monthly climate observations and associated high-resolution grids. Int. J. Climatol. 25, 693–712 (2005). [Google Scholar]
- 32.Kalnay E., Kanamitsu M., Kistler R., Collins W., Deaven D., Gandin L., Iredell M., Saha S., White G., Woollen J., Zhu Y., Leetmaa A., Reynolds R., Chelliah M., Ebisuzaki W., Higgins W., Janowiak J., Mo K. C., Ropelewski C., Wang J., Jenne R., Joseph D., The NCEP/NCAR 40-year reanalysis project. Bull. Am. Meteorol. Soc. 77, 437–471 (1996). [Google Scholar]
- 33.Alley W. M., The Palmer Drought Severity Index—Limitations and assumptions. J. Clim. Appl. Meteorol. 23, 1100–1109 (1984). [Google Scholar]
- 34.Swann A. L. S., Hoffman F. M., Koven C. D., Randerson J. T., Plant responses to increasing CO2 reduce estimates of climate impacts on drought severity. Proc. Natl. Acad. Sci. U.S.A. 113, 10019–10024 (2016). doi:10.1073/pnas.1604581113 [DOI] [PMC free article] [PubMed] [Google Scholar]
Associated Data
This section collects any data citations, data availability statements, or supplementary materials included in this article.
Supplementary Materials
Supplementary material for this article is available at http://advances.sciencemag.org/cgi/content/full/2/10/e1600873/DC1
Analytical PDF of megadrought
fig. S1. Joint (2D) PDF of Southwest megadrought risk for a normalized drought indicator time series [z′(t)] with various changes in the mean (Δμ) and changes in the variance (δσ).
fig. S2. Full range of changes in mean (Δμ) and variability (δσ) simulated by a CMIP5 model subset.
fig. S3. Megadrought PDF for various combinations of seasonal changes.
fig. S4. Reduction of variance in smoothed time series (Xw) as a function of smoothing window length (w).
fig. S5. Two-dimensional PDF of prolonged drought risk computed from the analytical expression for megadrought probability.
fig. S6. Megadrought 2D PDF for changes in mean and variance but for different autocorrelation characteristics of the underlying data.