

SUMMARY
Increased expression of vimentin intermediate filaments (VIF) enhances directed cell migration, but the mechanism behind VIF’s effect on motility is not understood. VIF interact with microtubules, whose organization contributes to polarity maintenance in migrating cells. Here we characterize the dynamic coordination of VIF and microtubule networks in wounded monolayers of Retinal Pigment Epithelial cells. By genome editing we fluorescently labelled endogenous vimentin and α-tubulin and we developed computational image analysis to delineate architecture and interactions of the two networks. Our results show that VIF assemble an ultrastructural copy of the previously polarized microtubule network. Because the VIF network is long-lived compared to the microtubule network, VIF template future microtubule growth along previous microtubule tracks, thus providing a feedback mechanism that maintains cell polarity. VIF knockdown prevents cells from polarizing and migrating properly during wound healing. We suggest that VIF’s templating function establishes a memory in microtubule organization that enhances persistence in cell polarization in general and migration in particular.
Graphical abstract

INTRODUCTION
The cytoskeleton is an interconnected network of filamentous polymers and regulatory proteins that governs cellular mechanics and morphodynamics. Cell migration, a central process during development, wound healing, immune response and cancer metastasis, involves continuous changes in cell morphology that are driven by the architectural dynamics of the cytoskeleton. Cell migration occurs in three steps that are tightly coordinated in time and space: propulsion of new pseudopodia, formation of cell-matrix and cell-cell adhesions, and contraction. While all three steps are governed by the assembly and turnover of actin filament networks and bundles and the engagement of actin-based structures with adhesion plaques and myosin motors, the ability of a cell to move in a particular direction requires polarization of this machinery: propulsion of pseudopodia ought to be localized at the leading edge, adhesions ought to be established in a gradient of strong coupling to the surrounding matrix and tissue at the front and weaker coupling at the rear, and contraction ought to be directed predominantly along this same front to rear axis. The establishment of such a cell-internal compass depends on the spatiotemporal orchestration of many signaling cues (Ridley et al., 2003). Microtubules are thought to be the master organizers of polarity signaling via their roles in vesicle and molecule trafficking between cell front and rear (Etienne-Manneville, 2013). The orientation of the microtubules in turn is controlled by signal transduction of extracellular cues and by feedback interactions with the cell-internal polarity signals that cooperatively confer front-rear asymmetry in the dynamics and stability of microtubules (Figure 1A) (Etienne-Manneville, 2013).
Figure 1.

Quantitative live cell imaging and analysis of vimentin (VIF) and microtubule interactions. (A) Left, schematic of cytoskeleton organization in a polarized, migrating cell. Propulsion of the cell front is driven by polymerization of a dense network of actin filament. Net traction of the cell body is enabled by a front-rear gradient in adhesion and contraction of cortex and actomyosin bundles aligned with the axis of migration. The vectorial asymmetry of the actomyosin and adhesion machineries depends on spatiotemporal orchestration of many signaling cues, which are organized to a large extent by a dynamic microtubule network, partly in response to extracellular guidance cues. Right, hierarchy of events leading to cell polarization and directed migration. The VIF network, which constitutes the third cytoskeleton component in mesenchymal cell migration, assembles along microtubules. Hence, VIF establish a structure copy of the microtubule network with 4–5 fold slower turnover (>10 minutes for VIF, 3–5 minutes for microtubules). (B) Genome-edited RPE cells expressing mEmerald-vimentin and mTagRFPt-α-tubulin under the control of the endogenous promotor during wound healing response. Scale bar: 50 μm. (C) Zoom of the VIF and MT networks in a cell at the wound edge. Scale bar: 10 μm. (D–J) Image analysis pipeline for cytoskeleton network reconstruction: (D) Raw image of mTagRFPt-α-tubulin. Scale bar: 10 μm; (E) Output of steerable filtering applied to D; (F) Non-maximum suppression of filter response in E; (G) Raw image overlaid by non-maximum suppression output color-coded by the local filament orientation (the orientation vertical to the wound sets the zero degree direction); (H) Zoomed view of boxed area in G. Black arrows indicate gaps between segments that belong to the same filament; (I) Reconstructed filaments after graph matching to bridge gaps (white arrows); (J) Reconstructed VIF (green) and microtubule filaments (red).
Intermediate filaments (IFs) constitute the third component of the cytoskeleton. IFs differ from actin filaments and microtubules in structure and assembly (Snider and Omary, 2014). IFs are made of filamentous monomers that laterally associate with each other to form unit-length filaments (ULFs). ULFs anneal in an end-to-end fashion to form longer, mature filaments. Contrary to actin filaments and microtubules where monomer addition occurs primarily at one of the filament ends, the exchange of subunits can occur anywhere along a mature filament and the filament structure itself is non-polar. In most mammalian cells, IFs can be found throughout the cytoplasm and in the nucleus. At least 67 genes encode functional human IFs proteins (Chang and Goldman, 2004). Among them, vimentin intermediate filaments (VIF) are specifically associated with enhanced migration ability. Motile cells such as fibroblasts and lymphocytes have higher VIF levels (Mendez et al., 2010), whereas epithelial cells, whose primary role is to form stable tissue barriers, express intermediate filaments from the keratin sub-family of IFs, but not VIF. How increased expression of VIF may contribute to enhanced directed cell migration has remained largely elusive.
To convey directionality to migration, the cell polarity needs to be persistent; on the other hand, the cell polarity needs to be adaptive to extracellular and intracellular cues that redirect migration. Microtubules grow and shrink in cycles that yield a turnover rate of 3–5 minutes (Shelden and Wadsworth, 1993) at the population level. Conceptually, this dynamic instability offers a powerful mechanism to translate long-range directional cues on a time scale of several minutes, whereas the actin machinery turns over on a faster time scale (~30–120 seconds), which is necessary to implement an efficient protrusion – adhesion – contraction cycle. VIF turnover is significantly slower than that of microtubules (>10 minutes) (Yoon et al., 1998), however, VIF assembly depends on microtubules (Chang and Goldman, 2004). Precursors of vimentin filaments referred to as particles and squiggles move along microtubules where they aggregate into longer, mature filaments that form a structural, yet longer-lived ‘copy’ of the microtubule network (Figure 1A). A recent quantitative super resolution imaging study showed strong VIF/microtubule alignment in endothelial cells (Nieuwenhuizen et al., 2015).
Conceivably, as a long-lived copy of the microtubule network, the vimentin network could inform future microtubule function; for example, it could guide their shrinkage and regrowth. Indeed, VIFs are known to interact with microtubules through a multitude of proteins, including microtubule associated motors (Prahlad et al., 1998), the cytoskeleton-binder plectin (Huber et al., 2014), and the tumor suppressor adenomatous polyposis coli (Sakamoto et al., 2013). We, therefore, hypothesized that VIF networks could enhance directed cell migration by increasing the persistence of the microtubule network architecture and thus of the whole-cell front-rear polarity. To test this hypothesis, we analyzed the dynamic interaction between the two cytoskeleton networks in the context of cell migration. Specifically, we established a cell line that expresses fluorescent fusions of vimentin and tubulin under the control of endogenous promoters and developed a high-resolution live cell imaging and computer vision workflow, as well as statistical methods, to quantitatively analyze the role VIF plays in microtubule network organization and cell migration.
RESULTS
Experimental system to measure the dynamic interaction between microtubule and VIF networks during cell migration
The motile behavior of cells is highly sensitive to vimentin expression levels (Figure S1A–B). Therefore, it would be impossible to study the specific role of VIF in the control of microtubule network organization and cell migration by imaging cells that overexpress a fluorescent vimentin. Instead we used TALEN-based genome editing to N-terminally tag vimentin and α-tubulin (Figures S1–3, Movie S1). Specifically, we established a hTERT-immortalized Retinal Pigment Epithelial (RPE) cell line that expresses mEmerald-vimentin and mTagRFPt-α-tubulin under the control of the endogenous cytoskeleton-regulating promoters which preserve normal vimentin and α-tubulin expression levels, with 8%+/−4% (mean, +/−STD, N= 5 blots) and 5%+/−2% (N = 6) of tagged vimentin and α-tubulin, respectively (Figures 1B–C, S3A–D). We chose RPE cells for our studies because, in culture, they establish a metastable state between epithelial and mesenchymal cells, i.e. they express canonical mesenchymal markers, including vimentin, but maintain the characteristic features of planar self-polarization followed by collective migration of epithelial monolayers after inducing a scratch wound (Ng et al., 2012). Thus, this cell model allowed us to monitor VIF-microtubule interaction during polarity establishment and maintenance. In order to study the role of VIF in these cell functions, we also used shRNA to knockdown vimentin in genome-edited RPE cells (Figure S3E–F).
To assess the extent of VIF-microtubule coordination and its roles in monolayer migration we developed a computer vision toolbox to reconstruct the architecture of both fibrous cytoskeleton networks (Figure S4A–D) and to quantify the dynamic interactions between them (Figure S4E–G). Briefly, the raw images are processed with a steerable filter (Jacob and Unser, 2004) to enhance the signal of curvilinear features (Figure 1D–E), followed by a non-maximum suppression step that skeletonizes the filtered images into line segments (Figure 1F). Finally, the line segments are aggregated into a complete representation of a filament network using a graph-based matching approach that closes breaks between filaments caused by unevenness of fluorescence signal, low SNR and filament crossovers (Figure 1G–J, Movies S2).
VIF and microtubule align in polarized cells
In the wounded RPE monolayer, cells in different bands of increasing distance from the wound edge exhibit various degrees of elongation. Cells in the first layer mostly orient towards the direction of migration, i.e. perpendicular to the wound edge (Figure 2A). To test whether cell orientation is associated with cytoskeletal polarization, we first analyzed the structure of reconstructed VIF and microtubules in different layers with respect to the wound edge. Our analysis indicates that the orientation of both networks is dependent on the position of the cell within the monolayer. Cells at the wound edge have both VIF and microtubule networks oriented in the direction of migration (Figure 2B, 2C). VIF and microtubule networks in cells at longer distances from the wound edge lose this preferential orientation. To investigate whether the simultaneous polarization of VIF and microtubules at the wound edge is caused by enhanced VIF/microtubule coordination, we analyzed the structural similarity of the VIF and microtubule networks for cells in different bands. We defined a scoring system based on the local proximity and alignment of filaments to quantify the structural similarity of the two networks (Figure S4E–G, Movie S2). Our analysis indicates that cells at the wound edge have higher similarity scores than cells in more distal bands (Figure 2B–D), suggesting that the networks may interact more in cells at the front. In support of this, the local network densities of VIF and microtubules are positively correlated with each other (Figures 2E, S5), with cells at the wound front exhibiting higher correlation coefficients. Collectively, the analyses suggest that in polarized cells at the wound edge, both VIF and microtubule networks are collaboratively organized in the direction of migration.
Figure 2.
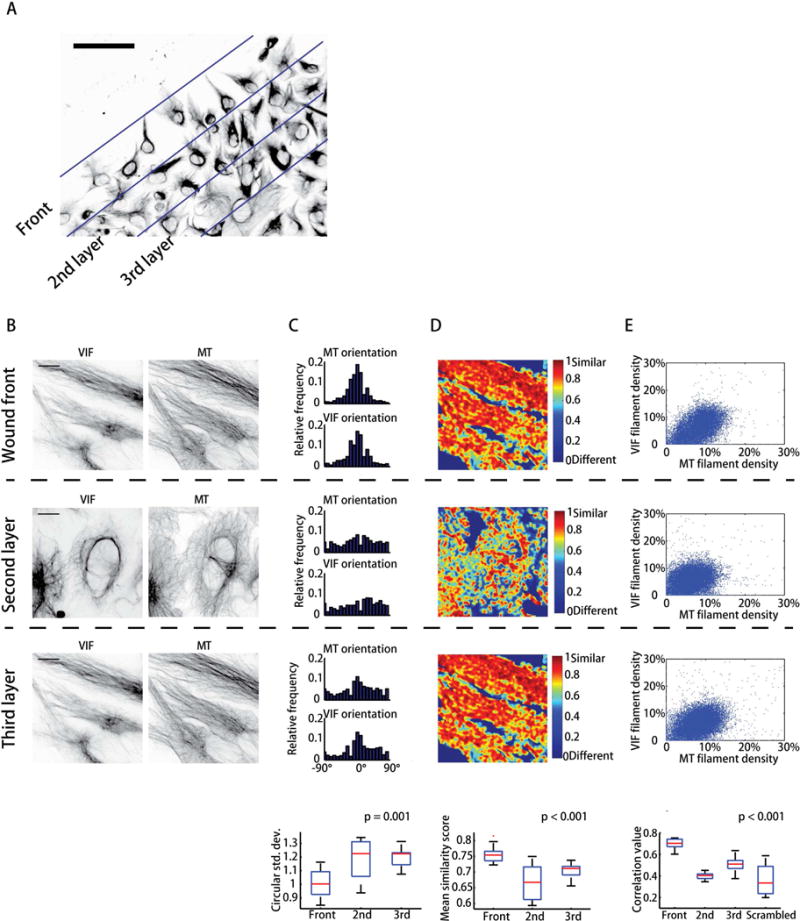
VIF and MT networks are co-aligned in cells at the wound edge. (A) Definition of bands in wounded1 cell monolayer with increasing distances from the wound edge. (B) VIF and MT raw images in different layers. (C) Distributions of local orientation in three bands. Bottom of column: ANOVA of circular standard deviation of orientation distribution (n = 30 cells). (D) Score map of VIF/microtubule network similarity. Bottom of column: ANOVA of mean of network similarity score (n = 30 cells). (E) Scatter plot of VIF vs. MT filament densities. Bottom of column: ANOVA for filament density correlation values (n = 30 cells).
VIF can stabilize microtubule organization
Microtubules have been proposed as the causative element in the VIF-microtubule co-alignment. Microtubules guide VIF assembly in fibroblasts (Gurland and Gundersen, 1995), and sustained treatment of nocodazole, which fully depolymerizes the microtubule network, results in a retraction of the VIF network to the perinuclear region (Yoon et al., 1998). On the other hand, disruption of VIF leads to a dramatic alteration of microtubules (Goldman et al., 1996). Taken together, these observations suggest a potential feedback interaction, where the two networks can mutually reinforce each other. However, previous data relied on endpoint readouts of network configurations that miss the dynamic effects of any such feedback at the time scales of network turnover and migration activities.
To test our hypothesis that the slow network (VIF) can stabilize the fast one (microtubules), we first examined whether microtubules associated with VIF are more resistant to perturbation by the microtubule-depolymerizing drug nocodazole. Overall, the microtubule network depolymerized over a few minutes after nocodazole addition, but the VIF network remained essentially intact for about 20 minutes (Figure 3A–B, Movie S3). We then asked whether microtubules aligned with VIF are more stable during drug treatment. To this end, we first calculated the VIF/microtubule network cross-similarity (high similarity served as a proxy for the local association of the two networks) and microtubule network self-similarity over a time span of 1 minute (inversely proportional to network dynamics) for an entire movie (Movie S4). In a second step we generated a scatter plot of VIF/microtubule cross-similarity vs. microtubule self-similarity for a time point that is within the fast period of filament length decrease (4–5 minutes) after nocodazole addition for all pixels belonging to the reconstructed microtubule network (Figure 3C). The scatter plot shows a possibly positive correlation, indicating that microtubules in regions of higher VIF/microtubule interaction depolymerize slower. To statistically verify this impression, we randomly sampled 10 data pairs and carried out a linear regression cross-similarity vs. self-similarity analysis. We found that the distribution of slopes from 1,000 samplings was significantly greater than zero (Figure 3D), whereas the distribution of slopes from 1,000 samplings of independent 10 cross-similarity and self-similarity values had a mean value equal to zero (Figure 3E). This shows that microtubules closely associated with VIF depolymerize slower than those that are not. A sensitivity analysis of the different parameters used for the similarity score generation, including the choice of the time point of the microtubule self-similarity calculations, confirmed the robustness of these findings (Figure S6, Table S3). Therefore, VIF can stabilize microtubules, consistent with previous studies showing that the absence of VIF alters microtubule organization (Shabbir et al., 2014). This stabilization function may provide persistence to microtubule organization, because the VIF network turnover is nearly tenfold slower.
Figure 3.
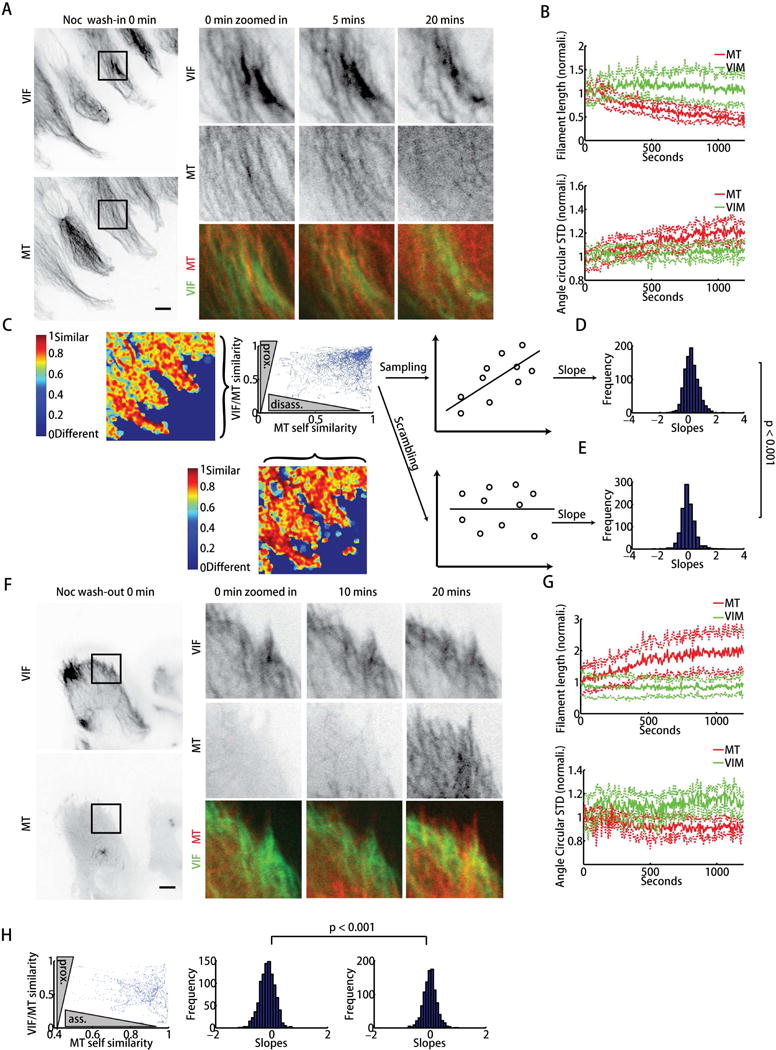
VIF stabilizes MTs and guides MT re-growth. (A) Confluent RPE cell monolayers were scratched, incubated with nocodazole and imaged. Top, bottom, representative images of mEmerald-vimentin and mTagRFPt-α-tubulin at different time points as indicated (Movie S3). t = 0 indicates time point of nocodazole addition to the medium. Scale bar: 10 μm. (B) Time courses of mean normalized filament lengths and circular standard deviations of orientation from n = 7 live experiments; solid lines: mean of total (normalized) filament lengths and circular standard deviations; dotted lines represent the 95% confidence interval about mean. (C) Scatter plot of VIF/MT network similarity (higher similarity means higher proximity and alignment of the two networks) 4 minutes after nocodazole addition vs. MT self-similarity (lower self-similarity means more disassembly) between 4–5 minutes after nocodazole addition. (D) 10 data points were randomly sampled in C to determine the correlation (slope of fit line) between the two similarity score sets. Distribution of slopes calculated from 1000 sampling repeats. (E) 10 data points were randomly sampled in C and scrambled to determine the distribution of random slopes. The distributions in E and F were compared by the Kolmogorov -Smirnov test (p < 0.001). (F) Confluent RPE monolayers were scratched and incubated with nocodazole for 20 minutes and then washed out. Top, bottom, representative images of mEmerald-vimentin and mTagRFPt-α-tubulin at different time points after nocodazole wash-out as indicated (Movie S5). t = 0 indicates time point of nocodazole wash-out. Scale bar: 10 μm. (G) Time courses of the mean normalized filament lengths and circular standard deviations of orientation distribution from n = 7 live experiments; solid lines: mean of total (normalized) filament lengths and circular standard deviations; dotted lines represent 95% confidence interval about mean. (H) Scatter plot of VIF/MT network similarity 5 minutes after nocodazole wash-out vs MT self-similarity (lower self-similarity means more assembly) between 4–5 minutes after nocodazole wash-out. The distribution of slopes obtained from 1000 line fits to independent samplings of 10 data points and the slope distribution of 1000 scrambled samples. The two distributions were compared by the Kolmogorov -Smirnov test (p < 0.001).
VIF template microtubule growth
To test whether local VIF-microtubule network association facilitates microtubule growth we washed out nocodazole 30 minutes after treatment and allowed the microtubule network to re-form. At this time point the microtubule network had disassembled whereas the VIF network was still nearly identical to the pre-treatment organization. After nocodazole wash-out, the microtubule network recovered over about 20 minutes (Figure 3F–G, Movie S5). Correlation analysis of cross-similarity vs self-similarity between 4 and 5 minutes after nocodazole washout revealed a significant negative slope (Figure 3H, Movie S6). This analysis suggests that microtubule growth preferentially follows the VIF network structure and/or that newly grown microtubules interacting with VIF are stabilized. Accordingly, we propose that VIF can act as a template for microtubule network organization in migrating cells.
To further test the notion that VIF act, at least in part, as a template for microtubule growth we analyzed the spatial correlation of VIF with trajectories of the microtubule-plus tip associated protein EB1 in RPE cells (Figure 4A, Movie S7). EB1 comets are observed to systematically move along VIF (Figure 4B, Movies S8, S9). To statistically demonstrate guidance of EB1 trajectories by VIF, we reconstructed EB1 trajectories using plusTipTracker software (Applegate et al., 2011; Matov et al., 2011) and calculated the similarity of the trajectory network with the VIF network (Figure 4C). We then scrambled the location and orientation of EB1 trajectories within the cell boundary and found that similarity scores along scrambled trajectories are much lower than along the measured trajectories (Figure 4C). This analysis supports the conclusion that microtubule growth is guided by the VIF network.
Figure 4.
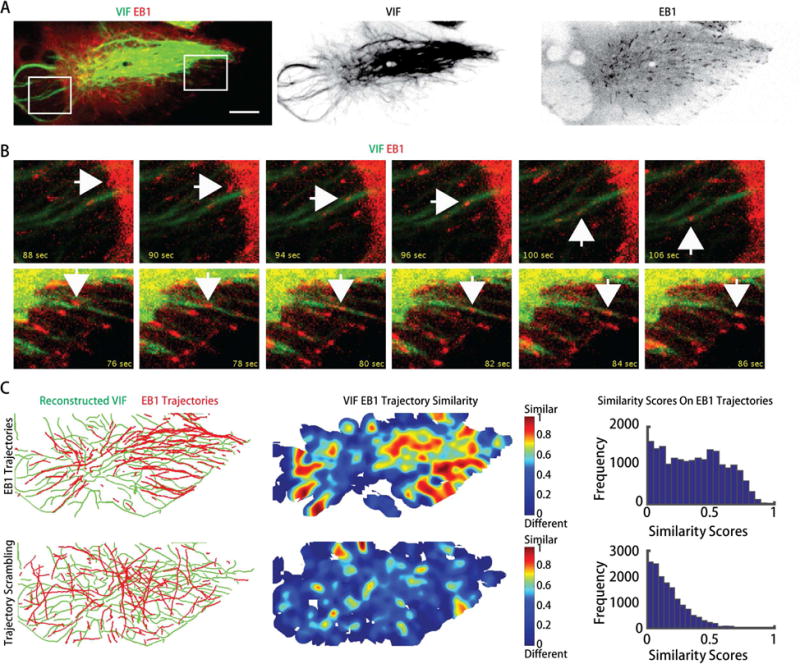
Microtubule plus ends grow along VIF. (A) mEmerald-vimentin genome-edited RPE cells were transfected with mTagRFP-EB1. Confluent monolayers were scratched and imaged (Movie S7). Scale bar: 10 μm. (B) representative images of the boxed regions in (A) at different time points as indicated (Movies S8, S9). White arrows indicate that EB1 trajectories align with VIF. (C) Top, the VIF and EB1 trajectories were reconstructed (left panel). Similarity between the VIF networks and EB1 trajectories were calculated (middle panel). Bottom, EB1 trajectories were scrambled (left panel). Similarity between the VIF networks and scrambled EB1 trajectories were calculated (the middle panel). The similarity scores along scrambled EB1 trajectories (bottom, right panel) are much lower than scores along unscrambled EB1 trajectories (top, right panel, n = 4 cells).
To also demonstrate directly that VIF can stabilize and template microtubules we fixed cells at different time points after nocodazole wash-in and wash-out and qualitatively observed the two networks by structured illumination super-resolution microscopy. These data clearly show prolonged microtubule-association with VIF during nocodazole incubation and preferential re-association after nocodazole wash-out (Figure S7A). Many microtubules follow VIF bundles even at high curvature, demonstrating a direct molecular interaction between the two cytoskeleton systems (Figure S7B).
Finally, we directly asked whether the VIF network is a causal factor of microtubule organization in a migrating cell. Our proposed model of VIF’s role as a template for microtubule organization on a time scale of 10–20 minutes predicts that the microtubule networks before and after nocodazole-mediated disassembly would be more similar in a cell expressing vimentin than a cell devoid of vimentin. To test this, we used shRNA to knockdown vimentin in genome-edited RPE cells (Figure S3E–F). Indeed, we found that in cells with vimentin depletion the microtubule networks imaged before wash-in of nocodazole and again imaged after wash-out were less similar than in control cells (Figure 5A–C, Movies S10–11).
Figure 5.
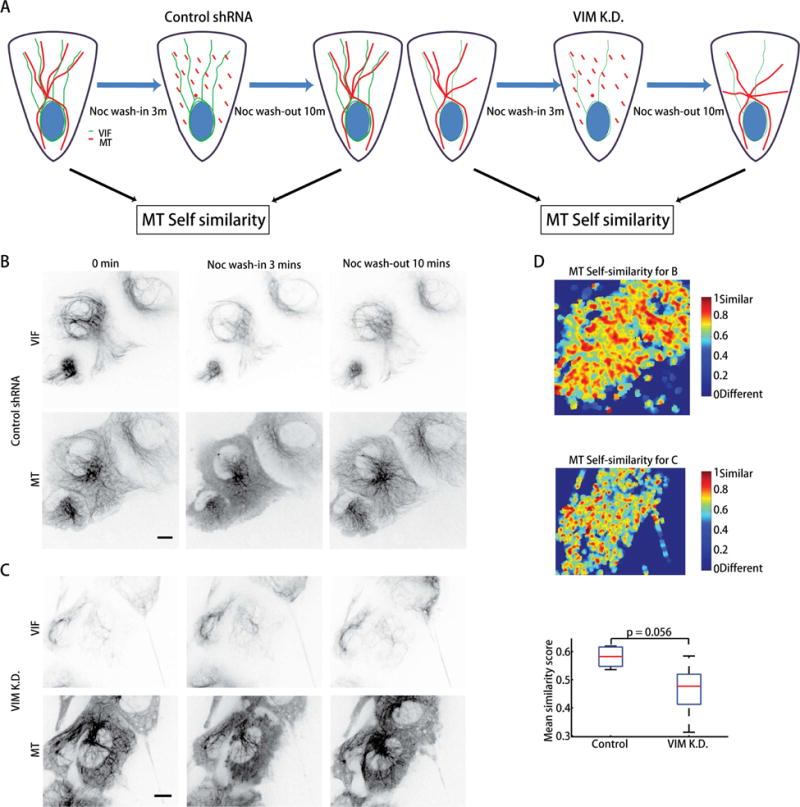
VIF network templates microtubule network. (A) Experimental procedure to establish a causal link between VIF expression and guidance of microtubule growth. (B, C) hTERT-RPE-1 mEmerald-vimentin/mTagRFPt-α-tubulin cells at the wound edge without (B) and with (C) knockdown of vimentin were incubated with nocodazole for 3 minutes and then washed out while being imaged. Top, bottom, representative images of mEmerald-vimentin and mTagRFPt-α-tubulin at different time points, as indicated (Movies S10, S11). Scale bar: 10 μm. (D) Top, microtubule self-similarity map before nocodazole incubation (0 mins) and 10 mins after nocodazole wash-out for control RPE cells. Middle, microtubule self-similarity map before nocodazole incubation (0 mins) and 10 mins after nocodazole wash-out for RPE cells with vimentin knockdown. Bottom, boxplot for the mean microtubule self-similarity scores of control and vimentin-knockdown cells (n = 5 experiments). Comparison of score distributions by Wilcoxon rank sum test.
To verify that VIF’s templating function observed in RPE cells is not a cell-type specific phenomenon, we ectopically expressed vimentin in MCF-7 cells, which are purely epithelial and thus have no detectable basal vimentin expression. We found that introduction of vimentin in these cells significantly enhanced microtubule polarization along the direction of cell elongation (Figure S8A–B). Altogether these data provide strong evidence for feedback interaction between the VIF and microtubule networks, in which the VIF network forms a structural copy of the microtubule network, and in turn stabilizes the microtubule network organization by guiding growth and conferring resistance to shrinkage of interacting microtubules.
VIF enhance cell polarity by templating microtubules
Given the proposed role of VIF as a microtubule network organizer, we next asked whether and how this function may be relevant to microtubule organization and cell polarization during migration. First, we wounded RPE monolayers and analyzed the healing process in absence and presence of VIF or microtubule perturbation. Consistent with previous data (Eckes et al., 2000; Eckes et al., 1998; Gilles et al., 1999), the wound closure rates were reduced with vimentin knockdown (Figure 6A–C, Movie S12). Analysis of migration speed and directionality over time and as a function of cell distance to the wound edge (Zaritsky et al., 2012) indicated that with vimentin knockdown, the establishment of migration directionality after scratching is delayed compared to control experiments (Figure 6B). Moreover, the propagation of speed increase after scratching to cells more distal to the wound edge is impaired. This suggests that the reduced healing rate with less vimentin is caused by slower establishment of cell polarization after wounding. Indeed, when we analyzed single RPE cell migration, cells harboring a scrambled shRNA vs. cells harboring shRNA against vimentin had the same migrating speed, but cells with VIF exhibited higher directionality (Figure S8C–D), confirming VIF knockdown primarily causes a defect in cell polarity. Based on our analysis of VIF–microtubule interactions we propose that this defect is due to abating microtubule organization. In fact, complete abrogation of microtubules by nocodazole incubation blocked wound healing and eliminated migration directionality (Figure 6A–C, Movie S12), consistent with the known role of microtubules in controlling polarity (Etienne-Manneville, 2013).
Figure 6.
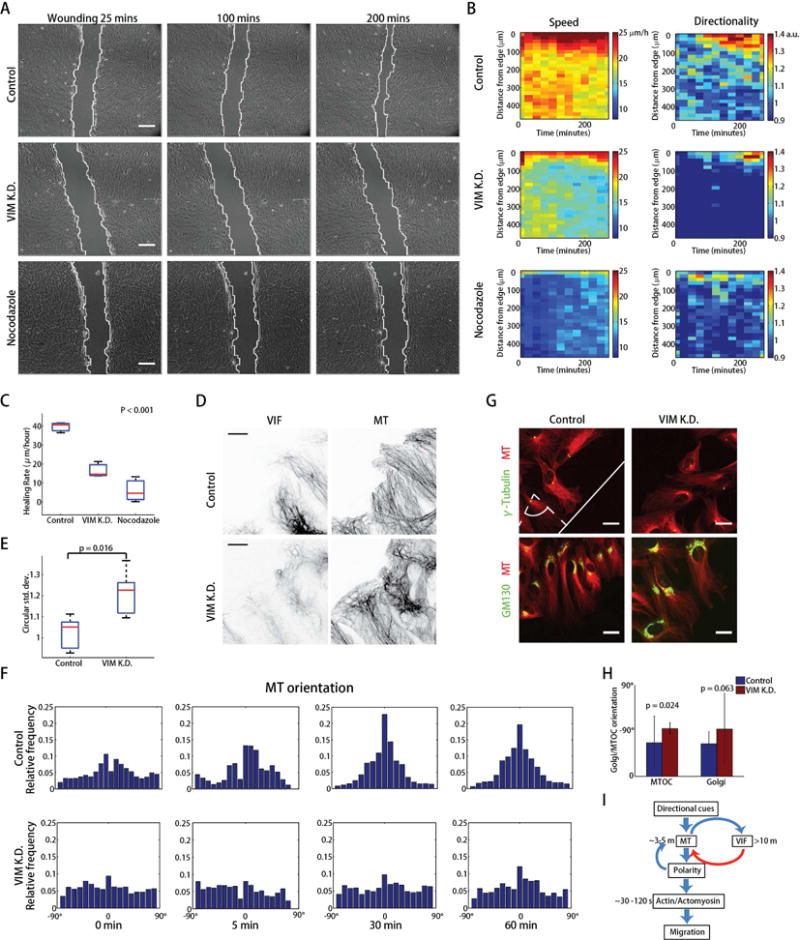
VIF stabilize microtubule network organization and enhance cell polarity in directed cell migration. (A) Wound healing response over 200 mins in control, vimentin-knockdown and nocodazole treated RPE cells as indicated (Movie S12). Scale bar: 200 μm. (B) Kymographs (distance from cell edge vs time) of migration speed and directionality. (C) ANOVA of healing rates (n = 3 experiments). (D) Microtubule and VIF organization in control and vimentin-knockdown RPE cells at the wound edge. Scale bar: 10 μm. (E) Boxplot of circular standard deviations of orientation distribution (n = 5 experiments). The p-value of the Wilcoxon rank sum test is shown. (F) Histograms of microtubule orientation in control and vimentin-knockdown RPE cells at different time points after scratching (Movie S13 and S14). (G) Golgi and γ-tubulin staining in control and vimentin-knockdown RPE cells at the wound edge (n = 30 cells). Scale bar: 20 μm. (H) Analysis of Golgi and γ-tubulin orientation with respect to the wound edge in control and vimentin knockdown RPE cells. The p-value of the Wilcoxon rank sum test is shown. (I) Model of VIF templating microtubules with positive feedback between microtubule structure and VIF assembly conferring increased persistence in cellular polarity and directed migration.
To test further whether the migration defects under vimentin knockdown are caused by compromised microtubule network organization we analyzed microtubule orientation for control and vimentin knockdown cells. We found indeed that in vimentin knockdown cells at the wound edge, microtubules are less oriented towards the direction of wound closure (Figure 6D–E). Temporal analysis of the microtubule network polarization after scratching in control conditions showed a build-up of preferential orientation of the network towards the wound edge over 30 minutes and persistence afterwards, whereas under vimentin knockdown the microtubule network remained randomly oriented (Figure 6F, Movies S13–14). Finally, hallmarks of cell polarization, i.e. the position of Golgi and MTOC relative to the nucleus were significantly disrupted in vimentin knockdown cells (Figure 6G–H). Some evidence suggests that VIF also play a role in adhesion organization (Menko et al., 2014). Thus, we considered the possibility that the defects in microtubule orientation in vimentin knockdown cells could be related to shifts in the distribution of adhesions. However, high-resolution imaging of the canonical adhesion marker paxillin did not display profound effects on focal adhesions upon loss of vimentin (Figure S8E). Therefore, we conclude that the templating of microtubules by VIF is central in VIF’s role as a promoter of directed migration.
DISCUSSION
Although diverse roles for vimentin in migration have been proposed (Havel et al., 2014; Helfand et al., 2011; Liu et al., 2015; Lowery et al., 2015; Mendez et al., 2010; Menko et al., 2014; Nieminen et al., 2006; Schoumacher et al., 2010), a systematic and quantitative analysis of VIF organization and dynamics in the context of cell migration has been lacking. Here, we establish, by high-resolution, multi-spectral live-cell imaging of genome edited cells expressing endogenous levels of fluorescent vimentin and α-tubulin, that VIF promotes directed cell migration as a polarity maintenance factor. In this context, VIF templates future microtubule networks along those that were polarized in the recent past; this templating function is important for efficient, directional cell migration. Based on these data, we propose the following model: The basal dynamics of the microtubule network is too fast to maintain cell polarity and migration directionality on a time scale that is optimal for directed migration. Therefore, the VIF network serves as a second structure to increase the persistence of microtubule-mediated cellular polarity by constraining the growth and shrinkage of microtubules to an oriented template, which enhances overall the migration efficiency. At the core of this model is a mutually re-enforcing feedback between microtubules and VIF that has the net effect of stabilizing the polarized organization of both networks (Figure 6I): VIFs assemble by aggregation of filament precursors and along microtubules to form an ultrastructural copy of the polarized microtubule network with nearly tenfold slower turnover. The presence of this copy both reduces the rate of microtubule disassembly and guides microtubule regrowth. However, strong enough signaling cues promoting microtubule reorganization can still overcome the VIF-based constraints. Because of the dependence of VIF assembly on the microtubule structure, such cues also lead to a reorganization of the VIF structure. Moreover, it is possible that cues which reorganize microtubules, may transiently destabilize VIF to lower the structural constraints imposed by VIF’s templating function (Helfand et al., 2011).
It is likely that VIF templates do not act alone. Other proteins have been proposed to guide microtubule organization, such as long-lived F-actin structures like stress fibers. Stress fibers interact with microtubules through mammalian spectraplakin ACF-7 and targets microtubules to focal adhesions, thus triggering focal adhesion disassembly and promoting keratinocyte migration (Wu et al., 2008). Similarly, in neuronal growth cones, actin arcs can guide the assembly and transport of microtubules (Schaefer et al., 2002). Reciprocally, growing microtubules can transport, stretch and bundle individual actin filaments, thereby regulating actin filament organization (Preciado Lopez et al., 2014); and during epithelial monolayer formation, filamentous septins associate with microtubules and guide the directionality of microtubule plus end movement by suppressing microtubule catastrophe. This navigation mechanism is essential for the apicobasal positioning of microtubules (Bowen et al., 2011). Our study adds one more guidance cue to microtubule organization with significant effects on cell-scale polarity and migration.
In adult organisms, vimentin expression is restricted to mesenchymal cells (Chang and Goldman, 2004; Herrmann et al., 2007). Following tissue injury and during epithelial to mesenchymal transitions (EMT), vimentin is strongly up-regulated (Mendez et al., 2010). In epithelial cancers, the onset of vimentin expression is a clinical marker for poor prognosis and increased metastasis (Dauphin et al., 2013; Havel et al., 2014; Kidd et al., 2014; Satelli and Li, 2011). Intriguingly, during EMT, when vimentin expression is systematically upregulated, cells transform from a state, in which polarity is primarily defined by tissue context to a state where polarity must be defined at the level of individual cells. It is therefore tempting to speculate that VIF function as a ‘polarity factor on demand’ to compensate for the loss of contextual polarity in mesenchymal cells. In a similar manner, vimentin up-regulation in cancer cells may be elicited to support polarity and thus enhance the efficiency of invasion by collective and single cell migration.
METHODS AND RESOURCES
Contact for reagent and resource sharing
Further information and requests for regents may be directed to, and will be fulfilled by the corresponding author Gaudenz Danuser (gaudenz.danuser@utsouthwetern.edu).
Experimental model details
Genome editing of mEmerald-vimentin and mTagRFPt-tubulin
Transcription Activator-Like Effector Nucleases (TALENs) assembly
We tagged both vimentin and alpha-tubulin with fluorescent proteins to simultaneously visualize intermediate filaments and microtubules in live cells. For vimentin the N-terminal addition of EGFP or mEmerald had previously been shown to yield functional fusion proteins (Helfand et al., 2011; Yoon et al., 1998); and α-tubulin was successfully labeled by N-terminal fusion of various fluorescent proteins in a variety of mammalian cells (reviewed here (Goodson et al., 2010)). To stably express the fusion proteins and to avoid artefacts from over-expression we chose to use a TALEN based genome editing approach to label the endogenous proteins. The target site selection and the assembly of transcription activator-like effectors Nucleases (TALENs) were described earlier (Cermak et al., 2011). In brief, optimal TALEN target sites were selected with the TAL Effector Nucleotide Targeter software (https://tale-nt.cac.cornell.edu/) such that the expected, induced DNA double strand breaks were located within about 60 nucleotides from the insertion site for the additional DNA coding for mEmerald (Tsien, 1998) and mTagRFPt (Shaner et al., 2008). Moreover, preferred TALEN sites had a T at the −1 position and were spaced by 13 or 25 nucleotides for VIM and TUBA1B, respectively (Cermak et al., 2011; Christian et al., 2012) (for more details on TALEN design see supplementary table S2 and supplementary Figure S1C–D. The TALEN fusions were assembled with the Golden-Gate method based on a library of four different “repeat variable di-residues” (RVDs, NI, HD, NN, NG) (Cermak et al., 2011). In the first step, RVDs were released with a BsaI digest that generated unique 4nt overhangs that allowed the assembly of arrays with T4 ligase (enzymes from New England Biolabs, Ipswich, MA). Sub-arrays of 10 or less RVDs were assembled, where the first 10 RVDs were ligated into pFUS_A and the remaining RVDs, except the last RVD, were ligated into pFUS_B vectors that were specific for the length of the array. In the second Golden Gate assembly step the subarrays were released with Esp3I and ligated together with the last RVD into the truncated TALEN backbone NΔ152/C+18 pCGS652, a derivative of pC-GoldyTALEN (Carlson et al., 2012; Christian et al., 2012) that fused RVD arrays with the Fok1 nuclease. The resulting arrays were analyzed by restriction digest and sequencing and deposited at Addgene (Cambridge, MA, pCGS652 ID#: 62220, TALENs targeting VIM and TUBA1B #62852–62855).
Donor vector assembly
Donor vectors were assembled from two approximately 800bp long homology regions and the fragments coding the fluorescent proteins mEmerald (Tsien, 1998) and mTagRFPt (Shaner et al., 2008) for VIM and TUBA1B, respectively (Figure S1C–D). Bacterial artificial chromosomes (BACs), clone RP11-315P19 for VIM and clone RP11-437A15 for TUBA1B, (BACPAC Resources Center at Children’s Hospital Oakland Research Institute, Oakland, CA) were used to amplify the homology regions. For the mEmerald-VIM donor vector, in a first step the fragment downstream the start codon of VIM was amplified with primers VIM-f and VIM-r (for primer sequences see supplementary table S1), digested with HindIII and XbaI (New England Biolabs) and ligated into pBluescript KS plus (pBS, Agilent, Santa Clara, CA). To mutagenize both TALEN binding sites two rounds of site directed mutagenesis were performed with the primer pairs VIM-L-mut-f/VIM-L-mut-r and VIM-R-mut-f/VIM-R-mut-r, using Pfu Ultra II Fusion HS (Agilent) DNA polymerase. The resulting construct was verified by sequencing. To assemble the donor vector from three overlapping fragments the primer pair VIM-U-f/VIM-U-r was used to amplify the fragment upstream the start codon of VIM. In addition, the primer VIM-D-f introduced a six amino acid GGSGGS linker between mEmerald and Vimentin. The primers VIM-D-f/VIM-D-r were used to amplify the fragment downstream of the start codon from the mutagenized pBS template; and the mEmerald fragment was amplified by PCR without introducing additional overhangs. The primers VIM-U-f/VIM-D-r overlapped with yeast-Ecoli shuttle vector pRS424 (Sikorski and Hieter, 1989). The PCR products were purified from agarose gels and transformed into YPH500 yeast cells (Cermak et al., 2011) together with KpnI linearized pRS424 vector. Cells were grown on selecting plates lacking tryptophan. After two days cells were harvested, plasmids were extracted with Zymoprep miniprep kit (Zymo, Irvien, CA) according to manufacturer’s instructions, transformed into Ecoli DH5alpha (New England Biolabs) and plated on ampicillin selective plates and grown overnight. Single clones were grown, plasmids extracted, analyzed by restriction digest and clones containing the full length insert were sequenced. For the mTagRFPt-TUBA1B donor vector the primer pair TUBA1B-U-f/TUBA1B-U-r was used to amplify a region upstream the second codon, primers mTagRFPt-f/mTagRFPt-r were used to amplify mTagRFPt and primer pair TUBA1B-D-f/TUBA1B-D-r was used to amplify the region downstream the second codon of TUBA1B. The primers TUBA1B-D-f/mTagRFPt-r introduced a six amino acid GGSGGS linker between mTagRFPt and TUBA1B. The donor vector was assembled and analyzed as described above for mEmerald-VIM donor vector. The TALEN expression plasmids and donor vectors were deposited at Addgene (IDs# 62849 & 62850,).
Cells
The hTERT immortalized human Retinal Pigment Epithelial cells (hTERT-RPE-1) were obtained from ATCC (Manassas, VA) and grown in DMEM/F12, 1:1,(Gibco, Life Technologies) medium supplemented with 10% fetal bovine serum(Gibco), penicillin/streptomycin(Gibco) and 0.01mg/ml hygromycin-B (Sigma, St. Louis MO).
Genome editing
The two loci VIM and TUBA1B were edited sequentially in hTERT-RPE-1 cells. In a first step the mEmerald sequence was introduced at the start codon of the VIM gene and clonal cell populations were grown and validated. In a second step, in one clone expressing the fusion protein mEmerald-vimentin the mTagRFPt sequence was introduced after the second codon of the TUBA1B gene. For genome editing, cells were transfected with the TALEN and donor vector plasmids with the NEON electroporation system (Life Technologies) at 1400V with two pulses of 20ms, seeded into 10cm dishes in full medium and expanded for 5–7 days. Cells were washed with PBS, trypsinized, collected in full medium and washed twice with PBS, analyzed on a FACSaria sorter (BD, Franklin Lakes, NJ) for mEmerald or mTagRFPt fluorescence and single fluorescent cells were sorted into 96 well plates in full DMEM/F12 medium containing 10mM HEPES (Gibco). Individual clones were expanded, analyzed by spinning disc confocal microscopy (Nikon, Nikon Imaging Center at Harvard Medical School, Boston, MA) for mEmerald-Vimentin or mTagRFPt-TUBA1B expression patterns. Clones expressing the fusion proteins were further validated by western blot, PCR and sequencing as described below.
Validation and quantification of fusion protein expression by Western blotting
To validate individual clones expressing the fluorescent fusion proteins, we analyzed cells by western blotting, PCR and sequencing. The edited hTERT-RPE-1 cells were grown to 80% confluency, washed twice with PBS, lysed with SDS-buffer (100mM Tris/HCl pH 7.5 1% SDS) that was pre-heated to 95°C. Lysates were collected, the genomic DNA was sheared by pipetting the lysate through a 27G needle. Lysates were spun at maximum speed for 10 minutes at 4°C in a table top centrifuge and the supernatant was collected. Lysates were heated to 95°C for 5 minutes in sample buffer (75mM Tris pH 6.8, 2% SDS, 10% glycerol, 0.01% bromophenol blue, and fresh 1.25% 2-mercaptoethanol and 50mM dithiothreithol). Proteins were separated on 4–20% gradient poly-acrylamide gels (Bio-rad, Hercules, CA) in tris-glycine running buffer (Tris, Glycine, 0.1% SDS). The pre-stained Precision Plus (Bio-rad) and PageRuler (Thermo Scientific) molecular weight markers were used to estimate protein size. Proteins were transferred to PVDF membranes (0.45μm pore size, Millipore, Bedford, MA) at 250 mAmp for 1h at 4°C in transfer buffer with SDS (39mM glycine, 48mM Tris, 1.5mM SDS, 20% methanol) with a wet transfer system (Bio-Rad). Membranes were incubated in Tris Buffered Saline with Tween (TBST, 50mM Tris, 150mM NaCl, pH 7.5, 0.1% Tween-20) blocking solution containing 10% non-fat milk, for one hour at room temperature. Membranes were probed with 1:1000 diluted primary antibodies in 5% milk/TBST over night at 4°C. Mouse anti-Vimentin (clone V9, Sigma), rabbit anti-Vimentin against a C-terminal peptide (C-20, Santa Cruz Biotechnology, Santa Cruz, CA), mouse anti-α-tubulin (GT114, Genetex, Irvine, CA), rabbit anti-α-tubulin (Abcam, ab18251, Cambridge, UK), mouse anti-GFP (mix of clone 7.1 and 13.1, Roche, Basel, Switzerland), mouse anti-RFP (RF5R, Thermo Fisher, Waltham, MA), mouse anti-GAPDH (GT239, Genetex), mouse anti-β-actin (AC-15, Sigma), rabbit anti-GAPDH (GTX100118, Genetex) antibodies were used. After three washes with TBST the membranes were incubated with secondary horse anti-mouse HRP-conjugated (Vector Lab, Burlingame, CA) antibodies diluted 1:1000 in TBST containing 5% milk, incubated for one hour at room temperature and washed three times with TBST. The ECL Super-Signal West Pico substrate (Thermo Fisher), incubated for 5 minutes at room temperature and imaged in a Versadoc-4000-MP imager (Bio-Rad), see supplementary Figure S2E. Images were analyzed with ImageJ (NIH, Bethesda, MD). In the western blot with the Genetex antibody against α-tubulin (Figure S2E) we observed a ~30kD fragment, indicating that the fusion protein was subject to proteolysis. For the quantitation of vimentin and α-tubulin protein amount in parental and edited hTERT-RPE-1 cells, lysates were obtained as described above and serially diluted two fold for nine times (Figure S3). For the vimentin and α-tubulin western blotting, the dilutions three to nine and one to six were used, respectively. Samples were run, blotted, blocked and probed as described above for vimentin and α-tubulin. Anti GAPDH or actin antibodies were used on the same blots to obtain loading references. The PVDF membranes were washed and probed with conjugated anti mouse-DyLight800 and anti rabbit-DyLight680 antibodies (Cell Signaling Technology, Beverly, MA) in Odyssey blocking buffer (Li-Cor Biosciences, Lincoln, NE). Membranes were washed as described above and scanned on a Li-Cor infrared imaging system (Li-Cor). The band intensities were analyzed with Image Studio Light 4.0 software (Li-Cor) and plotted in Excel. Intensity values in the linear range of the readout were normalized with the results from the actin or GAPDH loading controls of the same blot. Compared to the parental cell line, in the edited cells vimentin and α-tubulin expression were 86+/− 10% (mean +/−STD, N=5 blots, two different anti vimentin antibodies, two different lysates) and 104+/−18% (N= 6 blots, two different anti α-tubulin antibodies, two different lysates) respectively. In the edited cell line, 8+/−4% vimentin and 5+/−2% tubulin were tagged. This could indicate that the fusion proteins are repressed or less stable and subject to proteolytic degradation. The high STDs reflect the combined variation between lysates, blots and between the different antibodies.
Genomic DNA extraction, PCR and sequencing
To extract genomic DNA, hTERT-RPE-1 cells were washed twice with PBS, collected with a cell scraper, centrifuged at 1000rpm for two minutes at 4°C and the pellet was resuspended in lysis buffer (10mM Tris, pH 8.0, 0.1%SDS, 1mM EDTA) containing 0.06mg/ml Proteinase K (Bio Basic, Amherst, NY) and incubated for 3 hours at 55°C. RNA was digested with 0.012mg/ml DNAse free RNase (Life Technologies) for one hour at 37°C. Proteins were precipitated with potassium acetate solution (3M potassium, 5M acetate) and pelleted at full speed for three minutes at 4°C in a table top centrifuge. The supernatant was recovered and DNA was precipitated with ice cold isopropanol (Sigma) and pelleted at full speed for 30 seconds at 4°C. The resulting pellet was washed twice with 70% ethanol, dried and resuspended in TE buffer (10mM Tris pH 7.6, 0.1mM EDTA). The DNA concentration was measured with Nanodrop 2000c spectrophotometer (Thermo Fisher) and 50ng of DNA was used for PCR reactions (PFU Ultra II Fusion HS, Agilent). The primer pairs VIM-seq-f/VIM-seq-r and TUBA1B-seq-f/TUBA1B-seq-r were used to amplify the region around the start codon of VIM and TUBA1B, respectively. Products were separated on 1% agarose gels in TAE buffer (1mM EDTA, 40mM Tris, 20mM acetic acid) containing Gel Red nucleic acid stain (Biotium, Heyward, CA) (Figure S2A–D). The 500bp–10kb molecular weight marker was used to estimate the size of the fragments (Bio Basic). The gels were imaged in a Versadoc-4000-MP imager (Bio-Rad) and images were analyzed with ImageJ. The PCR products were extracted from the gel using standard kits (Bio Basic) and sequenced from the flanking primers used for the PCR reactions. The sequencing results were displayed with Chromas Lite software (Technelysium, South Brisbane, Australia).
shRNA construct
Human vimentin expression was inhibited using the following target sequence shRNA-VIM 5′-ACGTACGTCAGCAATATGA-3′ and scrambled control shRNA expression vector shRNA-Scr 5′-ATGTACTGCGCGTGGAGA-3′ sequence. The loop sequence between the sense and antisense sequences is 5′-TTCAAGAGA-3′. These sequences were cloned into pSilencer 5.1 H1- retroviral vector (Life Technologies) and viruses were produced per manufacturer’s instructions. The double genome edited hTERT-RPE-1 cells were infected in the presence of 4μg/ml hexadimethrine bromide (polybrene, Sigma) and selected with 2μg/ml puromycin (Sigma). To quantify the knockdown efficiency two fold dilution series of cell lysates were analyzed by Li-Cor infrared western blotting with mouse anti-vimentin (V9, Sigma), rabbit anti-GAPDH (GTX100118, Genetex) (see above) and images of the blots were analyzed with Image Studio Light 4.0 software (Li-Cor) as described above. Expression of shRNA-VIM reduced the vimentin protein level by 69+/−10% (mean, STD, N=4 blots) compared to cells expressing scrambled control shRNA-Scr (Figure S3E–F).
Method details
Experimental design
All microscopy experiments were performed at least 3 times on different days. Experimental consistence among different days was verified. During experiments and image analyses, cells with abnormal shapes, sizes or expression levels were excluded and separate batches of cells from one experiment were randomly selected. Final results rely on pooled data from all days.
Live cell imaging
Phase contrast imaging experiments
For nocodazole incubation experiments, cells were incubated with 250 ng/mL (830 nM) nocodazole (Sigma) in DMEM/F12 medium for 20 minutes before scratching. Nocodazole was dissolved in DMSO as 830 μM stock and kept at −20 °C until use. For mEmerald-Vimentin overexpression experiment, parental hTERT-RPE-1 cells were transiently transfected with the mEmerald-vimentin plasmid (Helfand et al., 2011) using Lipofectamin 2000 (Life Technologies). Transfection was done according to the manufacturer’s manual. 4 hours later, cells were trypsinized and re-seeded into MatTek plates (P12G-0-10-F) coated with 5 μg/mL Fibronectin for 1 hour at room temperature. Cells were incubated overnight to allow them to adhere and form monolayers. Monolayers were scratched with a pipette tip and filmed immediately.
For the single cell migration control experiment (Figure S8C–D), hTERT-RPE mEmerald-Vimentin/TUBA1B-mTagRFP cells expressing shRNA-VIM or control shRNA-Scr were plated into 12 well glass bottom MatTek plates (P12G-0-10-F) coated with 5 μg/mL Fibronectin for 1 hour and immediately filmed for 5 hours at a frame rate of 1 frame per minute.
Microtubule disassembly experiments
hTERT-RPE-1 mEmerald-vimentin/mTagRFPt-α-tubulin cells were plated with DMEM/F12 medium into Fn-coated 35 mm MatTek dishes (P35G-0-10-c). Cells were incubated overnight to allow them to adhere and form monolayers. Monolayers were scratched with a pipette tip and incubated with 250 ng/mL nocodazole in DMEM/F12 medium. Filming started immediately (~1 min) after nocodazole addition.
Microtubule recovery experiments
hTERT-RPE-1 mEmerald-vimentin/mTagRFPt-α-tubulin cell monolayers were scratched with a pipette tip and incubated with 250 ng/mL nocodazole for 20 minutes. Cells were washed with DMEM/F12 medium and filming started immediately (~1 min) after drug wash-out.
Microtubule self-similarity experiments
hTERT-RPE-1 mEmerald-vimentin/mTagRFPt-α-tubulin cells expressing shRNA-VIM or control shRNA-Scr were plated with DMEM/F12 medium into Fn-coated MatTek 12 well glass bottom plates (P12G-0-10-F). Cells were incubated with 1 μg/mL nocodazole for 3 minutes then carefully washed during filming. Filming was continued for another 15 minutes after washing.
Microtubule orientation experiments
hTERT-RPE-1 mEmerald-vimentin/mTagRFPt-α-tubulin cells expressing shRNA-VIM or control shRNA-Scr were plated with DMEM/F12 medium into Fn-coated MatTek dishes as described above. Cells were incubated overnight to allow them to adhere and form monolayers. Monolayers were scratched with a pipette tip to form a wound. Filming started immediately (~1 min) after scratching.
EB1 trajectory experiments
The mTagRFP-T-EB1-C-18 plasmid was a gift from Michael Davidson (Addgene plasmid # 58011) hTERT-RPE-1 mEmerald-vimentin cells were transfected with 1 μg/mL mTagRFP-EB1. 12 hours after transfection, monolayers were scratched with a pipette tip to form a wound. Filming started 6 hours after scratching.
Phase contrast imaging
Parental hTERT-RPE-1 cells, hTERT-RPE-1 mEmerald-vimentin/mTagRFPt-α-tubulin genome edited cells, hTERT-RPE-1 mEmerald-vimentin/mTagRFPt-α-tubulin cells expressing shRNA-VIM or control shRNA-Scr were plated with DMEM/F12 medium into MatTek (Ashland, MA) 35 mm glass-bottom dishes (P35G-0-20-C) or 12 well glass bottom MatTek plates (P12G-0-10-F) that were coated with 5 μg/mL Fibronectin for 1 hour at room temperature. Cells were incubated overnight to allow them to adhere and form monolayers. Monolayers were scratched with a pipette tip. Wound closure was monitored by phase contrast imaging using a Nikon Eclipse Ti microscope, equipped with 10×/0.25 N.A. Ph1 ADL objective and a Andor Zyla sCMOS camera (6.5 μm pixel size), and controlled by μManager software. Images were collected for 5 hours at a frame rate of 1 frame per minute. During acquisition, cells were kept in an onboard environmental chamber at controlled temperature (37 °C), humidity, CO2 (5%), and O2 (20%).
High-resolution live cell imaging
Time lapse image sequences were collected with an Andor Revolution XD spinning disk microscope mounted on a Nikon Eclipse Ti stand equipped with Perfect Focus, a Nikon Apo 60× 1.49 N.A. oil objective and a 1.5× optovar for further magnification. Images were recorded with an Andor IXON Ultra EMCCD camera with 16 μm pixel size. Given the 90× total magnification, this resulted in a pixel size of 178 nm in object space. A 488 nm and 561 nm lasers were used for exciting mEmerald and mTagRFPt, respectively. The output powers of the 488 nm and 561 nm lasers were set to 10% and 20% of the maximal output (37 mW and 23 mW, respectively). The exposure time was 300 ms per frame for both channels and images were collected at a frame rate of 1 frame per minute for microtubule orientation experiments, 12 frames per minute for microtubule disassembly/recovery experiments and 30 frames per minute for the EB1 trajectory experiments. Experiments lasted between 20 and 60 minutes. During acquisition, cells were kept in an onboard environmental control chamber as described above.
Fixed cell imaging
Fixation and staining
For Golgi and γ-tubulin staining experiments, hTERT-RPE-1 mEmerald-vimentin/mTagRFPt-α-tubulin cells expressing shRNA-VIM or control shRNA Scr were plated with DMEM/F12 medium into Ibidi dishes (Verona, WI) that were coated with 10 μg/mL Fibronectin for 1 h. Cells were incubated overnight to allow them to adhere and form monolayers. Monolayers were scratched to form a wound by making an “X” on the bottom of the Ibidi dish. The wounds were allowed to heal for 30 minutes before fixing with 4% PFA for 10 minutes at room temperature and permeabilizing with 0.5% TX-100 for 10 minutes. The samples were blocked with 5% BSA for 30 minutes at room temperature and stained with primary antibodies rabbit anti γ-tubulin (Abcam ab16504, 1:500, Cambridge, UK) or anti-GM130 (Abcam ab52649, 1:500) in 5% BSA overnight at 4°C. Primary antibodies were detected with secondary anti rabbit antibody that is conjugated with Alexa Fluor 647 (Life Technologies) in 5% BSA for 1 hour at room temperature (1:500).
For paxillin staining experiments, hTERT-RPE-1 mEmerald-vimentin/mTagRFPt-α-tubulin cells expressing shRNA-VIM or control shRNA Scr were plated with DMEM/F12 medium into MatTek dishes that were coated with 5 μg/mL Fibronectin for 1 h. Cells were incubated overnight to allow them to adhere and form monolayers. Monolayers were scratched with a pipette tip. The wounds were allowed to heal for 6 hours before fixed with 2% PFA+0.5% Triton X-100 for 2 minutes and 4% PFA for another 30 minutes at 37 °C. The samples were blocked with Q“quenching”-PBS (225 ml PBS, 22.5 mg Saponin, 4,5 g BSA, 225 mg lysine; pH 7,4) for 30 minutes at room temperature and stained with primary rabbit anti paxillin antibody (Abcam ab32084, 1:500) in Q-PBS for 1 hour at room temperature. The primary antibody was detected with secondary anti rabbit antibody that is conjugated with Alexa Fluor 647 (Life Technologies, 1:500) in Q-PBS for 1 hour at room temperature.
For experiments probing the role of VIF-based templating of microtubules in MCF-7 epithelial cells (vimentin-free at parental state), cells were plated with EMEM medium (ATCC, Manassas, VA) into MatTek dishes that were coated with 5 μg/mL Fibronectin for 1 h and transiently transfected with the mEmerald-vimentin plasmid using Lipofectamin 2000. Transfection was done according to the manufacturer’s manual. Cells were incubated overnight and then fixed with 2% PFA+0.5% Triton X-100 for 2 minutes and 4% PFA for another 30 minutes at 37 °C. The samples were blocked with Q“quenching”-PBS (225 ml PBS, 22.5 mg Saponin, 4,5 g BSA, 225 mg lysine; pH 7,4) for 30 minutes at room temperature and stained with primary mouse anti tubulin antibody (Genetex GTX628802, Irvine, CA, 1:500) in Q-PBS for 1 hour at room temperature. The primary antibody was detected with secondary goat anti mouse antibody that is conjugated with Alexa Fluor 568 (Life Technologies, 1:500) in Q-PBS for 1 hour at room temperature.
Wound healing experiments
hTERT-RPE-1 mEmerald-vimentin/mTagRFPt-α-tubulin cells expressing shRNA-VIM or control shRNA-Scr were plated into Ibidi dishes coated with 10μg/mL fibronectin. Cells were incubated overnight to allow them to adhere and form monolayers. The monolayers were scratched by making an “X” on the bottom of the Ibidi dish. Six hours after scratching, cells were washed briefly with 1x PBS w/Ca2+/Mg2+ and fixed with methanol at −20°C for 15 minutes.
Wound layer experiments
hTERT-RPE-1 mEmerald-vimentin/mTagRFPt-α-tubulin cells expressing shRNA-VIM or control shRNA Scr were plated into Ibidi dishes coated with 10μg/mL fibronectin. Cells were incubated overnight to allow them to adhere and form monolayers. The monolayers were scratched by making an “X” on the bottom of the Ibidi dish. Cells were incubated for 6 hours, washed briefly with 1× PBS w/Ca2+/Mg2+ and fixed with methanol at −20°C for 15 minutes.
Fixed cell imaging
Cells were imaged at the wound edge, one layer and/or two layers in from the wound edge. Images were collected in 8 different locations around the wound in each dish using a Nikon Eclipse Ti microscope, equipped with a Plan Apo 20x/0.75 objective, a Plan Fluor 20x/0.5 N.A. objective or a Nikon Plan Apo Lambda 100x/1.45 N.A. objective. Images were recorded with a Hamamatsu ORCA-AG cooled CCD camera or a Hamamatsu ORCA Flash 4.0 with 6.45 μm pixel size. All microscope components were controlled by Metamorph or Micro-manager software.
Super-resolution imaging
hTERT-RPE-1 mEmerald-vimentin/mTagRFPt-α-tubulin cells were plated in DMEM/F12 medium onto fibronectin-coated coverslips (5μg/ml) and grown overnight to allow them to adhere and form monolayers. Monolayers were scratched with a pipette tip. 6 hours later, cells were incubated with 250 ng/mL nocodazole in DMEM/F12 medium for 20 minutes, rapidly rinsed in PBS and fixed at 20°C for 10 min in ice-cold methanol at various time points. After fixation, cells were washed with PBS and mounted for observation using ProLong® Diamond Antifade Mountant (Thermo Scientific) or incubated with rat anti–α-tubulin antibody (Sigma-Aldrich) for 1 hour at room temperature in a moist chamber, washed with PBS-Tween, and then incubated with the secondary antibody conjugated with Alexa-Fluor 568 (Life Technologies) for 45 min at room temperature and then mounted for observation. Cells were imaged using the Nikon N-SIM Structured Illumination Super Resolution Microscope (Nikon) with oil immersion objective lenses [CFI Apochromat TIRF 100x oil (NA 1.49)].
Quantification and statistical analysis
Image analysis
Filament Network Reconstruction
Given the microscopy images obtained from live and fixed cell experiments, we aimed at quantifying the properties of the cytoskeleton network organization. The first and essential task was to accurately reconstruct the filament networks. The task was complicated by the high variability of intensity among different filaments or even along the same filaments. We developed a filament reconstruction algorithm with structure-guided hysteresis thresholding, for robust selection of bona fide filaments (Ding and Danuser, 2015). The flow of the algorithm is shown in Figure S4A–D. In the first step, multiple-scale steerable filtering was employed to the images to boost the curvilinear features, and based on the boosted features, the centerlines of possible filament fragments were detected. In the second step, the filament fragments are clustered into high and low confidence sets. In the third and final step, iterative graph matching is used to connect fragments into complete filaments. This includes the rescue of low confidence filament fragments that are structurally well linked to high confident fragments. The output of the reconstruction is a network of filaments each presented by an ordered chain of pixels and the local filament orientation.
Network similarity
The structural similarity of two reconstructed networks provides insight of their level of association and interaction. The similarity was calculated based on the distance and orientation of individual filament pixels in the two networks. First, we defined the local proximity measure: For each pixel in network 1, the closest pixel in network 2 was identified. If the distance between the two pixels was less than a threshold r (set to 15 pixels in the present analysis), the pixel pair was entered into the distance map D1→2. For each pixel in network 2, the closest pixel in network 1 was identified and recorded in the same way into the distance map D2→1. The two discrete distance maps were then spatially smoothed by a Gaussian filter using a variance of . This choice of σG defines a filter kernel that mostly covers the neighborhood of radius r. Second, we defined the local alignment measure: For each pixel in network 1, the filament orientation difference between this pixel and its corresponding closest pixel in network 2 was calculated and recorded in the angle map A1→2. Analogously, for each pixel in network 2 an angle map A2→1 was recorded based on the filament orientation difference to the closest pixel in network 1. The two maps were also smoothed by the Gaussian filter defined above for the distance map.
Based on the two filtered distance maps, and , and the two filtered angle maps and the similarity score was defined by the multiplication, i.e. the quadratic geometric mean, of the proximity score
and the alignment score
The relative contributions of the two scores were controlled by the ratio σD2/σA2. For all experiments we set and . Here σD was set to be slightly smaller than r/2, so that the score decreases to 0 at around 2σD at the boundary of the neighborhood of radius r; σA was set to be slightly smaller than π/3, which is considered a typical human visual upper bound for orientation alignment. Note that the values of parameters r, σG, σD, σA are not critical for comparative similarity analysis as shown in Fig S10.
The final similarity score S = SDSA is 1 for identical networks and monotonically decreases to 0 with increasing local differences between the networks. The procedure for local network similarity calculation is illustrated in Figure S4E. Importantly, both proximity and alignment scores are essential to determine the similarity of two networks. The proximity score measures the co-localization of filaments in the two networks. The alignment score measures the orientation consistency and structure resemblance of two networks. To have a high similarity score both proximity and alignment scores must be high. This is illustrated with two examples in Figure S4F–G, where low similarity scores are associated once with missing alignment, despite good co-localization; and once with insufficient co-localization, despite good alignment.
Network density correlation
As an alternative approach to studying the co-localization of two filament networks, we also defined the network density correlation. For each filament network, the local filament density of a given pixel is defined by the fraction of pixels in a given neighborhood covered by reconstructed filaments. Given two networks, all samples of local filament density within a common region-of-interest (ROI) are collected in two corresponding sets of density samples. The correlation of these two sets of samples determined the resulting network density correlation value (Figure S5A–E). To test significance of the correlation value between two true networks a control experiment, in which one of the two networks was numerically scrambled. In the scrambling process, every filament in the network is rotated around its centroid by a random angle; if a rotated filament sticks outside the ROI, the filament fragment outside will be cropped and shifted to a random location inside the ROI. This process is iterated until all filament fragments are contained in the ROI. While this approach maintains the global density of filaments it eliminates co-localization, as illustrated in Figure S5F–H.
Wound healing velocity measurements in phase contrast time-lapse sequences
Velocity fields were computed using custom-written cross correlation-based software on phase-contrast images (Zaritsky et al., 2012). Local-motion was estimated for all image-patches (of size 30 × 30 pixels each, or 20 μm × 20 μm) by searching for maximal cross-correlation of a given patch in the subsequent frame. Maximal search radius was defined by a maximal speed of 30 um hour−1.
Speed and directionality analysis during wound healing
Every local motion vector was decomposed into a component perpendicular and a component parallel to the wound edge. The speed was defined as the magnitude of the local motion vector. The directionality was defined as the absolute value of the ratio between the two components (Zaritsky et al., 2014). Higher values reflect a local motion towards the wound edge while smaller values denote significant sideways motion.
Kymographs
The spatiotemporal behavior of the wound healing response was captured by kymographs that depicted the speed and directionality as a function of the distance to the wound edge and of time. The wound edge position was computed in every time point of a phase contrast movie by applying MultiCellSeg (Zaritsky et al., 2011). Subsequently, pixels within the migrating sheet were binned into bands of 20 microns width relative to the wound edge, and median values of speed/directionality of all pixels in a particular band were assigned to the corresponding bin.
EB1 particle tracking
The trajectories of EB1 comets were tracked using the plusTipTracker, a Matlab-based open source software package for analyzing fluorescently-labeled microtubule plus end binding proteins (Applegate et al., 2011; Matov et al., 2011).
Statistics
Filament orientation analysis
Each pixel on a reconstructed filament is attributed with a measurement of the local filament orientation derived from the steerable filter response. The orientation values along reconstructed filaments in cell areas were plotted in a histogram. Histogram peaks indicated directions of preferential filament orientation in the particular ROI. To quantify the level of filament alignment about these directions the circular standard deviation of the orientation values were calculated.
Filament length analysis
The total vimentin and microtubule filament lengths in the cell areas in microtubule disassembly and recovery experiments were calculated and plotted over time.
Network similarity analysis
The network similarity analysis defines a score value for each pixel within the footprint of the analyzed cells. The analysis of variance of similarity scores in the cell region for cells at the front, the second and third layer of the wound was performed to assess the dependence of network similarities on the position of cells within the sheet.
Microtubule disassembly analysis
The VIF-microtubule cross-similarity scores and the microtubule network self-similarity at different time points after nocodazole addition (inversely proportional to microtubule disassembly dynamics) were calculated. The scatter plot of VIF-microtubule cross-similarity vs. microtubule self-similarity over a time span of 1 minute for all pixels belonging to reconstructed microtubules inside the cell areas shows a putatively positive correlation, suggesting that microtubules in regions with higher VIF-microtubule cross-similarity disassembled slower (higher self-similarity). To statistically verify this noisy correlation, 10 pixels were randomly sampled from the pixel pool and a linear regression was performed for the corresponding cross- and self-similarity values. The random sampling and linear regression was repeated 1000 times to generate a distribution of slopes describing the correlation of the two variables. The skew of this distribution towards positive or negative values indicated a positive or negative correlation between cross- and self-similarity. To determine the significance of the skew the distribution was compared to the distribution of slopes derived from regression of 10 independently sampled cross-similarity vs. self-similarity pairings (scrambled sampling) using the Kolmogorov–Smirnov test.
Microtubule recovery analysis
The VIF-microtubule similarity scores and the microtubule network self-similarity at different time points after nocodazole wash-out (inversely proportional to microtubule assembly dynamics) were calculated. A scatter plot of VIF-microtubule cross-similarity vs. microtubule self-similarity for all pixels belonging to reconstructed microtubules shows a possibly negative correlation, suggesting that microtubules in regions with higher similarity were growing faster (lower self-similarity). Statistical verification of this noisy correlation was performed as described for the microtubule disassembly analysis described above.
Cell polarization analysis
For Golgi and MTOC staining data, the centers of the nucleus and Golgi or MTOC was manually determined. A line perpendicular to the wound that passes through the nucleus center was drawn. The angle between this line and a line that connects nucleus center to Golgi or MTOC was measured. Thirty cells were analyzed for each condition to determine the statistical significance of the preferential alignment of Golgi and MTOC with the direction of wound closure in presence of vimentin.
Single cell tracking
Cell tracking was performed manually by a human observer unfamiliar with the underlying biological hypothesis of the difference between low and high vimentin expressing cells.
Data and software availability
Data resources
Raw image data files for the supplemental movies have been deposited in the Mendeley server (https://data.mendeley.com/datasets/xycvj95pw9/draft?a=f373835d-be67-453e-913a-a49d33d4e6d5). Other raw image data can be provided by the authors upon request.
Software
A slightly newer, upgraded version of the Filament Network Analysis Software can be downloaded at https://data.mendeley.com/datasets/dywxyj9xyz/draft?a=06981b3a-e4d4-49a3-8a21-b637cfc5d246.
Supplementary Material
Quantitative live cell imaging of genome edited cells shows that during directed cell migration vimentin intermediate filaments assemble in an ultrastructural copy of the polarized microtubule network. Since vimentin turns over slower than microtubules, it stabilizes and templates microtubule organization, thus providing persistence to existing cell polarity.
Highlights.
Genome editing to fluorescently label vimentin and β-tubulin at endogenous levels.
Quantitative live cell imaging of dynamic vimentin-microtubules interactions.
Vimentin is a template for microtubule organization.
Vimentin’s templating function stabilizes cell polarity during directed migration.
Acknowledgments
This study was supported by NIH grant P01GM096971 (G.D., R.G.), CPRIT recruitment award R1225 (G.D.) and fellowships from the Swiss National Science Foundation (C.J.B.), and the Novartis Research Foundation (C.J.B.). We thank the Live Cell Imaging Core Facility at the University of Texas Southwestern Medical Center and the Nikon Imaging Centers at Harvard Medical School and Northwestern University for help with light microscopy and we thank the Dana Farber Cancer Institute Flow Cytometry core for help with cell sorting. Research reported in this publication was supported by the National Cancer Institute of the National Institutes of Health under award number 5P30CA142543. We thank Xiao Ma, UTSW, for help with the double-blind analysis of single cell migration.
Author contributions
Z.G. performed live cell imaging experiments. C.J.B. performed the genome editing and validated cell lines. C.G.S. and D.F.V. provided reagents and consultation for TALEN design and assembly. A.M., K.S., and N.C. assisted with constructs, cell reagents, sample preparation and confocal microscopy. J.L. and R.G. performed SIM super-resolution imaging experiments. L.D. wrote the image analysis software. J.T. and G.D. conceived the project. Z.G. and A.Z. performed image analyses. Z.G., C.J.B., L.D. and G.D. discussed results and wrote the manuscript with input from all authors.
KEY RESOURCES TABLE
| Reagent or resource | Source | Identifier |
|---|---|---|
| Antibodies | ||
| Mouse monoclonal anti-vimentin | Sigma-Aldrich | V6630 |
| Rabbit anti-Vimentin against a C-terminal peptide | Santa Cruz | SC7557 |
| Mouse anti-α-tubulin | Genetex | GT114 |
| Rabbit anti-α-tubulin | Abcam | ab18251 |
| Mouse anti-GFP | Roche | 11 814 460 001 |
| Mouse anti-RFP | Thermo Fisher | RF5R |
| Mouse anti-GAPDH | Genetex | GT239 |
| Mouse anti-β-actin | Sigma-Aldrich | AC-15 |
| Rabbit anti-GAPDH | Genetex | GTX100118 |
| Rabbit anti γ-tubulin | Abcam | ab16504 |
| Rabbit anti-GM130 | Abcam | ab52649 |
| Rabbit anti paxillin antibody | Abcam | ab32084 |
| Mouse anti tubulin antibody | Genetex | GTX628802 |
| Chemicals | ||
| Nocodazole | Sigma-Aldrich | M1404 |
| Fibronectin | Sigma-Aldrich | F1141 |
| Experimental Models: Cell Lines | ||
| hTERT-RPE-1 | ATCC | CRL-4000 |
| hTERT-RPE-1 mEmerald-vimentin | This paper | C035_2G2 |
| hTERT-RPE-1 mEmerald-vimentin/mTagRFPt-α-tubulin | This paper | C043_1B7 |
| MCF-7 | ATCC | HTB-22 |
| Recombinant DNA | ||
| pRS mEmerald-VIM | This paper | Addgene: #62849 |
| pRS pRS-mTagRFP-TUBA1B | This paper | Addgene: #62850 |
| pGoldyTALEN-VIM-TAL-1 | This paper | Addgene: #62855 |
| pGoldyTALEN-VIM-TAL-2 | This paper | Addgene: #62852 |
| pGoldyTALEN-TUBA1B-TAL-1 | This paper | Addgene: #62853 |
| pGoldyTALEN-TUBA1B-TAL-2 | This paper | Addgene: #62854 |
| mEmerald-vimentin plasmid | Helfand et al., 2011 | N/A |
| pCGS652 | This paper | Addgene: #62220 |
| Golden Gate TALEN and TAL Effector Kit 2.0 | Cermak et al. 2011 | Addgene: Kit # 1000000024 |
| BAC VIM | BACPAC Resources Center at Children’s Hospital Oakland Research Institute, Oakland, CA | RP11-315P19 |
| BAC TUBA1B | BACPAC Resources Center at Children’s Hospital Oakland Research Institute, Oakland, CA | RP11-437A15 |
| Software and Algorithms | ||
| Filament Network Analysis Software 2.0 | This paper | https://data.mendeley.com/datasets/dywxyj9xyz/draft?a=06981b3a-e4d4-49a3-8a21-b637cfc5d246 |
| Deposited data | ||
| Live cell imaging raw data for vimentin/microtubules interaction | This paper | https://data.mendeley.com/datasets/xycvj95pw9/draft?a=f373835d-be67-453e-913a-a49d33d4e6d5 |
Footnotes
Publisher's Disclaimer: This is a PDF file of an unedited manuscript that has been accepted for publication. As a service to our customers we are providing this early version of the manuscript. The manuscript will undergo copyediting, typesetting, and review of the resulting proof before it is published in its final citable form. Please note that during the production process errors may be discovered which could affect the content, and all legal disclaimers that apply to the journal pertain.
SUPPLEMENTAL IMFORMATION
Supplemental Information includes eight figures, three tables and fourteen movies can be found with this article online at.
References
- Applegate KT, Besson S, Matov A, Bagonis MH, Jaqaman K, Danuser G. plusTipTracker: Quantitative image analysis software for the measurement of microtubule dynamics. J Struct Biol. 2011;176:168–184. doi: 10.1016/j.jsb.2011.07.009. [DOI] [PMC free article] [PubMed] [Google Scholar]
- Bowen JR, Hwang D, Bai X, Roy D, Spiliotis ET. Septin GTPases spatially guide microtubule organization and plus end dynamics in polarizing epithelia. The Journal of cell biology. 2011;194:187–197. doi: 10.1083/jcb.201102076. [DOI] [PMC free article] [PubMed] [Google Scholar]
- Carlson DF, Tan W, Lillico SG, Stverakova D, Proudfoot C, Christian M, Voytas DF, Long CR, Whitelaw CB, Fahrenkrug SC. Efficient TALEN-mediated gene knockout in livestock. Proceedings of the National Academy of Sciences of the United States of America. 2012;109:17382–17387. doi: 10.1073/pnas.1211446109. [DOI] [PMC free article] [PubMed] [Google Scholar]
- Cermak T, Doyle EL, Christian M, Wang L, Zhang Y, Schmidt C, Baller JA, Somia NV, Bogdanove AJ, Voytas DF. Efficient design and assembly of custom TALEN and other TAL effector-based constructs for DNA targeting. Nucleic acids research. 2011;39:e82. doi: 10.1093/nar/gkr218. [DOI] [PMC free article] [PubMed] [Google Scholar]
- Chang L, Goldman RD. Intermediate filaments mediate cytoskeletal crosstalk. Nature reviews Molecular cell biology. 2004;5:601–613. doi: 10.1038/nrm1438. [DOI] [PubMed] [Google Scholar]
- Christian ML, Demorest ZL, Starker CG, Osborn MJ, Nyquist MD, Zhang Y, Carlson DF, Bradley P, Bogdanove AJ, Voytas DF. Targeting G with TAL effectors: a comparison of activities of TALENs constructed with NN and NK repeat variable di-residues. PloS one. 2012;7:e45383. doi: 10.1371/journal.pone.0045383. [DOI] [PMC free article] [PubMed] [Google Scholar]
- Dauphin M, Barbe C, Lemaire S, Nawrocki-Raby B, Lagonotte E, Delepine G, Birembaut P, Gilles C, Polette M. Vimentin expression predicts the occurrence of metastases in non small cell lung carcinomas. Lung cancer. 2013;81:117–122. doi: 10.1016/j.lungcan.2013.03.011. [DOI] [PubMed] [Google Scholar]
- Ding L, Danuser G. Structure-guided hysteresis thresholding by iterative graph matching applied to the image construction of dense filamentous networks. Submitted to IEEE Transactions on Pattern Analysis and Machine Intelligence 2015 [Google Scholar]
- Eckes B, Colucci-Guyon E, Smola H, Nodder S, Babinet C, Krieg T, Martin P. Impaired wound healing in embryonic and adult mice lacking vimentin. Journal of cell science. 2000;113(Pt 13):2455–2462. doi: 10.1242/jcs.113.13.2455. [DOI] [PubMed] [Google Scholar]
- Eckes B, Dogic D, Colucci-Guyon E, Wang N, Maniotis A, Ingber D, Merckling A, Langa F, Aumailley M, Delouvee A, et al. Impaired mechanical stability, migration and contractile capacity in vimentin-deficient fibroblasts. Journal of cell science. 1998;111(Pt 13):1897–1907. doi: 10.1242/jcs.111.13.1897. [DOI] [PubMed] [Google Scholar]
- Etienne-Manneville S. Microtubules in cell migration. Annual review of cell and developmental biology. 2013;29:471–499. doi: 10.1146/annurev-cellbio-101011-155711. [DOI] [PubMed] [Google Scholar]
- Gilles C, Polette M, Zahm JM, Tournier JM, Volders L, Foidart JM, Birembaut P. Vimentin contributes to human mammary epithelial cell migration. Journal of cell science. 1999;112(Pt 24):4615–4625. doi: 10.1242/jcs.112.24.4615. [DOI] [PubMed] [Google Scholar]
- Goldman RD, Khuon S, Chou YH, Opal P, Steinert PM. The function of intermediate filaments in cell shape and cytoskeletal integrity. The Journal of cell biology. 1996;134:971–983. doi: 10.1083/jcb.134.4.971. [DOI] [PMC free article] [PubMed] [Google Scholar]
- Goodson HV, Dzurisin JS, Wadsworth P. Methods for expressing and analyzing GFP-tubulin and GFP-microtubule-associated proteins. Cold Spring Harbor protocols 2010. 2010 doi: 10.1101/pdb.top85. pdb top85. [DOI] [PubMed] [Google Scholar]
- Gurland G, Gundersen GG. Stable, detyrosinated microtubules function to localize vimentin intermediate filaments in fibroblasts. The Journal of cell biology. 1995;131:1275–1290. doi: 10.1083/jcb.131.5.1275. [DOI] [PMC free article] [PubMed] [Google Scholar]
- Havel LS, Kline ER, Salgueiro AM, Marcus AI. Vimentin regulates lung cancer cell adhesion through a VAV2-Rac1 pathway to control focal adhesion kinase activity. Oncogene. 2014 doi: 10.1038/onc.2014.123. [DOI] [PMC free article] [PubMed] [Google Scholar]
- Helfand BT, Mendez MG, Murthy SN, Shumaker DK, Grin B, Mahammad S, Aebi U, Wedig T, Wu YI, Hahn KM, et al. Vimentin organization modulates the formation of lamellipodia. Molecular biology of the cell. 2011;22:1274–1289. doi: 10.1091/mbc.E10-08-0699. [DOI] [PMC free article] [PubMed] [Google Scholar]
- Herrmann H, Bar H, Kreplak L, Strelkov SV, Aebi U. Intermediate filaments: from cell architecture to nanomechanics. Nature reviews Molecular cell biology. 2007;8:562–573. doi: 10.1038/nrm2197. [DOI] [PubMed] [Google Scholar]
- Huber F, Boire A, Lopez MP, Koenderink GH. Cytoskeletal crosstalk: when three different personalities team up. Current opinion in cell biology. 2014;32C:39–47. doi: 10.1016/j.ceb.2014.10.005. [DOI] [PubMed] [Google Scholar]
- Jacob M, Unser M. Design of steerable filters for feature detection using canny-like criteria. IEEE Trans Pattern Anal Mach Intell. 2004;26:1007–1019. doi: 10.1109/TPAMI.2004.44. [DOI] [PubMed] [Google Scholar]
- Kidd ME, Shumaker DK, Ridge KM. The role of vimentin intermediate filaments in the progression of lung cancer. American journal of respiratory cell and molecular biology. 2014;50:1–6. doi: 10.1165/rcmb.2013-0314TR. [DOI] [PMC free article] [PubMed] [Google Scholar]
- Liu CY, Lin HH, Tang MJ, Wang YK. Vimentin contributes to epithelial-mesenchymal transition cancer cell mechanics by mediating cytoskeletal organization and focal adhesion maturation. Oncotarget. 2015 doi: 10.18632/oncotarget.3862. [DOI] [PMC free article] [PubMed] [Google Scholar]
- Lowery J, Kuczmarski ER, Herrmann H, Goldman RD. Intermediate Filaments Play a Pivotal Role in Regulating Cell Architecture and Function. The Journal of biological chemistry. 2015 doi: 10.1074/jbc.R115.640359. [DOI] [PMC free article] [PubMed] [Google Scholar]
- Matov A, Edvall MM, Yang G, Danuser G. Optimal-Flow Minimum-Cost Correspondence Assignment in Particle Flow Tracking. Comput Vis Image Underst. 2011;115:531–540. doi: 10.1016/j.cviu.2011.01.001. [DOI] [PMC free article] [PubMed] [Google Scholar]
- Mendez MG, Kojima S, Goldman RD. Vimentin induces changes in cell shape, motility, and adhesion during the epithelial to mesenchymal transition. FASEB journal : official publication of the Federation of American Societies for Experimental Biology. 2010;24:1838–1851. doi: 10.1096/fj.09-151639. [DOI] [PMC free article] [PubMed] [Google Scholar]
- Menko AS, Bleaken BM, Libowitz AA, Zhang L, Stepp MA, Walker JL. A central role for vimentin in regulating repair function during healing of the lens epithelium. Molecular biology of the cell. 2014;25:776–790. doi: 10.1091/mbc.E12-12-0900. [DOI] [PMC free article] [PubMed] [Google Scholar]
- Ng MR, Besser A, Danuser G, Brugge JS. Substrate stiffness regulates cadherin-dependent collective migration through myosin-II contractility. The Journal of cell biology. 2012;199:545–563. doi: 10.1083/jcb.201207148. [DOI] [PMC free article] [PubMed] [Google Scholar]
- Nieminen M, Henttinen T, Merinen M, Marttila-Ichihara F, Eriksson JE, Jalkanen S. Vimentin function in lymphocyte adhesion and transcellular migration. Nature cell biology. 2006;8:156–162. doi: 10.1038/ncb1355. [DOI] [PubMed] [Google Scholar]
- Nieuwenhuizen RP, Nahidiazar L, Manders EM, Jalink K, Stallinga S, Rieger B. Co-Orientation: Quantifying Simultaneous Co-Localization and Orientational Alignment of Filaments in Light Microscopy. PloS one. 2015;10:e0131756. doi: 10.1371/journal.pone.0131756. [DOI] [PMC free article] [PubMed] [Google Scholar]
- Prahlad V, Yoon M, Moir RD, Vale RD, Goldman RD. Rapid movements of vimentin on microtubule tracks: kinesin-dependent assembly of intermediate filament networks. The Journal of cell biology. 1998;143:159–170. doi: 10.1083/jcb.143.1.159. [DOI] [PMC free article] [PubMed] [Google Scholar]
- Preciado Lopez M, Huber F, Grigoriev I, Steinmetz MO, Akhmanova A, Koenderink GH, Dogterom M. Actin-microtubule coordination at growing microtubule ends. Nat Commun. 2014;5:4778. doi: 10.1038/ncomms5778. [DOI] [PMC free article] [PubMed] [Google Scholar]
- Ridley AJ, Schwartz MA, Burridge K, Firtel RA, Ginsberg MH, Borisy G, Parsons JT, Horwitz AR. Cell migration: integrating signals from front to back. Science. 2003;302:1704–1709. doi: 10.1126/science.1092053. [DOI] [PubMed] [Google Scholar]
- Sakamoto Y, Boeda B, Etienne-Manneville S. APC binds intermediate filaments and is required for their reorganization during cell migration. The Journal of cell biology. 2013;200:249–258. doi: 10.1083/jcb.201206010. [DOI] [PMC free article] [PubMed] [Google Scholar]
- Satelli A, Li S. Vimentin in cancer and its potential as a molecular target for cancer therapy. Cellular and molecular life sciences : CMLS. 2011;68:3033–3046. doi: 10.1007/s00018-011-0735-1. [DOI] [PMC free article] [PubMed] [Google Scholar]
- Schaefer AW, Kabir N, Forscher P. Filopodia and actin arcs guide the assembly and transport of two populations of microtubules with unique dynamic parameters in neuronal growth cones. The Journal of cell biology. 2002;158:139–152. doi: 10.1083/jcb.200203038. [DOI] [PMC free article] [PubMed] [Google Scholar]
- Schoumacher M, Goldman RD, Louvard D, Vignjevic DM. Actin, microtubules, and vimentin intermediate filaments cooperate for elongation of invadopodia. The Journal of cell biology. 2010;189:541–556. doi: 10.1083/jcb.200909113. [DOI] [PMC free article] [PubMed] [Google Scholar]
- Shabbir SH, Cleland MM, Goldman RD, Mrksich M. Geometric control of vimentin intermediate filaments. Biomaterials. 2014;35:1359–1366. doi: 10.1016/j.biomaterials.2013.10.008. [DOI] [PMC free article] [PubMed] [Google Scholar]
- Shaner NC, Lin MZ, McKeown MR, Steinbach PA, Hazelwood KL, Davidson MW, Tsien RY. Improving the photostability of bright monomeric orange and red fluorescent proteins. Nature methods. 2008;5:545–551. doi: 10.1038/nmeth.1209. [DOI] [PMC free article] [PubMed] [Google Scholar]
- Shelden E, Wadsworth P. Observation and quantification of individual microtubule behavior in vivo: microtubule dynamics are cell-type specific. The Journal of cell biology. 1993;120:935–945. doi: 10.1083/jcb.120.4.935. [DOI] [PMC free article] [PubMed] [Google Scholar]
- Sikorski RS, Hieter P. A system of shuttle vectors and yeast host strains designed for efficient manipulation of DNA in Saccharomyces cerevisiae. Genetics. 1989;122:19–27. doi: 10.1093/genetics/122.1.19. [DOI] [PMC free article] [PubMed] [Google Scholar]
- Snider NT, Omary MB. Post-translational modifications of intermediate filament proteins: mechanisms and functions. Nature reviews Molecular cell biology. 2014;15:163–177. doi: 10.1038/nrm3753. [DOI] [PMC free article] [PubMed] [Google Scholar]
- Tsien RY. The green fluorescent protein. Annual review of biochemistry. 1998;67:509–544. doi: 10.1146/annurev.biochem.67.1.509. [DOI] [PubMed] [Google Scholar]
- Wu X, Kodama A, Fuchs E. ACF7 regulates cytoskeletal-focal adhesion dynamics and migration and has ATPase activity. Cell. 2008;135:137–148. doi: 10.1016/j.cell.2008.07.045. [DOI] [PMC free article] [PubMed] [Google Scholar]
- Yoon M, Moir RD, Prahlad V, Goldman RD. Motile properties of vimentin intermediate filament networks in living cells. The Journal of cell biology. 1998;143:147–157. doi: 10.1083/jcb.143.1.147. [DOI] [PMC free article] [PubMed] [Google Scholar]
- Zaritsky A, Kaplan D, Hecht I, Natan S, Wolf L, Gov NS, Ben-Jacob E, Tsarfaty I. Propagating waves of directionality and coordination orchestrate collective cell migration. PLoS computational biology. 2014;10:e1003747. doi: 10.1371/journal.pcbi.1003747. [DOI] [PMC free article] [PubMed] [Google Scholar]
- Zaritsky A, Natan S, Ben-Jacob E, Tsarfaty I. Emergence of HGF/SF-induced coordinated cellular motility. PloS one. 2012;7:e44671. doi: 10.1371/journal.pone.0044671. [DOI] [PMC free article] [PubMed] [Google Scholar]
- Zaritsky A, Natan S, Horev J, Hecht I, Wolf L, Ben-Jacob E, Tsarfaty I. Cell motility dynamics: a novel segmentation algorithm to quantify multi-cellular bright field microscopy images. PloS one. 2011;6:e27593. doi: 10.1371/journal.pone.0027593. [DOI] [PMC free article] [PubMed] [Google Scholar]
Associated Data
This section collects any data citations, data availability statements, or supplementary materials included in this article.