Significance
The hierarchical assembly pathway of the cytoskeletal protein vimentin may be responsible for the astonishing mechanical properties of the emerging filaments, such as high flexibility and extensibility, and thus play a key role in cellular mechanics. A two-step assembly mechanism, involving a lateral and a subsequent elongational step, has been established; however, the elongational step could not be followed in solution. Here, we show direct in situ observation and modeling of the elongation reaction of the filaments on the relevant length and time scales, using time-resolved, multiangle static and dynamic light scattering. We thus achieve sufficient spatio-temporal resolution without the need of labeling, staining, or adsorption to substrates.
Keywords: cytoskeleton, intermediate filaments, vimentin, self-assembly, time-resolved light scattering
Abstract
Vimentin intermediate filaments (IFs) are part of a family of proteins that constitute one of the three filament systems in the cytoskeleton, a major contributor to cell mechanics. One property that distinguishes IFs from the other cytoskeletal filament types, actin filaments and microtubules, is their highly hierarchical assembly pathway, where a lateral association step is followed by elongation. Here we present an innovative technique to follow the elongation reaction in solution and in situ by time-resolved static and dynamic light scattering, thereby precisely capturing the relevant time and length scales of seconds to minutes and 60–600 nm, respectively. We apply a quantitative model to our data and succeed in consistently describing the entire set of data, including particle mass, radius of gyration, and hydrodynamic radius during longitudinal association.
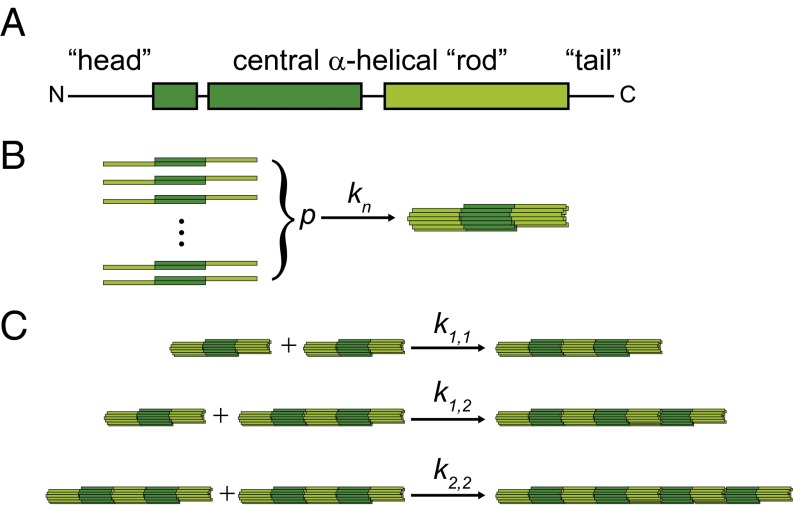
Intermediate filaments (IFs) constitute one of the three protein filament systems in the cytoskeleton of metazoa. Together with actin filaments and microtubules they form a sophisticated composite network, which has been identified as a main player in cell mechanics (1). By contrast to actin filaments and microtubules, which are conserved across cell types and organisms, IFs comprise a large family of proteins, encoded by 70 genes in humans (2), and they are expressed in a cell-type–specific manner. Vimentin is an IF protein expressed in fibroblasts, the eye lens, and cells of mesenchymal origin. The monomers with a molecular weight of 53.5 × 10³ g/mol share their tripartite structure consisting of an α-helical rod flanked by intrinsically disordered “head” and “tail” domains, as shown in Fig. 1A, with all other IFs. These monomers are stable in denaturing conditions, such as 8 M urea, and assemble into coiled-coil dimers and subsequently into antiparallel tetramers with = 214 × 103 g/mol, a length of 60 nm, and a diameter of 5 nm upon stepwise dialysis into low-salt buffers, such as 2 mM sodium phosphate (3). Thus, in buffer conditions without urea, these tetramers with a mass per unit length of 3,570 g/(mol⋅nm) are the smallest subunits and starting precursors for vimentin IF assembly. In vitro the assembly of tetramers into full-length filaments can be initiated by the addition of, e.g., monovalent salts such as potassium chloride (KCl) at concentrations of a few tens of millimolars. It has been shown by time-lapse electron microscopy (4) and more recently by real-time small-angle X-ray scattering (SAXS) in combination with microfluidic techniques (5–7) that a lateral assembly step into unit-length filaments (ULFs) consisting of typically eight tetramers (Fig. 1B) is followed by an elongation reaction where ULFs and short filaments join to form micrometer-long filaments (Fig. 1C). However, the exact molecular mechanism of the elongation reaction remains elusive. It is clear that the tail domains are not needed (4). The way that the IF consensus domains at either end of the rod interact, overlapping (8) vs. interdigitating (9), is not clear. Moreover, the extent to which the subdomain flexibility plays a role is still uncertain (10). Importantly, the number of monomers per cross-section may vary, depending on the overall and local buffer conditions (4). Note that in the fully assembled filament, the mass per unit length is 40 × 103 g/(mol⋅nm), when assuming a typical number of eight tetramers per cross-section, due to a partial overlap of the ULFs during the elongation reaction.
Fig. 1.
(A) Vimentin monomer structure with the central α-helical rod domain (green boxes; light and dark green for facilitating understanding of the assembly hierarchy) and intrinsically unstructured head and tail domains (black lines). Monomers form antiparallel tetramers, consisting of two coiled-coil dimers, in low-salt buffers. (B) Lateral assembly step. p tetramers associate to form a ULF. (C) Elongation reaction. Association of ULFs or filaments of any length are included in our model.
A ULF is 60 nm long and 17 nm in diameter, and thus SAXS is a highly suitable technique to observe the lateral assembly from tetramers to ULFs (5, 11). Recently fluorescence labeling techniques have been developed for vimentin IFs (12, 13), enabling us to observe the elongational growth of filaments 1 μm long or longer. However, the length scales between ∼100 nm and 500 nm are not easily accessible by SAXS or by visible light microscopy and dynamic data of the assembly process in this range are largely missing. We bridge this gap by applying a combination of time-resolved static light scattering (SLS) and dynamic light scattering (DLS), which accesses exactly the missing length scales and is sensitive in the range of contour lengths between 60 nm and 600 nm.
SLS is a very suitable technique to determine the mass and structure of protein aggregates and assemblies in dilute solution with radii of gyration and molar masses in the range of 10–200 nm and 5 × 10³–1 × 10⁸ g/mol, respectively. DLS further allows us to measure the distribution of relaxation times in solution (14, 15), from which diffusion coefficients can be extracted. An early study of aggregation applying combined SLS and DLS analyzed the initial stage of coagulation of spherical colloids (16). Time-resolved SLS was used to record the consumption of triarylamine molecules during their self-assembly and supplementary DLS succeeded in attributing a decreasing scattering signal to the monomers and nuclei disappearing during assembly (17). SLS and DLS have also been applied to study fibril formation in amyloid-β in the time range of a few seconds to days (18–22). In the case of fast kinetics, experiments had to be restricted to single-angle recordings due to the moderate temporal resolution of the methods. The limitations of single-angle DLS or SLS/DLS setups imply that to interpret kinetic data, specific assumptions have to be made about the morphology of aggregates. As an example, Lomakin et al. (19) and Pallitto and Murphy (23) in their studies of amyloid-β fibers had to assume a cylinder-like (24–26) structure of their aggregates and to use model-based equations and simplifications to extrapolate data to a state suitable for a kinetic analysis.
Our work extends the technique to a multiangle setup enabling time-resolved combined SLS and DLS. Compared with single-angle setups, where assumptions about the morphology and size distribution of the particles are necessary to extract structural parameters, multiangle light scattering permits reliable extraction of the molecular weight (), radius of gyration (), and hydrodynamic radius () without specific assumptions about the shape and the degree of polydispersity of the particles, as previously demonstrated for the aggregation of dyestuff molecules and for nucleation and growth of silica particles (27, 28). Application of this in situ technique provides us with a consistent set of and of assembling filaments and enables us to follow quantitatively and in real time the longitudinal growth of ULFs toward filaments of lengths up to 600 nm. The resulting data are compared with a kinetic model of a step growth process (23).
Theoretical Background
SLS from a dilute solution of weakly interacting particles can be approximated by (24)
| [1] |
DLS measures the intensity correlation function from which the inverse relaxation time can be obtained. depends on the scattering vector in the low q limit as
| [2] |
is the z-averaged diffusion coefficient and C and describe the angle and concentration dependence of respectively. for cylinders can be calculated according to Eq. S10. The Stokes–Einstein equation translates the diffusion coefficient into an effective hydrodynamic radius:
| [3] |
The parameter is defined as the radius of a sphere exhibiting the same diffusion coefficient as the particles under current consideration. differs from which is a purely geometric quantity. The actual difference depends on the particle shape and can be quantified by the ratio (29).
Results and Discussion
Characterization of Vimentin Before Initiation of Assembly.
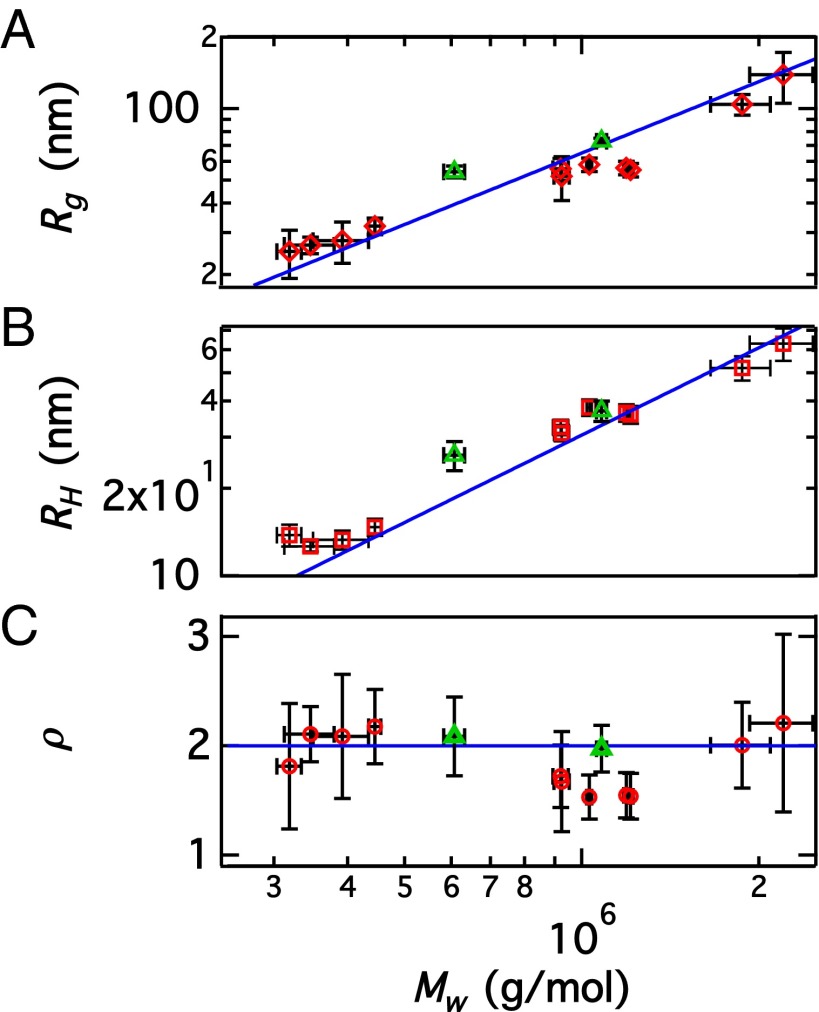
SLS and DLS measurements of nonassembled vimentin in dilute solution before the addition of KCl show different values of and for samples with slightly varying sample histories (e.g., different stock solutions, dialysis, and filtering in different batches) as shown in Fig. 2 (see also Tables S1 and S2). The values for and are always larger than those of a tetramer with = 214 kg/mol, 17 nm ( for rods). The polydispersity (p.d.), expressed as the ratio of the weight-averaged molecular weight and number-averaged molecular weight (see Supporting Information, Application of the Rod Model to Light Scattering for the mathematical definitions), is found to vary between 1.3 and 2.2, with higher- samples generally showing higher This result suggests that species larger than tetramers are present in our starting solutions.
Fig. 2.
Aggregation of unassembled vimentin. (A) Square root of the z-averaged squared radius of gyration plotted against weight-averaged molar mass The blue line indicates a power law with exponent 1. (B) Hydrodynamic radius plotted against The blue line indicates a power law with exponent 1. (C) Shape-sensitive ratio plotted against The blue line indicates the average value of The values extrapolated to infinite dilution from Zimm plots are included as green triangles (Supporting Information, Zimm Plots of Dilution Series of Vimentin in Sodium Phosphate Buffer).
Table S1.
Effect of filtering
| Sample | nm | g/mol | nm | C | *, kg⋅mol−1⋅nm−1 | c, g/L | |
| Not filtered | 140 ± 30 | 2.2 ± 0.3 | 63 ± 7 | 0.22 ± 0.05 | 2.2 ± 0.1 | 6.9 ± 2 | 0.098–0.035† |
| Filtered | 52 ± 10 | 9.2 ± 0.1 | 31 ± 1 | 0.3 ± 0.1 | 1.8 ± 0.1 | 9 ± 2 | 0.035 |
| Refiltered | 56 ± 5 | 9.2 ± 0.1 | 33 ±2 | 0.35 ± 0.1 | 1.8 ± 0.1 | 8.6 ± 0.9 | 0.035 |
=
A first measurement was taken at 0.098 g/L, and the solution was then diluted to 0.035 g/L and remeasured. Values correspond to the average between the two readings.
Table S2.
The parameters from Zimm analysis for two vimentin samples studied as a function of concentration (first two rows) and the parameters measured at a single concentration (other rows)
| Sample | nm | g/mol | nm | nm | C | ρ | kg⋅mol−1⋅nm−1 | mol⋅L⋅g−2 | dm3/g | c, g/L | |
| Dilution 1 | 58 ± 3 | 6.1 ± 0.3 | 115 ± 4 | 26 ± 5 | 0.34 ± 0.05 | 2.3 ± 0.5 | 5.3 ± 0.5 | 2.4 ± 0.6 | — | 1.5 | 0.5–0.13 |
| Dilution 2 | 73 ± 2 | 1.1 ± 0.1 | 220 ± 10 | 37 ± 3 | 0.26 ± 0.05 | 2 ± 0.2 | 6.3 ± 0.5 | 5.5 ± 0.3 | 1.2 ± 0.3 | 1.5 | 0.2–0.046 |
| Sample 1 | 25 ± 6 | 3.2 ± 0.2 | 60 ± 10 | 14 ± 1 | 0.17 ± 0.06 | 1.8 ± 0.6 | 5 ± 1 | — | — | 1.3 | 0.14 |
| Sample 2 | 32 ± 3 | 4.5 ± 0.1 | 84 ± 6 | 15 ± 1 | 0.20 ± 0.03 | 2.2 ± 0.3 | 6 ± 1 | — | — | 1.5 | 0.12 |
| Sample 3 | 28 ± 5 | 3.9 ± 0.4 | 70 ± 14 | 13 ± 1 | 0.22 ± 0.05 | 2.1 ± 0.6 | 6 ± 1 | — | — | 1.3 | 0.12 |
| Sample 4 | 27 ± 2 | 3.5 ± 0.3 | 66 ± 6 | 12.6 ± 0.5 | 0.2 ± 0.04 | 2.1 ± 0.3 | 5 ± 1 | — | — | 1.4 | 0.18 |
| Sample 5 | 100 ± 10 | 1.9 ± 0.2 | 220 ± 20 | 52 ± 5 | 0.2 ± 0.05 | 2.0 ± 0.4 | 8.6 ± 0.1 | — | — | 1.8 | 0.18 |
| Sample 6 | 58 ± 4 | 1.0 ± 0.1 | 120 ± 10 | 38 ± 3 | 0.32 ± 0.09 | 1.5 ± 0.2 | 6.3 ± 0.5 | — | — | 1.8 | 0.2 |
| Sample 7 | 55 ± 4 | 1.2 ± 0.1 | 120 ± 10 | 36 ± 3 | 0.32 ± 0.07 | 1.5 ± 0.2 | 6.3 ± 0.5 | — | — | 1.8 | 0.2 |
| Sample 8 | 56 ± 4 | 1.2 ± 0.1 | 120 ± 10 | 36 ± 3 | 0.32 ± 0.05 | 1.5 ± 0.2 | 6.3 ± 0.5 | — | — | 1.8 | 0.2 |
In column 3, is calculated via Eq. S4 and the mass per unit length in column 7 is set to
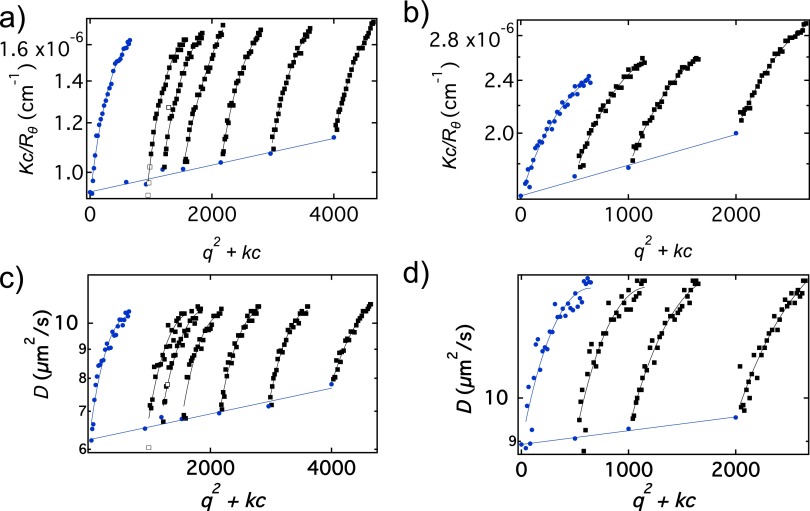
To evaluate the parameters and (Eqs. 1 and 2) and to scrutinize whether dilution affects the aggregation in the concentration regime under consideration, two samples were stepwise diluted and remeasured and and were extrapolated to c = 0 and included in Fig. 2 as green triangles; they agree well with the general trend. The results are plotted in Fig. S2 and and are given in Table S2. Thus, a concentration-dependent variation of the aggregation can be excluded as the cause of the observed sample characteristics. The absence of a correlation between the parameters shown in Fig. 2 and their corresponding concentrations (Tables S1 and S2) further supports insensitivity of the aggregation state to the protein concentration in the range studied.
Fig. S2.
Static (A and B) and dynamic (C and D) Zimm plots for two vimentin samples in sodium phosphate buffer. Shown are sample 1 (B and D) and sample 2 (A and C) (details in Table S2). Squares represent data points and circles represent values extrapolated to zero concentration. Lines are quadratic fits to the data. Open symbols are deleted points. k is an arbitrary constant set to 4,000 for sample 1 and to 20,000 for sample 2.
The effect of filtering, which is capable of breaking assemblies to some degree, is discussed in Supporting Information, Effect of Filtering and may be a potential cause of the variation observed within the present set of samples. Two different scenarios for our starting solution are consistent with the data shown in Fig. 2. First, it is possible that each individual sample represents a homogeneous population of rods at different lengths and masses, thus leading to the three distinct “groups” of data visible in Fig. 2. The constant value of ρ within experimental error suggests self-similarity in the structure of different samples (29). Both and are approximately proportional to shown by the power law exponent of 1 indicated by the blue lines in Fig. 2 A and B, as expected for a rod morphology. The average value of is also compatible with that of polydisperse rods (30). A second scenario could be a bidisperse population of mostly tetramers and between 2% and 12% filaments. In this scenario, the different measured values for length and mass result from differences in the fraction of short filaments in the bidisperse system.
It should be noted that the situation before initiation of the assembly is likely due to aggregates of tetramers caused by impurities in the solution that can act as seeds. Those aggregates are probably not identical to the higher-order structures that we find as intermediate steps during vimentin assembly. Moreover, we have shown previously that the addition of KCl transfers the tetramers into an assembly-competent state and thus initiates the process (6, 31) and this transfer could be associated with a solubilization of individual tetramers.
Kinetics of Assembly.
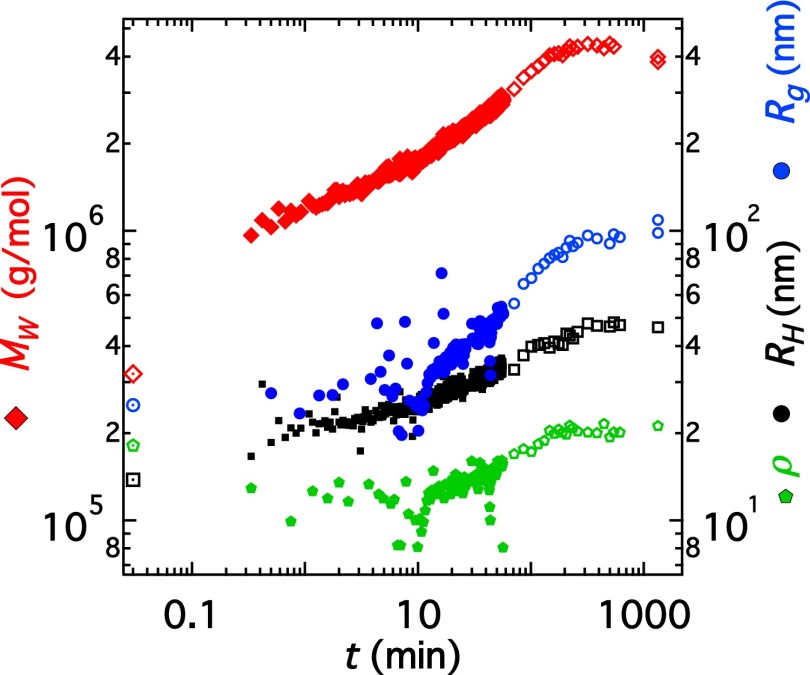
We select the least aggregated sample ( 3.2 × g/mol, 25 nm; Table 1) to study the kinetics of vimentin assembly. The concentration of this sample is (0.07 ± 0.02) g/L. Assembly is induced upon addition of 0.1 M KCl at a volume ratio of 1:1. Given the low protein concentration, corrections to and arising from and (∼0.5–3%) are neglected. Fig. 3 shows a plot of and ρ as a function of time, where t = 0 corresponds to the mixing time point. The values before the addition of salt (t = 0) are indicated as large symbols at t = 0.03 min. The first readings correspond to 0.3–0.5 min after mixing. Clear changes in the state of vimentin are apparent already at the earliest measured time points. Within the first 0.3 min, the molecular weight increases to a value of 106 g/mol, whereas remains constant within experimental error and increases by 20%. Further, for 10 min, continues to increase by a factor of 1.5 whereas grows only slightly and remains constant within a fairly large experimental uncertainty. For min, we observe an increase of and ρ.
Table 1.
and for samples before the addition of KCl and parameters from fits to the kinetic model at = 0.05 M and varying c
| Samples in sodium phosphate buffer | Kinetic parameters | |||||||
| C, g/L | g/mol | nm | nm | p | rad⋅nm | Mp−1/s | ML*, ×103 g/(mol⋅nm) | nm |
| 0.09 ± 0.01 | 3.5 × 10⁵ | 27 | 13 | 9 ± 1 | 0.34 ± 0.05 | 45 | 24 | |
| 0.07 ± 0.02 | 3.2 × 10⁵ | 25 | 14 | 6 ± 1 | 0.17 ± 0.02 | 2 × 1035 | 29 | 34 |
| 0.06 ± 0.01 | 3.9 × 10⁵ | 32 | 15 | 5 ± 1 | 0.14 ± 0.02 | 6 × 1029 | 25 | 22 |
is the mass per unit length of the ULFs [ = ].
Fig. 3.
Vimentin assembly kinetics. (red diamonds), (blue circles), (black squares), and ρ (green diamonds) are plotted against time for a vimentin solution (0.07 g/L protein, 0.05 M KCl). Symbols at t = 0.03 min correspond to the values of vimentin before addition of KCl; i.e., t = 0. ρ is multiplied by a factor of 10.
If the trend in in Fig. 3 is extrapolated to the point representing the initial state, two phases in the assembly process become apparent. Assuming rod-shaped assemblies, our data suggest that lateral assembly essentially takes place during the first minute. In the time range of 1 min 10 min lateral aggregation appears to be completed whereas elongation starts to become noticeable, thus establishing transition from the first to the second phase. Thereafter the data indicate elongational growth and an increase in the aspect ratio of the assemblies. Due to the specific length and time scales probed by light scattering, the focus of this work is a quantitative analysis of the second phase. At h, decreases. Given that the length of the assemblies at this time is of the order of several hundred nanometers ( 100 nm corresponds to lengths L of 300 nm), this is likely due to sedimentation. The polydispersity remains approximately constant at a value of 1.3 throughout the experiment.
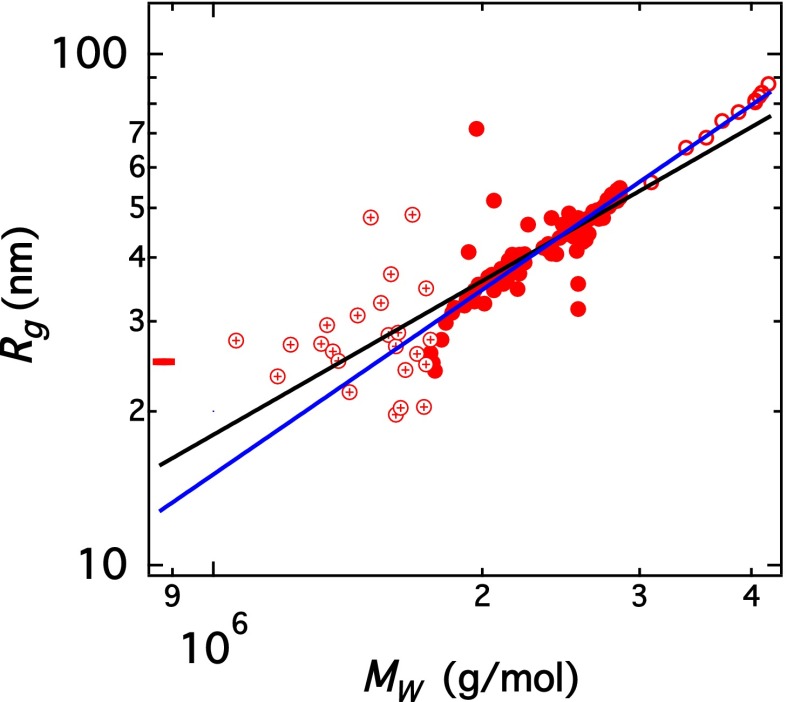
The correlation between and plotted in Fig. 4, gives insight into the morphology of the assembled structures: Rod-like morphologies yield whereas compact structures (e.g., spheres) lead to Lateral aggregation of rods with a high aspect ratio leads to const. For 10 min (circles with a cross in Fig. 4), the scatter in is fairly large. However, the values scatter around 29 nm, which is only 15% higher than the value of 25 nm determined at t = 0 (Fig. 2), confirming that growth is dominated by lateral assembly in the beginning of the assembly process. Data for 10 60 min are plotted as solid circles. Data for 60 min, obtained from 30 angle readings with acquisition times of 15 s per angle and therefore displaying significantly smaller errors, are plotted as open circles. These longer acquisition times were possible because the growth process became sufficiently slow at t = 60 min. A best fit to the data at 10 min with the rod model and and constant mass per unit length yields = 22 g/(mol⋅nm) ( 6 times that of a tetramer). The best fit to a power law yields an exponent of 1.3. Rigid rods may yield an apparent exponent greater than 1 if either increases or decreases as assembly takes place. In the case of vimentin assembly, we expect of the emerging filaments to increase due to assembly. As expected from previous work (3, 4), the exponent allows us to rule out growth via a monomer addition mechanism that would result in an exponent of 0.5 for rods (32).
Fig. 4.
Morphology of the emerging assemblies. is plotted against for the kinetic run shown in Fig. 3. Circles with a cross correspond to 10 min and solid circles to 10 60 min. Open circles correspond to data for min, which were obtained from 30 angle readings. The black line corresponds to polydisperse rods with = 1.3 and = 22 g/(mol⋅nm) (Eq. S4). The blue line corresponds to a best-fit power law. The red bar on the axis corresponds to the value before the aggregation process starts.
Kinetic Model.
Based on the above findings and on earlier work by Hermann et al. (4) we adopt a two-step model. In the first step, p tetramers assemble laterally to form ULFs with a rate constant (schematic in Fig. 1B). This step does not significantly affect the radius of gyration of the particles. The first step is modeled by a reaction of order p where p tetramers assemble laterally at once. We are fully aware that this oversimplifies the process; however, our dataset in this stage does not allow any further consideration. In a second step ULFs associate end to end (Fig. 1C). The reaction constant for this step is and depends on the lengths of the two aggregating species. corresponds to the assembly of two ULFs to yield a longitudinal ULF dimer, corresponds to the assembly of a longitudinal ULF dimer with a ULF, etc. In addition to the filament length, is a function of the cross-sectional hydrodynamic filament diameter, and the product of the maximum distance and angle between the ends of two filaments required for assembly (18, 23, 33–35). Further parameters needed for the model are the tetramer mass = 214 g/mol, the tetramer length = 60 nm, and the filament length (60 + 43( − 1)) nm, where is the longitudinal degree of association of a filament and 43 nm is the length contributed to the filament by a ULF. Kinetic equations for this scheme have been derived by Tomski and Murphy (18) and Pallitto and Murphy (23) and are compiled in Supporting Information, Kinetic Equations along with analytical solutions for the cases (just lateral assembly) and (instantaneous lateral assembly). The solutions to the equations for arbitrary values of and used for fitting our kinetic data are obtained numerically.
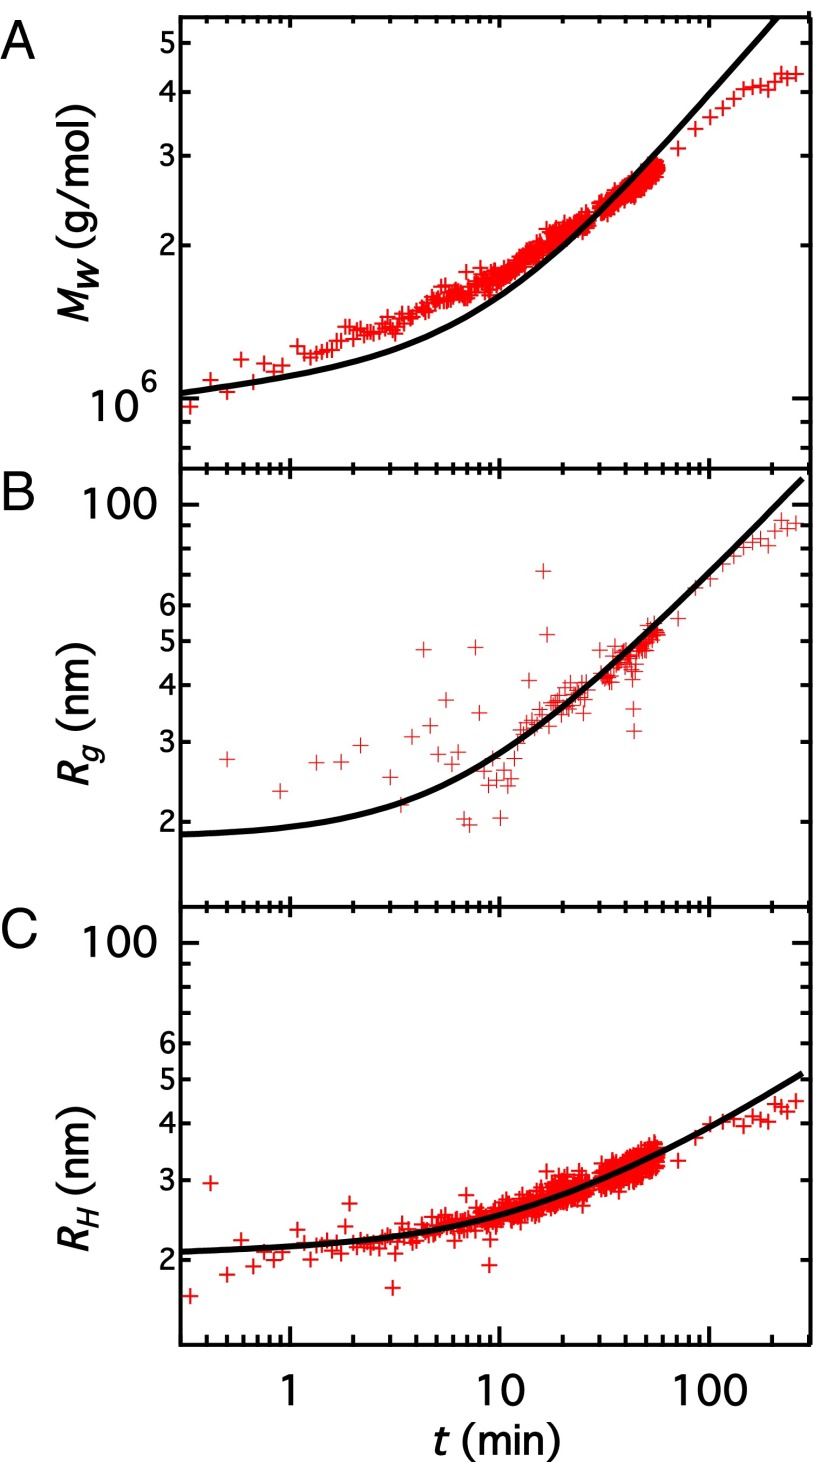
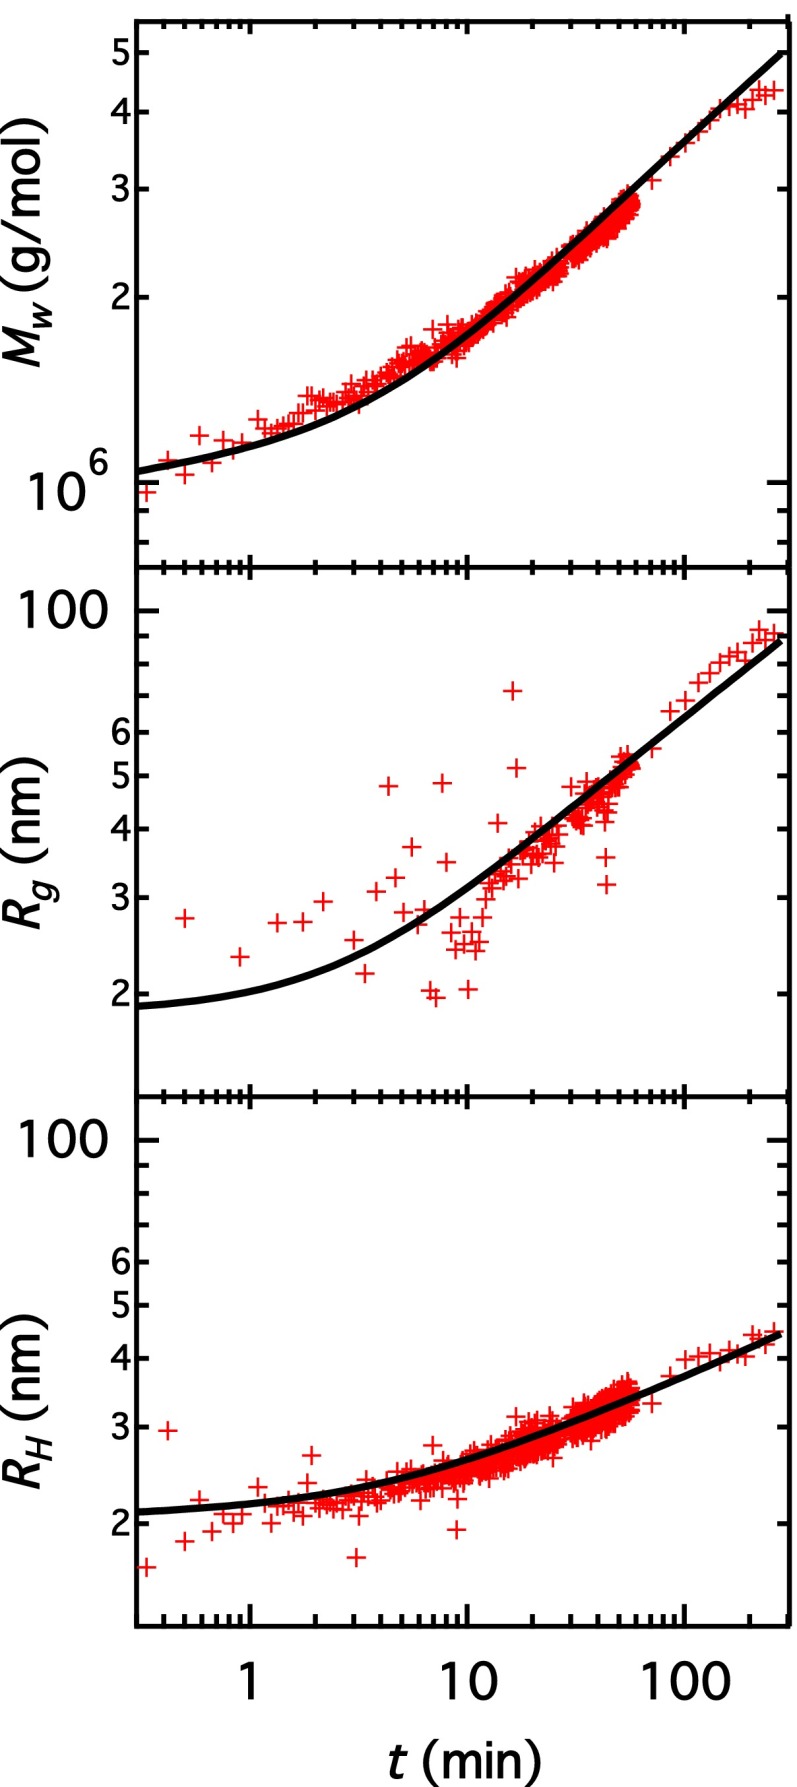
Fig. 5A shows as a function of time for the same sample discussed in Figs. 3 and 4. The model correctly captures the experimental data with three free parameters: and p, collected in Table 1. An additional parameter is needed but its value affects the fit to the only very weakly (see Supporting Information, Kinetic Equations for details of the calculation and parameter estimates). The data display a power law of at long times, close to the behavior expected for thin rods aggregating end to end (Supporting Information, Kinetic Equations). Fig. 5 B and C shows and as a function of time along with the corresponding theoretical trends based on the fit to the data in Fig. 5A, further adjusted to fit the and data. Adjustment is carried out by selecting one of the best fits to vs. t achieved with three neighboring values of p. All three fits equally well describe vs. t but exhibit varying quality for vs. t with only one of them showing satisfactory agreement (Supporting Information, Multiplicity of Fits). Further, is adjusted to fit the vs. t data. The model describes the time variation of and correctly.
Fig. 5.
(A) against time for a 0.07-g/L vimentin solution in the presence of 0.05 M KCl. (B) against time. (C) against time. The black lines show the model fit for the reaction scheme outlined in Fig. 1. The equations used to calculate and from this model are explained in Supporting Information, Kinetic Equations.
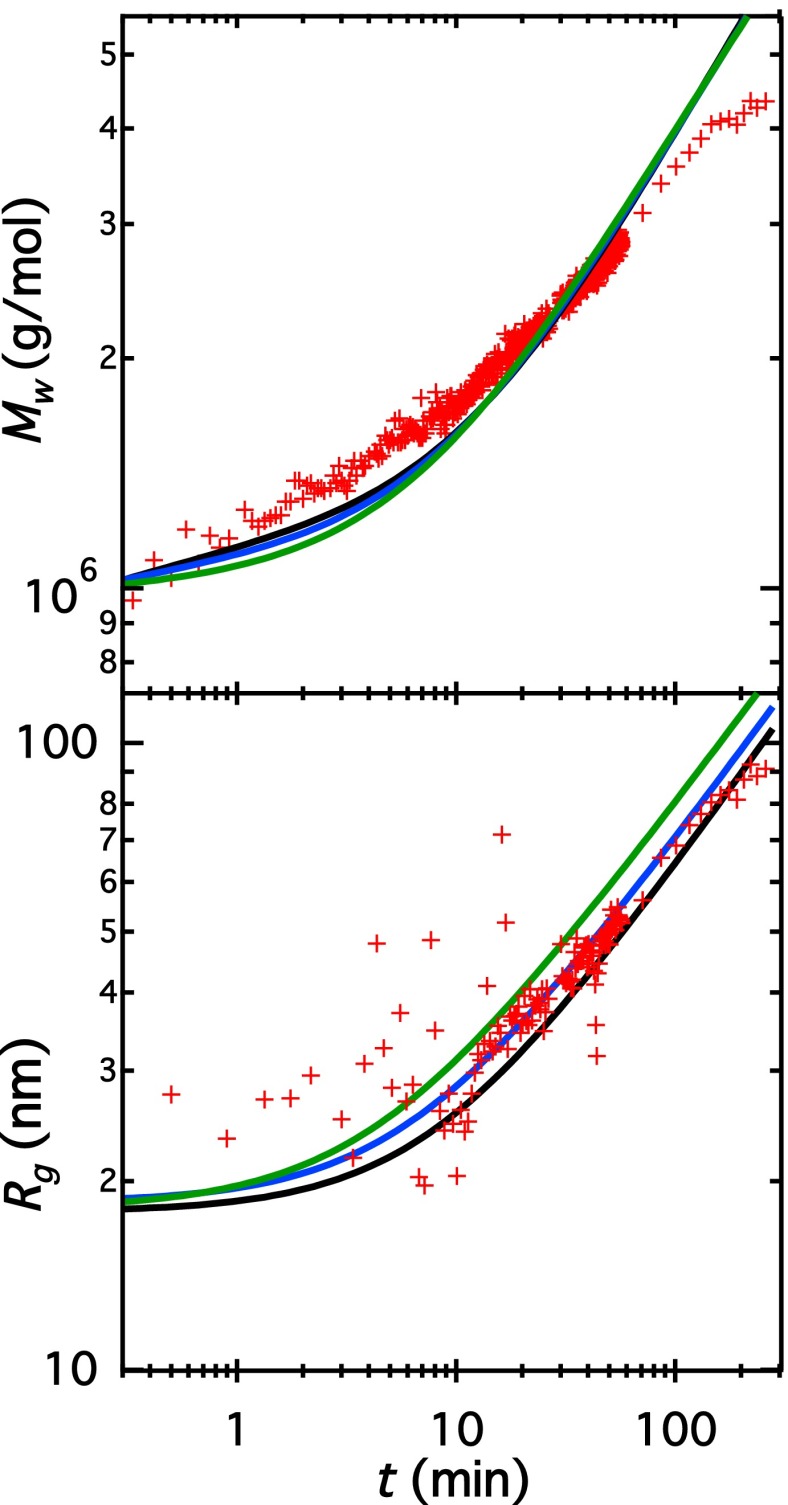
We note that if only one quantity (or ) is fitted, considerable uncertainty in the parameter estimates is observed. For example, if we fit only setting p to any value between 5 and 7, correspondingly different values of and result in equally good fits to the data (see Fig. S5). It is only when is considered additionally, that we can restrict the valid fits. The same is true if we fit only We are able to obtain multiple combinations for p, and that fit the time dependence of but deviate largely from the values (Supporting Information, Multiplicity of Fits).
Fig. S5.
Fit according to the kinetic model. Red symbols show vs. time (Top) and vs. time (Bottom) for the kinetic run at vimentin concentration of 0.07 g/L. Lines are fits to the model presented in the main text. Green line, p = 5; blue line, p = 6; black line, p = 7. and are adjusted to yield a best fit to the data for 100 min.
Whereas most previous studies (4, 34, 36) quantitatively captured the first, lateral assembly step, the present work complements these results by focusing on the second, elongational assembly step. Just like SAXS (5), DLS and SLS are solution techniques, minimizing the influence of filament–substrate interactions, and do not require labeling or staining. Direct comparison of kinetic values with previously published results is difficult due to differences in temperature, protein, and salt concentration. However, the trends reported here are in qualitative agreement with previous results, i.e., lateral assembly within seconds (our fit suggests that 70–80% of the tetramers are consumed by the time of the first measurements) and elongation within s. The work of Portet (34) may be compared in more detail to our work: The mean filament length of a 0.1-g/L sample in 0.1 M KCl 20 min after dilution is ∼450 nm. Our values of nm translate into 100–200 nm contour length. The values of ( in model I of ref. 34) are in the range of 1–4 nm rad, an order of magnitude larger than ours. This faster growth is expected because the salt concentration and temperature are greater than for our samples.
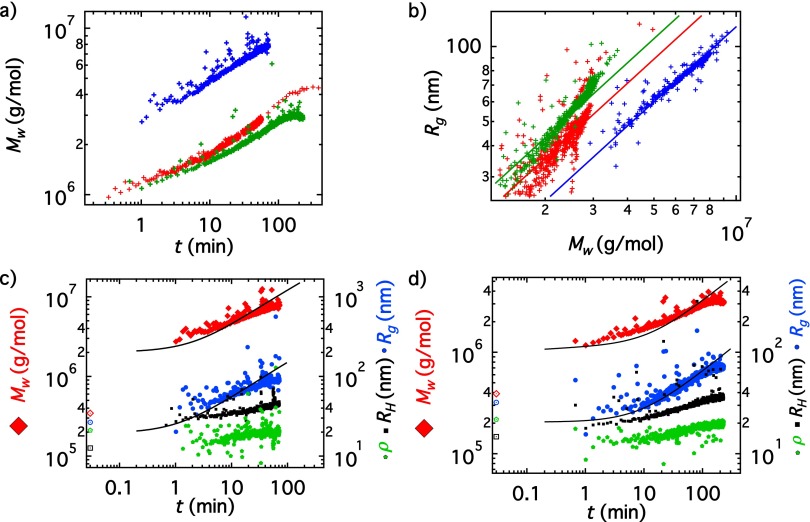
Two additional samples with similar protein concentrations of c = 0.06 ± 0.01 and 0.09 ± 0.01 g/L (Table 1) were investigated for comparison. Fits to the kinetic model are presented in Fig. S7. Qualitatively, the assembly process remains the same, with a lateral assembly step followed by end-to-end growth (Supporting Information, Variability with Concentration). The scatter in the values of p, and compiled in Table 1 demonstrates the level of uncertainty in our results, probably due to inaccuracies in concentration measurements at such low values. The resulting mass per unit length of the ULFs varies from 25 to 45 g/(mol⋅nm), corresponding to approximately five to nine tetramers per ULF. Lateral assembly is too fast for the 0.09 g/L sample to model step one. Noteworthy, the values of p and are close to the values expected from direct imaging using, e.g., electron microscopy (4), where typically p = 8 and = 40 g/(mol⋅nm) were found. However, variations between 20 g/(mol⋅nm) and 65 g/(mol⋅nm) were observed, even within one filament when the “kick-start” assembly mode has been used by direct mixing of two solutions as in this study. These values correspond to p ranging between 4 and 13. By contrast, slow dialysis leads to homogeneous filaments (4). The values of 22–34 nm resulting from the fit in Fig. 5C are on the same order as the hydrodynamic diameter of 16–18 nm found by Hohenadl et al. (37) for the related IF protein desmin.
Fig. S7.
(A) vs. time for three different kinetic runs. Blue symbols, c = 0.09 g/L; red symbols, c = 0.07 g/L; green symbols, c = 0.06 g/L. (B) vs. Symbols have the same meaning as in A. (C) (red diamonds), (blue circles), (black squares), and ρ × 10 (green stars) for the kinetic run with vimentin concentration of 0.09 g/L. Large open symbols at t = 0.03 min represent values before addition of KCl. (D) Same as C but for 0.06-g/L vimentin concentration. The lines in C and D represent fits with the kinetic model applied in the same way as done for c = 0.07 g/L in Fig. 5 and Fig. S5. The results from all fits are summarized in Table 1 of the main text.
Evaluation of the Kinetic Model.
Our model provides a good fit to the data; however, several important approximations must be noted: (i) We have assumed all reactions to be irreversible, which is probably true to a great extent in the light of the very slow subunit exchange observed in vitro (38); (ii) lateral assembly (step one) is assumed to occur for only a single value of p, whereas in fact it is well known that vimentin filaments exhibit heterogeneous values (4, 39) when assembly is started by mixing of the solutions; (iii) the mean value of L is used to calculate the reaction constant for step two, which avoids having to solve a large number of differential equations; (iv) we use an approximate expression for the diffusion coefficients of rods, which may suffer at low aspect ratios; and (v) we use one of many possible assumptions for the initial state of our system. Given these considerations, the fit parameters collected in Table 1 must be taken as indicative values. Whereas agreement between data and model is good in general, the model predicts a slightly steeper increase of with time. Following Hill (33), our model assumes the probability that a collision between two rods of lengths and results in aggregation varies as As noted by Hill, he did not consider rotational motion or intermolecular excluded volume of rods (33). Thus, it seems reasonable that the length dependence of would deviate from his prediction. In fact, treating the exponent of as a free parameter yields a better fit to with (Fig. S6). This aspect is further discussed in Supporting Information, Justification of Number of Free Parameters and Alternative Fit.
Fig. S6.
Fit with modified and p = 6. Symbols and lines have the same meaning as in Fig. 5 of the main text.
Conclusions
We investigate the assembly of vimentin IF proteins into filaments in their native state, i.e., without labeling, staining, or adsorption to substrates. In situ observation of the assembly process is enabled by using multiangle, time-resolved SLS and DLS. Our kinetic model describes the two stages of the protein association: Lateral assembly of the rod-shaped subunits dominates growth for the first minute and end-to-end assembly of the emerging ULFs dominates for times longer than 10 min. Our datasets reveal average numbers of five to nine tetramers per cross-section, which is in agreement with previous results.
Materials and Methods
Preparation and Purification of Vimentin Protein.
Human vimentin protein was recombinantly expressed in Escherichia coli and was purified after initial expression from inclusion bodies as described elsewhere (40). The quality of the protein was determined by SDS polyacrylamide gel electrophoresis (SDS/PAGE). Vimentin was stored at −80 °C in 8 M urea, 5 mM Tris-hydrochloric acid (Tris⋅HCl) (pH 7.5), 1 mM EDTA, 0.1 mM ethylene glycol tetraacetic acid (EGTA), 1 mM DTT, and 10 mM methyl ammonium chloride (MAC). Before the experiments, vimentin was renatured into tetramers by stepwise dialysis against 2 mM phosphate buffer (PB), pH 7.5, containing 8 M, 4 M, 2 M, and 1 M urea at room temperature for 30 min each. Finally, overnight dialysis into 2 mM PB was performed at 4 °C. All dialysis steps are performed using membranes of 50-kDa cutoff (Spectra/Por7; Spectrum Europe B.V.). For each dataset presented here, the protein concentration was determined by measuring the absorption at 280 nm with UV/visible (UV/Vis) spectroscopy (Nanodrop ND-1000; ThermoScientific Technologies). The concentration of several ( 20) samples was measured before and after filtering to check for possible absorption of protein by the filter but no such effect was found.
Light-Scattering Experiments.
Kinetic SLS and DLS experiments were carried out on an ALV CGS-3 Compact Goniometer System equipped with eight detectors, spaced 8° from each other. A He-Ne laser from Soliton with λ = 632.8 nm was used as the light source. The full accessible q range with this instrument is 0.0046 ≤ q ≤ 0.024 nm−1. For a typical kinetic reading, the starting angle was fixed at 25°, resulting in a q range of 0.0046 ≤ q ≤ 0.017 nm−1. Further details on the instrument can be found in ref. 27. Cylindrical quartz cuvettes of 20 mm diameter, washed with freshly distilled acetone, were used as scattering cells. To study the kinetics of assembly, 3 mL of vimentin solution was filtered into a cuvette, followed by 3 mL of the KCl solution. The cuvette was shaken to promote mixing and placed into the light-scattering instrument and the measurement started. The times from mixing to the first reading are typically 15–30 s. All filters (0.22 μm cellulose ester) were washed with the corresponding solvent before use. A second combined SLS/DLS (ALV-CGS 5000E) instrument with two detectors at a single angle was used for samples that were not time dependent (before the addition of salt) or for measurements with slow kinetics such that no significant change occurred in the typical acquisition time for a scattering curve ( 5 min).
Data Analysis.
Light-scattering data were reduced using standard procedures. The solvent intensity was subtracted from that of the sample. Absolute calibration was performed against toluene. For kinetic readings, where only eight angles are available, and C were obtained from linear regression of Eqs. 1 and 2, setting and = 0 (see Fig. S3). Readings affected by the presence of dust are omitted (see Fig. S4). was obtained from least-squares fitting of Eqs. S8 and S9 (Supporting Information, Application of the Rod Model to Light Scattering). = 0.186 cm3/g (41) was assumed for all samples. For full angular readings, where a wide q range is available, SLS data were fitted either using the above procedure or using a polydisperse form factor as described in Supporting Information, Application of the Rod Model to Light Scattering (see Fig. S1). Fitting of the kinetic data was performed numerically, using the Runge–Kutta method, implemented in Igor Pro v6.36. A detailed description of the fitting procedure is provided in Supporting Information, Kinetic Equations.
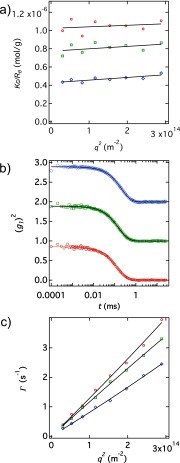
Fig. S3.
Color code: red symbols, t = 0.5 min; green symbols, t = 2 min; blue symbols, t = 35 min. (A) SLS data in the Zimm representation. Lines are fits to Eq. 1 of the main text. (B) Square of the electric field time correlation functions Correlation functions at angle 80° along with fits to Eq. S8. Green and blue curves are shifted vertically by values of 1 and 2, respectively, for clarity. (C) Decay time vs. along with fits to Eq. 2 of the main text.
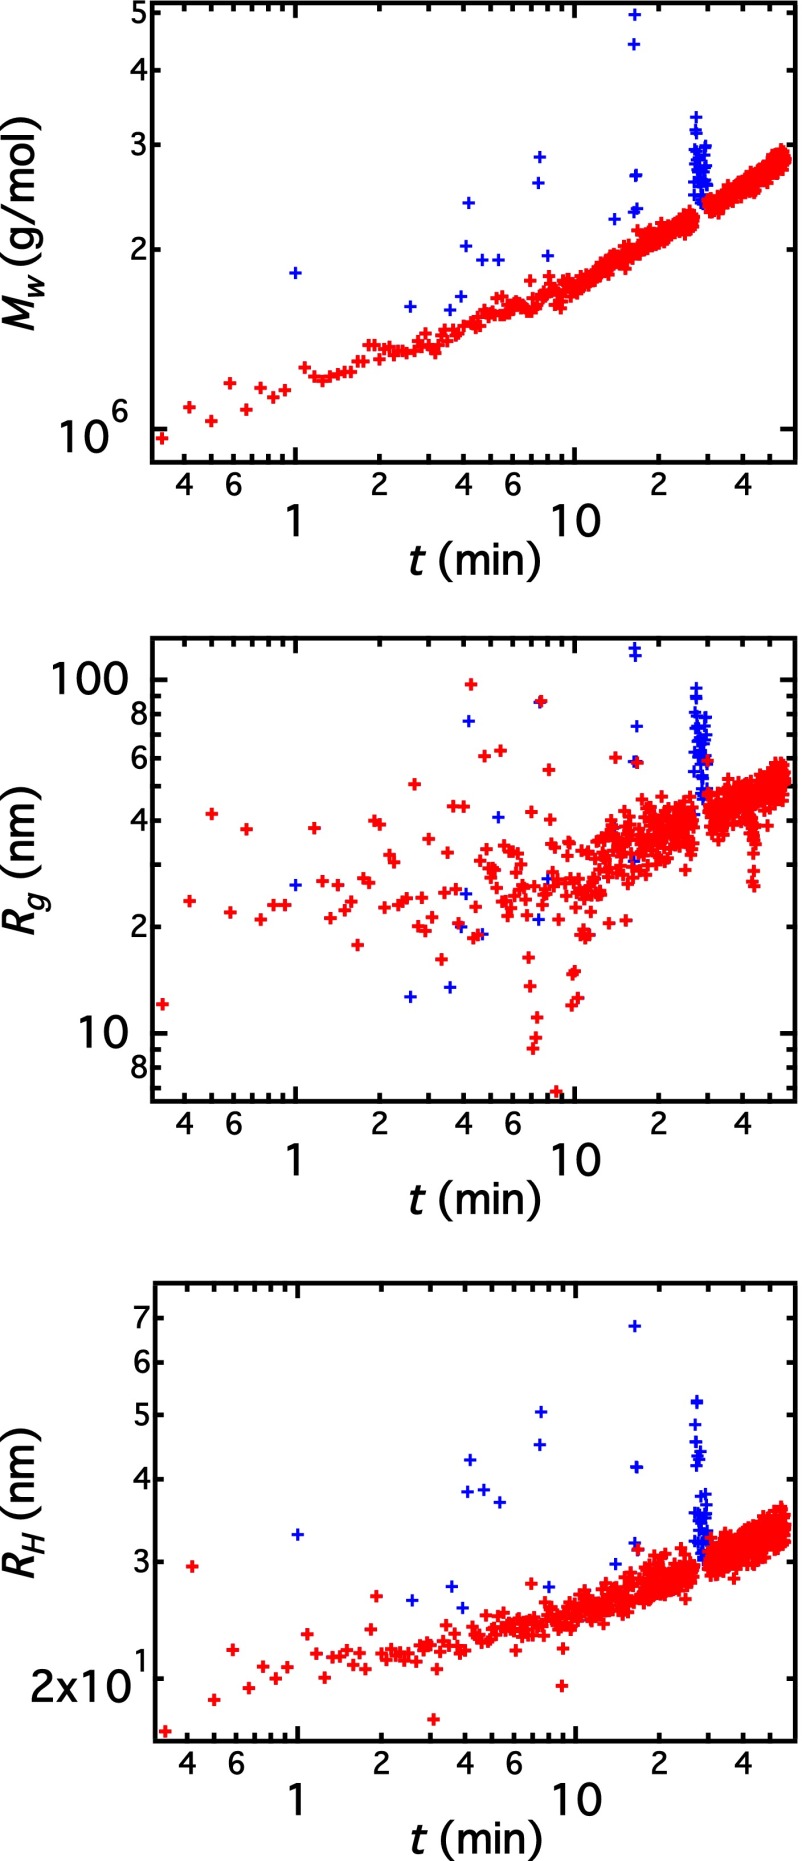
Fig. S4.
and as a function of time for the 0.07-g/L vimentin sample discussed in the main text. Blue points correspond to the deleted data points and red points to the data presented in the main text.
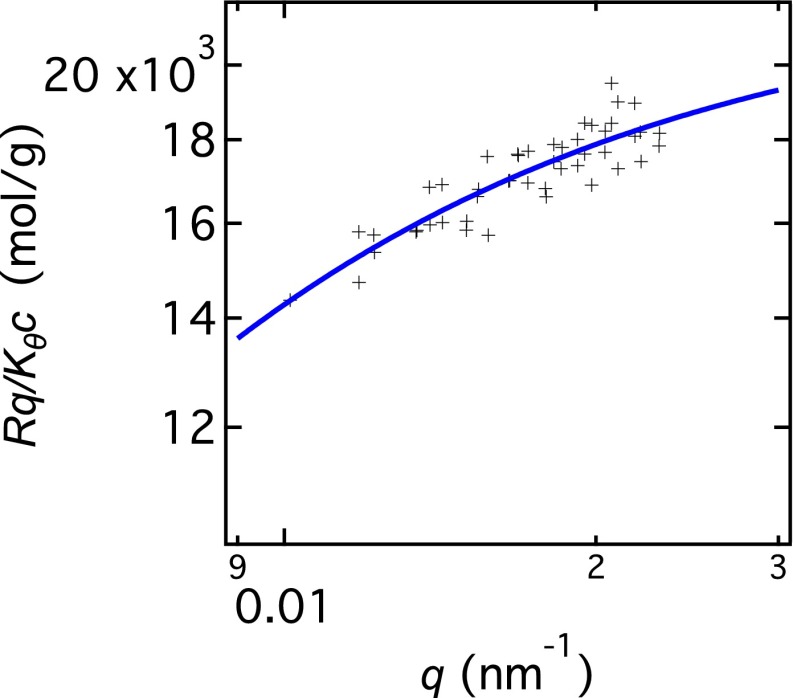
Fig. S1.
Holtzer plot for the sample without filtering corresponding to the highest and in Fig. 2 of the main text. Blue line indicates the fit to the polydisperse rod form factor.
Application of the Rod Model to Light Scattering
The scattering from a dilute solution of weakly interacting particles can be approximated by
| [S1] |
where is the scattering vector magnitude with the scattering angle θ, the refractive index of the solvent and the wavelength of the light λ. is the excess Raleigh ratio and c is the concentration of the solute in grams per liter, K is a constant given by is Avogadro’s number, is the refractive index increment of the solute in the solvent, is the form factor, is the second virial coefficient; is the weight-averaged molecular weight of the solute, defined as
where is the number fraction of a species with molar mass is the z-averaged square radius of gyration, given by
Vimentin assemblies adopt a structure close to that of rigid cylinder-like particles. Hence, Eqs. S1–S6 relate results from SLS to suitable model parameters. The form factor for thin rods of length L is given by (24)
For polydisperse systems, the form factor is the z-average over a distribution of particle sizes,
| [S2] |
where is the weight distribution function of particle length L, which can be modeled by a Schultz–Zimm (SZ) function, based on the weight average of the length (30),
| [S3] |
where is the Gamma function.
The z average of the squared radius of gyration for polydisperse thin rods following an SZ distribution is given by (30)
| [S4] |
The first to third moments of the molar mass for an SZ distribution are related by
| [S5] |
The second virial coefficient for cylinders of diameter d is approximated by (24)
| [S6] |
Dynamic light scattering measures the intensity time correlation function
is the intensity of scattered light at time t and scattering vector magnitude q. The field autocorrelation function can be calculated from with the Siegert relation,
where β is a constant. For a monodisperse solute = is referred to as the inverse decay time. Generally, a distribution of inverse decay times is expected for a polydisperse system:
| [S7] |
may be obtained by Laplace inversion, for example, by using the CONTIN algorithm. A simple approach (15) to extract the moments of the distribution is by a modified cumulant method, where is expanded as
| [S8] |
with and the first, second, and third cumulants, respectively. Due to limitations in data quality, it is common to fit with only the first two cumulants.
The first cumulant is used to calculate the z-averaged diffusion coefficient via Eq. 2 of the main text. The second cumulant in Eq. S8 is the variance of . It can be used to calculate the polydispersity = 1 + of rod-like molecules (14):
| [S9] |
The z-averaged diffusion coefficient for polydisperse cylinders, where the length distribution follows the SZ formula, can be calculated using an expression analogous to Eq. S2 with the diffusion coefficient, in place of P(q,L). The diffusion coefficient of cylinders is approximated using a formula derived by Yoshizaki and Yamakawa (25), based on an interpolation between spheroids and long cylinders,
| [S10] |
where and d is the cylinder’s diameter.
Effect of Filtering
In an effort to understand the variability of our starting solutions we performed the following experiment: 0.1 mL of a 4 g/L vimentin solution was dispensed into a cuvette without filtering, followed by 3.9 mL of filtered buffer. SLS of this sample yields a molar mass of 2.2 × 10⁶ g/mol. The sample was further diluted with filtered solvent to 0.035 g/L and remeasured and no change was found. A Holtzer plot of this sample is shown in Fig. S1 (black crosses) along with the fit to the rod form factor (blue line). The fit was obtained leaving and as free parameters while z was fixed to the value obtained from cumulant analysis. The sample was then filtered through a 0.22-μm filter, resulting in a significantly less aggregated ( 106 g/mol) sample. The decrease in is accompanied by a corresponding decrease in which yields a constant within experimental error if a rigid structure is assumed. The constant value of suggests a longitudinal breakage of aggregates rather than lateral disaggregation. A second filtration did not induce further disaggregation. The results of these experiments are summarized in Table S1.
Zimm Plots of Dilution Series of Vimentin in Sodium Phosphate Buffer
Preparation of solutions of tetrameric vimentin in sodium phosphate buffer turned out to result in oligomers of the tetramers. To determine whether the oligomers are stable or depend on vimentin concentration, two vimentin solutions were used as stock solutions for two dilution series. Fig. S2 shows static and dynamic Zimm plots for two dilution series, including fits to Eqs. 1 and 2 in the main text with an added term in Crucially, parameters and can be obtained if the aggregation state is independent of concentration. Both series show a positive virial coefficient typical for stable entities. The stability of our solutions was further confirmed by the constant observed for a sample stored in a light-scattering cuvette at room temperature for 1 wk. Further, the values of are calculated using Eq. S6 for samples 1 and 2 as 3 ± 1 × 10⁻⁷ mol⋅L⋅g−2 and 5 ± 2 × 10⁻⁷ mol⋅L⋅g−2, respectively, with d being extracted from Eq. S10 integrated over the SZ distribution that was fixed at the corresponding experimental and These values agree with the measured values within experimental error. The agreement between measured and calculated values for suggests that no concentration-dependent aggregation occurs: If samples were significantly more aggregated as the concentration increased, an abnormally low value for would result. Conversely, if aggregation increased upon dilution, a higher than expected value of would be measured. The results of these datasets, along with those of readings at single concentrations, are summarized in Table S2. Together with the results in Table S1, these are plotted in Fig. 2 of the main text.
Evaluation of SLS and DLS Curves in Kinetic Runs
Fig. S3A shows the scattering intensity in the Zimm representation for the 0.07-g/L kinetic run at three different times along with the line of best fit, corresponding to Eq. 1 of the main text with Fig. S3B shows three field autocorrelation functions as squares taken at nm2 (θ = 80°) for the same three times used in Fig. S3A along with fits to Eq. S8. Fig. S3C shows the decay time as a function of for the same times used in Fig. S3A, along with the fit to Eq. 2 of the main text (setting = 0).
Data Cleaning
Fig. S4 plots and as a function of time for the 0.07-g/L sample discussed in the main text. Points where the scattering signal is dominated by the presence of dust, as manifested by an artificially large were omitted in Figs. 2–5 of the main text; they are indicated as blue crosses. Additionally, due to the large scatter in every five points in Fig. S4 were binned into one for in Fig. 2 of the main text.
Kinetic Equations
The kinetic equations describing the reaction scheme outlined in the main text can be found in ref. 23. Pallitto and Murphy (23) consider a more complicated scheme, which reduces to our model when only the last two steps are used. This is equivalent to setting to zero all reaction constants except and in ref. 23. Further, we consider the reaction order in step one (Fig. 1 of the main text) to be equal to p, which corresponds to setting in the model of Pallitto and Murphy. The equations describing the time dependence of the concentration of nonlaterally assembled species and laterally assembled species where the subscript refers to the longitudinal degree of polymerization (i.e., the number of length increments corresponding to the elongation by an additional tetramer in or by an additional ULF in ), are given by
| [S11] |
| [S12] |
The first term in Eq. S12 accounts for the filaments generated from lateral association of the “f” species. The second and third terms correspond to the loss and generation of filaments of longitudinal degree of polymerization i due to end-to-end assembly of other filaments, respectively. If a polydisperse distribution of the species f is assumed, the first term in Eq. S12 must be interpreted carefully. Because f-type oligomers of any length can laterally assemble with others of different length, the laterally assembled filaments of p oligomers (which account for the first term in Eq. S12) will have a heterogeneous mass per unit length along the respective filament. Thus, refers to the concentration of ULFs that contain at least one oligomer set by the prefactor (outside the big brackets) in the first term of Eq. S12. The nature of the initially occurring f and “F” species can be adjusted to the measured values of and (Fig. 2 of the main text) for the sample selected. The smallest soluble vimentin unit is the tetramer, with L = 60 nm and = 214,000 g/mol. Given that these are values commensurate with the observed and values, the discrete nature of vimentin should be considered for the evaluation of the initial state of the respective kinetic run. The effective cross-sectional diameter of tetramers and longitudinal multifolds thereof is taken to be nm (11). The diameter of ULF is left as a free parameter. The end-to-end aggregation constant is given by the product of the sum of diffusion coefficients of two molecules the distance between centers required for a collision to occur and the probability that a collision results in aggregation The latter was calculated by Hill (33), who predicted a scaling of Combining the expressions of Hill for and and Tirado and de la Torre’s (26) expression for Di and Dj, the following relation is obtained (23),
| [S13] |
where η is the kinematic viscosity of the solvent, is the Boltzmann constant, is the product of the maximum distance and the maximum angle at which a collision between two filaments results in aggregation, and and are the lengths of the reacting filaments. For simplicity was reduced in the model of Pallitto and Murphy (23) to
| [S14] |
where is the number-averaged length of the F species. Eq. S14 can be further approximated as
| [S15] |
where A and μ are parameters set so that closely matches the expression in large brackets in Eq. S14. A and μ are therefore fully set by and As an example, for the 0.07-g/L kinetic run we use and with in units of decimeters. For our experiments, where does not vary by more than an order of magnitude, using this approximation never leads to an error in greater than
The nth moment of the concentration of the two species is defined as
The equations describing the zeroth to second moments of the concentration of the nonlaterally assembled species (subscript f) and the laterally assembled species (subscript F) are given as
| [S16] |
| [S17] |
| [S18] |
| [S19] |
| [S20] |
| [S21] |
The initial conditions are given by
where is the total concentration of vimentin in f species expressed as (number of tetramers in initially existing f species)/liter, is the molar mass of a tetramer, and (0) and (0) are the number- and weight-averaged molecular weights of the f species at time 0, respectively. The starting conditions for and are calculated in an analogous manner,
where is the total concentration of vimentin in F species expressed as (number of tetramers assembled in initially existing filaments)/liter and is the longitudinal degree of polymerization of the initially existing filaments F, expressed as number of ULFs per filament.
The kinetic model applied in the present work represents a special case of the process determined by Eqs. S11 and S12 where we assume a simple scenario to fix the initial state of our kinetic model: a bimodal population consisting of (i) tetramers and (ii) an oligomeric ULF with a longitudinal degree of polymerization of This leads to the simplified versions of Eqs. S11 and S12,
| [S22] |
| [S23] |
where is the Kronecker delta function, and to the simple starting conditions for the f species of (0) = (0) = and = Eqs. S16–S21 and the starting conditions for and remain unaffected. The mass per unit length of the ULFs generated by the lateral assembly of tetramers is p times that of a tetramer. The scenario outlined above is capable of reproducing the vs. results collected in Fig. 2 of the main text. The number fraction of oligomeric ULFs is approximately constant at 0.5% (corresponding to mass fractions of 2% for the least aggregated samples and 10% for the more aggregated ones) and the variation in and is caused by the degree of longitudinal assembly of filaments. For the three samples used for kinetic runs in the main text, the longitudinal degree of polymerization of the filaments present at t = 0 is The mass fractions of filaments at 0 are 2.3% for the 0.09-g/L sample, 2.4% for the 0.07-g/L sample, and 7% for the 0.06-g/L sample.
for the entire ensemble is calculated from
which allows us to fit data obtained from light-scattering experiments with the above model.
To be able to also fit we assume that the filaments of species F are distributed according to the SZ formula (Eq. S3). The polydispersity of the filament population is calculated using
Once the polydispersity is known, the z-averaged square radius of gyration for each population can be calculated according to Eq. S4. The z-averaged squared radii of gyration for the f and F species are and respectively. We note that in the scenario applied in the present work = 17 nm (pure tetramers) and independent of time. Due to the partial overlap between ULFs, the mass per unit length of the filaments which is required to calculate is a function of the filament length We approximate the weight-averaged length of the filaments as where is the average mass per unit length of the ensemble at a given time. is given by nm, where is the longitudinal degree of polymerization for the filaments at an arbitrary time. For nondiscrete values of polynomial interpolation is used. The z-averaged square radius of gyration for the entire ensemble, which is measured by static light scattering, is given by
The z-averaged diffusion coefficient for the f species and for the F species can be calculated by integrating Eq. S10 over the length distribution [in an analogous way to Eq. S2 with instead of ]. This requires input of the weight-averaged lengths for the tetramer and filaments and respectively, and the polydispersities for both populations. The z-averaged diffusion coefficient for the full ensemble can be calculated as
Eqs. S16–S21 cannot, to the best of our knowledge, be solved analytically for the general case of finite and 0. For the special case where end-to-end elongation does not take place (), the above equations can be solved to give
| [S24] |
| [S25] |
| [S26] |
| [S27] |
| [S28] |
| [S29] |
We can also obtain an analytical solution when The initial conditions have to be changed to reflect the initial population of laterally assembled filaments. The analytical expressions for and are then given by
| [S30] |
| [S31] |
| [S32] |
where
To fit data, we solve Eqs. S16–S21 and S15 numerically, using a Runge–Kutta 4 method implemented in Igor Pro v6.36. The time step was varied depending on sample and fit parameters between 0.03 s and 0.01 ms. We use the values of p and obtained from first fitting Eqs. S24–S29 as our starting guesses. The initial conditions are obtained from the values of and measured for the sample before salt addition. We did not implement a least-squares minimization routine; rather, the parameters were adjusted by eye until they gave a good fit to the data. This typically took on the order of 20 iterations.
Multiplicity of Fits
Fig. S5 shows fits to and for the 0.07-g/L sample discussed in the main text. The parameter p was fixed to 5, 6, and 7 and and were adjusted to fit the data for 100 min (before precipitation). Whereas the quality of the fits to remains similar for all three p values, the fits to vary considerably, and p = 6 yields the best fit to the vs. t data. We note here that the calculated value of initially decreases as step one proceeds. The reason for this is that when tetramers assemble laterally to form a ULF, their relative contribution to increases and therefore the relative contribution of the longer species (trimers F3 in this case) decreases. This decrease occurs only at very early times; then levels off and eventually increases due to end-to-end elongation. Our data do not permit checking this feature of our model.
Justification of Number of Free Parameters and Alternative Fit
Number of Free Parameters.
The model presented uses four free parameters: two reaction constants and one for each reaction step; the degree of laterally assembled tetramers in filaments, p (or alternatively the mass per unit length of the filaments); and one hydrodynamic parameter, We judge this to be an appropriate number of free parameters relative to the amount of data presented. A minimum of two reaction constants are required to model a two-step process and p is fully determined by the correlation between and Further, a hydrodynamic diameter (which is not available from the literature and is expected to deviate significantly from the cross-sectional diameter measured by electron microscopy or calculated from p or ) is required to fit the vs. time data. Once the optimized value of is obtained, we rerun the procedure outlined in Supporting Information, Multiplicity of Fits for and and find that using this new value has virtually no effect on the quality of the fits. is therefore independently set by the vs. time data. Compared with other techniques such as UV-Vis spectroscopy, which measures concentrations of filaments, or electron microscopy, which typically yields the relative length (and/or width) distribution of filaments (without having access to absolute concentrations of a given species), combined SLS/DLS provides mass, structural, and hydrodynamic data on an absolute scale. As explained in Supporting Information, Multiplicity of Fits, if one considers only one of either parameter or for example p can be set to any reasonable value without the fit being significantly affected. Availability of both and from SLS resolves a final value for p. If is obtained from electron microscopy images at variable time, its kinetic interpretation, which has to be inevitably based on monomer loss and particle growth in terms of mass values, requires an additional guess on the mass per unit filament length.
In conclusion, the different parameters are set by either independent datasets (p and ) or different time regions ( and ). Compared with other techniques commonly used to study protein self-assembly, time-resolved–SLS/DLS yields relatively extensive datasets where different quantities (mass, length, and diffusion) are measured.
Use of a Modified Exponent Fit.
The fit presented in the main text was carried out with as few free parameters as possible, with deviations of the fit from experimental data not larger than 20% (except for recorded at very early times where the scatter in the data is large). We now consider the inclusion of an additional free parameter to improve the agreement with our data. Hill (33) estimated the probability that a collision between two rods with lengths and results in aggregation as In his calculation, rotational motions of rods and intermolecular excluded volume were neglected. Even if his calculation is exact for rods, the predicted scaling may be modified if additional interactions like, for instance, electrostatic or van der Waals interactions exist between the ends of two rods. It therefore seems possible that the true exponent for could deviate significantly from Hill’s (33) value of 2. We have therefore also fitted our data using where α is left as a free parameter. The best-fit value of significantly deviates from Hill’s prediction and yields a correct description of and as a function of time, shown in Fig. S6. All data ( and ) in the elongation-dominated regime ( min) never deviate by more than 10% from the fit. The deviation of the exponent can be interpreted as a length dependence of meaning that the maximum distance or angle between two colliding rods decreases with rod length as An exponent of would have a simple geometrical interpretation: A sphere with diameter L is drawn around each of the reacting filaments involved in an elongation step. Along with this, two identical surface areas (independent of rod length) are fixed at opposing sides of each sphere corresponding approximately to the ends of the rods. A collision between these spheres results in aggregation when the two drawn surface areas contact without the spheres overlapping. This schematic leads to a dependence on length of the maximum angle between rods for a successful collision of and and thus to an exponent of α = 4 . However, we consider the addition of this parameter as a first hint for a more complicated elongation mechanism as has been so far applied and therefore we have opted to present the fit with in Fig. S6 as an alternative fit to the one of the more simple model shown in the main text.
Comparison with Literature Data.
Portet (34) carefully analyzed the filament length distribution data of vimentin at several times in the interval of 60–14,400 s in 0.1 M KCl at 37 °C by means of images from electron microscopy, atomic force microscopy, and total internal reflection fluorescence microscopy. Fits with a model similar to ours yielded an elongation rate constant [ for model I in ref. 34, which is equivalent to /8 in our model] that increased with increasing reaction time, which is similar to using an exponent of This trend is opposite to our modified fit where a best fit is obtained with α = 3.5, corresponding to a [in the terminology of Portet (34)] decreasing with time. Although we do not know the cause of this disagreement, it is worth noting that both studies suggest that the elongation step for vimentin is more complex than simple end-to-end aggregating rods.
Variability with Concentration
Fig. S7A shows vs. time for the three different concentrations studied. A significant variation in the kinetics between the 0.07-g/L and the 0.09-g/L samples can be observed. Fig. S7B shows a plot of vs. for the three kinetic runs, along with limiting power laws of which is the functional form expected for rigid rods of constant polydispersity. The mass per unit length determines the value of k given a value for the polydispersity. The aggregation process remains qualitatively the same for all samples as seen in Fig. S7 C and D: First, a lateral aggregation step occurs, signaled by a large increase in without any significant increase of Eventually, the increase in coupled with an increase in the ρ parameter signals elongation, with a characteristic for end-to-end association of rods. Fig. S7B shows that the mass per unit length for the 0.09 sample is 1.5 times and 1.8 times larger than those for the 0.07-g/L and 0.06-g/L samples, respectively. This difference could be due to an error in the determination of concentration of our protein solutions, which in turn affects the calculated values of (but not ). Specifically, if the actual concentrations for the 0.06-g/L and 0.07-g/L samples are 30–40% lower than the value we used for our calculations, and the concentration of the 0.09-g/L sample is 30% higher, the three curves overlay and the p values obtained from our model fits coincide for all three samples, giving within experimental uncertainty 7–8, in agreement with previous reports (4). The fits shown in Fig. S7 C and D refer to the experimentally determined protein concentration; however, the quality of the fits to or is not affected significantly by a change of 30% in the assumed concentration set to make all trends compatible with a unique p = 8.
Supplementary Material
Acknowledgments
We thank Harald Herrmann for fruitful discussions, Susanne Bauch for technical assistance, and Sanjib Saha for assistance with the SLS/DLS measurements. This work was supported by the German Research Foundation (DFG) in the framework of SFB 755 “Nanoscale Photonic Imaging,” project B07 and DFG KO 3572/5-1, as well as the Helmholtz Gemeinschaft in the framework of the Virtual Institute VH-VI-403 “In-Situ Nano-Imaging of Biological and Chemical Processes.”
Footnotes
The authors declare no conflict of interest.
This article is a PNAS Direct Submission.
This article contains supporting information online at www.pnas.org/lookup/suppl/doi:10.1073/pnas.1606372113/-/DCSupplemental.
References
- 1.Fletcher DA, Mullins RD. Cell mechanics and the cytoskeleton. Nature. 2010;463(7280):485–492. doi: 10.1038/nature08908. [DOI] [PMC free article] [PubMed] [Google Scholar]
- 2.Omary MB, Ku NO, Strnad P, Hanada S. Toward unraveling the complexity of simple epithelial keratins in human disease. J Clin Invest. 2009;119(7):1794–1805. doi: 10.1172/JCI37762. [DOI] [PMC free article] [PubMed] [Google Scholar]
- 3.Herrmann H, Aebi U. Intermediate filament assembly: Fibrillogenesis is driven by decisive dimer-dimer interactions. Curr Opin Struct Biol. 1998;8(2):177–185. doi: 10.1016/s0959-440x(98)80035-3. [DOI] [PubMed] [Google Scholar]
- 4.Herrmann H, et al. Structure and assembly properties of the intermediate filament protein vimentin: The role of its head, rod and tail domains. J Mol Biol. 1996;264(5):933–953. doi: 10.1006/jmbi.1996.0688. [DOI] [PubMed] [Google Scholar]
- 5.Brennich ME, et al. Dynamics of intermediate filament assembly followed in micro-flow by small angle X-ray scattering. Lab Chip. 2011;11(4):708–716. doi: 10.1039/c0lc00319k. [DOI] [PubMed] [Google Scholar]
- 6.Brennich ME, et al. Impact of ion valency on the assembly of vimentin studied by quantitative small angle X-ray scattering. Soft Matter. 2014;10(12):2059–2068. doi: 10.1039/c3sm52532e. [DOI] [PubMed] [Google Scholar]
- 7.Hémonnot CYJ, Mauermann M, Herrmann H, Köster S. Assembly of simple epithelial keratin filaments: Deciphering the ion dependence in filament organization. Biomacromolecules. 2015;16(10):3313–3321. doi: 10.1021/acs.biomac.5b00965. [DOI] [PubMed] [Google Scholar]
- 8.Strelkov SV, Schumacher J, Burkhard P, Aebi U, Herrmann H. Crystal structure of the human lamin A coil 2B dimer: Implications for the head-to-tail association of nuclear lamins. J Mol Biol. 2004;343(4):1067–1080. doi: 10.1016/j.jmb.2004.08.093. [DOI] [PubMed] [Google Scholar]
- 9.Kapinos LE, et al. Characterization of the head-to-tail overlap complexes formed by human lamin A, B1 and B2 “half-minilamin” dimers. J Mol Biol. 2010;396(3):719–731. doi: 10.1016/j.jmb.2009.12.001. [DOI] [PubMed] [Google Scholar]
- 10.Meier M, et al. Vimentin coil 1aa molecular switch involved in the initiation of filament elongation. J Mol Biol. 2009;390(2):245–261. doi: 10.1016/j.jmb.2009.04.067. [DOI] [PubMed] [Google Scholar]
- 11.Sokolova AV, et al. Monitoring intermediate filament assembly by small-angle x-ray scattering reveals the molecular architecture of assembly intermediates. Proc Natl Acad Sci USA. 2006;103(44):16206–16211. doi: 10.1073/pnas.0603629103. [DOI] [PMC free article] [PubMed] [Google Scholar]
- 12.Winheim S, et al. Deconstructing the late phase of vimentin assembly by total internal reflection fluorescence microscopy (TIRFM) PLoS One. 2011;6(4):e19202. doi: 10.1371/journal.pone.0019202. [DOI] [PMC free article] [PubMed] [Google Scholar]
- 13.Nöding B, Köster S. Intermediate filaments in small configuration spaces. Phys Rev Lett. 2012;108(8):088101. doi: 10.1103/PhysRevLett.108.088101. [DOI] [PubMed] [Google Scholar]
- 14.Selser J. A determination of polymer number-averaged and weight-averaged molecular weight using photon correlation spectroscopy. Macromolecules. 1979;12(5):909–916. [Google Scholar]
- 15.Hassan PA, Kulshreshtha SK. Modification to the cumulant analysis of polydispersity in quasielastic light scattering data. J Colloid Interface Sci. 2006;300(2):744–748. doi: 10.1016/j.jcis.2006.04.013. [DOI] [PubMed] [Google Scholar]
- 16.Holthoff H, Egelhaaf SU, Borkovec M, Schurtenberger P, Sticher H. Coagulation rate measurements of colloidal particles by simultaneous static and dynamic light scattering. Langmuir. 1996;12(23):5541–5549. [Google Scholar]
- 17.Jouault N, Moulin E, Giuseppone N, Buhler E. Light scattering strategy for the investigation of time-evolving heterogeneous supramolecular self-assemblies. Phys Rev Lett. 2015;115(8):085501. doi: 10.1103/PhysRevLett.115.085501. [DOI] [PubMed] [Google Scholar]
- 18.Tomski SJ, Murphy RM. Kinetics of aggregation of synthetic β-amyloid peptide. Arch Biochem Biophys. 1992;294(2):630–638. doi: 10.1016/0003-9861(92)90735-f. [DOI] [PubMed] [Google Scholar]
- 19.Lomakin A, Teplow DB, Kirschner DA, Benedek GB. Kinetic theory of fibrillogenesis of amyloid β-protein. Proc Natl Acad Sci USA. 1997;94(15):7942–7947. doi: 10.1073/pnas.94.15.7942. [DOI] [PMC free article] [PubMed] [Google Scholar]
- 20.Lomakin A, Chung DS, Benedek GB, Kirschner DA, Teplow DB. On the nucleation and growth of amyloid beta-protein fibrils: Detection of nuclei and quantitation of rate constants. Proc Natl Acad Sci USA. 1996;93(3):1125–1129. doi: 10.1073/pnas.93.3.1125. [DOI] [PMC free article] [PubMed] [Google Scholar]
- 21.Walsh DM, et al. Amyloid β-protein fibrillogenesis. Structure and biological activity of protofibrillar intermediates. J Biol Chem. 1999;274(36):25945–25952. doi: 10.1074/jbc.274.36.25945. [DOI] [PubMed] [Google Scholar]
- 22.Kusumoto Y, Lomakin A, Teplow DB, Benedek GB. Temperature dependence of amyloid β-protein fibrillization. Proc Natl Acad Sci USA. 1998;95(21):12277–12282. doi: 10.1073/pnas.95.21.12277. [DOI] [PMC free article] [PubMed] [Google Scholar]
- 23.Pallitto MM, Murphy RM. A mathematical model of the kinetics of β-amyloid fibril growth from the denatured state. Biophys J. 2001;81(3):1805–1822. doi: 10.1016/S0006-3495(01)75831-6. [DOI] [PMC free article] [PubMed] [Google Scholar]
- 24.Yamakawa H. Modern Theory of Polymer Solutions. Harper & Row Publishers, Inc; New York: 1971. [Google Scholar]
- 25.Yoshizaki T, Yamakawa H. Dynamics of spheroid-cylindrical molecules in dilute solution. J Chem Phys. 1980;72(1):57–69. [Google Scholar]
- 26.Tirado MM, de la Torre JG. Rotational dynamics of rigid, symmetric top macromolecules. Application to circular cylinders. J Chem Phys. 1980;73(4):1986–1993. [Google Scholar]
- 27.Michels R, Sinemus T, Hoffmann J, Brutschy B, Huber K. Co-aggregation of two anionic azo dyestuffs at a well-defined stoichiometry. J Phys Chem B. 2013;117(28):8611–8619. doi: 10.1021/jp403985m. [DOI] [PubMed] [Google Scholar]
- 28.Cravillon J, et al. Controlling zeolitic imidazolate framework nano-and microcrystal formation: Insight into crystal growth by time-resolved in situ static light scattering. Chem Mater. 2011;23(8):2130–2141. [Google Scholar]
- 29.Burchard W. Static and dynamic light scattering from branched polymers and biopolymers. Adv Polym Sci. 1983;48:1–124. [Google Scholar]
- 30.Schmidt M. Combined integrated and dynamic light scattering by poly (γ-benzyl glutamate) in a helocogenic solvent. Macromolecules. 1984;17(4):553–560. [Google Scholar]
- 31.Saldanha O, Brennich ME, Burghammer M, Herrmann H, Köster S. The filament forming reactions of vimentin tetramers studied in a serial-inlet microflow device by small angle x-ray scattering. Biomicrofluidics. 2016;10(2):024108. doi: 10.1063/1.4943916. [DOI] [PMC free article] [PubMed] [Google Scholar]
- 32.Liu J, Rieger J, Huber K. Analysis of the nucleation and growth of amorphous CaCO3 by means of time-resolved static light scattering. Langmuir. 2008;24(15):8262–8271. doi: 10.1021/la8006519. [DOI] [PubMed] [Google Scholar]
- 33.Hill TL. Length dependence of rate constants for end-to-end association and dissociation of equilibrium linear aggregates. Biophys J. 1983;44(2):285–288. doi: 10.1016/S0006-3495(83)84301-X. [DOI] [PMC free article] [PubMed] [Google Scholar]
- 34.Portet S. Dynamics of in vitro intermediate filament length distributions. J Theor Biol. 2013;332:20–29. doi: 10.1016/j.jtbi.2013.04.004. [DOI] [PubMed] [Google Scholar]
- 35.Portet S, et al. Vimentin intermediate filament formation: In vitro measurement and mathematical modeling of the filament length distribution during assembly. Langmuir. 2009;25(15):8817–8823. doi: 10.1021/la900509r. [DOI] [PubMed] [Google Scholar]
- 36.Kirmse R, et al. A quantitative kinetic model for the in vitro assembly of intermediate filaments from tetrameric vimentin. J Biol Chem. 2007;282(25):18563–18572. doi: 10.1074/jbc.M701063200. [DOI] [PubMed] [Google Scholar]
- 37.Hohenadl M, Storz T, Kirpal H, Kroy K, Merkel R. Desmin filaments studied by quasi-elastic light scattering. Biophys J. 1999;77(4):2199–2209. doi: 10.1016/S0006-3495(99)77060-8. [DOI] [PMC free article] [PubMed] [Google Scholar]
- 38.Nöding B, Herrmann H, Köster S. Direct observation of subunit exchange along mature vimentin intermediate filaments. Biophys J. 2014;107(12):2923–2931. doi: 10.1016/j.bpj.2014.09.050. [DOI] [PMC free article] [PubMed] [Google Scholar]
- 39.Herrmann H, Aebi U. Intermediate filament assembly: Temperature sensitivity and polymorphism. Cell Mol Life Sci. 1999;55(11):1416–1431. doi: 10.1007/s000180050382. [DOI] [PMC free article] [PubMed] [Google Scholar]
- 40.Herrmann H, Kreplak L, Aebi U. Isolation, characterization, and in vitro assembly of intermediate filaments in intermediate filament cytoskeleton. Methods Cell Biol. 2004;78:3–24. doi: 10.1016/s0091-679x(04)78001-2. [DOI] [PubMed] [Google Scholar]
- 41.Zhao H, Brown PH, Schuck P. On the distribution of protein refractive index increments. Biophys J. 2011;100(9):2309–2317. doi: 10.1016/j.bpj.2011.03.004. [DOI] [PMC free article] [PubMed] [Google Scholar]
Associated Data
This section collects any data citations, data availability statements, or supplementary materials included in this article.


