Abstract
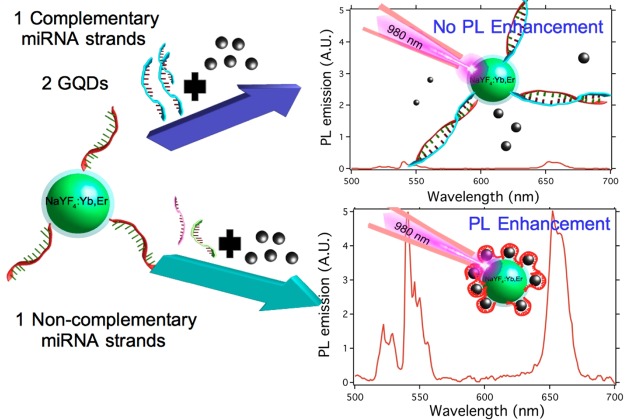
We developed a sensor for the detection of specific microRNA (miRNA) sequences that was based on graphene quantum dots (GQDs) and ssDNA-UCNP@SiO2. The proposed sensor exploits the interaction between the sp2 carbon atoms of the GQD, mainly π–π stacking, and the DNA nucleobases anchored on the upconversion nanoparticles (UCNPs). This interaction brings the GQD to the surface of the ssDNA-UCNP@SiO2 system, enhancing the upconversion emission. On the other hand, hybridization of the single-stranded DNA (ssDNA) chains anchored on the nanoparticles with their complementary miRNA sequences blocks the capacity of the UCNPs to interact with the GQD through π–π stacking. That gives as result a reduction of the fluorescent enhancement, which is dependent on the concentration of miRNA sequences. This effect was used to create a sensor for miRNA sequences with a detection limit of 10 fM.
Keywords: upconversion, nanoparticles, graphene quantum dots, energy transfer, miRNA sensor
Introduction
The microRNAs (miRNAs) are noncoding sequences of 20–25 nucleotides, and they are important in the transcriptional mechanisms of gene expression.1 It has been demonstrated that many viruses, such as Human Cytomegalovirus, Epstein–Barr virus, HIV, Human Herpesvirus, Ebola, Hepatitis C, or Dengue, can encode and express specific viral miRNAs that help the viral replication, facilitating the host infection. For instance, in the case of HIV-1, the miRNA HIV-1-miR-Tar-5p reduces cell apoptosis and helps propagation of the virus.2−5 These miRNAs provide a mechanism to extend the life of the infected cells with the aim of increasing viral replication.6 An interesting feature of miRNA is that they are expressed throughout the entire life of the virus, in contrast with antibodies that only appear in detectable concentrations only after 10–20 days of infection.7 In addition, miRNAs are by far more stable than mRNA sequences and can be found in sera samples, at relatively high concentration, opening the possibility for use as early diagnosis biomarkers. For instance, cells infected by HIV-1 expel exosomes loaded with Tar miRNAs at concentrations as high as 1.6 × 10⁻¹⁴ M.6 However, because of the small amounts of these miRNAs in the cells, their monitoring needs sensitive and advanced detection techniques, which limits their application in clinical assays.8 These problems have prompted scientists to develop simple techniques that do not require the use of enzymatic transcription- and amplification-coupled reactions to detect the presence of specific sequences of miRNA strands in sera, blood, saliva, or other samples.9
In the last years, upconversion nanoparticles (UCNPs) have demonstrated their tremendous potential for biomedical applications as superb molecular beacons that can be used for analytical purposes.10−16 UCNPs are materials that are able to absorb low-energy photons (two or more) and emit one at higher energy.17 This phenomenon is due to electronic transitions of the inner 4f–4f orbitals and is favored by the shielding effect of the 5s and 5p orbitals.18 However, the most important feature that makes the UCNPs an alternative to classical organic dyes is the excitation wavelength, which is located around 980 nm in the near-infrared (NIR) region. At this excitation wavelength, biomolecular autofluorescence is avoided, while a lower light scattering compared with UV–vis radiation is obtained. This results in enhancement of the signal-to-noise ratio using UCNPs.14,19 However, one of the major drawbacks of these kinds of materials is their inherent low quantum yield. For instance, bulk NaYF4:Yb,Er under irradiation at 975 nm presented 5% upconversion quantum yields,20 while the corresponding NaYF4:Yb,Er nanoparticles exhibited size-dependent quantum yields. Thus, UCNPs with a diameter of 30 nm presented 0.1% quantum yield. Much effort has been devoted to magnifying the quantum yield of upconversion materials, and some of them have been focused on materials that enhance the local electromagnetic field of the nanoparticles. For example, the upconversion efficiency of lanthanide nanoparticles has been increased by a factor between 2 and 8 by concentrating the surface plasmon polaritons.21
Other authors have observed that the upconversion emission can be increased by coupling UCNPs with quantum dots, which can act at the intermediate level in the energy-transfer process of Ln3+ ions, resulting in conspicuous enhancement of the upconversion emission.22 Another strategy used to enhance the upconversion efficiency by up to 3000-fold is by coupling UPNPs with organic dyes that absorb and emit in the NIR range. These dyes can be used as antennas, which harvest photons more efficiently than the sensitizer ions (mainly Yb3+) of the UCNP, transferring after that these quanta to the Ln3+ cations.23 Interesting alternatives to the aforementioned organic dyes are the graphene quantum dots (GQDs), with application in sensing,24 that exhibit broad-band emission in the ultraviolet (UV), visible,18 and NIR ranges.25,26 The emission is associated with the wide π-electron delocalization that exists in the structure of the GQD. This property opens the possibility of using GQDs as antennas if they are placed in the proximity of the UCNP surface.
The capacity of sp2 carbon atoms for interacting with single-stranded oligonucleotides (ssDNA or ssRNA) through π–π interactions is well-known. This property could be used to program the assembly of GQDs on the surfaces of ssDNA- or ssRNA-functionalized UCNPs. By contrast, π electrons of the nucleobases of double-stranded DNA (dsDNA) are involved in formation of the duplex via base-stacking interactions and would not allow the assembly of GQDs on the surfaces of UCNPs. Using this approach, it would be possible to design a fluorescence sensor for miRNAs using UCNPs and GQDs. Thus, when the complementary miRNA strand is present, the hybridization process of ssDNA-UCNPs would lead to dsDNA, preventing their interaction with the GQDs. By contrast, reduction of the miRNA concentration would lead to an increment in the number of ssDNA chains that could interact with the GQDs. Hence, by using relative emission/upconversion measurements compared to a reference, it would be possible to determine the presence of complementary miRNA. As a proof of concept, in this work we have studied the capacity of the proposed platform to detect the presence of a specific miRNA sequence named DENV-2-vsRNA5,27 which appears during the Dengue infection. This work could pave the way to creating a fast, cheap, and reproducible methodology for rapid analysis of infections through the detection of miRNA sequences without the requirement for transcription steps.
Experimental Section
Materials
ErCl3·6H2O (99.9%), YbCl3·6H2O (99.99%), YCl3·6H2O (99.9%), oleic acid (90%), ammonium fluoride (98%), sodium hydroxide (98%), methanol (99.9%), anhydrous N,N-dimethylformamide, 99.8%, 1-octadecene (80%), n-hexane (95%), tetraethyl orthosilicate (99.99%), succinic anhydride (99%), an ammonium hydroxide solution (30%), IGEPAL CO-520, (3-aminopropyl)triethoxysilane (99%), phosphate-buffered saline tablets (PBS), 1-ethyl-3-[3-(dimethylamino)propyl]carbodiimide (99%), and N-hydroxysulfosuccinimide (98%) were acquired from Sigma-Aldrich and used as received.
The PBS solutions were prepared by dissolving the tablet following the manufacturer’s specifications. The DNA sequences were purchased from ATDBio, while the RNA sequences were ordered from Thermo Fisher Scientific. The ssDNA probe sequence was 5′-aminohexyl-GGCTTAATCCGACCTGACTTCTG-3′, and the target miRNA sequence was 5′-CAGAAGUCAGGUCGGAUUAAGCC-3′. Random sequences (noncomplementary miRNA sequences) were extracted from sera using the miRNeasy Mini Kit from Quiagen following the manufacturer’s protocol.
Characterization Methods
Upconversion photoluminescent spectra were collected using a PTI spectrofluorometer coupled to a 980 nm continuous-wave (CW) laser with a tunable output power between 0 and 3 W (Coherent, USA). The UV–vis spectra were collected with a Ocean Optics model USB2000+ spectrometer, and the NIR spectra were collected with a BWTEK model BTC261 spectrometer with an InGaAs detector. The electron microscopy study was performed in transmission mode (TEM) using a JEM 1010 microscope (JEOL, Japan; 80 kV) equipped with a digital camera (Olympus, Megaview II). A Malvern Nano-ZS instrument was used to perform the ζ-potential measurements. A PHI 5700 (Physical Electronic) spectrometer was used to collect the X-ray photoelectron spectroscopy (XPS) spectra. The elements of interest were analyzed using nonmonochromatic radiation (Mg Kα) with a hemispherical detector, which operated with a pass energy value set at 29.35 eV. The signals were analyzed according the reference C 1s (284.8 eV) using PHI ACESS ESCA-V6.0F software and processed with the MultiPak 8.2B package.
Synthesis of NaYF4:Yb,Er@SiO2 Functionalized with ssDNA
The synthesis of monodisperse ssDNA-NaYF4:Yb,Er@SiO2 was performed by following a previously reported procedure.16
Synthesis of GQDs
The synthesis of GQDs was carried out by a “top-down” hydrothermal method: Graphite (1g, 83 mmol) was dispersed in 50 mL of HF (48%, 1.38 mol), which contained KMnO4 (6 g, 38 mmol), and this mixture was refluxed for 60 min. After cooling to room temperature, 10 mL of H2O2 (30%, 88 mmol) was added to the previous mixture, yielding a dark-brown solution. The suspended material was centrifuged at 3000 rpm for 15 min and washed with water several times.
Hybridization Experiments
Hybridization of UCNP@SiO2 nanoparticles was performed by incubating the ssDNA-UCNP@SiO2 nanoparticles with miRNA solutions at 90 °C for 4 min. After that, the temperature of the samples was reduced slowly to 40 °C and maintained at this temperature for 60 min. Finally, the ssDNA-UCNP@SiO2 nanoparticles were centrifuged twice, redispersed in PBS containing 0.1 mg/mL GQDs, and incubated for 30 min before measurement.
Results and Discussion
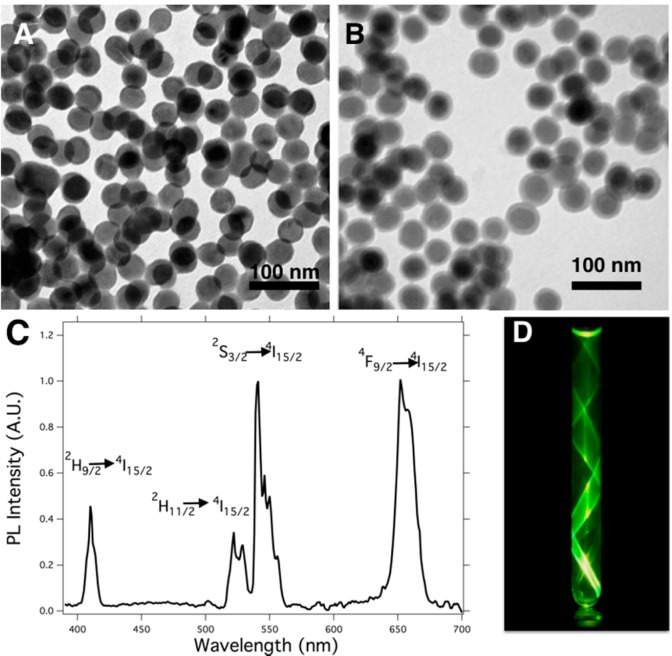
The synthesis of NaYF4:Yb,Er nanoparticles produced highly monodisperse spherical UCNPs with a mean diameter of 32 ± 3 nm, as measured from the TEM micrographs (Figure 1A). These nanoparticles were easily dispersed in hexane because of their oleic acid coating, which also acts as a stabilizing agent. The X-ray diffraction (XRD) patterns of the UCNPs matched with those of the hexagonal β-NaYF4 phase (see Figure S1). In addition, the atomic composition of the nanoparticles was β-NaY0.79F4:Yb0.19,Er0.02, as revealed by energy-dispersive spectroscopy (EDS; Figure S2). With the aim of facilitating surface functionalization, the UCNPs were subsequently covered with a SiO2 shell via a reverse microemulsion condensation method. This procedure allows one to obtain monodisperse spherical core@shell nanoparticles (UCNP@SiO2), in which each nanoparticle was covered with a silica shell and no particles were found with multiple nuclei. The overall mean diameter of the UCNP@SiO2 nanoparticles was 38 ± 4 nm with a silica shell thickness of approximately 6 nm, as analyzed from the TEM micrographs (Figure 1B). These UCNP@SiO2 nanoparticles can be dispersed in polar solvents such as water or ethanol, exhibiting upconversion emission when they are illuminated with a 980 nm CW laser (Figure 1D).
Figure 1.
(A) TEM micrograph of as-synthesized β-NaY0.79F4:Yb0.19,Er0.02. (B) TEM micrograph of monodisperse β-NaY0.79F4:Yb0.19,Er0.02@SiO2. (C) PL emission of β-NaY0.79F4:Yb0.19,Er0.02@SiO2 nanoparticles upon illumination with a 980 nm CW laser. (D) Photograph taken from a dispersion of NaYF4:Yb,Er@SiO2 in an NMR tube illuminated with a 980 nm CW laser from the bottom.
These nanoparticles showed characteristic upconversion fluorescence spectra from ytterbium- and erbium-doped NaYF4 nanocrystals with their characteristic emissions at (i) 410 nm (blue emission corresponding to the transition 2H9/2 → 4I15/2), (ii) 534 and 549 nm (green emission corresponding to the transitions 2H11/2 → 4I15/2 and 4S3/2 → 4I15/2), and (iii) 654 nm (red emission due to the transition 4F9/2 → 4I15/2; see Figure 1C).
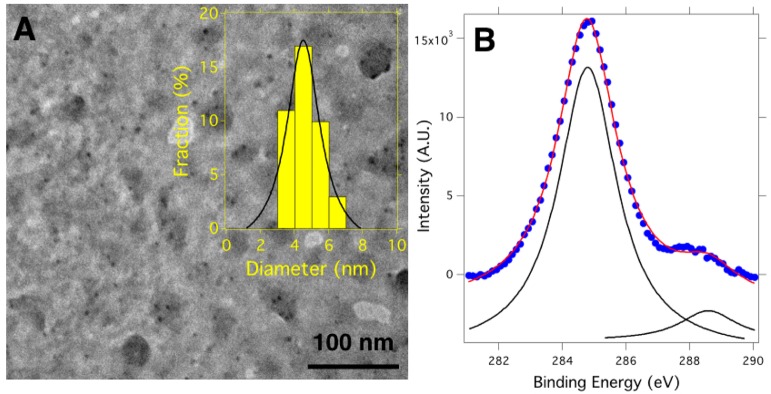
Figure 2A shows a TEM micrograph of the synthesized GQDs that appear as small nanoparticles with a mean diameter of 4.3 ± 0.8 nm, as measured from the TEM micrograph. The XPS spectrum of the C 1s core level shows two bands located at 284.7 and 288.5 eV. As can be seen in Figure 2B, the first band is more intense and is attributed to sp2 carbon atoms of the GQD structure (284.7 eV), while the second band is associated with the COO– groups (288.5 eV).28 The C sp2/C sp3 ratio was determined from the areas of these peaks, and its value is given in Table 1. In addition, the ζ-potential measurements revealed that the GQDs presented a value of −17.5 mV, which provides them with aqueous stability.
Figure 2.
(A) TEM micrograph of the GQDs. The inset shows the diameter distribution of the synthesized GQDs fitted with a Gaussian curve (black line). (B) XPS spectrum of the C 1s core levels of GQDs.
Table 1. Binding Energies, Percentages of Different Groups, and C sp2/C sp3 Ratios for GQDs.
| bond | max binding energy (eV) | composition (%) | C sp2/C sp3 |
|---|---|---|---|
| C=C | 284.7 | 85 | 5.66 |
| COO– | 288.5 | 15 |
Interestingly, when the GQDs were dispersed in an aqueous solution containing ssDNA-UCNP@SiO2 nanoparticles, we observed a dramatic enhancement of the upconversion, as shown in Figure 3. In the presence of increasing concentration of GQDs, the upconversion emission of the ssDNA-UCNP@SiO2 nanoparticles augmented up to 25 times. With the aim of figuring out the role that the ssDNA chains play in enhancement of the fluorescence, UCNP@SiO2 nanoparticles without ssDNA chains were dispersed in aqueous solutions containing increasing concentration of GQDs. The result is shown in Figure 4, where one can see the near absence of luminescent emission enhancement in this later case. This result reveals the decisive role that the ssDNA chains have in the interaction between the UCNP@SiO2 and the GQDs.
Figure 3.
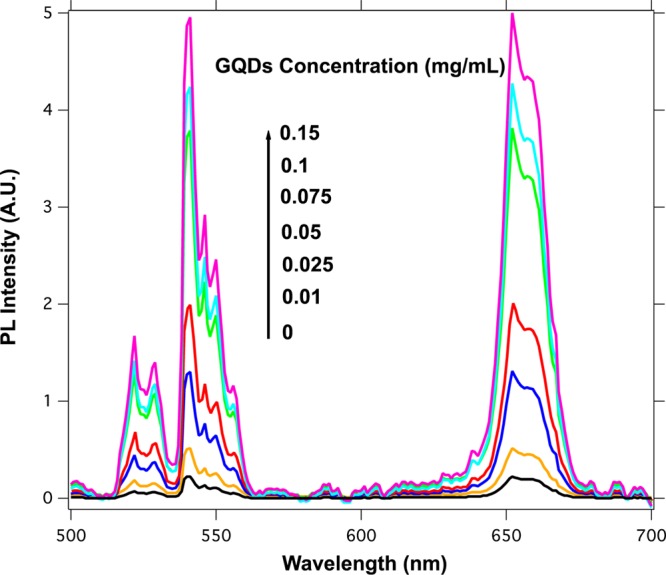
Emission spectra of the ssDNA-UCNP@SiO2 nanoparticles (0.04 mg/mL) with different concentrations of GQDs (λexc = 980 nm).
Figure 4.
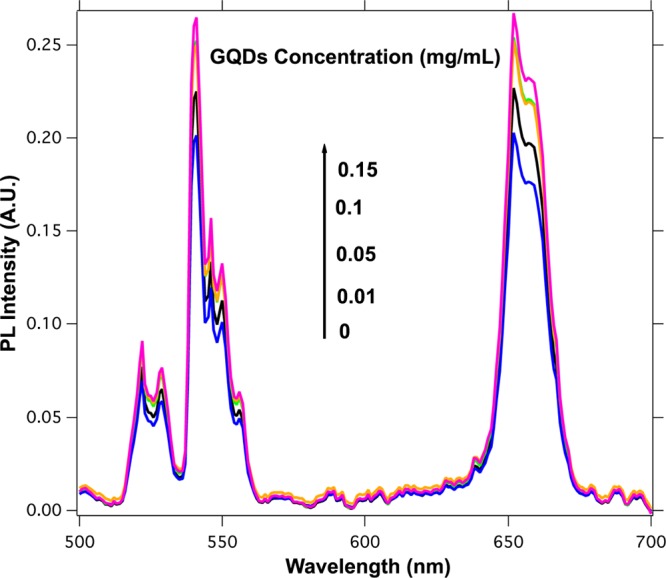
Fluorescence spectra of the UCNP@SiO2 nanoparticles (0.04 mg/mL) after the addition of different amounts of GQDs (λexc = 980 nm).
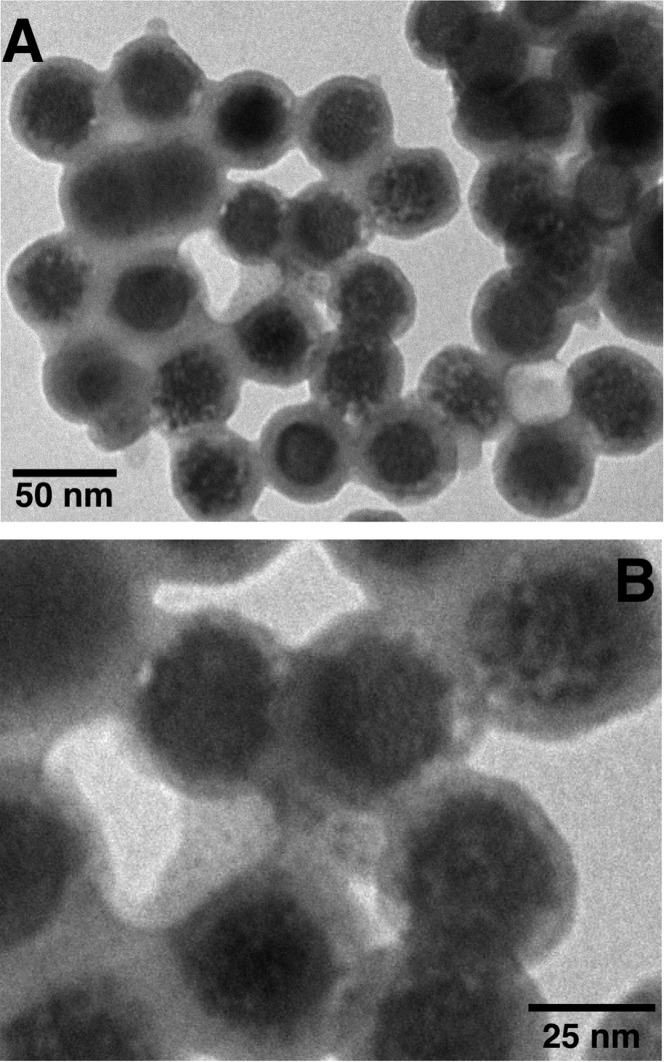
Figure 5 displays TEM micrographs of a mixture between GQDs and ssDNA-UCNP@SiO2 nanoparticles. Effectively, the combination of GQDs with ssDNA-UCNP@SiO2 nanoparticles leads to the formation of complexes constituted by ssDNA-UCNP@SiO2 covered with GQDs. These complexes would be the result of π–π interactions between the oligonucleotide strands and the electron-deficient surface of the GQDs. For this outcome to occur, the GQDs have to get close to the UCNP@SiO2 nanoparticles, which effectively happens, as revealed by Figure 5.
Figure 5.
(A) TEM image of ssDNA-UCNP@SiO2 GQD. The GQD concentration was 0.1 mg/mL, and the concentration of the ssDNA-UCNP@SiO2 nanoparticles was 0.04 mg/mL. (B) Magnification of the same TEM image.
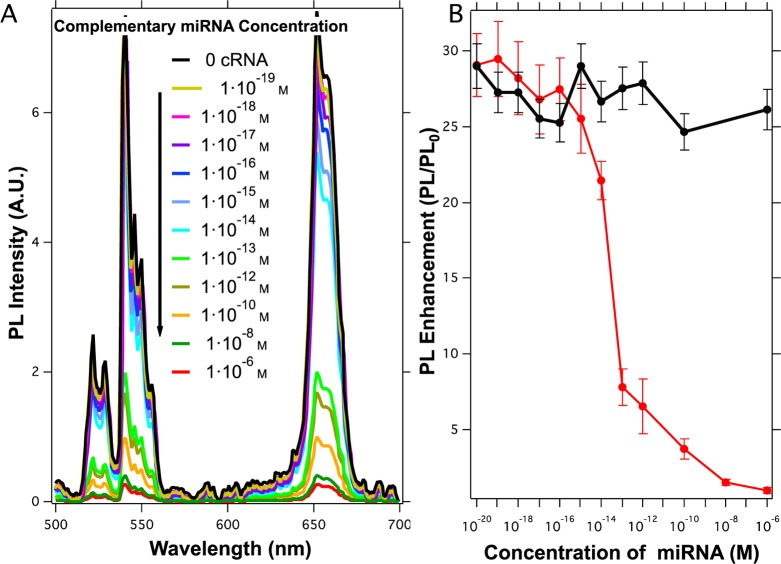
A way to hamper the π–π stacking between the GQDs and ssDNA-UCNP@SiO2 nanoparticles would be to block the interaction between the nucleotide bases and the sp2 carbon atoms of the GQDs through hybridization of the ssDNA with their complementary and antiparallel chains. This approach was used previously by other groups29,30 to avoid interaction between ssDNA and grapheme oxide. For that, ssDNA-UCNP@SiO2 nanoparticles were dispersed in PBS that contained different concentrations of complementary miRNA strands. After the hybridization process, the dsDNA-UCNP@SiO2 nanoparticles were centrifuged and dispersed in 1 mL of PBS containing 0.1 mg/mL GQD. The results of these experiments are shown in Figure 6.
Figure 6.
(A) Representation of the upconversion emission spectra of 0.04 mg/mL ssDNA-UCNP@SiO2 nanoparticles with 0.1 mg/mL GQDs after incubation with different concentrations of complementary miRNA sequences. The black line represents upconversion enhancement in the absence of complementary miRNA. (B) Representations of PL enhancement as a function of the complementary miRNA concentration (red) and PL enhancement in the presence of noncomplementary miRNA sequences (black). Each point is the result of five independent experiments.
In Figure 6A, we can observe a reduction of the upconversion enhancement when the ssDNA-UCNP@SiO2 nanoparticles were hybridized with increasing concentration of complementary miRNA sequences. This result shows that the formation of double-stranded oligonucleotides wouldeffectively hamper the assembly of GQDs on the surface of the UCNPs. Figure 6B depicts variation of photoluminescence (PL) enhancement as a function of the presence or absence of complementary miRNA sequences. PL enhancement was defined as
where PL is the photoluminescence intensity of the functionalized nanoparticles in the presence of miRNA sequences and PL0 is the photoluminescence intensity of the system in the absence of miRNA sequences.
This figure reveals that when the concentration of complementary miRNA sequences tends to zero, the upconversion enhancement was maximum and very similar to the enhancement obtained in the absence of miRNA, as seen in Figure 3. By contrast, when the concentration of miRNAs increased above 10 fM, PL enhancement was conspicuously reduced. This result could indicate that, above this concentration of miRNAs, the number of double-stranded oligonucleotides on the surface is large enough to drastically reduce the number of GQDs close to the surface. From this concentration, further increments of the miRNA concentration lead to further reduction of the upconversion enhancement until a negligible value at miRNA concentrations above 1 × 10⁻⁶ M is reached. Such a result would indicate that higher miRNA concentrations completely block the interaction capacity between the UCNPs and GQDs. Furthermore, in the presence of noncomplementary miRNA sequences, upconversion enhancement remained constant, denoting the selectivity of the proposed sensor, black line in Figure 6B.
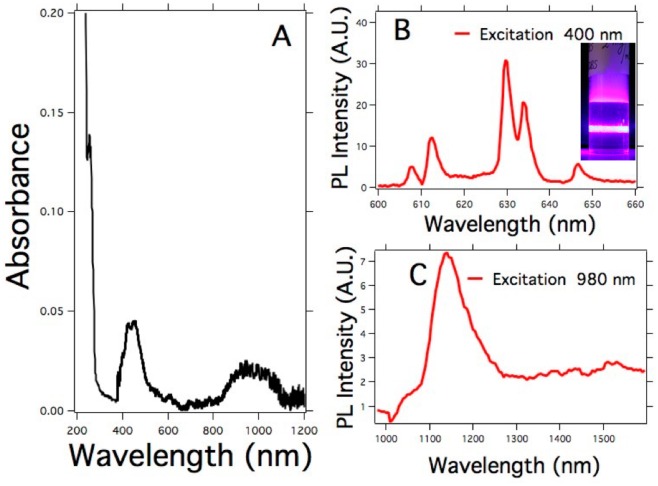
Scheme 1 depicts the action mechanism proposed for the detection process With the aim of understanding the action mechanism underlying the upconversion enhancement, the absorbance and PL emission of GQD were studied in the range comprised between 190 to 1500 nm as shown in Figure 7. Here, one can observe absorption bands at 200 nm, 410 nm and a broad one starting at 850 nm. In addition, when the GQD were excited at 400 nm they exhibited intense PL emissions at 610, 617, 630, 637, and 645 nm respectively, as depicted in Figure 7B. Furthermore, when the GQD were excited at 980 nm, they showed an emission band located at 1150 nm (Figure 7C).
Scheme 1. Schematic Representation of the Proposed Sensor Platform in the Presence or Absence of Complementary Oligonucleotides.
Figure 7.
(A) Absorption spectra of the GQDs. (B) PL emission of the GQDs in the visible range (λexc = 400 nm). The inset shows the PL emission of a dispersion of GQDs upon excitation at 400 nm. (C) PL emission of the GQDs in the NIR range (λexc = 980 nm). The GQD concentration was 0.1 mg/mL.
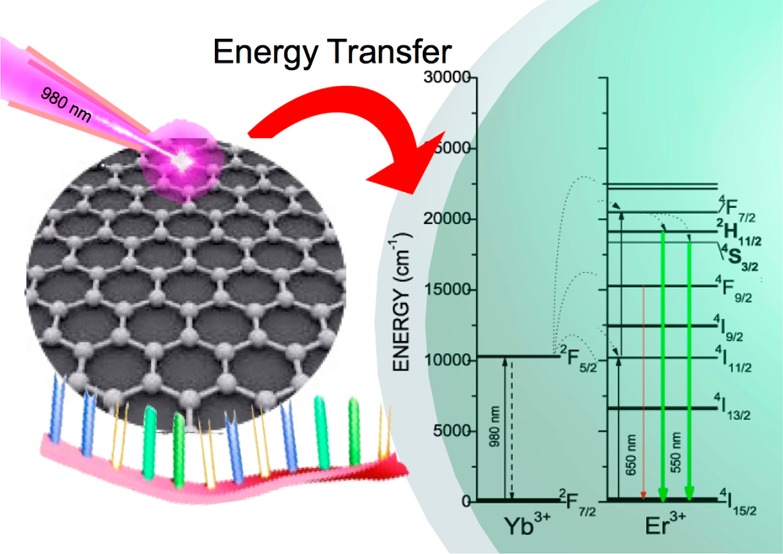
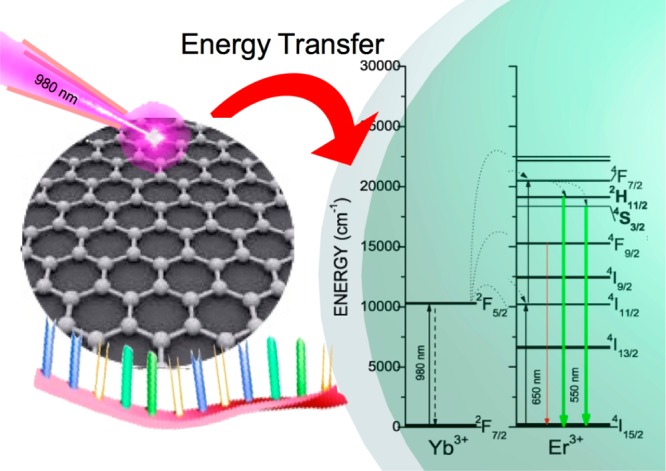
The capacity of the GQDs to absorb and emit NIR light could make them act as antennas when they are in close proximity with the UCNPs, transferring the quanta to the core of the UCNPs, as summarized in Scheme 2.23 Hence, the number of photons collected by the system could be drastically increased, rendering an increment in the upconversion enhancement.
Scheme 2. Proposed Energy-Transfer Mechanism between the GQDs and UCNPs.
Conclusions
In this work, a sensor for the miRNA sequences was prepared by exploiting the interaction between ssDNA-functionalized UCNPs and GQDs. In the absence of complementary miRNA sequences, the ssDNA-functionalized particles interact with the GQDs, leading to enhancement of the upconversion emission. On the other hand, in the presence of target miRNA sequences, the hybridization process yields dsDNA on the surface of the UCNPs, which hinders interaction with the GQDs and reduces the upconversion fluorescence enhancement. Using relative emission/upconversion measurements compared to a reference, it was possible to determine the presence of complementary miRNA target sequences with a detection limit of 10 fM.
Acknowledgments
The Bill & Melinda Gates Foundation (Grant OPP1128411) and the Spanish MINECO for Project MAT2014-55065R are gratefully acknowledged for financial support of this project.
Supporting Information Available
The Supporting Information is available free of charge on the ACS Publications website at DOI: 10.1021/acsami.6b02361.
EDS spectrum and XRD pattern (PDF)
The authors declare no competing financial interest.
Supplementary Material
References
- Gilad S.; Meiri E.; Yogev Y.; Benjamin S.; Lebanony D.; Yerushalmi N.; Benjamin H.; Kushnir M.; Cholakh H.; Melamed N.; Bentwich Z.; Hod M.; Goren Y.; Chajut A. Serum MicroRNAs Are Promising Novel Biomarkers. PLoS One 2008, 3 (9), 1–7. 10.1371/journal.pone.0003148. [DOI] [PMC free article] [PubMed] [Google Scholar]
- Yeung M. L.; Bennasser Y.; Le S. Y.; Jeang K. T. siRNA, miRNA and HIV: Promises and Challenges. Cell Res. 2005, 15 (11–12), 935–946. 10.1038/sj.cr.7290371. [DOI] [PubMed] [Google Scholar]
- Liang H.; Zhou Z.; Zhang S.; Zen K.; Chen X.; Zhang C. Identification of Ebola Virus microRNAs and Their Putative Pathological Function. Sci. China: Life Sci. 2014, 57 (10), 973–981. 10.1007/s11427-014-4759-2. [DOI] [PubMed] [Google Scholar]
- Wang J.; Jiang D.; Rao H.; Zhao J.; Wang Y.; Wei L. Absolute Quantification of Serum microRNA-122 and Its Correlation with Liver Inflammation Grade and Serum Alanine Aminotransferase in Chronic Hepatitis C Patients. Int. J. Infect. Dis. 2015, 30, 52–56. 10.1016/j.ijid.2014.09.020. [DOI] [PubMed] [Google Scholar]
- Hussain M.; Asgari S. MicroRNA-like Viral Small RNA from Dengue Virus 2 Autoregulates Its Replication in Mosquito Cells. Proc. Natl. Acad. Sci. U. S. A. 2014, 111 (7), 2746–2751. 10.1073/pnas.1320123111. [DOI] [PMC free article] [PubMed] [Google Scholar]
- Narayanan A.; Iordanskiy S.; Das R.; Van Duyne R.; Santos S.; Jaworski E.; Guendel I.; Sampey G.; Dalby E.; Iglesias-Ussel M.; Popratiloff A.; Hakami R.; Kehn-Hall K.; Young M.; Subra C.; Gilbert C.; Bailey C.; Romerio F.; Kashanchi F. Exosomes Derived from HIV-1-Infected Cells Contain Trans-Activation Response Element RNA. J. Biol. Chem. 2013, 288 (27), 20014–20033. 10.1074/jbc.M112.438895. [DOI] [PMC free article] [PubMed] [Google Scholar]
- Peeling R. W.; Artsob H.; Pelegrino J. L.; Buchy P.; Cardosa M. J.; Devi S.; Enria D. A.; Farrar J.; Gubler D. J.; Guzman M. G.; Halstead S. B.; Hunsperger E.; Kliks S.; Margolis H. S.; Nathanson C. M.; Nguyen V. C.; Rizzo N.; Vázquez S.; Yoksan S. Evaluation of Diagnostic Tests: Dengue. Nat. Rev. Microbiol. 2010, 8 (12), S30–S37. 10.1038/nrmicro2459. [DOI] [PubMed] [Google Scholar]
- Huang J.; Wang F.; Argyris E.; Chen K.; Liang Z.; Tian H.; Huang W.; Squires K.; Verlinghieri G.; Zhang H. Cellular microRNAs Contribute to HIV-1 Latency in Resting Primary CD4+ T Lymphocytes. Nat. Med. 2007, 13 (10), 1241–1247. 10.1038/nm1639. [DOI] [PubMed] [Google Scholar]
- Yang X.; Yu Y.; Gao Z. A Highly Sensitive Plasmonic DNA Assay Based on Triangular Silver Nanoprism Etching. ACS Nano 2014, 8 (5), 4902–4907. 10.1021/nn5008786. [DOI] [PubMed] [Google Scholar]
- Sedlmeier A.; Gorris H. H. Surface Modification and Characterization of Photon-Upconverting Nanoparticles for Bioanalytical Applications. Chem. Soc. Rev. 2015, 44 (6), 1526–1560. 10.1039/C4CS00186A. [DOI] [PubMed] [Google Scholar]
- Alonso-Cristobal P.; Oton-Fernandez O.; Mendez-Gonzalez D.; Díaz J. F.; Lopez-Cabarcos E.; Barasoain I.; Rubio-Retama J. Synthesis, Characterization, and Application in HeLa Cells of an NIR Light Responsive Doxorubicin Delivery System Based on NaYF 4:Yb,Tm@SiO 2 -PEG Nanoparticles. ACS Appl. Mater. Interfaces 2015, 7 (27), 14992–14999. 10.1021/acsami.5b03881. [DOI] [PubMed] [Google Scholar]
- Rantanen T.; Järvenpää M.-L.; Vuojola J.; Kuningas K.; Soukka T. Fluorescence-Quenching-Based Enzyme-Activity Assay by Using Photon Upconversion. Angew. Chem., Int. Ed. 2008, 47 (20), 3811–3813. 10.1002/anie.200705861. [DOI] [PubMed] [Google Scholar]
- Liu B.; Chen Y.; Li C.; He F.; Hou Z.; Huang S.; Zhu H.; Chen X.; Lin J. Poly(Acrylic Acid) Modification of Nd 3+ -Sensitized Upconversion Nanophosphors for Highly Efficient UCL Imaging and pH-Responsive Drug Delivery. Adv. Funct. Mater. 2015, 25 (29), 4717–4729. 10.1002/adfm.201501582. [DOI] [Google Scholar]
- Wu S.; Duan N.; Ma X.; Xia Y.; Wang H.; Wang Z.; Zhang Q. Multiplexed Fluorescence Resonance Energy Transfer Aptasensor between Upconversion Nanoparticles and Graphene Oxide for the Simultaneous Determination of Mycotoxins. Anal. Chem. 2012, 84 (14), 6263–6270. 10.1021/ac301534w. [DOI] [PubMed] [Google Scholar]
- Alonso-Cristobal P.; Vilela P.; El-Sagheer A.; Lopez-Cabarcos E.; Brown T.; Muskens O. L.; Rubio-Retama J.; Kanaras a G. Highly Sensitive DNA Sensor Based on Upconversion Nanoparticles and Graphene Oxide. ACS Appl. Mater. Interfaces 2015, 7, 12422. 10.1021/am507591u. [DOI] [PubMed] [Google Scholar]
- Doughan S.; Han Y.; Uddayasankar U.; Krull U. J. Solid-Phase Covalent Immobilization of Upconverting Nanoparticles for Biosensing by Luminescence Resonance Energy Transfer. ACS Appl. Mater. Interfaces 2014, 6 (16), 14061–14068. 10.1021/am503391m. [DOI] [PubMed] [Google Scholar]
- Chen Z.; Chen H.; Hu H.; Yu M.; Li F.; Zhang Q.; Zhou Z.; Yi T.; Huang C. Versatile Synthesis Strategy for Carboxylic Acid-Functionalized Upconverting Nanophosphors as Biological Labels. J. Am. Chem. Soc. 2008, 130 (10), 3023–3029. 10.1021/ja076151k. [DOI] [PubMed] [Google Scholar]
- Wang F.; Deng R.; Wang J.; Wang Q.; Han Y.; Zhu H.; Chen X.; Liu X. Tuning Upconversion through Energy Migration in Core-Shell Nanoparticles. Nat. Mater. 2011, 10 (12), 968–973. 10.1038/nmat3149. [DOI] [PubMed] [Google Scholar]
- Jalani G.; Naccache R.; Rosenzweig D. H.; Haglund L.; Vetrone F.; Cerruti M. Photocleavable Hydrogel-Coated Upconverting Nanoparticles: A Multifunctional Theranostic Platform for NIR Imaging and On-Demand Macromolecular Delivery. J. Am. Chem. Soc. 2016, 138 (3), 1078–1083. 10.1021/jacs.5b12357. [DOI] [PubMed] [Google Scholar]
- Fischer S.; Goldschmidt J. C.; Löper P.; Bauer G. H.; Brüggemann R.; Krämer K.; Biner D.; Hermle M.; Glunz S. W. Enhancement of Silicon Solar Cell Efficiency by Upconversion: Optical and Electrical Characterization. J. Appl. Phys. 2010, 108 (4), 1–11. 10.1063/1.3478742. [DOI] [Google Scholar]
- Verhagen E.; Kuipers L.; Polman A. Enhanced Nonlinear Optical Effects with a Tapered Plasmonic Waveguide. Nano Lett. 2007, 7 (2), 334–337. 10.1021/nl062440f. [DOI] [PubMed] [Google Scholar]
- Chang J.; Liu Y.; Li J.; Wu S.; Niu W.; Zhang S. Strong Red and NIR Emission in NaYF4:Yb3+,Tm3+/QDs Nanoheterostructures. J. Mater. Chem. C 2013, 1, 1168. 10.1039/C2TC00184E. [DOI] [Google Scholar]
- Zou W.; Visser C.; Maduro J. a.; Pshenichnikov M. S.; Hummelen J. C. Broadband Dye-Sensitized Upconversion of near-Infrared Light. Nat. Photonics 2012, 6 (8), 560–564. 10.1038/nphoton.2012.158. [DOI] [Google Scholar]
- Zor E.; Morales-Narvaez E.; Zamora-Galvez A.; Bingol H.; Ersoz M.; Merkoçi A. Graphene Quantum Dots-Based Photoluminescent Sensor: A Multifunctional Composite for Pesticide Detection. ACS Appl. Mater. Interfaces 2015, 7 (36), 20272–20279. 10.1021/acsami.5b05838. [DOI] [PubMed] [Google Scholar]
- Tang L.; Ji R.; Li X.; Bai G.; Liu C. P.; Hao J.; Lin J.; Jiang H.; Teng K. S.; Yang Z.; Lau S. P. Deep Ultraviolet to near-Infrared Emission and Photoresponse in Layered N-Doped Graphene Quantum Dots. ACS Nano 2014, 8 (6), 6312–6320. 10.1021/nn501796r. [DOI] [PubMed] [Google Scholar]
- Zheng X. T.; Ananthanarayanan A.; Luo K. Q.; Chen P. Glowing Graphene Quantum Dots and Carbon Dots: Properties, Syntheses, and Biological Applications. Small 2015, 11 (14), 1620–1636. 10.1002/smll.201402648. [DOI] [PubMed] [Google Scholar]
- Hussain M.; Asgari S. MicroRNA-like Viral Small RNA from Dengue Virus 2 Autoregulates Its Replication in Mosquito Cells. Proc. Natl. Acad. Sci. U. S. A. 2014, 111 (7), 2746–2751. 10.1073/pnas.1320123111. [DOI] [PMC free article] [PubMed] [Google Scholar]
- Hidalgo R. S.; López-Díaz D.; Velázquez M. M. Graphene Oxide Thin Films: Influence of Chemical Structure and Deposition Methodology. Langmuir 2015, 31 (9), 2697–2705. 10.1021/la5029178. [DOI] [PubMed] [Google Scholar]
- Liu C.; Wang Z.; Jia H.; Li Z. Efficient Fluorescence Resonance Energy Transfer between Upconversion Nanophosphors and Graphene Oxide: A Highly Sensitive Biosensing Platform. Chem. Commun. (Cambridge, U. K.) 2011, 47 (16), 4661–4663. 10.1039/c1cc10597c. [DOI] [PubMed] [Google Scholar]
- Wu M.; Kempaiah R.; Huang P. J. J.; Maheshwari V.; Liu J. Adsorption and Desorption of DNA on Graphene Oxide Studied by Fluorescently Labeled Oligonucleotides. Langmuir 2011, 27 (6), 2731–2738. 10.1021/la1037926. [DOI] [PubMed] [Google Scholar]
Associated Data
This section collects any data citations, data availability statements, or supplementary materials included in this article.


