Abstract
CeO2 nanoparticles (NPs) have been well demonstrated as an antioxidant in protecting against oxidative stress-induced cellular damages and a potential therapeutic agent for various diseases thanks to their redox enzyme-mimicking activities. The Ce3+/Ce4+ ratio and oxygen vacancies on the surface have been considered as the major originations responsible for the redox enzyme-mimicking activities of CeO2 NPs. Herein, CeO2 nanostructures (nanocubes and nanorods) exposed different facets were synthesized via a facile hydrothermal method. The characterizations by X-ray photoelectron spectroscopy, Raman spectroscopy, and UV-Vis spectroscopy show that the Ce3+/Ce4+ ratio and oxygen vacancy content on the surfaces of as-synthesized CeO2 nanostructures are nearly at the same levels. Meanwhile, the enzymatic activity measurements indicate that the redox enzyme-mimicking activities of as-synthesized CeO2 nanostructures are greatly dependent on their exposed facets. CeO2 nanocubes with exposed {100} facets exhibit a higher peroxidase but lower superoxide dismutase activity than those of the CeO2 nanorods with exposed {110} facets. Our results provide new insights into the redox enzyme-mimicking activities of CeO2 nanostructures, as well as the design and synthesis of inorganic nanomaterials-based artificial enzymes.
Enzyme-mimicking activities of various nanomaterials have attracted considerable interest in industrial catalysis and biomedical fields. CeO2 nanoparticles (NPs) have been well demonstrated as an antioxidant highly effective in protecting against oxidative stress-induced cellular damages and a potential therapeutic agent for various diseases, such as cancer, diabetes, chronic inflammation, brain autoimmune degenerative disease, and retinal pathologies1,2,3,4. Numerous studies have shown that CeO2 NPs display high activities mimicking a series of redox enzymes, including superoxide dismutase (SOD)5,6,7, catalase8,9,10, peroxidase11,12,13,14,15, phosphotriesterase16, phosphatase17,18, and oxidase19, which can scavenge reactive oxygen and nitrogen species. In CeO2, the intrinsic defects derived from the existence of Ce3+ result in the formation of oxygen vacancies compensating for the positive charge deficiency. The enzyme-mimicking activities of CeO2 NPs have been attributed to the auto-regenerative cycle of Ce3+/Ce4+ and oxygen vacancies on the surface of CeO2. Hence, the redox state of Ce ions on the surface plays a crucial role in the redox enzyme-mimicking activities of CeO2 NPs. Studies by Self et al.5,6,7,8,9,10 indicated that the high Ce3+/Ce4+ ratio on the surface of CeO2 NPs corresponded to high SOD mimetic activity, which was inhibited and transferred to catalase/peroxidase mimetic activities when the Ce3+/Ce4+ ratio decreased. On the other hand, some results suggested that increasing the Ce3+ concentration on the surface of CeO2 NPs was beneficial to peroxidase mimetic activity11,12.
The exposed facets have been demonstrated to considerably contribute to the catalytic performances of various metals, alloys, and metal oxides20,21,22,23. Recent studies by Shen et al. based on theoretical calculations and experimental data confirmed that redox enzyme-mimicking activities of noble metals (Au, Ag, Pd, and Pt) were critically dependent on exposed facets24. Previous studies also showed that the catalytic activities of CeO2 NPs in the oxidation of CO, NO, and propane were substantially related to the exposed facets25,26,27,28,29,30,31. So far, the relationship between the exposed facets of CeO2 NPs and their redox enzyme-mimicking activities has not yet been explored.
Herein, CeO2 nanocubes with exposed {100} facets and nanorods with exposed {110} facets were synthesized through a facile hydrothermal method. Phase structures and morphologies were characterized by X-ray diffraction (XRD), transmission electron microscopy (TEM), and high resolution transmission electron microscopy (HRTEM). The surface information of the cerium element located on the surface of the CeO2 nanostructures was analyzed by X-ray photoelectron spectroscopy (XPS), Raman spectroscopy, and UV-Vis spectroscopy. The specific surface areas of the CeO2 nanostructures were measured by nitrogen adsorption in accordance with the Brunauer-Emmett-Teller (BET) method. Furthermore, the peroxidase and SOD mimetic activities of the CeO2 nanostructures were evaluated.
Results and Discussion
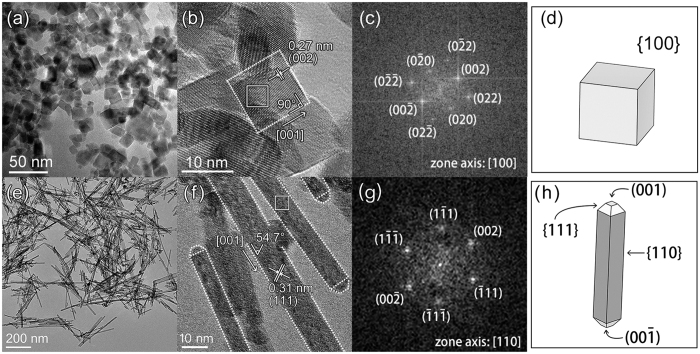
Figure 1 shows the TEM and HRTEM images of the as-synthesized CeO2 nanostructures. Homogeneous CeO2 nanocubes were obtained at an average size of approximately 13 ± 3 nm (Fig. 1a). The HRTEM image displays the well-aligned crystal planes, indicating the single-crystalline nature of CeO2 nanocubes (Fig. 1b). The interplanar spacing of approximately 0.27 nm could be indexed to the (200) plane of the face-centered cubic CeO2. The spots that appeared on the fast Fourier transformation (FFT) pattern of the area marked with white lines in Fig. 1b were indexed, and the zone axis was found to be [100] (Fig. 1c). Accordingly, a three-dimensional model describing the nanocubes is shown in Fig. 1d, representing a cubic structure enclosed with {100} facets. CeO2 nanorods with an average diameter of approximately 10 ± 3 nm were obtained by adjusting the synthesis parameters (Fig. 1e). The well-aligned crystal planes observed from the HRTEM image in Fig. 1f also indicate the single-crystalline structure of CeO2 nanorods.
Figure 1. TEM and HRTEM images of the as-synthesized CeO2 nanostructures.
(a–f) CeO2 nanocubes; (e–h) CeO2 nanorods. (c,g) show the FFT patterns of the areas marked with white lines in (b,f), respectively. (e,h) display the proposed models of the CeO2 nanocubes and nanorods, respectively. The CeO2 models were drawn using software VESTA32.
The interplanar spacing of approximately 0.31 nm could be indexed to the (111) plane. The spots that appeared on the FFT pattern of the area marked with white lines in Fig. 1f were indexed, and the zone axis was found to be [110] (Fig. 1g). Accordingly, a three-dimensional model describing the nanorods is shown in Fig. 1h, suggesting a rod-like structure enclosed with {110} and {111} facets and truncated by (100) and (00Ī) facets at the z-axis.
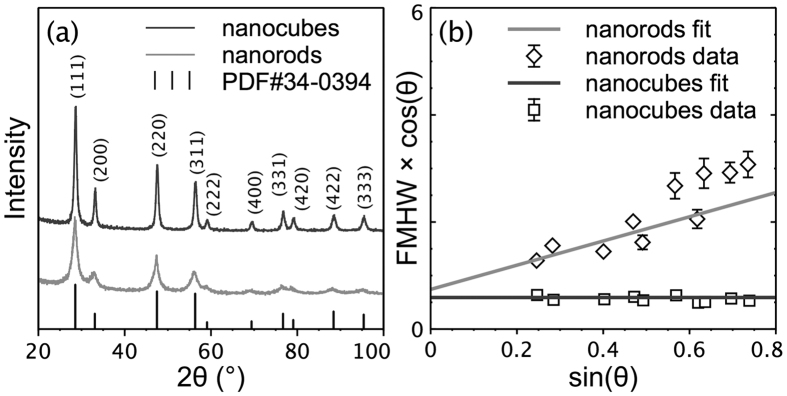
The phase structure of the as-synthesized CeO2 nanostructures was identified by XRD characterization. All of the diffraction peaks in the XRD patterns could be indexed to the cubic fluorite structure of CeO2 (JCPDS Card 34–0394) (Fig. 2a). Pawley method34 was adopted to obtain the full width at half maximum (FWHM) of the individual peak in the XRD patterns. The result is illustrated as Williamson-Hall plots (Fig. 2b)35. The coefficient of the fitted lines reflects the magnitude of the microstrain (a higher coefficient denotes a higher microstrain), and the intercept of the fitted lines indicates the crystallite size. No microstrain existed in the CeO2 nanocubes, but a large microstrain was observed in the CeO2 nanorods (0% vs. 0.98%). Meanwhile, the crystallite size calculated from the intercept of the fitted lines was approximately 13.5 nm for the CeO2 nanocubes and 10.7 nm for the CeO2 nanorods, consistent with the average size obtained from the TEM images. In addition, the BET specific surface area measured by N2 adsorption-desorption isotherms was approximately 70.9 m2/g for the CeO2 nanocubes and 95.4 m2/g for the CeO2 nanorods, indicating the larger specific surface area of the CeO2 nanorods compared with that of the CeO2 nanocubes.
Figure 2.
(a) XRD patterns of the as-synthesized CeO2 nanostructures. (b) Williamson-Hall plots of the CeO2 nanostructures derived from the XRD patterns. The coefficient of the fitted lines indicates the microstrain (a higher coefficient denotes a higher microstrain), and the intercept of the fitted lines indicates the crystallite size (a higher intercept means a smaller size). The linear and nonlinear fittings were performed using software Fityk33.
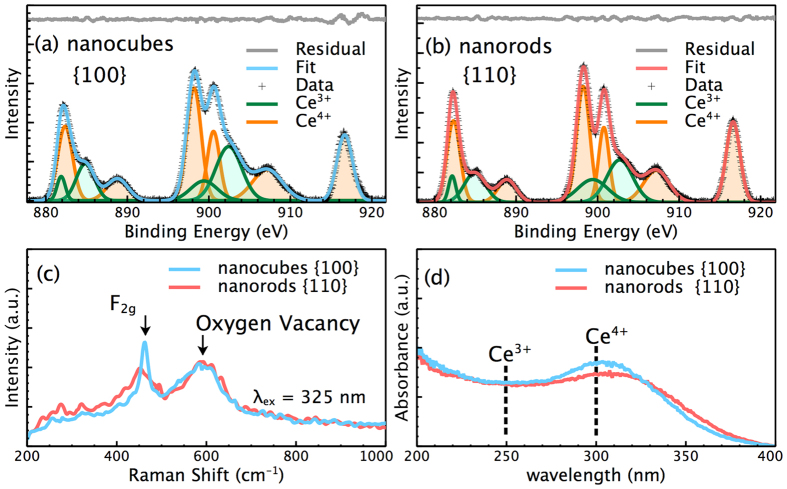
The surface chemical information of the CeO2 nanostructures was analyzed by XPS, Raman spectroscopy, and UV-Vis spectroscopy. The peaks in the XPS spectra were fitted using the Gaussian function (Fig. 3a,b). The areas of the fitting peaks ascribed to Ce3+ and Ce4+ were used to calculate the contents of Ce3+ and Ce4+ on the surface of the CeO2 nanostructures15,36. The calculations yielded approximately 31.8% of Ce3+ for the CeO2 nanocubes and 31.2% of Ce3+ for the CeO2 nanorods, suggesting the similar Ce3+ contents on the surfaces of the as-synthesized CeO2 nanostructures. Figure 3c shows the Raman spectra of CeO2 nanostructures at the excitation wavelength of 325 nm. The strong peak at 462 cm−1 could be ascribed to the F2g mode37,38. The asymmetrical and broader peak in the Raman spectrum of the CeO2 nanorods could be attributed to the smaller crystallite size and larger microstrain compared with those of the CeO2 nanocubes39. Notably, the two CeO2 nanostructures exhibited similar Raman absorption at 595 cm−1, which corresponds to the characteristic peak of oxygen vacancy37,38.
Figure 3.
(a,b) XPS spectra of the as-synthesized CeO2 nanostructures. The peaks in XPS spectra were fitted using Gaussian function and ascribed to Ce3+ and Ce4+, respectively. (c) Raman spectra of the as-synthesized CeO2 nanostructures at the excitation wavelength of 325 nm. (d) UV-Vis spectra of the as-synthesized CeO2 nanostructures.
This result implies that oxygen vacancies on the surfaces of both CeO2 nanostructures were at the same level. The absorption peak at 250 nm in UV-Vis spectra of CeO2 has been ascribed to Ce3+, and the absorption peak at 295 nm has been ascribed to Ce4+ 6,10. No obvious absorption peak belonging to Ce3+ was observed for both of the CeO2 nanostructures (Fig. 3d), implying the low Ce3+ content in the crystal structure of the CeO2 nanostructures. Therefore, these results strongly demonstrated that both the Ce3+/Ce4+ ratio and oxygen vacancies on the surface of the as-synthesized CeO2 nanostructures were nearly at the same levels.
The peroxidase-mimicking activity of the CeO2 nanostructures was evaluated by monitoring the catalytic reaction between H2O2 and tetramethylbenzidine (TMB) in acetic buffer solution (equation 1).
 |
The change in absorbance at 652 nm indicates the formation of TMBox. Almost no change in absorbance was observed within 30 min (Fig. 4), implying that H2O2 failed to oxidize TMB in the absence of catalysts. Subsequently, in the presence of CeO2 nanorods with exposed {110} facets, a slight increase in absorbance was observed with reaction time extension, suggesting that the TMB was slowly oxidized by H2O2. The absorbance was dramatically increased with the reaction prolongation in the presence of CeO2 nanocubes, demonstrating that the oxidation of TMB by H2O2 was greatly accelerated by the CeO2 nanocubes with exposed {100} facets.
Figure 4. Peroxidase mimetic activity of the CeO2 nanostructures.
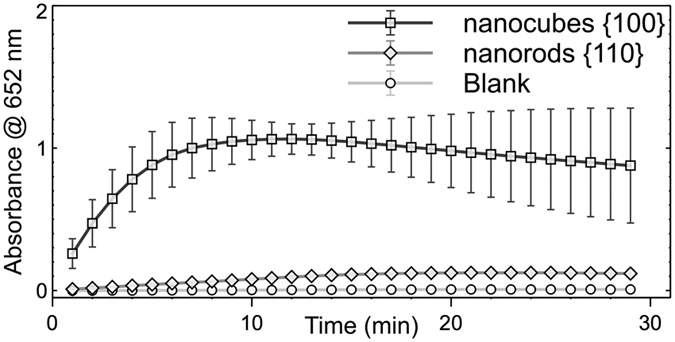
The change in absorbance at 652 nm represents the conversion of TMB to oxidized TMB (TMBox).
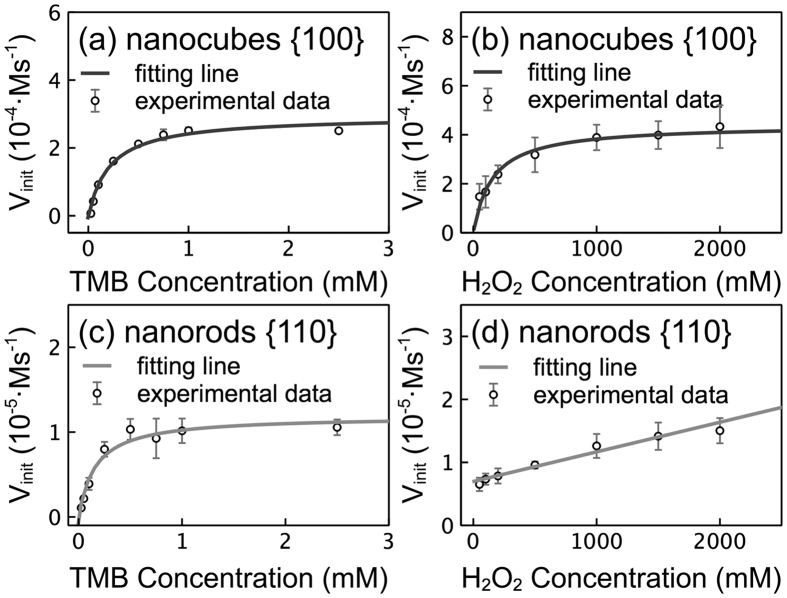
Figure 5 shows the results of a steady-state kinetic assay conducted by varying the concentrations of TMB and H2O2. Kinetic parameters were calculated by fitting experimental data to the Michaelis-Menten equation. Vmax is the maximal reaction velocity, and Km is the Michaelis constant. A higher Vmax value represents a higher conversion rate from substrate to product, and a higher Km denotes a smaller catalyst affinity to the substrate. Under varied TMB concentrations (Fig. 5a,c), the Km value was approximately 0.217 mM for the CeO2 nanocubes and approximately 0.240 mM for the CeO2 nanorods, consistent with the values reported previously14,40. These results suggest the similar affinities of TMB to both of the CeO2 nanostructures. However, Vmax value was approximately 8.2 × 10⁻⁸ M/s for the CeO2 nanocubes and 0.4 × 10⁻⁸ M/s for the CeO2 nanorods, indicating that the rate of the reaction catalyzed by the CeO2 nanocubes with exposed {100} facets was 23 times higher than that catalyzed by the CeO2 nanorods with exposed {110} facets. Meanwhile, under varying H2O2 concentrations, the Km and Vmax for the CeO2 nanocubes were approximately 153.6 mM and 12.2 × 10⁻⁸ M/s, respectively. In such cases, the Km obtained is far greater than that obtained from the varied TMB levels, suggesting that the affinity of H2O2 on the surface of the CeO2 nanocubes was far smaller than that of TMB. While the larger Vmax in the case of varying H2O2 concentrations than that in the case of varying TMB concentrations suggests that the catalytic reaction was more sensitive to the H2O2 concentration. Notably, the Michaelis-Menten equation failed to describe the relation between the concentration of H2O2 and the initial velocity of the reaction in the presence of the CeO2 nanorods (Fig. 5d). Instead, a linear relation was observed, implying a simple first-order reaction dependent on the concentration of the H2O2 catalyzed by the CeO2 nanorods.
Figure 5. Steady-state kinetic assay of peroxidase mimetic activity.
The peroxidase-mimicking activity of the CeO2 nanorods was also measured after a heating treatment at 650 °C for 48 h because the fitting of the XRD patterns reveals the existence of microstrain in the CeO2 nanorods. However, no significant increase in enzyme activity was observed in despite of the disappearance of the microstrain in the CeO2 nanorods after annealing (see Supplementary Figs S1 and S2). Hence, the peroxidase mimetic activities of the CeO2 nanostructures were influenced by the exposed facets instead of the microstrain.
The SOD mimetic activity of the CeO2 nanostructures was also evaluated with colorimetric assay kits. The results indicate that the SOD mimetic activity of the CeO2 nanorods with exposed {110} facets was four times higher than that of the CeO2 nanocubes with exposed {100} facets (see Supplementary Fig. S3). After annealing to remove the microstrain, the CeO2 nanorods still exhibited a higher SOD mimetic activity than that of the CeO2 nanocubes. Thus, the SOD mimetic activity of the CeO2 nanostructures may have also depended on the exposed facets instead of the microstrain.
Theoretical calculations and experimental data have indicated that redox enzymes-mimicking activities of CeO2 could be ascribed to the transformation between Ce4+ and Ce3+ ions and the generation of oxygen vacancies compensating for the positive charge deficiency on the surfaces41,42,43. However, in the present study, both the Ce3+/Ce4+ ratio and oxygen vacancies were of the same level on the surfaces of the two CeO2 nanostructures, which displayed different redox enzyme-mimicking activities. Therefore, the different exposed facets should be responsible for such different catalytic performances. It is generally known that CeO2 possesses three low-index facets: {111}, {110}, and {100} facet. Among which, CeO2 {110} surface is a type I ionic crystal surface with neutral atomic planes due to a stoichiometric balance between anions and cations, while CeO2 {111} surface is a type II ionic crystal surface with charged planes but without net dipole moment perpendicular to the surface. Both CeO2 {110} and {111} surfaces have relatively low surface energies and display modest relaxations on the surfaces compared to the bulk. By comparison, CeO2 {100} surface has a nearly infinite free energy and therefore require a major reconstruction compared to the bulk because such a surface consists of alternatively charged planes and thus produces a dipole moment perpendicular to the surface. Accordingly, the stability of three facets decreased in an order of {111} > {110} > {100}, which means the higher catalytic activity of {100} facets than that of {110} and {111} facets41,42,43. According to an energy-based model describing the facet-dependent redox enzyme-mimicking activities of noble metal NPs, the dissociative adsorption of O2 on the metal surfaces was proposed to be the key step that provided the surfaces with oxidase-like activities24. Meanwhile, the protonation of O2·− and adsorption and rearrangement of HO2· on metal surfaces were mainly responsible for SOD-like activity of these metals24. Therefore, it is reasonable to speculate that the facet-dependent adsorption, activation, and rearrangement processes between the reacting species and the exposed facets may play crucial roles on the redox enzyme-mimicking activities of CeO2 nanostructures in addition to the transformation between Ce4+ and Ce3+ions ratio and the generation of oxygen vacancies on the surfaces. Unfortunately, although numerous theoretical and experimental investigations have been performed in order to interpret the relationship between the catalytic activity and the surface compositions and crystal structures, the accurate atomic structures of CeO2 nanostructures, particularly for the CeO2 with exposed {110} and {100} facets, still remain indistinct41,42,43,44. Therefore, more theoretical and experimental investigations are necessary to elucidate the precise mechanisms on the influences of redox enzyme-mimicking activities of CeO2 nanostructures by their exposed facets.
Conclusion
In summary, we have shown that the redox enzyme mimetic activities of the CeO2 nanostructures were determined by the exposed facets. At the same levels of Ce3+/Ce4+ ions and oxygen vacancies on the surfaces, CeO2 nanocubes with exposed {100} facets displayed a higher peroxidase but lower SOD mimetic activity than those of the CeO2 nanorods with exposed {110} facets. Therefore, integrated factors, including exposed facets, Ce3+/Ce4+ ratio, and oxygen vacancy surface content, should be carefully considered when CeO2 nanostructures are employed as antioxidant and therapeutic agent for various diseases on the basis of their redox enzyme-mimicking activities. Our results provide new insight into the redox enzyme-mimicking activities of CeO2 nanostructures, as well as the design and synthesis of other inorganic nanomaterials-based artificial enzymes.
Methods
Materials
Sodium hydroxide (NaOH, 96%), hydrogen peroxide (H2O2, 30%), acetic acid (99.5%) and cerium nitrate hexahydrate (Ce(NO3)3·6H2O, 99%) were of analytical grade and purchased from Sinopharm Chemical Reagent Co. (Shanghai, China). 3,3′,5,5′-tetramethyl-benzidine (TMB, 98%) was obtained from Aladdin (Shanghai, China). Silicon (SRM™ 640e) was obtained from National Institute of Standards and Technology (NIST). All reagents were used as received without further purification.
Synthesis of CeO2 nanostructures
In a typical synthesis, 20 mL of Ce(NO3) 3·6H2O solution (0.1 mol/L) was added dropwise into NaOH solution (0.1 mol/L for nanocubes and 12 mol/L for nanorods). The mixed solution was then transferred and sealed in a 50 mL Teflon-lined stainless steel autoclave, with subsequent heating for 24 h. The heating temperature was kept at 140 °C for nanocubes and 100 °C for nanorods. After the reaction, the precipitate was collected by centrifugation (9000 rpm, 5 min) and washed alternately with ethanol and deionized water several times, and then dried at 60 °C in the air.
Characterization of CeO2 nanostructures
The phase structure of the samples was identified by powder X-ray diffraction (XRD) on a D8 Advance diffractometer using Cu Kα radiation (λ = 1.5418 Å). NIST SRM™ 640e was used to obtain the instrumental broadening profile. X-ray photoelectron spectroscopy (XPS) measurements were performed on a spectrometer (Axis Ultra DLD-600W, Kratos Analytical Ltd.) using Al Kα radiation as the excitation source. The morphologies of the samples were observed using high resolution transmission electron microscopy (HRTEM, JEM-2100F STEM/EDS, JEOL Corp, Japan). The Raman spectra of the samples were recorded by a Raman spectrometer with a 325 nm laser excitation (VERTEX 70, Bruker, Germany). The UV-Vis spectra of the samples were recorded with an ultraviolet–visible spectrometer (Shimadzu Corp., UV-2550 PC).
Enzyme mimetic activity of CeO2 nanostructures
The peroxidase mimetic activity of CeO2 was evaluated by monitoring the redox reaction between TMB and H2O2 in the presence of the CeO2 nanostructures. Typically, 1 mL acetate buffer solution (50 mM, pH = 4.0) containing 25 μg CeO2, 0.5 μmol TMB, and 1 mol H2O2 was added in a cuvette. The reaction was monitored using an ultraviolet–visible spectroscopy (Shimadzu Corp., UV-2550 PC) at wavelength of 652 nm. The measurement was recorded at an interval of one minute and the temperature was kept at 25 °C. In order to obtain the apparent kinetic parameters, experiments varying concentrations of the substrates were carried out. The measurement was recorded at an interval of 10 seconds in order to obtain a higher accuracy. All the rest reaction conditions were unchanged. More details on the calculation of apparent kinetic parameters can be found in the Supplementary Information. The SOD mimetic activity of CeO2 nanostructures was determined with colorimetric assay kits (Nanjing Jiancheng Bioengineering Institute, China).
Data process
All the non-linear curve fittings (XRD, XPS and Michaelis-Menten Kinetic) were processed using software Fityk (version 1.3.0)33. All the experiments were repeated at least triplicated to obtain the standard deviation.
Additional Information
How to cite this article: Yang, Y. et al. Redox enzyme-mimicking activities of CeO2 nanostructures: Intrinsic influence of exposed facets. Sci. Rep. 6, 35344; doi: 10.1038/srep35344 (2016).
Supplementary Material
Acknowledgments
This work was financially supported by the Natural Science Foundation of China (Nos 30800256 and 31301735), and the basic research project of Wuhan Science and Technology Bureau (No. 2014060101010041).
Footnotes
Author Contributions Y.Y., Z.M., W.H. and L.L. synthesized the CeO2 nanostructures and evaluated the enzyme mimicking activities. Y.Y. analyzed the data. Y.Y., J.L. and Q.W. designed the whole work and drafted the manuscript. All the authors revised the manuscript.
References
- Celardo I., Pedersen J. Z., Traversa E. & Ghibelli L. Pharmacological potential of cerium oxide nanoparticles. Nanoscale 3, 1411–1420 (2011). [DOI] [PubMed] [Google Scholar]
- Wason M. S. & Zhao J. Cerium oxide nanoparticles: Potential applications for cancer and other diseases. Am. J. Transl. Res. 5, 126–131 (2013). [PMC free article] [PubMed] [Google Scholar]
- Xu C. & Qu X. Cerium oxide nanoparticle: a remarkably versatile rare earth nanomaterial for biological applications. NPG Asia Mater. 6, e90 (2014). [Google Scholar]
- Heckman K. L. et al. Custom Cerium Oxide Nanoparticles Protect against a Free Radical Mediated Autoimmune Degenerative Disease in the Brain. ACS Nano 7, 10582–10596 (2013). [DOI] [PubMed] [Google Scholar]
- Korsvik C., Patil S., Seal S. & Self W. T. Superoxide dismutase mimetic properties exhibited by vacancy engineered ceria nanoparticles. Chem. Commun. 1056–1058 (2007). [DOI] [PubMed] [Google Scholar]
- Heckert E. G., Karakoti A. S., Seal S. & Self W. T. The role of cerium redox state in the SOD mimetic activity of nanoceria. Biomaterials 29, 2705–2709 (2008). [DOI] [PMC free article] [PubMed] [Google Scholar]
- Liu X. et al. Apoferritin–CeO2 nanotruffle that has excellent artificial redox enzyme activity. Chem. Commun. 48, 3155–3157 (2012). [DOI] [PubMed] [Google Scholar]
- Pirmohamed T. et al. Nanoceria exhibit redox state-dependent catalase mimetic activity. Chem. Commun. 46, 2736–2738 (2010). [DOI] [PMC free article] [PubMed] [Google Scholar]
- Singh S. et al. A phosphate-dependent shift in redox state of cerium oxide nanoparticles and its effects on catalytic properties. Biomaterials 32, 6745–6753 (2011). [DOI] [PMC free article] [PubMed] [Google Scholar]
- Singh R. & Singh S. Role of Phosphate on Stability and Catalase Mimetic Activity of Cerium Oxide Nanoparticles. Colloids Surfaces B Biointerfaces 132, 78–84 (2015). [DOI] [PubMed] [Google Scholar]
- Xiao X., Luan Q., Yao X. & Zhou K. Single-crystal CeO2 nanocubes used for the direct electron transfer and electrocatalysis of horseradish peroxidase. Biosens. Bioelectron. 24, 2447–2451 (2009). [DOI] [PubMed] [Google Scholar]
- Li X., Zhang Z., Tao L., Li Y. & Li Y. Y. A chemiluminescence microarray based on catalysis by CeO2 nanoparticles and its application to determine the rate of removal of hydrogen peroxide by human erythrocytes. Appl. Biochem. Biotechnol. 171, 63–71 (2013). [DOI] [PubMed] [Google Scholar]
- Wang N., Sun J., Chen L., Fan H. & Ai S. A Cu2(OH)3Cl-CeO2 nanocomposite with peroxidase-like activity, and its application to the determination of hydrogen peroxide, glucose and cholesterol. Microchim. Acta 182, 1733–1738 (2015). [Google Scholar]
- Tian Z. et al. Highly sensitive and robust peroxidase-like activity of porous nanorods of ceria and their application for breast cancer detection. Biomaterials 59, 116–124 (2015). [DOI] [PubMed] [Google Scholar]
- Zhao H., Dong Y., Jiang P., Wang G. & Zhang J. Highly Dispersed CeO2 on TiO2 Nanotube: A Synergistic Nanocomposite with Superior Peroxidase-Like Activity. ACS Appl. Mater. Interfaces 7, 6451–6461 (2015). [DOI] [PubMed] [Google Scholar]
- Vernekar A. A., Das T. & Mugesh G. Vacancy-Engineered Nanoceria: Enzyme Mimetic Hotspots for the Degradation of Nerve Agents. Angew. Chemie Int. Ed. 54, 1–6 (2015). [DOI] [PubMed] [Google Scholar]
- Kuchma M. H. et al. Phosphate ester hydrolysis of biologically relevant molecules by cerium oxide nanoparticles. Nanomedicine Nanotechnology, Biol. Med. 6, 738–744 (2010). [DOI] [PubMed] [Google Scholar]
- Tan F. et al. An efficient method for dephosphorylation of phosphopeptides by cerium oxide. J. Mass Spectrom. 43, 628–632 (2008). [DOI] [PubMed] [Google Scholar]
- Asati M. A., Santra D. S., Kaittanis M. C., Nath D. S. & Perez P. J. M. Oxidase Activity of Polymer-Coated Cerium Oxide Nanoparticles. Angew. Chem. Int. Ed. 48, 2308–2312 (2010). [DOI] [PMC free article] [PubMed] [Google Scholar]
- Tian N., Zhou Z.-Y., Sun S.-G., Ding Y. & Wang Z. L. Synthesis of Tetrahexahedral Platinum Nanocrystals with High-Index Facets and High Electro-Oxidation Activity. Science 316, 732–735 (2007). [DOI] [PubMed] [Google Scholar]
- Mu J., Zhang L., Zhao G. & Wang Y. The crystal plane effect on the peroxidase-like catalytic properties of Co3O4 nanomaterials. Phys. Chem. Chem. Phys. 16, 15709 (2014). [DOI] [PubMed] [Google Scholar]
- Yu J., Low J., Xiao W., Zhou P. & Jaroniec M. Enhanced photocatalytic CO2-Reduction activity of anatase TiO2 by Coexposed {001} and {101} facets. J. Am. Chem. Soc. 136, 8839–8842 (2014). [DOI] [PubMed] [Google Scholar]
- Lin Y., Ren J. & Qu X. Catalytically active nanomaterials: a promising candidate for artificial enzymes. Acc. Chem. Res. 47, 1097–1105 (2014). [DOI] [PubMed] [Google Scholar]
- Shen X. et al. Mechanisms of Oxidase and Superoxide Dismutation-like Activities of Gold, Silver, Platinum, and Palladium, and Their Alloys: A General Way to the Activation of Molecular Oxygen. J. Am. Chem. Soc. 137, 15882–15891 (2015). [DOI] [PubMed] [Google Scholar]
- Aneggi E., Llorca J., Boaro M. & Trovarelli A. Surface-structure sensitivity of CO oxidation over polycrystalline ceria powders. J. Catal. 234, 88–95 (2005). [Google Scholar]
- Agarwal S., Zhu X., Hensen E. J. M., Mojet B. L. & Lefferts L. Surface-Dependence of Defect Chemistry of Nanostructured Ceria. J. Phys. Chem. C 119, 12423–12433 (2015). [Google Scholar]
- Hu Z. et al. Effect of Ceria Crystal Plane on the Physicochemical and Catalytic Properties of Pd/Ceria for CO and Propane Oxidation. ACS Catal. 6, 2265–2279 (2016). [Google Scholar]
- Tang K. et al. The Effect of Exposed Facets of Ceria to the Nickel Species in Nickel-Ceria Catalysts and Their Performance in a NO+ CO Reaction. ACS Appl. Mater. Interfaces 7, 26839–26849 (2015). [DOI] [PubMed] [Google Scholar]
- Sun C., Li H. & Chen L. Nanostructured ceria-based materials: synthesis, properties, and applications. Energy Environ. Sci. 5, 8475–8505 (2012). [Google Scholar]
- Zhang D., Du X., Shi L. & Gao R. Shape-controlled synthesis and catalytic application of ceria nanomaterials. Dalton Trans. 41, 14455–14475 (2012). [DOI] [PubMed] [Google Scholar]
- Younis A., Chu D., Kaneti Y. V. & Li S. Tuning the surface oxygen concentration of {111} surrounded ceria nanocrystals for enhanced photocatalytic activities. Nanoscale 8, 378–387 (2016). [DOI] [PubMed] [Google Scholar]
- Momma K. & Izumi F. VESTA 3 for three-dimensional visualization of crystal, volumetric and morphology data. J. Appl. Crystallogr. 44, 1272–1276 (2011). [Google Scholar]
- Wojdyr M. Fityk. A general-purpose peak fitting program. J. Appl. Crystallogr. 43, 1126–1128 (2010). [Google Scholar]
- Pawley G. S. Unit-cell refinement from powder diffraction scans. J. Appl. Crystallogr. 14, 357–361 (1981). [Google Scholar]
- Scardi P., Leoni M. & Delhez R. Line broadening analysis using integral breadth methods: A critical review. J. Appl. Crystallogr. 37, 381–390 (2004). [Google Scholar]
- Natile M. M. & Glisenti A. CoOx/CeO2 Nanocomposite Powders: Synthesis, Characterization, and Reactivity. Chem. Mater. 17, 3403–3414 (2005). [Google Scholar]
- Reddy B. M. et al. Surface Characterization of CeO2/SiO2 and V2O5/CeO2/SiO2 Catalysts by Raman, XPS, and Other Techniques. J. Phys. Chem. B 106, 10964–10972 (2002). [Google Scholar]
- Wu Z., Li M., Howe J., Meyer H. M. & Overbury S. H. Probing defect sites on CeO2 nanocrystals with well-defined surface planes by raman spectroscopy and O2 adsorption. Langmuir 26, 16595–16606 (2010). [DOI] [PubMed] [Google Scholar]
- Spanier J. E., Robinson R. D., Zhang F., Chan S.-W. & Herman I. P. Size-dependent properties of CeO2-y nanoparticles as studied by Raman scattering. Phys. Rev. B 64, 245407 (2001). [Google Scholar]
- Gao L. et al. Intrinsic peroxidase-like activity of ferromagnetic nanoparticles. Nat. Nanotechnol. 2, 577–583 (2007). [DOI] [PubMed] [Google Scholar]
- Huang W. Oxide Nanocrystal Model Catalysts. Acc. Chem. Res. 49, 520–527 (2016). [DOI] [PubMed] [Google Scholar]
- Mullins D. R. The surface chemistry of cerium oxide. Surf. Sci. Rep. 70, 42–85 (2015). [Google Scholar]
- Paier J., Penschke C. & Sauer J. Oxygen defects and surface chemistry of ceria: Quantum chemical studies compared to experiment. Chem. Rev. 113, 3949–3985 (2013). [DOI] [PubMed] [Google Scholar]
- Conesa J. Computer modeling of surfaces and defects on cerium dioxide. Surf. Sci. 339, 337–352 (1995). [Google Scholar]
Associated Data
This section collects any data citations, data availability statements, or supplementary materials included in this article.


