

Summary
Education of first responders and referring medical professionals is considered vital to high-quality burn care. Prior to 1999, the community education program at The Burn Center of MedStar Washington Hospital Center (MWHC) was staffed by ICU nurses who volunteered their time. As the program became more popular in the mid-1990s, the requests for lectures exceeded the capacity of a volunteer program. A request to hospital administration for a full-time education coordinator position was rejected in the climate of budget cut-backs and declining reimbursement. A business-oriented proposal, ultimately accepted, promised an increase in admissions, an improved payor mix, and an annual review of data to demonstrate the cost/benefit advantage. To advertise the creation of the coordinator position and education programs, letters were mailed to local fire departments, nursing schools and emergency departments. The response was positive, and, with a full-time coordinator, the requests were accommodated in a timely manner. Community education programs increased almost four-fold. Average annual admissions increased initially from 292 to 374 and have continued to increase, rising to 812 in fiscal year 2008. As expected, the average percent total body surface area burns decreased (from 10.8% to 6.9%), reflecting increased referral of smaller burns and, inferentially and per analysis, an improved payor mix. Most impressive was the increase in charitable donations, from an annual average of $27,500 before the position was created to an average of $183,000 annually thereafter. From this experience as well as the experience discovered by a national survey, there are desirable side effects of a full-time community burn education program coordinator, and the cost for The Burn Center at MWHC has been more than balanced by the benefits.
Keywords: brûlure, prévention, formation locale de la communauté, soins
Abstract
La formation des premiers appelés et des professionnels référents est considérée comme fondamentale pour la qualité des soins aux brûlés. Avant 1999, le programme de formation de la société du CTB de l’hôpital MedStar de Washington DC (MWHC) était géré par des infirmières de réanimation volontaires. Dans le milieu des années 1990 ce programme, rencontrant un auditoire de plus en plus large, le volontariat n’était plus matériellement possible. Une demande de création de poste de coordinateur de formation plein-temps a été refusée par l’administration, dans un contexte de restrictions budgétaires. La promesse d’une augmentation des hospitalisations, d’une meilleure valorisation des séjours et d’une évaluation annuelle de l’amélioration du rapport coût/service rendu a finalement emporté la conviction. Les pompiers, écoles d’infirmières et services d’urgence ont été avertis par voie postale de la mise en place de ce coordinateur. Ces formations, dès lors réalisées sur rendez-vous, ont quadruplé. Le nombre d’admissions est passé de 292 au préalable à 812 en 2008 et la surface moyenne brûlée a baissé de 10.8 à 6.9%, témoignant d’une augmentation des hospitalisations pour brûlure peu étendues. Il a, comme prévu, été observé une meilleure valorisation. De manière plus inattendue, les dons sont passés de 27 500$ à 183 000$ annuels avant/après. Notre expérience, ainsi que les résultats d’une étude nationale montre l’intérêt de la mise en place d’un coordinateur de la formation en matière de brûlures, qui a montré son intérêt médico-économique dans le CTB du MWHC.
Introduction
There is very little published experience regarding burn center education and outreach beyond that of injury prevention. A small collection of articles exist pertaining to the experiences of nurse coordinators in the field of trauma, which support the importance of this role in the face of trauma center financial challenges.1-9 The financial challenges of burn centers have also been well-documented, with suggestions for improvements but lacking an agreed upon remedy.10-23 Here, we present a review of relevant literature pertaining to the role of an outreach and education-dedicated individual in a burn center as well as a historical case study of our burn center’s own outreach education program and the advantages it has provided
Scope of the issue
The National Burn Repository (NBR) represents data on approximately 60% of burn patients treated yearly in North American burn centers.24 It is important to highlight that 40% of patients with burn injuries are not treated in burn centers, thus data on their outcomes and whether they would have benefitted from referral to a specialized center are not reflected in the NBR, which collects its data via the participation of burn centers.24 There are 4,000 burnrelated deaths each year, and 75% of these deaths occur before burn center referral or patient arrival, making referral patterns and outcomes of non-burn centers important to continually examine and improve.24
A two-year study examining all burn injuries in the state of North Carolina by ICD-9 codes showed that 2,036 adult patients sustained injuries that required hospitalization, with 70% of those meeting American Burn Association (ABA) burn-center referral criteria. Only 67% of the approximately 1425 patients meeting ABA referral criteria were indeed referred to burn centers, leaving an estimate of 470 patients without the specialized care they may have required.24 Of the total burned adult population in the study, 952 patients were entirely treated at non-burn centers, and 45% of this group met referral criteria without being transferred; an estimate of 428 patients who went without the recommended specialized burn care.24 All burnrelated deaths that occurred at non-burn centers in this study also met referral criteria.24 Hospital length of stay was found to be longer for patients at burn centers than those at non-burn centers, however, more of the patients discharged from burn centers went directly home, while those discharged from non-burn centers went to rehab centers or home with health services.24 Most surprisingly, 39% of all burn-related operative procedures examined in the study were performed at non-burn centers, and half of these were done on patients who met burn center referral criteria but were not referred.24 It is no secret that patients without insurance are more likely to be referred to regional burn centers than those with insurance.15,23 Indeed, in this study, more patients who were covered by Medicare were treated at non-burn centers, with the authors raising the question of whether these patients are not being referred to burn centers due to financial incentives.24 Methods aimed at increasing referrals to verified burn centers are needed and may be addressed by employment of an outreach educator who makes this a primary focus.
The American College of Surgeons Committee on Trauma (ACSCOT) provides formal guidelines on trauma center structure and conducts visits for verification of these guidelines.2 In 2001, the Stanford University School of Medicine Department of Surgery experienced an unsuccessful visit with ACSCOT, and to remedy their deficiencies, the hiring of a nurse coordinator and the development of an outreach program were instituted.2 Two years later in 2003, the program was successfully verified as a level I trauma center.2 The trauma nurse coordinator is the position in the literature most similar to the position employed at The Burn Center at Medstar Washington Hospital Center (MWHC). Roles and responsibilities for a trauma nurse coordinator were initially described in a publication in 2004 as general trauma management, data collection, maintenance of a trauma database, evaluation and improvement of trauma care, and educating staff in the concept of trauma teams and systems.7 The trauma nurse coordinator is described as “the stabilizing force in the trauma multidisciplinary team, a resource to staff, a role model for excellence in practice, and a patient advocate”,9 and trauma center verification reviews by the American College of Surgeons have been cited as deficient due to a lack of a person filling this position,25 highlighting its importance to the success of a trauma center. The trauma nurse coordinator is a position that evolves, focusing on process improvement and standards of care after the development of the data, outreach, and research infrastructure.7 Health care costs are increasing with more competition for and difficult decisions regarding a finite amount of financial resources, but commitment to nurse education is imperative, given the direct impact it has been shown to have on quality of care.8
Examination of the outreach education program at The Burn center of MWHc
Development of the outreach education program at The Burn Center at MWHC was driven by two different perspectives. One was altruism in a group of dedicated burn nurses who saw a need for outreach education to improve the pre-transfer management of critical burn patients. The other was the survival instincts of a burn director who saw the future of a tertiary care center threatened by the changing medical economics of the 1990s.
In the pre-Advanced Burn Life Support (ABLS) days of the 1980s, members of the nursing staff of The Burn Center at MWHC raised concerns over the suboptimal care of the burn patients in the field and emergency departments prior to transport to The Burn Center. With encouragement from nursing management, one of the intensive care unit (ICU) primary nurses volunteered to chair an outreach committee. The intention was to provide education to first responders and emergency department personnel. Nursing staff members were recruited as members of the committee. A letter offering an educational session was mailed to local firefighting and emergency medical service units and to emergency departments. A lecture was outlined, and slides were created for presentation on the emergency care and transport of acute burns. The lecture was offered to fire stations and training academies and was scheduled for days, evenings and weekends as requested. Initially the response was small, but through word of mouth in the community, requests for education slowly increased. With time, a positive result was visible and pre-hospital care improved.
Through the early 1990s, nursing administration continued to support the program, providing flexible scheduling for the lecturers. However, that generosity shrank when the hospital experienced a significant nursing shortage; the resulting scheduling inflexibility forced cancellation of lectures. Compounding this issue, the volunteer pool diminished as it became necessary for the volunteer outreach nurses to schedule lectures only on their days off.
Concurrently, the adverse financial impact of diagnosis related groups (DRGs) was being felt by many hospitals, and several burn units around the country were closed for financial reasons. 10,11,14,18,19 Administrators and financial planners began to scrutinize the clinical service lines with negative fiscal profiles, and even those with the potential to be financially neutral were targeted for reduction or elimination to free up bed space for high-volume, highprofit- margin specialties. Historically, burn units had not been considered profitable, and MWHC’s burn service had long been under scrutiny by the hospital’s financial planners. In spite of slow but steady increases in annual admissions since its inception in 1972, The Burn Center’s annual admission rate had reached a plateau of 280-320 patients per year in the early 1990s. Annual analysis showed a less-than-desirable payor mix with an annual 15-18% “self-insured” patients and 26-28% of patients with DC Medicaid. The Medicare patient group only constituted 11% of the annual admissions. In addition, with Medicaid paying self-styled DRG rates and “self-insured” patients paying much less than 10% of charges, reimbursements were not optimal. With a relatively small daily census and admission rate, admission of only one or two major critically- ill burn patients per year with large bills and poor payments could drive The Burn Center’s budget deeply into negative fiscal standing.
The director saw an opportunity to improve the economics of The Burn Center by increasing admissions and the daily census and proposed to do that through an active outreach program. The concept of expanding a money-losing service was difficult to explain to hospital administrators, but, nevertheless, a cogent argument was prepared. Population-based projections and local government data suggested that an additional 300+ patients were being treated annually and spread among the 35 other hospitals in the referral region. The obvious and logical assumption was that these patients were not being referred because they were small burns and/or were insured patients that other hospitals found fiscally advantageous to keep.
The hospital president accepted the idea and, in a show of faith, created a new full-time position under The Burn Center director for the purpose of marketing the burn service. This position, entitled Education Coordinator, required a veteran nurse whose schedule would be protected by employment in the burn section of general surgery. The plan was centered on an active, aggressive promotion of The Burn Center’s outreach education and prevention programs. An assumption was made that the medical professionals in the community had negative financial incentive to refer insured patients. Thus, the program was designed to reach out beyond the health care professionals to the public at large in the hope that educated patients would request to be referred to a specialty center for burn treatment. Some of the efforts of the outreach education program include recruiting new graduate nurses to the field of burn care, teaching Advanced Burn Life Support courses, community burn prevention outreach, education of prehospital first responders, and marketing of The Burn Center to the public. A promise was made to the hospital’s president that the program would be monitored for effectiveness and costs compared to benefits.
Methods of program examination:to monitor the education outreach program, data were collected from the burn center patient registry, financial ledgers for the burn service and the nursing units, the records of outreach activities, and the periodic reports from the institution’s fundraising foundation. The data were analyzed by time increments matching at least the five years before and since the education coordinator became a full-time position. Figures were prepared from the tabulated data and reflect the trends that were observed before and after the creation of a fulltime coordinator position. In appropriate cases, means of values for the time periods pre- and since the inception of the coordinator position were calculated and compared for statistical analysis. A two-tailed t-test was utilized to measure statistical significance with a p value set at 0.05
Results of program examination
Increased annual admissions : after hiring an outreach education coordinator, this burn center observed a steady increase in annual burn admissions from a prior average of 302 per year to an unprecedented peak of 812 in fiscal year (FY) 2008. Fig. 1 illustrates admission trends from 1992 through 2008 as well as averages from years pre-coordinator to those after the inception of the outreach education coordinator program. The average number of annual admissions increased from 297 ± 20 (1992-1999) to 525 ± 166 (2000-2008), which was statistically significant with a p value of 0.0016.
Fig. 1. Burn Center admissions. Annual admissions were queried from the Burn Registry of MWHC for each fiscal year. The left panel shows the trends by year for admission numbers to The Burn Center at MWHC and the right panel shows averages before and after the inception of the outreach education coordinator program. The average number of admissions increased from 297 ± 20 to 525 ± 166, which was statistically significant with a p value of 0.0016. Error bars represent standard deviations of the mean. Values represented as triangles correspond to years prior to the inception of the coordinator position. Circles represent data from years since the creation of the position.

Decreased % TBSA burn injury: annual % TBSA data were analyzed and Fig. 2 illustrates trends in the burn sizes of referred patients from 1992 through 2008 as well as averages from years pre-coordinator to those after the inception of the outreach education coordinator program. The average TBSA of patients referred decreased from 10.8 ± 1.7 to 6.9 ± 2.6, which was statistically significant with a p-value of 0.007.
Fig. 2. Decreases in burn extent. The average % TBSA was computed for the time periods before and after the creation of the coordinator position. The left panel shows the trends by year for average TBSA of patients referred to The Burn Center at MWHC and the right panel shows averages before and after the inception of the outreach education coordinator program. The average TBSA of patients referred decreased from 10.8 ± 1.7 to 6.9 ± 2.6, which was statistically significant with a p value of 0.007. Error bars represent standard deviations of the mean. Values represented as triangles correspond to years prior to the inception of the coordinator position. Circles represent data from years since the creation of the position.

Increased operative procedure volume: Fig. 3 details the trend observed in the yearly number of burn surgical procedures performed as well as averages from years precoordinator to those after the inception of the outreach education coordinator program. Since the introduction of a full-time coordinator, a clear increase has been observed in this center’s operation and procedure volume. The average number of yearly operative procedures increased from 298 ± 24 (1992-1999) to 484 ± 99 (2000-2008), which was statistically significant with a p value of 0.0006.
Fig. 3. Increased operative procedure volume. The number of operative cases and procedures were queried from hospital financial records for each fiscal year. The left panel shows the trends by year for number of operative procedures at The Burn Center at MWHC and the right panel shows averages before and after the inception of the outreach education coordinator program. The average number of yearly operative procedures increased from 298 ± 24 to 484 ± 99, which was statistically significant with a p value of 0.0006. Error bars represent standard deviations of the mean. Values represented as triangles correspond to years prior to the inception of the coordinator position. Circles represent data from years since the creation of the position.

Improved length of stay (LOS) indices: two indicators of LOS were assessed - ICU length of stay as well as total hospital length of stay. Fig. 4 details the trend observed in burn patients’ ICU and hospital lengths of stay as well as averages from years pre-coordinator to those after the inception of the outreach education coordinator program. The average ICU length of stay decreased from 3.8 ± 0.7 (1992-1999) to 2.1 ± 0.7 days (2000-2008), which was statistically significant with a p value of 0.004. The average total hospital length of stay decreased from 12.2 ± 1.9 (1992-1999) to 8.0 ± 1.5 days (2000-2008), which was also statistically significant with a p value of 0.003.
Fig. 4. Decreased length of stay. Average LOS for each fiscal year was computed. The left panel shows the trends by year for average length of ICU and hospital stay at The Burn Center at MWHC and the right panel shows averages before and after the inception of the outreach education coordinator program. The average ICU length of stay decreased from 3.8 ± 0.7 to 2.1 ± 0.7 days, which was statistically significant with a p value of 0.004. The average total hospital length of stay decreased from 12.2 ± 1.9 to 8.0 ± 1.5 days, which was also statistically significant with a p value of 0.003. Error bars represent standard deviations of the mean. Values represented as triangles correspond to years prior to the inception of the coordinator position. Circles represent data from years since the creation of the position.

Improved payor mix and average collection rates: the proportion of sub-optimally-insured patients declined as the new patient admission numbers increased (Fig. 5). As predicted, the less-adequate payors - Medicaid and “selfinsured” - decreased from a total of over 40% (1992-1999) to less than 25% (2000-2008). The profit margin increased, and our “business” increased in critical mass. Using standard time-honored reimbursement assumptions by payor classes, the change in overall collection rates for hospital services were extrapolated. With payor classes determined for pre- and post-coordinator eras, the assumptions were multiplied by relative weights, and this revealed that the estimated average annual gross collection rates increased from 37.8% (1992-1999) to 43.4% (2000-2008).
Fig. 5. Payor mix improvement. Financial data were collected and averaged from the time periods before coordinator position creation (left panel), and after (right panel). The proportion of patients covered by private insurance and Medicare increased, decreasing the proportion of patients presenting with Medicaid or “Self-Insurance.”.

Attributable additional costs of the coordinator position: the costs of the program are measurable, and those are reviewed annually. One measurable cost is the relentless, rising cost of gasoline. As the coordinator’s travel miles have increased, transportation costs per year have risen disproportionately from an initial $0.27 per mile in 1999 to $0.53 per mile in 2008, which parallels those changes in standard mileage rates seen over time according to the Internal Revenue Service (Fig. 6). The costs of logo-branded giveaways are illustrated in Fig. 7. This cost parallels somewhat the increased number and size of marketing activities. Examples are fire department open houses and television stations’ annual health expositions. This is, nonetheless, a controllable cost. It is difficult to estimate the return specific to this investment but the people with inquiries about burn care who have dialed the 1-800-WHC-BURN number may well have found that phone number on their refrigerator magnets, pencils, balloons, coffee mugs and brochures.
Fig. 6. Travel costs. Mileage and fuel usage logs were tabulated from 1999 to 2008. A second order polynomial nonlinear regression was used to display the overall trends of increase in miles traveled and gasoline expenses.

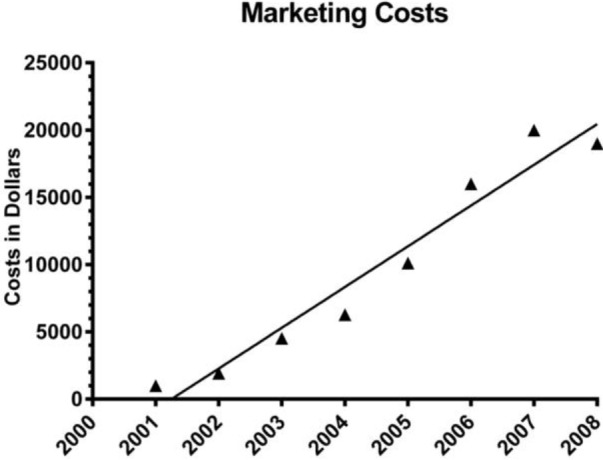
Fig. 7. Marketing costs.Overall costs of purchases made for marketing purposes were calculated for the years 2001 to 2008. Linear regression was used to display the overall trend of increase.
Increased charitable donations: a measurable, albeit unexpected, side benefit of the outreach program was the prodigious increase in charitable donations to The Burn Center. It is noteworthy that the firefighters in the region have always supported the burn center with gifts from annual fundraising events. As the outreach program has expanded, so have the annual total dollars donated by firefighters and civilians who gained awareness of The Burn Center via the outreach education and prevention program. Annual charitable donations prior to the employment of a dedicated outreach coordinator were $27,506 ± 19,911 on average, and increased to $183,386 ± 54,431 annually thereafter (p<0.0001). Of note, there was a large bolus of charitable donations that occurred circa 9/11/2001. These additional donations were not included as part of these data (Fig. 8).
Fig. 8. Charitable donations. Annual charitable donations were tabulated. The left panel shows the trends by year for amount of charitable donations to The Burn Center at MWHC and the right panel shows averages before and after the inception of the outreach education coordinator program. The average amount of yearly charitable donations increased from $27,506 ± 19911 to $183,386 ± 54,432, which was statistically significant with a p value less than 0.0001. Error bars represent standard deviations of the mean. Values represented as triangles correspond to years prior to the inception of the coordinator position. Circles represent data from years since the creation of the position.

Maintained outreach event activity: since the inception of the official program, the number of annual events has exceeded 100 with some years hosting as many as 140 (Fig. 9). Classes and events provided to first responders and nursing students have remained a large proportion of the efforts. Other events have included local Boy Scout groups, Parent-Teacher Associations, and assisted-living facilities. ABLS classes were offered originally in 2001 and initially only two courses were conducted annually. Since 2003, the Education Coordinator at this center has offered at least 10 courses annually (Fig. 10).
Fig. 9. Outreach and education activities. The daily activity log of the coordinator was tabulated. The left panel shows the trends by year for number of outreach and education activities sponsored by The Burn Center at MWHC and the right panel shows averages before and after the inception of the outreach education coordinator program. The average number of yearly activities increased from 10 ± 13 to 115 ± 16, which was statistically significant with a p value less than 0.0001. Error bars represent standard deviations of the mean. Values represented as triangles correspond to years prior to the inception of the coordinator position. Circles represent data from years since the creation of the position.

Fig. 10. ABLS courses. The number of courses offered annually from 2001 to 2008 were totaled. Linear regression was used to display the overall trend of increase.

Discussion
Here in are measurable parameters before and after instituting an outreach education coordinator position (and program) at our burn center. As these data underscore, there has been positive change in multiple facets of this burn center’s health. It is unlikely that the summed expansion and positive fiscal improvements seen at this burn center were merely coincidental.
No citations were found in the literature as to the function or positive benefits of outreach education coordinators in the burn community. The trauma literature provided some insight with an article that describes the role of the trauma outreach coordinator(s) in Australia and New Zealand.7 In this paper most respondents to a survey reported that much of their time was spent fulfilling data registry requirements. At our burn center, this is also a role that is fulfilled by the coordinator, however, this is not a primary role, and the majority of time is not spent on this task.
Success of this program has been dependent on a number of factors: 1) the identification of a need for burn care education and prevention programs in the geographical region, 2) support from hospital administration, and 3) most importantly, an experienced, enthusiastic, flexible member of the burn team who is willing to provide the education to medical professionals and the public. These factors combined to influence the results shared above, not least of which was the identification of over 300 patients a year as appropriate referral sources to this burn center, leading to increased yearly admissions, operative procedures and financial solvency.
The coordinator’s efforts at this burn center are clearly also gaining positive attention through activities which include: organizing Advanced Burn Life Support (ABLS) courses, recruiting new nurses through exposure to burn care, and collaborating with public relations and marketing for the hospital as well as The Burn Center at MWHC. The outreach education coordinator has been active in disseminating the ABA Referral Criteria26 to health care professionals and the public, and has made a huge impact on prehospital care as reported by burn center staff. The coordinator has also partnered with the local firefighter burn foundation that aims to promote prevention. Recently this partnership has resulted in grant funding to enable successful implementation of further outreach and education efforts.
Conclusions
In summary, though current literature on this subject is sparse, the need for outreach support for burn centers and the populations they serve is clear. The benefits of an education coordinator position can include: improved prehospital care of the burn patient, increased referral of burn patients, education of the public to the existence and benefits of the burn center, increase in charitable donations, recruitment of graduating nursing students into the field of burn care, and awareness of burn hazards leading to the prevention of burn injuries. The outreach education program has benefits that extend beyond the altruistic. In this burn center’s experience, the program only reached its full potential after a full-time position was created for the Education Coordinator. Our analysis confirmed the soundness of the financial investment and revealed additional unanticipated beneficial effects.
Acknowledgments
* This work was originally presented at the 38th annual American Burn Association meeting. Abstract #253.
References
- 1.Blansfield JS. The career spectrum in emergency nursing. Trauma nurse coordinator. J Emerg Nurs. 1996;22:486–488. doi: 10.1016/s0099-1767(96)80188-7. [DOI] [PubMed] [Google Scholar]
- 2.Maggio PM, Brundage SI, Hernandez-Boussard T, Spain DA. Commitment to COT verification improves patient outcomes and financial performance. J Trauma. 2009;67:190–194. doi: 10.1097/TA.0b013e3181a51b2f. [DOI] [PubMed] [Google Scholar]
- 3.Beachley M, Snow S, Trimble P. Developing trauma care systems: the trauma nurse coordinator. J Nurs Adm. 1988;18:34–42. [PubMed] [Google Scholar]
- 4.McArdle M, Murrin P. Role of the trauma nurse coordinator. Nurs Clin North Am. 1986;21:673–675. [PubMed] [Google Scholar]
- 5.Price JP. Trauma nurse coordinator. Crit Care Nurse. 1988;8:87–90. [PubMed] [Google Scholar]
- 6.Morgan T, Schwab CW. The trauma nurse coordinator in a regionalized system of trauma care. J Nurs Manag. 1987;18:80B–80H. doi: 10.1097/00006247-198704000-00017. [DOI] [PubMed] [Google Scholar]
- 7.Curtis K, Donoghue J. The trauma nurse coordinator in Australia and New Zealand: a progress survey of demographics, role function, and resources. J Trauma. 2008;15:34–42. doi: 10.1097/01.JTN.0000327324.37534.02. [DOI] [PubMed] [Google Scholar]
- 8.Curtis K, Leonard E. The trauma nurse coordinator in Australia and New Zealand: demographics, role, and professional development. J Trauma Nurs. 2012;19:214–220. doi: 10.1097/JTN.0b013e3182759a7d. [DOI] [PubMed] [Google Scholar]
- 9.DeKeyser FG, Paratore A, Camp L. Trauma nurse coordinator: three unique roles. J Nurs Manag. 1993;24:56A–56H. [PubMed] [Google Scholar]
- 10.Dimick AR, Potts LH, Charles ED, Jr, Wayne J, Reed IM. The cost of burn care and implications for the future on quality of care. J Trauma. 1986;26:260–266. doi: 10.1097/00005373-198603000-00009. [DOI] [PubMed] [Google Scholar]
- 11.Rees JM, Dimick AR. The cost of burn care and the federal government’s response in the 1990s. Clin Plast Surg. 1992;19:561–568. [PubMed] [Google Scholar]
- 12.Vercruysse GA, Ingram WL, Feliciano DV. The demographics of modern burn care: should most burns be cared for by non-burn surgeons? Am J Surg. 2011;201:91–96. doi: 10.1016/j.amjsurg.2009.12.023. [DOI] [PubMed] [Google Scholar]
- 13.Kastenmeier A, Faraklas I, Cochran A, et al. The evolution of resource utilization in regional burn centers. J Burn Care Res. 2010;31:130–136. doi: 10.1097/BCR.0b013e3181cb8ca2. [DOI] [PubMed] [Google Scholar]
- 14.Riffer J. Inadequate DRG payment threatens burn care. Hospitals. 1986;60:98–98. [PubMed] [Google Scholar]
- 15.Klein MB, Mack CD, Kramer CB, Heimbach DM et al. Influence of injury characteristics and payer status on burn treatment location in Washington state. J Burn Care Res. 2008;29:435–440. doi: 10.1097/BCR.0b013e3181710846. [DOI] [PMC free article] [PubMed] [Google Scholar]
- 16.Al-Mousawi AM, Jeschke MG, Herndon DN. Invited commentary on “The demographics of modern burn care: should most burns be cared for by non-burn surgeons?”. Am J Surgery. 2011;201:97–99. doi: 10.1016/j.amjsurg.2010.06.018. [DOI] [PubMed] [Google Scholar]
- 17.Vercruysse GA, Ingram WL, Feliciano DV. Overutilization of regional burn centers for pediatric patients - a healthcare system problem that should be corrected. Am J Surg. 2011;202:802–808. doi: 10.1016/j.amjsurg.2011.06.036. [DOI] [PubMed] [Google Scholar]
- 18.Warden GD, Saffle JR, Kravitz M. Potential DRG reimbursement vs actual cost for burn care. II. Referral distance. J Burn Care Rehabil. 1986;7:48–51. [PubMed] [Google Scholar]
- 19.Warden GD, Saffle JR, Kravitz M. Potential DRG reimbursement vs actual cost of burn care. I. Patients with burns of less than 25% TBSA. Journal Burn Care Rehabil. 1986;7:45–48. doi: 10.1097/00004630-198601000-00010. [DOI] [PubMed] [Google Scholar]
- 20.Mandal A. Quality and cost-effectiveness - effects in burn care. Burns. 2007;33:414–417. doi: 10.1016/j.burns.2006.08.035. [DOI] [PubMed] [Google Scholar]
- 21.Davis JS, Dearwater S, Rosales O et al. Tracking non-burn center care: what you don’t know may surprise you. J Burn Care Res. 2012;33:e263–e237. doi: 10.1097/BCR.0b013e3182504450. [DOI] [PubMed] [Google Scholar]
- 22.Brandt CP, Coffee T, Yurko L, Yowler CJ, Fratianne RB. Triage of minor burn wounds: avoiding the emergency department. J Burn Care Rehabil. 2000;21:26–28. doi: 10.1097/00004630-200021010-00006. [DOI] [PubMed] [Google Scholar]
- 23.Zonies D, Mack C, Kramer B, Rivara F, Klein M. Verified centers, nonverified centers, or other facilities: a national analysis of burn patient treatment location. J Am Coll Surg. 2010;210:299–305. doi: 10.1016/j.jamcollsurg.2009.11.008. [DOI] [PMC free article] [PubMed] [Google Scholar]
- 24.Carter JE, Neff LP, Holmes JHt. Adherence to burn center referral criteria: are patients appropriately being referred? J Burn Care Res. 2010;31:26–30. doi: 10.1097/BCR.0b013e3181cb8efb. [DOI] [PubMed] [Google Scholar]
- 25.Mitchell FL, Thal ER, Wolferth CC. American College of Surgeons Verification/Consultation Program: analysis of unsuccessful verification reviews. J Trauma. 1994;37:557–562. [PubMed] [Google Scholar]
- 26.Fagenholz PJ, Sheridan RL, Harris NS, Pelletier AJ, Camargo CA, Jr. National study of Emergency Department visits for burn injuries, 1993 to 2004. J Burn Care Res. 2007;28:681–690. doi: 10.1097/BCR.0B013E318148C9AC. [DOI] [PubMed] [Google Scholar]