

Summary
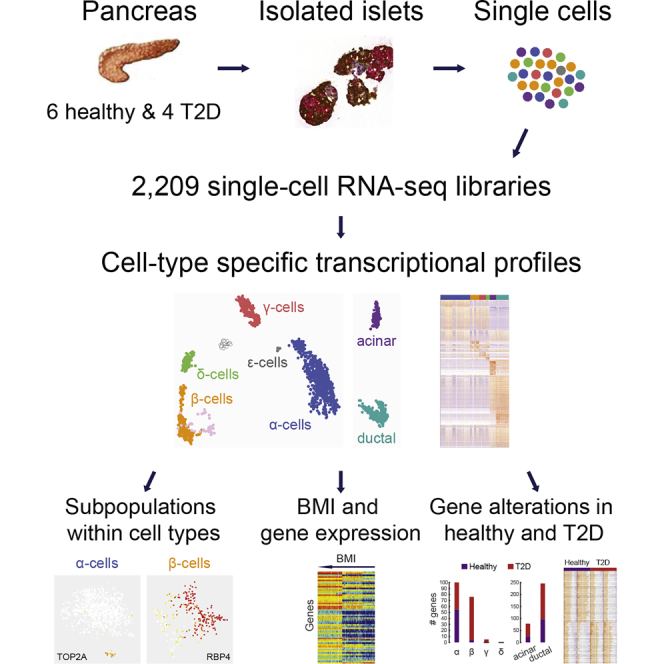
Hormone-secreting cells within pancreatic islets of Langerhans play important roles in metabolic homeostasis and disease. However, their transcriptional characterization is still incomplete. Here, we sequenced the transcriptomes of thousands of human islet cells from healthy and type 2 diabetic donors. We could define specific genetic programs for each individual endocrine and exocrine cell type, even for rare δ, γ, ε, and stellate cells, and revealed subpopulations of α, β, and acinar cells. Intriguingly, δ cells expressed several important receptors, indicating an unrecognized importance of these cells in integrating paracrine and systemic metabolic signals. Genes previously associated with obesity or diabetes were found to correlate with BMI. Finally, comparing healthy and T2D transcriptomes in a cell-type resolved manner uncovered candidates for future functional studies. Altogether, our analyses demonstrate the utility of the generated single-cell gene expression resource.
Graphical Abstract
Highlights
-
•
Single-cell RNA-seq enabled molecular profiling of rare human pancreatic cells
-
•
Subpopulations were identified within endocrine and exocrine cell types
-
•
Genes associated with obesity or diabetes had correlating expression with BMI
-
•
Transcriptional alterations found in type 2 diabetic individuals
Segerstolpe et al. use single-cell transcriptomics to generate transcriptional profiles of individual pancreatic endocrine and exocrine cells of healthy and type 2 diabetic donors. They revealed cell-type-specific gene expression and novel subpopulations, as well as gene correlations to BMI and gene expression alterations in diabetes.
Introduction
The pancreas is a vital organ for maintaining metabolic homeostasis, consisting largely of exocrine ductal and acinar cells that produce and deliver digestive enzymes into the gut. Intermingled in the exocrine regions are the islets of Langerhans, comprised of at least five distinct endocrine cell types: α cells (secreting glucagon, GCG), β cells (insulin, INS), γ/PP cells (pancreatic polypeptide, PPY), δ cells (somatostatin, SST), and ε cells (ghrelin, GHRL), together making up less than 2% of pancreas mass. The cell-type composition within human islets of Langerhans is 50%–60% β cells, 30%–45% α cells, less than 10% γ and δ cells, and less than 1% ε cells (Cabrera et al., 2006); however, this composition varies among individuals. The endocrine islets are essential for blood glucose homeostasis and key players in the development of diabetes, which is characterized by loss of functional β cells (Kahn et al., 2006). Type 2 diabetes (T2D) is caused by a combination of increasing INS resistance in peripheral tissues and reduced mass or dysfunction of the β cells.
In order to understand the molecular mechanism governing the function of the pancreas, it has been important to investigate cell-type-specific gene expression in health and disease. Due to the cellular heterogeneity within the islets of Langerhans, it is challenging to interpret whole-islet transcriptome data, and fluorescence-activated cell sorting (FACS)-enriched transcriptome data only exist for a few cell types. In particular, it is hard to distinguish cell-type compositional differences from alterations occurring within specific cell types and address whether subpopulations exist. These issues could be resolved using single-cell transcriptomics (Sandberg, 2014, Stegle et al., 2015). The two studies to date have had too few cells (Li et al., 2016, Wang et al., 2016) to control for inter-individual differences and profile rare cells.
Here, we used single-cell RNA-sequencing (RNA-seq) to generate transcriptional profiles of endocrine and exocrine cell types of the human pancreas in healthy and T2D individuals. We could reveal subpopulations in endocrine and exocrine cell types, identify genes with interesting correlations to BMI in specific cell types, and find alterations in gene expression in T2D.
Results
Pancreatic tissue and cultured islets were obtained from six healthy and four T2D donors of varying BMI and age (Figure 1A). Functionality of the islets was confirmed with glucose-stimulated INS secretion (GSIS) (Figure S1A, available online). Islets were dissociated into single-cell suspension and viable individual cells were distributed via FACS into 384-well plates containing lysis buffer (Figure S1B). Next, single-cell cDNA libraries were generated using the Smart-seq2 protocol (Picelli et al., 2014), which enables the capture of full-length poly(A)+ RNAs with higher sensitivity and more even transcriptome coverage than with previous protocols (Picelli et al., 2013, Ramsköld et al., 2012, Stegle et al., 2015). Each single-cell transcriptome was sequenced to ∼750,000 reads, sufficient for cell-type classification (Pollen et al., 2014). Gene expression was quantified as reads per kilobase of transcript per million mapped reads (RPKM) using rpkmforgenes (Ramsköld et al., 2009).
Figure 1.

Single-Cell Transcriptome Analyses of Human Pancreas
(A) Table of donor information (HbA1c, glycated hemoglobin).
(B) Projection of all cells (n = 2,209) onto two dimensions using t-SNE based on the expression values (log2RPKM) of the 1,000 genes with highest biological variation across cells.
(C) Expression (log2RPKM) of exocrine marker genes (PRSS1 for acinar and KRT19 for ductal cells) overlaid onto the 2D t-SNE as shown in (B).
(D) Boxplots displaying the expression levels in the seven obtained clusters of marker genes for MHC class II antigen-presenting cells (CD86), mast cells (TPSAB1), pancreatic stellate cells (COL1A2), and endothelial cells (PLVAP). Median and mean are shown as a line and circle, respectively. Edges of each box indicate the 25th and 75th percentiles. Bars extend to extreme data points and outliers are plotted as gray dots.
(E) Two-dimensional t-SNE projection of the endocrine cells (n = 1,554) based on the expression values (log2RPKM) of the 500 genes with highest biological variation across endocrine cells. The obtained clusters were assigned to the endocrine cell types based on the hormone expression levels in (F). Colors correspond to cell types and shadings indicate donors. Healthy and T2D cells are marked with circles and triangles, respectively.
(F) t-SNE representation of cells as in (E) illustrating the expression of the five endocrine hormones: GCG, INS, PPY, SST, and GHRL. Color scale is according to log2RPKM values, with white and red colors corresponding to minimum (zero) and maximum (log2RPKM = 21) expression, respectively.
(G) Bar graphs showing the percentage of cells classified into cell types, per donor.
Since certain endocrine populations (e.g., ε cells) are present within the islets at low frequencies, we sequenced ∼350 cells from each donor. In total we obtained 3,386 cells, and after stringent quality control filtering (see Supplemental Experimental Procedures; Figures S1C–S1H), we retained 2,209 cells. As controls, we also sequenced 16 empty wells for six of the donors (in total 96 wells). The sequencing reads detected in the controls, originating from low levels (<0.5%) of RNA contamination from FACS or library preparation, were below the quality thresholds.
Cell-Type Identification and Expression
We explored the single-cell transcriptome data in an unbiased manner by identifying biological variation in gene expression (Brennecke et al., 2013) (Table S1) and projecting all cells onto two dimensions using t-distributed stochastic neighbor embedding (t-SNE) (Van der Maaten and Hinton, 2008). The major separation of cells reflected gene expression differences between exocrine and endocrine cell types (Figure 1B), with two clusters corresponding to exocrine acinar (n = 185) and ductal (n = 386) cells based on expression of their respective markers, PRSS1 and KRT19 (Figure 1C), whereas the third cluster contained the endocrine cells (n = 1,554). The five smaller observed clusters (Figure 1B) corresponded to pancreatic stellate cells (PSCs; n = 54, high expression of collagen genes, matrix metalloproteinases, TIMP1, FN1, POSTN, and ACTA2) (Liu and Du, 2015), endothelial cells (n = 16, expressing PLVAP, CD31/PECAM1, VWF, and ANGPT2), mast cells (n = 7, expressing tryptase genes TPSB2, TPSD1, and TPSAB1), antigen-presenting MHC class II cells (n = 5, high expression of CD74, CD86, HLA-DPA1, HLA-DPB1, and HLA-DRA) and two cells of unknown origin (“unclassified exocrine,” high expression of, e.g., RCAN1, SPP1, and NOV) (Figure 1D; Table S1). The cell clusters were obtained without using knowledge of cell types or prior purification of cell populations.
To resolve the various endocrine cell types, we performed a similar analysis only on the endocrine cells, which separated them into discrete clusters (Figure 1E) with distinct hormone expression and allowed their classification into α, β, γ, δ, and ε cells (Figure 1F). The endocrine cells clustered together irrespectively of inter-individual differences and T2D status (Figure 1E), demonstrating that cell-type-specific expressions are associated with the dominating transcriptome patterns. A group of cells characterized by a high expression of multiple hormones and an elevated number of expressed genes was detected among β cells (“co-expression,” n = 39; Figures 1E and S2A). Although such cells have been reported (Blodgett et al., 2015), this group likely corresponds to cell doublets and therefore was excluded. Indeed, image analyses identified 0.3% cell doublets during single-cell sorting (Supplemental Experimental Procedures), and hormone co-expression was found in ∼0.9%–1.8% of the remaining endocrine cells after removal of the potential cell doublets (Figures S2C and S2D). A second cluster of cells (unclassified endocrine, n = 41; Figure 1E, white group) characterized by low number of genes expressed (Figure S2B) was also excluded from the analyses.
Variations in Cell-Type Composition
The composition of cells profiled from each donor varied substantially (Figures 1G and S3A; Table S1), both in terms of exocrine and endocrine cells and within the endocrine cell types. To determine if the observed composition of cell types corresponded to cell types present in the non-dissociated tissue and islet preparations, we performed immunohistochemistry staining with GCG and INS on the pancreatic tissues and purified islets (Figure S3B) (eight donors), and FACS analyses on dissociated islets using antibodies targeting GCG, INS, and SST (two donors) (Figure S3C). Analyses of the estimated fractions of α, β, and δ cells in the tissue and islets revealed that α cells were more abundant and β cells less numerous in the single-cell data than in the corresponding tissue and islet preparations (Figure S3D). This could reflect lower survival of β cells during single-cell dissociation and FACS. For γ and δ cells, the numbers were in general agreement except for an increase of γ cells in the single-cell data in one T2D donor (Figure 1G). We concluded that single-cell dissociation and FACS introduce a systematic bias in cell-type proportions. In order to compare single-cell to whole-islet RNA-seq, we correlated the average gene expression in single cells with the expression in whole-islet sequencing from the same donors. This analysis demonstrated that single-cell data give a reliable view of the whole islet (Spearman’s ρ, 0.86–0.92; Figure S4A) and that with only tens of single cells, correlations start to saturate (Figure S4B).
Gene Expression Signatures of Endocrine Cells
The average number of genes expressed per cell type was roughly 5,500 for endocrine and 7,000 for exocrine cells (Figure 2A), with slight variation using higher expression threshold (Figure S1H). Strikingly, hormone expression accounted for a large fraction of the transcriptome in endocrine cells, reflecting their functional dedication to hormone secretion, with INS, PPY, and SST transcripts alone accounting for ∼50% of the total cellular transcripts in the β, γ, and δ cells, respectively (Figure 2B). In α and ε cells, the expression of GCG and GHRL, respectively, accounted for ∼20% of their transcriptomes (Figure 2B; Table S1).
Figure 2.

Characterization of Endocrine Cell Transcriptomes
(A) Boxplots showing the number of genes detected in each cell type (expression threshold, RPKM ≥ 1). Median and mean are shown as a line and circle, respectively. Edges of each box indicate the 25th and 75th percentiles. Bars extend to extreme data points and outliers are plotted as gray dots.
(B) Percentage of all mRNAs in respect to the total transcriptome in each cell type (Table S1), with genes ranked according to the expression magnitude in descending order (x axis).
(C) Table with the number of significantly enriched genes in α, β, γ, δ, acinar, and ductal cells.
(D) Heatmap with expression distributions for the top 25 enriched genes in each of the four endocrine cell types (α, β, γ, and δ cells). The genes were selected based on the magnitude of expression range among the four endocrine cell types. The expression profiles of the ten donors are shown separately and for each endocrine and exocrine cell type, with labels indicating cell type and donor (top). Colors correspond to standardized log2 expression values, where each cell in the heatmap contains the distribution of values across the cells for each cell type and donor.
(E) Boxplots with the expression levels of selected cell-type enriched genes identified in the differential expression analysis: FAP, DPP4, and GPR119 for α cells; LINC01099 for β cells; and LEPR and GHSR for δ cells. Gene expression is shown for α, β, γ, δ, ε, acinar, and ductal cells, with color shadings representing different donors. Median and mean are shown as a line and circle, respectively. Edges of each box indicate the 25th and 75th percentiles. Bars extend to extreme data points and outliers are plotted as gray dots.
(F and G) Single-molecule RNA FISH on pancreatic tissue section. (F, left) A representative islet (donor H5) co-stained with GCG (green), FAP (red), and DAPI (blue). (G, left) Islet (donor H5) co-stained with SST (green), LEPR (red), and DAPI (blue). (F and G, right) Zoom-in on merged or individual channels. Quantification and additional images in Table S3. Scale bar represents 25 μm.
Next, we investigated the specific gene expression in the six major cell types (α, β, γ, δ, acinar, and ductal cells) to shed light on their respective functions, using one-way ANOVA on the five healthy male donors (to exclude confounding effects of sex and disease). This analysis revealed several hundred genes that were expressed at significantly higher levels in α, β, γ, δ, or exocrine cell types (Table S2; Figures 2C, 2D, and 3C). Most of the previous transcriptome studies of the pancreas have investigated whole islets or used FACS to sort for either α or β cells followed by microarray analysis or RNA-seq. For α or β cells, several studies in mouse (Benner et al., 2014, Ku et al., 2012) or human islets (Blodgett et al., 2015, Bramswig et al., 2013, Dorrell et al., 2011, Nica et al., 2013) have found cell-type-specific transcripts with 2-fold or higher expression levels than in other cell types. The genes we identified as being α and β cell enriched overlapped largely with the previous studies. For example, in α cells we detected known markers such as GCG, LOXL4, DPP4, GC, and FAP (Figure 2E) (Dorrell et al., 2011). Importantly, RNA in situ hybridization verified significant co-expression of FAP and GCG in α cells (Figure 2F; Table S3). We also observed cell-type enriched expression of genes that have not previously been linked to specific endocrine cell types. GPR119 has been identified as a potential target for the treatment of diabetes, since agonists have been shown to enhance nutrient-stimulated INS and GLP-1 release and also to increase β cell mass in mice in vivo (Chu et al., 2008, Gao et al., 2011). We could assign the expression of GPR119 primarily to α cells in humans (Figure 2E), in contrast to previous reports (Chu et al., 2008, Odori et al., 2013).
Figure 3.

Cell-Type-Specific Expression
(A) Heatmap showing ε cell enriched gene expression (rows) across the seven cell types for the ten donors (columns). Labels indicating the cell type and donor are shown on the top. Colors in the heatmap correspond to standardized log2 expression values, where each cell in the heatmap contains the distribution of values across the cells for each cell type and donor.
(B) Heatmap with expression levels of transcription factors (rows) across the cells from the six cell types for the ten donors (columns). Blue and red colors correspond to minimum (zero) and maximum (log2RPKM = 12) expression, respectively.
(C) Heatmap with expression of significantly enriched genes (rows) in acinar and ductal cells across the six cell types for the ten donors (columns). The genes were selected based on the magnitude of expression range between the two exocrine cell types. The heatmap was generated as in (A).
(D) Heatmap showing the differentially expressed (DE) genes (columns) between the pancreatic stellate (PSCs) and the endothelial cells (rows). The results were obtained using single-cell differential expression (SCDE), and only the genes with a log2 fold change in expression of at least seven between the two groups are shown. The colors in the heatmap correspond to standardized log2 expression values, where each cell in the heatmap contains the distribution of values across the cells of each cell type.
In β cells, we found elevated expression levels of, e.g., INS, IAPP, ADCYAP1, PDX1, MAFA, NKX6-1, and MEG3 (Figures 2D and 3B). Additionally, β cell-specific protein expression of both PDX1 and NKX6-1 was verified using FACS analysis, where the PDX1+/NKX6-1+ cell population coincided with the expression of β cell marker C-peptide protein (Figure S5A). We also detected long non-coding RNAs, e.g., LINC01099, with expression restricted mainly to β cells (Figure 2E).
Transcriptional Profiling of Rare Endocrine Cell Types
The transcriptomes of γ, δ, and ε cells are largely unknown in human. We noted that many receptors were highest or exclusively expressed in δ cells (e.g., UNC5B, GABRB3, GABRG2, CASR, FFAR4/GPR120, and KCNJ2) (Figure 2D; Table S2). We also identified pronounced expression of the leptin receptor (LEPR) in δ cells (Figure 2E). Previous studies in murine and human cells have reported LEPR protein expression in α, β, and δ cells (Kieffer et al., 1996, Kieffer et al., 1997, Tudurí et al., 2009). RNA in situ hybridization validated significant co-expression of LEPR and SST in δ cells (Figure 2G; Table S3). Expression of the GHRL receptor (GHSR) has been reported on mouse α cells (Date et al., 2002), rat INS-1 β cell line (Wierup et al., 2004), and to be partly localized to β cells in human islets (Granata et al., 2007). Intriguingly, we uncovered that the GHSR was specifically expressed in δ cells (Figure 2E).
We also identified genes specifically expressed in γ cells, e.g., SERTM1, SPOCK1, ABCC9, and SLITRK6 (Figure 2D; Table S2), none of which, to the best of our knowledge, have been assigned to pancreatic or γ cell functions. Among the 2,209 cellular transcriptomes captured, seven were from ε cells. Analysis of these cells allowed us to identify elevated expression of 39 genes, including the expression of GHRL and GHRLOS. The ε cells uniquely expressed several interesting receptors like NPY1R, OPRK1, PTGER4, and ASGR1, and processing enzymes such as PCSK6 (Figure 3A; Table S2).
Transcription Factor Expression in Endocrine Cells
We could confirm the expression of many transcription factors in endocrine cells, e.g., ISL1 and NEUROD1, and restricted expression of MAFA in β cells and IRX2 in α cells (Figure 3B). However, many transcription factors were expressed in a subset of endocrine or exocrine cells, including ARX expression in α and γ cells, in line with the increase in γ and α cell numbers after forced ARX expression in mouse embryonic islets (Collombat et al., 2007). We found HHEX expression in both δ and ductal cells while MAFB expression was restricted to α, β, and δ cells (Figure 3B). We also detected several enrichments of factors in particular cell types. For example, NKX6-3 was enriched in δ cells and SIX2 and SIX3 were restricted to β cells. In γ cells, we observed significantly elevated expression of MEIS2, ETV1, and ID4 (Figure 3B), whereas AFF3 was specifically expressed in ε cells (Figure 3A).
Cell-Type-Specific Expression in Other Pancreatic Cell Types
The transcriptomes of exocrine cell types had higher numbers of significantly enriched genes, 332 and 408 genes, respectively, for acinar and ductal cells (Figures 2C and 3C; Table S2). Additionally, we detected a large number of genes that were expressed at higher levels in both exocrine cell types but were absent in endocrine cells (data not shown). The pancreatic stellate cells and endothelial cells also expressed a large number of specific genes (Figure 3D; Table S2).
Using our cell-type-specific expression data, we assessed to what extent cell-type-specific gene expression can be identified from whole-islet sequencing (Taneera et al., 2012) by simply correlating gene expression with cell-type-defining hormone or marker gene expression. Our results indicate that only few of the cell-type enriched genes would be captured, as our strongest cell-type enriched genes were either seldom significant or had low ranks (Figure S5B).
The Identification of Subpopulations and Cellular States
In order to explore heterogeneity within cell populations, we investigated the clustering of cells within each cell type. After assigning cells to cell types, the second strongest determinant of the cellular transcriptomes was inter-individual differences (Figure S6).
Clustering analysis after the removal of donor effect (see Supplemental Experimental Procedures) uncovered subpopulations of α, β, and acinar cells. For γ, δ, and ductal cells, no robust separation was observed (Figure S6). Twelve α cells belonging to multiple donors (both healthy and T2D) grouped separately from all other α cells (Figures 4A and S6A). GCG expression was similar in both clusters; however, differential expression analysis showed a mild downregulation of several α enriched genes (C10orf10, PEMT, PLCE1, ARRDC4, CRYBA2, LOXL4, RGS4, and SMIM24) and a high expression of proliferation-associated genes (e.g., TOP2A, MKI67, CENPF, BIRC5, and CDK1) in these twelve cells (Figure 4A). Therefore, the rare α cells constituted proliferating α cells that were distinguished by a signature of 439 significantly upregulated genes (Table S4). Importantly, this group was not detectable before adjusting for donor effects (Figure S6A). Searching for proliferative gene expression signatures across the complete single-cell dataset revealed additional acinar (n = 8) and ductal (n = 2) cells with expression of proliferative markers (Figure S7). The gene expression signatures of these rare proliferating cells might provide clues to the mechanisms of self-renewal of pancreatic tissue.
Figure 4.

Uncovering Subtypes of Endocrine and Exocrine Cells
(A) (Left) Two-dimensional t-SNE representation of all α cells (n = 886, 10 donors) using donor-normalized expression values of the 500 most variable genes in α cells. Colored according to cluster assignments. (Right) Heatmap illustrating the top DE genes (columns) between the two α cell clusters (rows). The colors in the heatmap correspond to standardized log2 expression values, where each cell in heatmap contains the distribution of values across the cells in each cluster.
(B) (Left) Two-dimensional t-SNE representation of β cells (n = 270, 10 donors) using donor-normalized expression values of the 50 most variable genes in β cells. (Right) t-SNE representation of cells, colored according to expression (log2RPKM) of DE genes among the five clusters.
(C) (Left) Two-dimensional t-SNE projection of acinar cells (n = 185, 10 donors) using donor-normalized expression values of the 100 most variable genes in acinar cells. (Right) Heatmaps illustrating the top DE genes (columns) per cell cluster (rows). The heatmap was generated as in (A).
Sub-clustering of β cells revealed five clusters of cells with combinatorial expression of RBP4, FFAR4/GPR120, ID1, ID2, and ID3 (Figure 4B; Table S4). Cells of the five clusters expressed INS at similar levels (Figure 4B). Interestingly, clusters 1 and 5 expressed RBP4 (also expressed in δ cells; Figure 2D), an adipokine primarily expressed in the liver and adipocytes (Klöting et al., 2007). Increased circulating levels of RBP4 are prominent in obese and T2D individuals and correlate with INS resistance in the periphery (Yang et al., 2005). The same RBP4-expressing β cells (clusters 1 and 5) also express FFAR4. FFAR4 agonists have been shown to induce INS release in mouse pancreatic islets (Moran et al., 2014). β cell clusters 1, 2, and 3 were characterized by expression of ID1 and ID3, regulators of basic helix-loop-helix (bHLH) transcription factors (Ling et al., 2014). To the best of our knowledge, these subgroups of β cells have never been described before.
Finally, we identified two clusters of acinar cells (Figure 4C). Cells belonging to cluster 1 were characterized by elevated expression of inflammatory related genes (Figure 4C; Table S4), including components of the MHC class II molecule, e.g., CD74, HLA-DMA, HLA-DRA, and HLA-DRB1 (Figure 4C). Cluster 1 also expressed pro-inflammatory chemokines (e.g., CXCL1, CXCL6, CCL2, CCL20, and CX3CL1), cytokines (IL17C and IL18), and transcription factors and immune regulators (STAT1, NFKBIA, NFKBIZ, HIF1A, SOX4, and ONECUT2). Cells of cluster 2 expressed higher levels of key acinar genes encoding secretory digestive enzymes (e.g., CEL, CELA2A, and AMY) and important transcription factors that regulate expression of digestive enzymatic genes including PTF1A and RBPJL (Figure 4C).
Gene Expression Alterations with Increased Obesity
In order to investigate gene expression signatures relating to obesity, we correlated the expression of each gene with donor BMI for the five healthy males, separately per cell type (see Supplemental Experimental Procedures; Table S5). Several of the genes correlating with BMI have earlier been implicated in obesity or diabetes progression. Expression of the PCSK1 inhibitor (PCSK1N) showed a strong positive correlation with BMI in all endocrine cell types (Figures 5A and 5B). PCSK1 converts pro-hormones to active hormones with substrates such as INS, SST, and enkephalins. Altered function of PCSK1 is associated with obesity both in mouse and human (Nead et al., 2015). In addition, transgenic mice overexpressing PCSK1N have an obese phenotype (Wei et al., 2004). Analysis also revealed that SCG5 was negatively correlated with BMI in all cell types (Figure 5B). SCG5 is a molecular chaperone of PCSK2, the enzyme responsible for cleavage of pro-GCG to GCG and also involved in pro-IAPP to IAPP processing (Braks and Martens, 1994, Wang et al., 2001), implicating an α and β cell-related dysfunction in GCG and IAPP processing, respectively, correlating with increasing BMI. Interestingly, PPDPF expression in α, β, δ, and ductal cells was positively correlated with BMI (Figure 5A). PPDPF regulates exocrine pancreas development in zebrafish, where overexpression leads to relative expansion of the exocrine pancreas (Jiang et al., 2008). Finally, we noted that CALM2 was negatively correlated with BMI in endocrine (α, β, γ, and δ) and ductal cells (Figures 5A and 5B), which is of interest given the role of calmodulins in calcium sensing and signaling, e.g., in β cells and INS release (Gilon et al., 2014). Naturally, previous bulk analyses should, in principle, be able to identify genes that are correlating to BMI in all (or the most abundant) cell types, whereas those specific to particular cell types would not be easily revealed without single-cell resolution. This is apparent when comparing correlations obtained with all cells to correlations based on separate cell types (Figure 5C). For example, positive correlations of INS, PPY, and SST in β, γ, and δ cells were stronger in cell-type resolved analyses. Interestingly, several genes with previous links to obesity and diabetes were correlating with BMI in the cell-type resolved analyses, but were not correlating in the bulk analyses (Figure 5C).
Figure 5.

Gene Expression Correlates to Donor Physiological Characteristics
(A) Heatmap of gene expression associated with BMI in α cells (n = 417, healthy male donors). Genes (rows) with a positive or negative correlation of at least 0.7 in magnitude are ranked in descending order of coefficient. Cells (columns) are ordered in descending order of BMI. Blue and red colors correspond to minimum (zero) and maximum (log2RPKM = 14) expression, respectively. The corresponding Spearman’s correlation coefficients computed for the genes in each cell type (based on the cells from healthy male donors) are displayed on the right of the heatmap.
(B) Scatterplots showing the expression levels of four genes with a robust correlation with BMI. The fitted curve in each scatter shows the linear regression between the expression and BMI, where m is the slope and b the y-intercept.
(C) Scatterplots of Spearman’s correlations of genes toward BMI computed based on overall expression in donors (x axis) or for the specific indicated cell type (y axis). Colored are the genes with an absolute correlation coefficient of at least 0.6 within a particular cell type that is also at least 10% higher in respect to the correlation computed using all cells.
Gene Expression Alterations in T2D
Contrasting the transcriptomes from healthy and T2D individuals in each cell type independently identified significant (adjusted p value ≤ 0.01) alterations in gene expression in endocrine and exocrine cell types (Figure 6A; Table S6). INS deficiency in T2D can result from decreased β cell mass and reduced INS production in remaining β cells. Three out of four T2D donors had lower numbers of β cells (Figure S3A), and we detected significantly lower INS mRNA levels in T2D β cells (Figure 6B). The most significant difference in β cells was a downregulation of FXYD2 in T2D individuals (Figure 6B). FXYD2 encodes the gamma subunit of an Na,K-ATPase. Mice lacking FXYD2 are more glucose tolerant, have a substantial pancreatic β cell hyperplasia, and have increased plasma INS levels (Arystarkhova et al., 2013). In line with these experiments, overexpression of FXYD2 in renal cells reduced the rate of cell division (Wetzel et al., 2004). Our data also revealed several important genes that were upregulated in T2D β cells, e.g., GPD2 and LEPROTL1 (Figure 6B). GPD2 is one of two key enzymes of the NADH shuttles into mitochondria and aids the subsequent ATP production and glucose-induced activation of mitochondrial metabolism and INS secretion in β cells (Eto et al., 1999). Moreover, LEPROTL1 is also known as endospanin-2. Overexpression of the LEPROTL1 protein decreases the surface localization of the leptin receptor (Séron et al., 2011) and the growth hormone receptor (GHR) in cells (Touvier et al., 2009), thereby inhibiting the hormonal actions. Endospanin-1, a paralog of LEPROTL1with similar activity (Séron et al., 2011), was recently shown to be upregulated in obese mice, and silencing of the gene restored central leptin responsiveness in these mice, leading to body weight loss (Vauthier et al., 2014).
Figure 6.

Altered Gene Expression in Cells from T2D Individuals
(A) Bar graphs showing the number of DE genes between cells from healthy and T2D donors per cell type.
(B) Heatmaps with the DE genes between healthy and T2D α (left) and β cells (right). Labels indicating the disease status and sex of the cells are shown on the top. Colors in the heatmap correspond to standardized log2 expression values, where each cell in the heatmap contains the distribution of values across the cells of each group.
(C) Heatmap of the enriched gene sets (using GSEA) within the α, β, γ, δ, acinar, and ductal cell types for healthy and T2D groups. The heatmap is colored according to the adjusted p values (−log10), with red and blue colors corresponding to enrichments among genes up- and downregulated in T2D, respectively. Sets with no significant enrichment are indicated with white color.
We also observed transcriptional alterations in α cells of T2D individuals. RGS4 has been shown to be a negative regulator of GSIS in mouse MIN6 insulinoma cells via its inhibitory actions on the M(3) muscarinic receptor (CHRM3) (Ruiz de Azua et al., 2010). The expression of RGS4 and CHRM3 in pancreas has not been established before and we detected them significantly enriched in α and γ cells, respectively (Table S2). We found a significantly decreased expression of WFS1 in T2D α cells (Figure 6B; Table S6), in agreement with a recent study (Taneera et al., 2012).
Finally, we used gene set enrichment analysis (GSEA) to investigate whether transcriptional alterations in T2D were enriched for specific functional categories or previously defined gene signatures. The analysis revealed that genes responsible for energy metabolism in mitochondria and protein synthesis were significantly downregulated in most cell types in T2D individuals (Figure 6C; Table S7). In contrast, among the genes found upregulated in T2D, we observed, for example, enrichment for apoptosis, diabetic nephropathy, and cytokine signaling (Figure 6C).
Functional Validation of GLP1R
GCG-like peptide receptor 1 (GLP1R), expressed in β and δ cells (Figure 7A), is of interest for targeted diabetic treatment due to the ability of GLP1R agonists to induce GSIS in β cells (Nadkarni et al., 2014). Moreover, GLP1 analogs (e.g., exenatide and liraglutide) are commonly used anti-diabetic drugs (Montanya, 2012). To validate the functionality of the isolated human islets, we measured both the INS response to exenatide treatment and the GLP1R protein expression. Immunohistochemistry detected GLP1R solely in the endocrine islets and predominantly in β cell enriched regions (Figure 7B). Additionally, GLP1R+ cellular fractions (FACS) were significantly enriched for β and δ cells (Figure 7C). Finally, we observed a significant increase in INS release from islets treated with 10 nM exenatide in high glucose conditions, regardless of whether the islets originated from healthy or T2D donors (Figure 7D). We conclude that the islets are functional in terms of GLP1/GLP1R signaling and that GLP1R protein expression was in agreement with the single-cell RNA-seq data.
Figure 7.

Functional Analysis of GLP1R
(A) Boxplot showing expression of GLP1R in α, β, γ, δ, ε, acinar, and ductal cells, with color shadings representing different donors. Median and mean are shown as a line and circle, respectively. Edges of each box indicate the 25th and 75th percentiles. Bars extend to extreme data points and outliers are plotted as gray dots.
(B) Immunohistochemistry of pancreatic tissue for INS (brown) and GCG (red) (top left and zoom-in on top right), or GLP1R (brown) (lower left and zoom-in on lower right).
(C) (Left) FACS analysis of islet cells stained with fluorescently conjugated GLP1R antagonist. Gate shows fraction of the total islet cells positive for GLP1R. (Right) Pie charts with the percentage of α, β, δ, and other cells in FACS analyses of total islet cells (upper) or the GLP1R+ cellular fraction (lower), labeled with INS, GCG, and SST antibodies.
(D) Dot plots showing GSIS of human islets from one healthy (left) and one T2D (right) donor treated with 16.7 mM glucose ± 10 nM Exenatide (Ex4).
Discussion
With the development of single-cell RNA-seq, high-throughput profiling of transcriptomes across cell types, states, and subpopulations has become feasible (Sandberg, 2014). Here, we generated a unique resource of 2,209 full-length, single-cell transcriptomes from cultured pancreatic islets of ten donors. Our data are available through a user-friendly and searchable web portal (http://sandberg.cmb.ki.se/pancreas). Unbiased analyses of the data allowed the identification of cell types, demonstrating that cell-type-specific gene expression programs were the strongest determinant of the cellular transcriptomes. Importantly, due to the large number of profiled cells, we could simultaneously define the transcriptional signatures of both abundant and rare cell types in the pancreas, including δ, γ, ε, stellate, immune, and endothelial cells.
Despite the few numbers of scattered δ and ε cells within the islets of Langerhans, their transcriptomes hinted that they may have important, previously unrecognized roles in islet homeostasis. With multiple receptors, δ cells could sense and react to a variety of hormonal signals. First, they express the GHRL receptor, which enables them to receive input locally from GHRL-producing ε cells and/or systemically from GHRL release from the intestine during digestion.
In our transcriptional profile of δ cells, we also uncovered that they uniquely express the leptin receptor. Because leptin is released predominantly from adipocytes (Fasshauer and Blüher, 2015), the initial pancreatic response to leptin levels could be mediated through δ cells. In this respect, it is also tempting to speculate whether the scattered positions of δ cells within human islets of Langerhans enable them to integrate both paracrine and endocrine factors before using SST and other factors (van der Meulen et al., 2015) to signal to their immediate environment.
After assigning cells to cell types, it was apparent that cells within cell types grouped according to donor (Figure S6). Only after correcting for donor differences were we able to identify subpopulations and cellular states. The large number of profiled cells allowed us to investigate the heterogeneity within each cell type. Interestingly, we unraveled distinct sub-clusters of endocrine and exocrine cells, including proliferating α cells and subsets of β cells with combinatorial expression of transcriptional regulators. Moreover, we identified a group of acinar cells expressing MHC class II genes (CD74, HLA-DMA, HLA-DRA, HLA-DRB1, and HLA-DRB5). MHC class II molecules are predominantly expressed by professional antigen-presenting cells. In addition, peripheral cells in close contact with environmental cues for immunological reactions (e.g., intestinal epithelial cells, airway epithelial cells, and keratinocytes) have been shown to express MHC class II molecules (Kambayashi and Laufer, 2014). It is possible that the antigen-presenting acinar cells are localized to pancreatic areas in closer contact with environmental cues.
For metabolic diseases, it is expected that single-cell transcriptome analyses can be paradigm changing. The single-cell resolution allows for the parallel identification of disease-associated transcriptional alterations in each cell type independently (Sandberg, 2014). Moreover, although islets or tissues in health and disease vary in cellular composition, single-cell transcriptomics circumvents these challenges by first assigning cells to cell types, which then allows comparisons in a cell-type resolved manner. Our analyses revealed potential compensatory actions for the lower β cell mass in T2D, including the downregulation of FXYD2 and upregulation of GPD2. It is intriguing that mice lacking FXYD2 had a pronounced pancreas phenotype with increased proliferation of β cells (Arystarkhova et al., 2013). The downregulation of FXYD2 could indicate an effort to stimulate β cell proliferation also in humans, but whether the function of FXYD2 is shared in mice and men needs to be established. Moreover, elevated levels of GPD2 in T2D β cells could increase INS secretion via increase of NADH shuttles into mitochondria. Finally, aberrations in mitochondrial respiratory functions were also prominent in the functional gene enrichment results for several cell types in the pancreas from the T2D donors.
In this study, we generated a resource of single-cell transcriptomes from healthy and T2D donors that should be of great value to the research community. Our computational analyses demonstrated the power of cell-type resolved analyses and revealed cell-type-specific gene expression programs, subpopulations, and transcriptional alterations in T2D. Similar single-cell analyses of other metabolic tissues and pathologies will significantly advance our understanding of heterogeneity within metabolic tissues in health and disease.
Experimental Procedures
Single-Cell RNA-Seq of Pancreatic Islets
Human tissue and primary islets were purchased from Prodo Laboratories Inc., providing islets isolated from donor pancreases obtained from deceased individuals with research consent from Organ Procurement Organizations (OPOs). The use and storage of human islets and tissue samples were performed in compliance with the Declaration of Helsinki, ICH/Good Clinical Practice and was approved by the independent Regional Ethics Committee. Human islet samples (85%–95% pure) were cultured for 4 days in complete Prodo Islet Media Standard PIM(S) to recover after arrival. Islets were dissociated and distributed by FACS into 384-well plates. Single-cell RNA-seq libraries were produced with the Smart-seq2 protocol as previously described (Picelli et al., 2014). Sequencing was carried out on an Illumina HiSeq 2000 generating 43 bp single-end reads.
RNA-Seq of Whole Islets
RNA was isolated from whole islets from seven donors (healthy donors H3, H4, and H6 and all T2D donors) using QIAGEN RNeasy Microkit with on-column DNase digestion (QIAGEN) and processed with Illumina TruSeq Stranded mRNA Library Prep Kit. Indexed libraries were pooled and sequenced (paired-end 75 bp) on an Illumina NextSeq 500.
Single-Molecule mRNA Fluorescence In Situ Hybridization
mRNAs were visualized by single-molecule fluorescence in situ hybridization (smFISH) using the RNAscope Fluorescent Multiplex Kit (Advanced Cell Diagnostics, Inc.) on formalin-fixed, paraffin-embedded (FFPE) sections of pancreas from four healthy donors. The following RNAscope probes were used: Hs-GCG (ACD556741), hs-SST (ACD310591), hs-FAP (ACD411971), and hs-LEPR (ACD406371). Images were acquired on a Nikon A1R confocal microscope. See Table S3 for detailed information about how each cell was counted together with the statistics per slide and donor.
Processing of RNA-Seq Data
Sequence reads were aligned toward the human genome (hg19 assembly) using STAR (v2.3.0e), and uniquely aligned reads within RefSeq gene annotations were used to quantify gene expression as RPKMs using rpkmforgenes (Ramsköld et al., 2009).
Cell-Type Classification
Cell-type classification was defined in a two-dimensional t-SNE space that was constructed using a set of genes with highest biological variation. The assignment of the formed clusters to cell types was performed based on the expression levels of hormones or other known marker genes. The cell-type classification of all cells analyzed is included in Table S1.
Differential Expression Analysis
Differential expression analysis between cell types (α, β, γ, δ, acinar, and ductal cells) was performed using one-way ANOVA with log2-transformed expression data from the five healthy male donors.
Analysis of Heterogeneity in the Cell Types
To investigate heterogeneity within cell types, single-cell expression data of each cell type independently was ranked based on biological variability, and using this as input, the cells were projected onto two dimensions with the t-SNE. In all cases, the obtained embedding was dominated by donor differences (Figure S6). We applied a parametric empirical Bayesian framework to remove donor differences and repeated the t-SNE dimensionality reduction using the adjusted expression values.
Analyses of Gene Expression against BMI
Spearman’s ρ coefficients were calculated separately for each gene and cell type based on the log2-transformed expression values. The results were adjusted using Benjamini-Hochberg to control the false discovery rate (α = 0.01). The five healthy male donors were used, since there is a positive correlation between BMI and sex in our donors (ρ = 0.49). The lists containing genes with an absolute correlation coefficient with BMI greater than 0.5 are included in Table S5. We also generated gene correlations using all cells (not separated per cell type) from the same five male donors to simulate the correlations one would obtain in “whole-islet” analyses.
Differential Expression Analysis between Cells from Healthy and T2D Donors
We identified statistically significant gene expression differences between healthy and T2D individuals for the major cell types: α, β, γ, δ, acinar, and ductal cells. Non-parametric one-way ANOVA (Kruskal-Wallis test) was used after dividing samples into four groups based on disease status (healthy or T2D) and sex. Bonferroni adjustment was used for the multiple comparison correction and the Benjamini-Hochberg method to control the false discovery rate at significance level α = 0.01. The genes that showed significant differences in respect to sex were excluded from the results in both tests in order to identify the differentially expressed (DE) genes related to T2D.
GSEA in Cell Types
GSEA was used to examine whether the genes identified as DE between the healthy and T2D cells for each cell type are members of categories with specific functions. We used the pre-ranked version, providing the difference in median expression values between the healthy and T2D cells as the gene ranking metric. The significant categories (FDR ≤ 1%) that are enriched in each cell type for the two conditions are reported in Table S7.
Author Contributions
P.E., A.-C.A., E.-M.A., M.C., and A.S. handled islets and cell sorting, and performed functional in vitro and ex vivo assessments. M.K.B., D.M.S., C.Ä. and R.S. initiated and supervised the work. Å.S. and S.P. prepared sequencing libraries. X.S. and Å.S. performed RNA FISH. M.K., X.S., Å.S., and A.S. analyzed the imaging data. A.P. performed computational experiments. Å.S., A.P., and R.S. wrote the manuscript.
Acknowledgments
We thank Olov Andersson for helpful comments on our study, the Eukaryotic Single-Cell Genomics facility at SciLifeLab Stockholm for generating single-cell sequencing libraries, and the Live Cell Imaging facility/Nikon Center of Excellence at Karolinska Institutet, Huddinge. The c-peptide hybridoma monoclonal antibody, developed by Madsen, O.D., was obtained from the Developmental Studies Hybridoma Bank, University of Iowa. This work was supported by grants from the Swedish Research Council (R.S.), European Research Council (648842; R.S.) and the Swedish Foundation for Strategic Research (M.K. and R.S.), Swedish Cancer Society (M.K.), and Center for Innovative Medicine (M.K.). P.E., E.-M.A., A.-C.A., A.S., M.C., M.K.B., and C.Ä. are employees and shareholders of AstraZeneca AB. D.M.S. is an employee and shareholder of AstraZeneca Plc.
Published: September 22, 2016
Footnotes
Supplemental Information includes Supplemental Experimental Procedures, seven figures, and seven tables and can be found with this article online at http://dx.doi.org/10.1016/j.cmet.2016.08.020.
Accession Numbers
Raw data (Fastq files) for single-cell and whole-islet RNA-seq have been submitted to ArrayExpress (EBI) with accession numbers ArrayExpress: E-MTAB-5061 and E-MTAB-5060, respectively.
Supplemental Information
Related to Figure 1. This table provides details of the identification of genes with most biological variation, genes with highest expression in cell types, donors, and whole-islet RNA-seq of donors. Additionally, it contains the cell-type composition per donor and general statistics of each processed cell.
Related to Figure 2. This supplemental table lists the genes identified as significantly cell-type enriched in each of the cell types (as separate sheets in the Excel file).
Related to Figure 2. Detailed information of the quantification of expression based on the RNA in situ hybridization experiments on FAP/GCG in α cells and LEPR/SST in δ cells. It summarizes the quantifications of multiple human islets in sections obtained from several donors. The images and details of the counting of each cell in each image are provided in the additional sheets in the Excel file (names by donor and RNA in situ targets).
Related to Figure 4. Lists of the genes that were identified as significantly DE between subpopulations within cell types. Results for each cell type are provided in separate sheets in the Excel file (α, β, and acinar cells—the cell types for which we could identify robust subpopulations).
Related to Figure 5. Details on the correlations of gene expression with BMI either for cells of each cell type or using all cells per donor.
Related to Figure 6. Lists of the genes identified as DE between healthy individuals and T2D.
Related to Figure 6. Detailed results from the GSEA performed on each cell type are listed in separate sheets in the Excel file.
References
- Arystarkhova E., Liu Y.B., Salazar C., Stanojevic V., Clifford R.J., Kaplan J.H., Kidder G.M., Sweadner K.J. Hyperplasia of pancreatic beta cells and improved glucose tolerance in mice deficient in the FXYD2 subunit of Na,K-ATPase. J. Biol. Chem. 2013;288:7077–7085. doi: 10.1074/jbc.M112.401190. [DOI] [PMC free article] [PubMed] [Google Scholar]
- Benner C., van der Meulen T., Cacéres E., Tigyi K., Donaldson C.J., Huising M.O. The transcriptional landscape of mouse beta cells compared to human beta cells reveals notable species differences in long non-coding RNA and protein-coding gene expression. BMC Genomics. 2014;15:620. doi: 10.1186/1471-2164-15-620. [DOI] [PMC free article] [PubMed] [Google Scholar]
- Blodgett D.M., Nowosielska A., Afik S., Pechhold S., Cura A.J., Kennedy N.J., Kim S., Kucukural A., Davis R.J., Kent S.C. Novel observations from next-generation RNA sequencing of highly purified human adult and fetal islet cell subsets. Diabetes. 2015;64:3172–3181. doi: 10.2337/db15-0039. [DOI] [PMC free article] [PubMed] [Google Scholar]
- Braks J.A., Martens G.J. 7B2 is a neuroendocrine chaperone that transiently interacts with prohormone convertase PC2 in the secretory pathway. Cell. 1994;78:263–273. doi: 10.1016/0092-8674(94)90296-8. [DOI] [PubMed] [Google Scholar]
- Bramswig N.C., Everett L.J., Schug J., Dorrell C., Liu C., Luo Y., Streeter P.R., Naji A., Grompe M., Kaestner K.H. Epigenomic plasticity enables human pancreatic α to β cell reprogramming. J. Clin. Invest. 2013;123:1275–1284. doi: 10.1172/JCI66514. [DOI] [PMC free article] [PubMed] [Google Scholar]
- Brennecke P., Anders S., Kim J.K., Kołodziejczyk A.A., Zhang X., Proserpio V., Baying B., Benes V., Teichmann S.A., Marioni J.C., Heisler M.G. Accounting for technical noise in single-cell RNA-seq experiments. Nat. Methods. 2013;10:1093–1095. doi: 10.1038/nmeth.2645. [DOI] [PubMed] [Google Scholar]
- Cabrera O., Berman D.M., Kenyon N.S., Ricordi C., Berggren P.-O., Caicedo A. The unique cytoarchitecture of human pancreatic islets has implications for islet cell function. Proc. Natl. Acad. Sci. USA. 2006;103:2334–2339. doi: 10.1073/pnas.0510790103. [DOI] [PMC free article] [PubMed] [Google Scholar]
- Chu Z.-L., Carroll C., Alfonso J., Gutierrez V., He H., Lucman A., Pedraza M., Mondala H., Gao H., Bagnol D. A role for intestinal endocrine cell-expressed g protein-coupled receptor 119 in glycemic control by enhancing glucagon-like peptide-1 and glucose-dependent insulinotropic peptide release. Endocrinology. 2008;149:2038–2047. doi: 10.1210/en.2007-0966. [DOI] [PubMed] [Google Scholar]
- Collombat P., Hecksher-Sørensen J., Krull J., Berger J., Riedel D., Herrera P.L., Serup P., Mansouri A. Embryonic endocrine pancreas and mature beta cells acquire alpha and PP cell phenotypes upon Arx misexpression. J. Clin. Invest. 2007;117:961–970. doi: 10.1172/JCI29115. [DOI] [PMC free article] [PubMed] [Google Scholar]
- Date Y., Nakazato M., Hashiguchi S., Dezaki K., Mondal M.S., Hosoda H., Kojima M., Kangawa K., Arima T., Matsuo H. Ghrelin is present in pancreatic alpha-cells of humans and rats and stimulates insulin secretion. Diabetes. 2002;51:124–129. doi: 10.2337/diabetes.51.1.124. [DOI] [PubMed] [Google Scholar]
- Dorrell C., Schug J., Lin C.F., Canaday P.S., Fox A.J., Smirnova O., Bonnah R., Streeter P.R., Stoeckert C.J., Jr., Kaestner K.H., Grompe M. Transcriptomes of the major human pancreatic cell types. Diabetologia. 2011;54:2832–2844. doi: 10.1007/s00125-011-2283-5. [DOI] [PMC free article] [PubMed] [Google Scholar]
- Eto K., Tsubamoto Y., Terauchi Y., Sugiyama T., Kishimoto T., Takahashi N., Yamauchi N., Kubota N., Murayama S., Aizawa T. Role of NADH shuttle system in glucose-induced activation of mitochondrial metabolism and insulin secretion. Science. 1999;283:981–985. doi: 10.1126/science.283.5404.981. [DOI] [PubMed] [Google Scholar]
- Fasshauer M., Blüher M. Adipokines in health and disease. Trends Pharmacol. Sci. 2015;36:461–470. doi: 10.1016/j.tips.2015.04.014. [DOI] [PubMed] [Google Scholar]
- Gao J., Tian L., Weng G., O’Brien T.D., Luo J., Guo Z. Stimulating β-cell replication and improving islet graft function by AR231453, A GPR119 agonist. Transplant. Proc. 2011;43:3217–3220. doi: 10.1016/j.transproceed.2011.10.021. [DOI] [PubMed] [Google Scholar]
- Gilon P., Chae H.-Y., Rutter G.A., Ravier M.A. Calcium signaling in pancreatic β-cells in health and in Type 2 diabetes. Cell Calcium. 2014;56:340–361. doi: 10.1016/j.ceca.2014.09.001. [DOI] [PubMed] [Google Scholar]
- Granata R., Settanni F., Biancone L., Trovato L., Nano R., Bertuzzi F., Destefanis S., Annunziata M., Martinetti M., Catapano F. Acylated and unacylated ghrelin promote proliferation and inhibit apoptosis of pancreatic β-cells and human islets: involvement of 3′,5′-cyclic adenosine monophosphate/protein kinase A, extracellular signal-regulated kinase 1/2, and phosphatidyl inositol 3-Kinase/Akt signaling. Endocrinology. 2007;148:512–529. doi: 10.1210/en.2006-0266. [DOI] [PubMed] [Google Scholar]
- Jiang Z., Song J., Qi F., Xiao A., An X., Liu N.-A., Zhu Z., Zhang B., Lin S. Exdpf is a key regulator of exocrine pancreas development controlled by retinoic acid and ptf1a in zebrafish. PLoS Biol. 2008;6:e293. doi: 10.1371/journal.pbio.0060293. [DOI] [PMC free article] [PubMed] [Google Scholar]
- Kahn S.E., Hull R.L., Utzschneider K.M. Mechanisms linking obesity to insulin resistance and type 2 diabetes. Nature. 2006;444:840–846. doi: 10.1038/nature05482. [DOI] [PubMed] [Google Scholar]
- Kambayashi T., Laufer T.M. Atypical MHC class II-expressing antigen-presenting cells: can anything replace a dendritic cell? Nat. Rev. Immunol. 2014;14:719–730. doi: 10.1038/nri3754. [DOI] [PubMed] [Google Scholar]
- Kieffer T.J., Heller R.S., Habener J.F. Leptin receptors expressed on pancreatic beta-cells. Biochem. Biophys. Res. Commun. 1996;224:522–527. doi: 10.1006/bbrc.1996.1059. [DOI] [PubMed] [Google Scholar]
- Kieffer T.J., Heller R.S., Leech C.A., Holz G.G., Habener J.F. Leptin suppression of insulin secretion by the activation of ATP-sensitive K+ channels in pancreatic β-cells. Diabetes. 1997;46:1087–1093. doi: 10.2337/diab.46.6.1087. [DOI] [PMC free article] [PubMed] [Google Scholar]
- Klöting N., Graham T.E., Berndt J., Kralisch S., Kovacs P., Wason C.J., Fasshauer M., Schön M.R., Stumvoll M., Blüher M., Kahn B.B. Serum retinol-binding protein is more highly expressed in visceral than in subcutaneous adipose tissue and is a marker of intra-abdominal fat mass. Cell Metab. 2007;6:79–87. doi: 10.1016/j.cmet.2007.06.002. [DOI] [PubMed] [Google Scholar]
- Ku G.M., Kim H., Vaughn I.W., Hangauer M.J., Myung Oh C., German M.S., McManus M.T. Research resource: RNA-seq reveals unique features of the pancreatic β-cell transcriptome. Mol. Endocrinol. 2012;26:1783–1792. doi: 10.1210/me.2012-1176. [DOI] [PMC free article] [PubMed] [Google Scholar]
- Li J., Klughammer J., Farlik M., Penz T., Spittler A., Barbieux C., Berishvili E., Bock C., Kubicek S. Single-cell transcriptomes reveal characteristic features of human pancreatic islet cell types. EMBO Rep. 2016;17:178–187. doi: 10.15252/embr.201540946. [DOI] [PMC free article] [PubMed] [Google Scholar]
- Ling F., Kang B., Sun X.-H. Id proteins: small molecules, mighty regulators. Curr. Top. Dev. Biol. 2014;110:189–216. doi: 10.1016/B978-0-12-405943-6.00005-1. [DOI] [PubMed] [Google Scholar]
- Liu Y., Du L. Role of pancreatic stellate cells and periostin in pancreatic cancer progression. Tumour Biol. 2015;36:3171–3177. doi: 10.1007/s13277-015-3386-2. [DOI] [PubMed] [Google Scholar]
- Montanya E. A comparison of currently available GLP-1 receptor agonists for the treatment of type 2 diabetes. Expert Opin. Pharmacother. 2012;13:1451–1467. doi: 10.1517/14656566.2012.692777. [DOI] [PubMed] [Google Scholar]
- Moran B.M., Abdel-Wahab Y.H.A., Flatt P.R., McKillop A.M. Evaluation of the insulin-releasing and glucose-lowering effects of GPR120 activation in pancreatic β-cells. Diabetes Obes. Metab. 2014;16:1128–1139. doi: 10.1111/dom.12330. [DOI] [PubMed] [Google Scholar]
- Nadkarni P., Chepurny O.G., Holz G.G. Regulation of glucose homeostasis by GLP-1. Prog. Mol. Biol. Transl. Sci. 2014;121:23–65. doi: 10.1016/B978-0-12-800101-1.00002-8. [DOI] [PMC free article] [PubMed] [Google Scholar]
- Nead K.T., Li A., Wehner M.R., Neupane B., Gustafsson S., Butterworth A., Engert J.C., Davis A.D., Hegele R.A., Miller R., BioBank Japan, AGEN-BMI, GIANT Consortium Contribution of common non-synonymous variants in PCSK1 to body mass index variation and risk of obesity: a systematic review and meta-analysis with evidence from up to 331,175 individuals. Hum. Mol. Genet. 2015;24:3582–3594. doi: 10.1093/hmg/ddv097. [DOI] [PMC free article] [PubMed] [Google Scholar]
- Nica A.C., Ongen H., Irminger J.-C., Bosco D., Berney T., Antonarakis S.E., Halban P.A., Dermitzakis E.T. Cell-type, allelic, and genetic signatures in the human pancreatic beta cell transcriptome. Genome Res. 2013;23:1554–1562. doi: 10.1101/gr.150706.112. [DOI] [PMC free article] [PubMed] [Google Scholar]
- Odori S., Hosoda K., Tomita T., Fujikura J., Kusakabe T., Kawaguchi Y., Doi R., Takaori K., Ebihara K., Sakai Y. GPR119 expression in normal human tissues and islet cell tumors: evidence for its islet-gastrointestinal distribution, expression in pancreatic beta and alpha cells, and involvement in islet function. Metabolism. 2013;62:70–78. doi: 10.1016/j.metabol.2012.06.010. [DOI] [PubMed] [Google Scholar]
- Picelli S., Björklund Å.K., Faridani O.R., Sagasser S., Winberg G., Sandberg R. Smart-seq2 for sensitive full-length transcriptome profiling in single cells. Nat. Methods. 2013;10:1096–1098. doi: 10.1038/nmeth.2639. [DOI] [PubMed] [Google Scholar]
- Picelli S., Faridani O.R., Björklund Å.K., Winberg G., Sagasser S., Sandberg R. Full-length RNA-seq from single cells using Smart-seq2. Nat. Protoc. 2014;9:171–181. doi: 10.1038/nprot.2014.006. [DOI] [PubMed] [Google Scholar]
- Pollen A.A., Nowakowski T.J., Shuga J., Wang X., Leyrat A.A., Lui J.H., Li N., Szpankowski L., Fowler B., Chen P. Low-coverage single-cell mRNA sequencing reveals cellular heterogeneity and activated signaling pathways in developing cerebral cortex. Nat. Biotechnol. 2014;32:1053–1058. doi: 10.1038/nbt.2967. [DOI] [PMC free article] [PubMed] [Google Scholar]
- Ramsköld D., Wang E.T., Burge C.B., Sandberg R. An abundance of ubiquitously expressed genes revealed by tissue transcriptome sequence data. PLoS Comput. Biol. 2009;5:e1000598. doi: 10.1371/journal.pcbi.1000598. [DOI] [PMC free article] [PubMed] [Google Scholar]
- Ramsköld D., Luo S., Wang Y.-C., Li R., Deng Q., Faridani O.R., Daniels G.A., Khrebtukova I., Loring J.F., Laurent L.C. Full-length mRNA-seq from single-cell levels of RNA and individual circulating tumor cells. Nat. Biotechnol. 2012;30:777–782. doi: 10.1038/nbt.2282. [DOI] [PMC free article] [PubMed] [Google Scholar]
- Ruiz de Azua I., Scarselli M., Rosemond E., Gautam D., Jou W., Gavrilova O., Ebert P.J., Levitt P., Wess J. RGS4 is a negative regulator of insulin release from pancreatic beta-cells in vitro and in vivo. Proc. Natl. Acad. Sci. USA. 2010;107:7999–8004. doi: 10.1073/pnas.1003655107. [DOI] [PMC free article] [PubMed] [Google Scholar]
- Sandberg R. Entering the era of single-cell transcriptomics in biology and medicine. Nat. Methods. 2014;11:22–24. doi: 10.1038/nmeth.2764. [DOI] [PubMed] [Google Scholar]
- Séron K., Couturier C., Belouzard S., Bacart J., Monté D., Corset L., Bocquet O., Dam J., Vauthier V., Lecœur C. Endospanins regulate a postinternalization step of the leptin receptor endocytic pathway. J. Biol. Chem. 2011;286:17968–17981. doi: 10.1074/jbc.M111.224857. [DOI] [PMC free article] [PubMed] [Google Scholar]
- Stegle O., Teichmann S.A., Marioni J.C. Computational and analytical challenges in single-cell transcriptomics. Nat. Rev. Genet. 2015;16:133–145. doi: 10.1038/nrg3833. [DOI] [PubMed] [Google Scholar]
- Taneera J., Lang S., Sharma A., Fadista J., Zhou Y., Ahlqvist E., Jonsson A., Lyssenko V., Vikman P., Hansson O. A systems genetics approach identifies genes and pathways for type 2 diabetes in human islets. Cell Metab. 2012;16:122–134. doi: 10.1016/j.cmet.2012.06.006. [DOI] [PubMed] [Google Scholar]
- Touvier T., Conte-Auriol F., Briand O., Cudejko C., Paumelle R., Caron S., Baugé E., Rouillé Y., Salles J.-P., Staels B., Bailleul B. LEPROT and LEPROTL1 cooperatively decrease hepatic growth hormone action in mice. J. Clin. Invest. 2009;119:3830–3838. doi: 10.1172/JCI34997. [DOI] [PMC free article] [PubMed] [Google Scholar]
- Tudurí E., Marroquí L., Soriano S., Ropero A.B., Batista T.M., Piquer S., López-Boado M.A., Carneiro E.M., Gomis R., Nadal A., Quesada I. Inhibitory effects of leptin on pancreatic alpha-cell function. Diabetes. 2009;58:1616–1624. doi: 10.2337/db08-1787. [DOI] [PMC free article] [PubMed] [Google Scholar]
- Van der Maaten L., Hinton G. Visualizing data using t-SNE. Journal of Machine Learning. 2008;9:2579–2605. [Google Scholar]
- van der Meulen T., Donaldson C.J., Cáceres E., Hunter A.E., Cowing-Zitron C., Pound L.D., Adams M.W., Zembrzycki A., Grove K.L., Huising M.O. Urocortin3 mediates somatostatin-dependent negative feedback control of insulin secretion. Nat. Med. 2015;21:769–776. doi: 10.1038/nm.3872. [DOI] [PMC free article] [PubMed] [Google Scholar]
- Vauthier V., Swartz T.D., Chen P., Roujeau C., Pagnon M., Mallet J., Sarkis C., Jockers R., Dam J. Endospanin 1 silencing in the hypothalamic arcuate nucleus contributes to sustained weight loss of high fat diet obese mice. Gene Ther. 2014;21:638–644. doi: 10.1038/gt.2014.36. [DOI] [PubMed] [Google Scholar]
- Wang J., Xu J., Finnerty J., Furuta M., Steiner D.F., Verchere C.B. The prohormone convertase enzyme 2 (PC2) is essential for processing pro-islet amyloid polypeptide at the NH2-terminal cleavage site. Diabetes. 2001;50:534–539. doi: 10.2337/diabetes.50.3.534. [DOI] [PubMed] [Google Scholar]
- Wang Y.J., Schug J., Won K.-J., Liu C., Naji A., Avrahami D., Golson M.L., Kaestner K.H. Single cell transcriptomics of the human endocrine pancreas. Diabetes. 2016 doi: 10.2337/db16-0405. Published online June 30, 2016. [DOI] [PMC free article] [PubMed] [Google Scholar]
- Wei S., Feng Y., Che F.-Y., Pan H., Mzhavia N., Devi L.A., McKinzie A.A., Levin N., Richards W.G., Fricker L.D. Obesity and diabetes in transgenic mice expressing proSAAS. J. Endocrinol. 2004;180:357–368. doi: 10.1677/joe.0.1800357. [DOI] [PubMed] [Google Scholar]
- Wetzel R.K., Pascoa J.L., Arystarkhova E. Stress-induced expression of the gamma subunit (FXYD2) modulates Na,K-ATPase activity and cell growth. J. Biol. Chem. 2004;279:41750–41757. doi: 10.1074/jbc.M405622200. [DOI] [PubMed] [Google Scholar]
- Wierup N., Yang S., McEvilly R.J., Mulder H., Sundler F. Ghrelin is expressed in a novel endocrine cell type in developing rat islets and inhibits insulin secretion from INS-1 (832/13) cells. J. Histochem. Cytochem. 2004;52:301–310. doi: 10.1177/002215540405200301. [DOI] [PubMed] [Google Scholar]
- Yang Q., Graham T.E., Mody N., Preitner F., Peroni O.D., Zabolotny J.M., Kotani K., Quadro L., Kahn B.B. Serum retinol binding protein 4 contributes to insulin resistance in obesity and type 2 diabetes. Nature. 2005;436:356–362. doi: 10.1038/nature03711. [DOI] [PubMed] [Google Scholar]
Associated Data
This section collects any data citations, data availability statements, or supplementary materials included in this article.
Supplementary Materials
Related to Figure 1. This table provides details of the identification of genes with most biological variation, genes with highest expression in cell types, donors, and whole-islet RNA-seq of donors. Additionally, it contains the cell-type composition per donor and general statistics of each processed cell.
Related to Figure 2. This supplemental table lists the genes identified as significantly cell-type enriched in each of the cell types (as separate sheets in the Excel file).
Related to Figure 2. Detailed information of the quantification of expression based on the RNA in situ hybridization experiments on FAP/GCG in α cells and LEPR/SST in δ cells. It summarizes the quantifications of multiple human islets in sections obtained from several donors. The images and details of the counting of each cell in each image are provided in the additional sheets in the Excel file (names by donor and RNA in situ targets).
Related to Figure 4. Lists of the genes that were identified as significantly DE between subpopulations within cell types. Results for each cell type are provided in separate sheets in the Excel file (α, β, and acinar cells—the cell types for which we could identify robust subpopulations).
Related to Figure 5. Details on the correlations of gene expression with BMI either for cells of each cell type or using all cells per donor.
Related to Figure 6. Lists of the genes identified as DE between healthy individuals and T2D.
Related to Figure 6. Detailed results from the GSEA performed on each cell type are listed in separate sheets in the Excel file.