We report the clinical and molecular characteristics of a 69-year-old woman with metastatic colorectal cancer, treated with the epidermal growth factor receptor (EGFR)-targeted monoclonal antibody panitumumab, displaying peculiar molecular tumour heterogeneity at progression consisting of KRAS and MET amplification as distinct drivers associated with acquired resistance.
The patient had rectosigmoid junction adenocarcinoma, G3, KRAS (exon 2) wild type, pT3N2(5/14)M0 treated with surgery in March 2007 and then adjuvant capecitabine (Xeloda) and oxaliplatin (XELOX) chemotherapy. In April 2009 the patient had pelvic relapse and underwent presacral, paraortic and inferior mesenteric lymphadenectomy confirming metastatic colon adenocarcinoma, KRAS (exon 2), BRAF and PIK3CA wild type, human epidermal growth factor receptor 2 (HER2) 2+ without amplification by in situ hybridisation1 and no amplification of KRAS or MET. The patient received subsequent chemotherapy for stage IV disease with XELOX with progression and subsequently FOLFIRI. At disease progression, based on the RAS wild type status, on August 2010 the patient started treatment with panitumumab, achieving partial response which was maintained for 1 year. At that time disease progression occurred in the retroperitoneum, abdominal lymph nodes, liver and lung. Since the lymph nodes involvement caused ureteral dilation and liver involvement was limited to a single lesion in segment VII, in September 2011 the patient underwent surgery for excision of retroperitoneum and parailiac lymph nodes and atypical liver resection of segment VII. The histological diagnosis was consistent with metastases of colon adenocarcinoma in all three tumour metastatic sites.
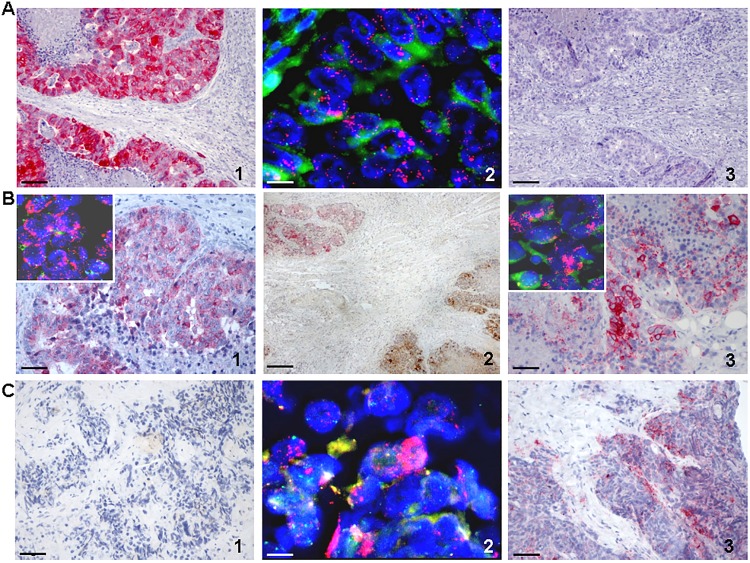
Molecular assessment was performed on the second metastasectomy and compared to data of the previous one. Interestingly, a peculiar intratumour heterogeneity was demonstrated, as the liver metastasis was found to be MET amplified while KRAS was negative (figure 1A and see online supplementary figure S1); conversely, in the retroperitoneum KRAS was amplified while MET was negative (figure 1C and see online supplementary figure S1). Finally, in the ureteral metastatic deposit an amplification of both oncogenes was concomitantly present (figure 1B and see online supplementary figure S1). Overexpression of HER2 was not detected in any of the metastatic sites analysed (data not shown). This molecular status was different from that demonstrated in the tumour specimens of previous metastasectomy performed before treatment with EGFR-targeted therapy, where no amplification of either KRAS or MET was detected (data not shown).
Figure 1.
Immunohistochemistry (IHC) and fluorescence in situ hybridisation (FISH) analysis of MET and KRAS. For IHC, the specific MET antibody (Met (D1C2) XP Rabbit mAB, Cell Signaling Technology, Inc.; dilution 1:1000) and KRAS (F234) antibody (SC-30, mouse monoclonal IgG2a Santa Cruz Biotechnology; dilution 1:100) have been used. For FISH analysis the c-MET amplification probe (cytocell) and KRAS/CEN12q FISH probe (Abnova) have been used. Magnification for IHC pictures is ×200 (scale bar: 100 µm), except for B2 that have ×40 (scale bar: 500 µm). Magnification for FISH pictures is ×630 (scale bar: 10 µm). (A) Liver metastasis. (1) IHC showing cytoplasmic MET overexpression (red staining); (2) MET gene amplification (red dots) by FISH in tumour nuclei; (3) IHC negative staining for KRAS protein expression in the same tumour area where MET protein is overexpressed. (B) Ureteral metastasis. (1) IHC showing cytoplasmic MET overexpression (red staining) and FISH analysis (inset) showing MET gene amplification; (2) dual-IHC assay showing overexpression of MET (red staining, upper left) and KRAS (brown staining, bottom right) proteins in two different areas of the same specimen; (3) showing cytoplasmic and membrane KRAS overexpression (red staining) and FISH analysis (inset) showing KRAS gene amplification in the tumour nuclei. (C) Retroperitoneal metastasis. (1) IHC analysis showing negative staining for MET protein; (2) FISH analysis showing KRAS gene amplification (red dots) in tumour nuclei; (3) IHC showing cytoplasmic and membrane KRAS overexpression (red staining) in the same area where MET staining was negative.
esmoopen-2016-000079supp_figure.pdf (123.8KB, pdf)
We and others previously reported KRAS and MET amplifications as bona fide secondary resistance mechanisms to pharmacological pressure exerted by cetuximab or panitumumab.2–4 Here we show that these molecular abnormalities can simultaneously arise within the same patient after initial response to treatment. Further, data from this case study highlight how these distinct genetic alterations can coexist in the same tumour lesion but also might display substantial intrapatient heterogeneity. In conclusion, this molecular case study highlights how selective drug pressure can sustain tumour evolution consisting in the emergence of polyclonal mechanisms of resistance – within the same patient and even within the same metastatic lesion–that eventually drive cancer progression. The knowledge of these coexisting molecular abnormalities can inform targeted therapeutic strategies to overcome drug resistance.5
Footnotes
Funding: Partly supported by AIRC, Associazione Italiana Ricerca Cancro—2010 Special Programme Molecular Clinical Oncology 5×1000, project 9970. Investigators at Niguarda Cancer Center were partly supported by grant Terapia Molecolare Tumori provided by Fondazione Oncologia Niguarda.
Competing interests: None declared.
Provenance and peer review: Not commissioned; internally peer reviewed.
References
- 1.Valtorta E, Martino C, Sartore-Bianchi A et al. . Assessment of a HER2 scoring system for colorectal cancer: results from a validation study. Mod Pathol 2015;28:1481–91. 10.1038/modpathol.2015.98 [DOI] [PubMed] [Google Scholar]
- 2.Siravegna G, Mussolin B, Buscarino M et al. . Clonal evolution and resistance to EGFR blockade in the blood of colorectal cancer patients. Nat Med 2015;21:795–801. 10.1038/nm.3870 [DOI] [PMC free article] [PubMed] [Google Scholar]
- 3.Valtorta E, Misale S, Sartore-Bianchi A et al. . KRAS gene amplification in colorectal cancer and impact on response to EGFR-targeted therapy. Int J Cancer 2013;133:1259–65. 10.1002/ijc.28106 [DOI] [PubMed] [Google Scholar]
- 4.Bardelli A, Corso S, Bertotti A et al. . Amplification of the MET receptor drives resistance to anti-EGFR therapies in colorectal cancer. Cancer Discov 2013;3:658–73. 10.1158/2159-8290.CD-12-0558 [DOI] [PMC free article] [PubMed] [Google Scholar]
- 5.Russo M, Siravegna G, Blaszkowsky LS et al. . Tumor, heterogeneity and lesion-specific response to targeted therapy in colorectal cancer. Cancer Discov 2016;6:147–53. 10.1158/2159-8290.CD-15-1283 [DOI] [PMC free article] [PubMed] [Google Scholar]
Associated Data
This section collects any data citations, data availability statements, or supplementary materials included in this article.
Supplementary Materials
esmoopen-2016-000079supp_figure.pdf (123.8KB, pdf)


