

Abstract
Background and Objective
To clarify mechanisms of genetic regulation of human aging and longevity traits, a number of genome-wide association studies (GWAS) of these traits have been performed. However, the results of these analyses did not meet expectations of the researchers. Most detected genetic associations have not reached a genome-wide level of statistical significance, and suffered from the lack of replication in the studies of independent populations. The reasons for slow progress in this research area include low efficiency of statistical methods used in data analyses, genetic heterogeneity of aging and longevity related traits, possibility of pleiotropic (e.g., age dependent) effects of genetic variants on such traits, underestimation of the effects of (i) mortality selection in genetically heterogeneous cohorts, (ii) external factors and differences in genetic backgrounds of individuals in the populations under study, the weakness of conceptual biological framework that does not fully account for above mentioned factors. One more limitation of conducted studies is that they did not fully realize the potential of longitudinal data that allow for evaluating how genetic influences on life span are mediated by physiological variables and other biomarkers during the life course. The objective of this paper is to address these issues.
Data and Methods
We performed GWAS of human life span using different subsets of data from the original Framingham Heart Study cohort corresponding to different quality control (QC) procedures and used one subset of selected genetic variants for further analyses. We used simulation study to show that approach to combining data improves the quality of GWAS. We used FHS longitudinal data to compare average age trajectories of physiological variables in carriers and non-carriers of selected genetic variants. We used stochastic process model of human mortality and aging to investigate genetic influence on hidden biomarkers of aging and on dynamic interaction between aging and longevity. We investigated properties of genes related to selected variants and their roles in signaling and metabolic pathways.
Results
We showed that the use of different QC procedures results in different sets of genetic variants associated with life span. We selected 24 genetic variants negatively associated with life span. We showed that the joint analyses of genetic data at the time of bio-specimen collection and follow up data substantially improved significance of associations of selected 24 SNPs with life span. We also showed that aging related changes in physiological variables and in hidden biomarkers of aging differ for the groups of carriers and non-carriers of selected variants.
Conclusions
. The results of these analyses demonstrated benefits of using biodemographic models and methods in genetic association studies of these traits. Our findings showed that the absence of a large number of genetic variants with deleterious effects may make substantial contribution to exceptional longevity. These effects are dynamically mediated by a number of physiological variables and hidden biomarkers of aging. The results of these research demonstrated benefits of using integrative statistical models of mortality risks in genetic studies of human aging and longevity.
Keywords: genetics of longevity, genetic model of mortality, stress resistance, genetics of aging, physiological variables
1. Introduction
Actuaries and demographers often analyze mortality data using survival models in which mortality rates are considered as parametric functions of age. Although such models are useful for many practical applications there is a clear understanding that explanatory power and predictive potentials of such models are limited. This is because parameters of these models do not characterize factors and processes involved in shaping age patterns of mortality curves including genes, aging related changes, as well as environmental factors and processes. These models were constructed to provide a good fit to mortality data, with little or no concern about biological interpretation of model parameters. The modern tendency towards developing personalized approaches to prevention and treatment of chronic aging related diseases stimulates deeper insights into the nature of individual aging and its connection with health and survival outcomes. It is clear that the actuarial practice today has to deal with increasing knowledge about factors and mechanisms affecting morbidity and mortality risks and adjust its methods and models accordingly.
Although the details of such adjustment are not clear to date and the discussion of possible alternatives is beyond the scope of this paper, the actuarial science will benefit from information on forces and mechanisms involved in shaping age patterns of mortality curves. It will certainly benefit from summarizing this information in the integrative mortality models whose parameters characterize biological processes developing in aging human bodies, their interaction with external conditions, as well as roles of genetic and non-genetic factors affecting mortality risks. Such models will evolve in parallel with accumulation of knowledge about individual aging related changes and their connections with health and survival outcomes. The rapid growth of genetic data on participants of large longitudinal studies, as well as earlier estimates that about 25–30% of variation in life span is due to genetic factors, open a unique opportunity to clarify the roles of genetic and non-genetic factors in aging, life span, and mortality risk. As in any complicated enterprise, the new findings from studies addressing these issues were accompanied by new challenges and problems. One set of problems deals with special feature of genetic variants affecting aging and longevity related traits, which is often ignored in genetic association studies. These variants are involved in the process of mortality selection in genetically heterogeneous populations that causes changes in genetic structure of the population under study, and affects the results of genome-wide association studies (GWAS) of aging and longevity traits. This indicates that to investigate genetics of human longevity related traits the methods and approaches developed in genetic epidemiology for studying complex multifactorial traits have to be properly adjusted to the effects of mortality selection.
The purpose of this paper is to outline complications and problems accompanying genetic analyses of aging and longevity to date, to identify hidden reserves and underused research potentials of available data and methods, to discuss novel approaches for efficient analyzes of available data, and to outline roles of related genes in aging and longevity. We also show that the use of these hidden reserves allows for addressing fundamental research problems on mechanisms of genetic regulation of aging and life span that have not been addressed before with these data.
We start with the description of genetic and longitudinal data collected in Framingham Heart Study (FHS) used in our analyses. The individuals from the original FHS cohort were followed up for more than 60 years with biennial examinations of physiological state and measurements of other biomarkers. This cohort is especially convenient for studying aging and longevity because almost all study participants from this cohort have data on life span. For historical reasons, not all members of this cohort were genotyped. The bio-specimen (e.g., blood) for genotyped individuals were collected later, and for many of them at different time points. For genetic analyses of longitudinal data the time of bio-specimen collection became a new “baseline”. The age distribution of genotyped individuals at this new “baseline” may contain important information for genetic analyses of human aging and life span if this distribution has sufficient numbers of the adults and old and oldest old individuals. Note that this information has not been used in the genetic analyses of these traits in (Deelen et al. 2011; Lunetta et al. 2007; Nebel et al. 2011; Newman et al. 2010; Walter et al. 2011). These studies demonstrated low efficiency of statistical methods used in genetic association studies, weak associations of detected genetic variants with the traits of interest, and the lack of replication of research findings in the studies of independent populations. These analyses detected many genetic variants associated with longevity. However, most of these variants have not reached genome-wide level of statistical significance.
Several factors are likely to be responsible for these problems. One may deal with the fact that models currently used in GWAS of human aging and longevity are oversimplified and do not correspond to inherent complexity of aging and longevity traits. Specifically, the traditional approaches to GWAS of these traits underestimate the possibility of pleiotropic associations of genetic variants with these traits: genes may show different associations with mortality and life span at different age intervals (Atzmon et al. 2006; Yashin et al. 1999; Yashin et al. 2000); they may show pleiotropic effects on risks of distinct diseases (Yashin et al. 2015). These effects may also include tradeoffs: genes may increase risk of one disease and reduce it for the next (Kulminski et al. 2013; Ukraintseva et al. 2010).
One more reason for slow progress in detecting single genes involved in regulation of aging and longevity traits could be related to the multi-factorial nature of such traits. Traits might be influenced by large numbers of common genetic variants, each having a small effect (Burton et al. 2007; Thomas et al. 2008; Yang et al. 2010; Zeggini et al. 2008). This property was considered as a “disappointing feature of many discoveries made in GWAS, because such genetic variants may be of little predictive value” (Pawitan et al. 2009). The situation indicates the need for approaches capable of evaluating mechanisms by which many small-effect alleles may influence a complex trait of interest. In (Yashin et al. 2010) we investigated one such mechanism for genetic regulation of longevity. We hypothesized that the value of the trait (life span) depends on the number of the small-effect “longevity” alleles contained in the individual genome. The results of our analyses strongly supported this hypothesis and showed that joint influence of many small-effect longevity alleles on life span can be described as the “genetic dose – life span response” relationship. The existence of such relationship brings a new perspective to GWAS of longevity and other complex traits. The construction of different versions of polygenic risks scores and properties of additive polygenic influence on life span has been discussed in (Yashin et al. 2012; Yashin et al. 2012).
The lack of replication -- a serious problem for many GWASs of human aging and longevity traits -- may partly deal with technical issues. Different research groups may detect different sets of genetic variants because they use different statistical models in genetic association studies of these traits. We discuss this issue and provide reference to our paper that addressed this problem in details (Yashin et al. 2012). We also showed that one more reason for the lack of replication of GWAS findings could be differences in quality control (QC) procedures used in preparing genetic data for analyses. It turns out that different research groups often use different QC procedures that may reduce comparability of research findings.
Most researchers studying the genetics of human longevity searched for genes that contribute to increased longevity. This strategy ignores the possibility that at least some part of exceptional longevity could result from the absence of many deleterious genetic factors that contribute to premature death, especially for individuals having large numbers of such “frailty” or “vulnerability” alleles or genotypes. The presence of many such “vulnerability” alleles has been hypothesized in the evolutionary theories of aging (Albin 1993; Charlesworth 2001; Hughes and Reynolds 2005; Ljubuncic and Reznick 2009). A number of detected variants show pleiotropic effects on mortality risk at distinct age intervals of the life course, and different disease traits, as well as on dynamic characteristics of aging-related changes taking place during the life course.
One more reason for low efficiency of genetic association studies of aging and longevity traits might be that conventional methods used in genetic association studies underutilize available information on aging, health and life span. Most of these methods just ignore the available knowledge about the traits of interest accumulated in the research field and treat the limited data set used in the analyses as the only source of information about these traits. This practice misses the opportunities to realize high research potential of the available information (Arbeev et al. 2011; Yashin et al. 2007; Yashin et al. 2013; Yashin et al. 1999; Yashin et al. 2000). It jeopardizes systemic integration of available information on aging and longevity, reduces the efficiency of data analyses, and slows down the progress in better understanding of either the nature of these traits or factors affecting them.
The power and biological relevance of GWAS can be enhanced by incorporating the biological and demographic principles of trait formation into the backbone of genetic analyses, through appropriate mathematical models and statistical functions, and by incorporating genetic questions into a comprehensive framework of dynamic analyses of longitudinal data. We discuss approaches to improving efficiency of genetic association studies and explain how combining genetic data with demographic information can be used for these purposes. We also show that combining genetic information from the data on age distribution at the time of biospecimen collection with that of follow-up data improves the accuracy of genetic analyses.
An important advantage of using longitudinal data in genetic analyses of aging and longevity traits is the opportunity to evaluate survival functions and age trajectories of other biomarkers for carriers and non-carriers of selected genetic variants. The behavior of such survival functions may indicate how the effects of selected genetic variants on mortality risk change with age. The difference in average age trajectories of physiological variables for carriers and non-carriers of selected genetic variants will show how physiological aging related changes are modulated by genetic factors. Note that such a possibility does not exist in the case-control studies. We illustrate this advantage by showing corresponding age trajectories for carriers and non-carriers of the two selected genetic variants.
From the systems biology point of view the biomarkers measured in longitudinal studies represent only a portion of components of a multidimensional biological process representing coordinated process of aging related decline in organism’s functioning. Many important biomarkers of aging are not measured in longitudinal studies but make substantial influence on age-behavior of measured variables. The roles of such biomarkers in the mechanisms of aging related changes were verified in other studies of aging including experiments with animal model systems. To be able to evaluate effects of measured and hidden components of aging related changes on life span in their mutual connection, as well as to evaluate roles of genetic and non-genetic factors in these processes, we developed the genetic stochastic process model of human aging and mortality that includes hidden and observed components of these changes. We show how hidden biomarkers characterizing stress resistance, adaptive capacity, physiological norms, effects of allostatic adaptation and allostatic load can be incorporated into a dynamic stochastic process model (SPM) of human aging, health and longevity, and how this model can be used in statistical analyses of genetic, static non-genetic and phenotypic longitudinal data. The prototype of this model was first described in Woodbury and Manton (1977). Its application to analyses of longitudinal data is described in numerous publications (see (Yashin and Manton 1997) and references in it).
The SPM for analyzing hidden components of aging has been developed and validated in the studies of subsets of the longitudinal data (Arbeev et al. 2009; Arbeev et al. 2011; Arbeev et al. 2012; Yashin et al. 2011; Yashin et al. 2011; Yashin et al. 2007; Yashin et al. 2008; Yashin et al. 2012; Yashin et al. 2010; Yashin et al. 2007; Yashin et al. 2007; Yashin et al. 2008; Yashin et al. 2012; Yashin et al. 2013; Yashin et al. 2009). The use of the genetic version of such a model (GenSPM) (Arbeev et al. 2009) allows us to synthesize all of the components and the outcomes, and to evaluate how genetic effects on aging and longevity traits are mediated by physiological variables and the key biomarkers of aging. Note that an important advantage of using the genetic version of the stochastic process model of human aging, health and mortality is the opportunity to study roles of genetic factors in hidden biomarkers of aging and their connection with health and survival outcomes. These biomarkers (stress resistance, adaptive capacity, age dependent physiological norms, effect of allostatic adaptation, allostatic load) are considered in the model as a part of the biological mechanism involved in forming partly observed age trajectories of physiological variables as well as risks of health and survival outcomes. Such analyses allow for testing whether age trajectories of biomarkers of aging depend on the individual’s genetic background and whether parameters describing age patterns of mortality rates as well as other hazard rates differ for individuals with different genetic background. Finally, we investigate properties of detected genes and their biological roles in regulating aging and life span.
2. Longitudinal Data in Genetic Studies of Aging and Longevity: The Framingham Heart Study
The Framingham Heart Study (FHS) includes 14,428 participants, from whom 9,215 were genotyped for 550,000 SNPs. The FHS original cohort was launched in 1948 (exam 1), with 5,209 respondents (55 percent females) age 28–62 residing in Framingham, Mass., who had not yet developed overt symptoms of cardiovascular disease (Dawber et al. 1951) and continued to the present with biennial examinations (30 exams to date) that include detailed medical history, physical exams and laboratory tests. The offspring cohort (FHSO) was launched in 1971 (with eight exams to date) with 5,124 second-generation individuals (52 percent females), who are the original FHS participants’ adult children and their spouses (Kannel et al. 1979; Splansky et al. 2007). The third generation cohort, consisting of the grandchildren of the original cohort participants, having at least one parent in the offspring cohort, totaling 4,095 individuals (53 percent females), was added to the study with the first examination completed in 2005 (Splansky et al. 2007). The three FHS cohorts use similar research protocols so comparisons could be made. Across the three generations, 99.7 percent of participants are white.
Phenotypic traits collected in the FHS cohorts over 60 years and relevant to our analyses include life span, cause of death, age at disease onset (cardiovascular diseases (CVD), cancer and neurodegenerative disorders (ND)), indices characterizing disease and recovery progress (blood, urinary, mental and physical tests; use of medication and other treatment), internal and external disease risk factors, including diastolic blood pressure (DBP), systolic blood pressure (SBP), ventricular rate (VR), blood glucose (BG), serum cholesterol (CH), body mass index (BMI), and demographic, behavioral and life history characteristics, and selected markers of aging. The occurrence of CVD, cancer, ND and death has been followed through continuous surveillance of hospital admissions, death registries, clinical exams and other sources, so that all the respective events are included in the study.
FHS genetic data include 9,215 individuals from three generations of the FHS who were genotyped for genome-wide SNPs, with results available through the Framingham SNP Health Association Resource (SHARe). The genotyping was conducted using Affymetrix platform with about 550,000 SNPs representing a significant part of human genome variability. Individual information is publicly available through the Framingham SHARe upon request. In this paper we will discuss challenging issues of genetic association studies of human aging and longevity, describe approaches that improve quality of genetic analyses, and illustrate the use of these approaches in the analyses of data from the original FHS cohort.
3. Comprehensive genetic analyses of human life span
Recently, studying the details of genetic connection between individual aging related changes and mortality rate was considered as a matter of high practical importance in gerontological literature. This is because the hypothesis that one can reduce burden of chronic aging related diseases by postponing individual aging processes or by slowing down the individual aging rates received support in experimental studies of aging with laboratory animals. However, despite the high potential of available data and evident progress in clarifying the genetic nature of many complex traits, the genetic studies of human aging and longevity traits had limited success. The decades of genetic studies of longevity using candidate genes showed that new conceptual ideas are needed to better understand genetic mechanisms involved in regulating aging-related traits (De Benedictis et al. 2001; Finch and Tanzi 1997). The expectations that the use of GWAS will rapidly clarify these problems have not been realized. The results of these studies were often controversial. Most associations have not reached genome-wide levels of statistical significance and suffered from the lack of replication. The research findings were difficult to explain from the evolutionary theories point of view. This situation indicates the need for developing new concepts and better methods for analyzing genetic data on such traits (Di Rienzo and Hudson 2005; Teslovich et al. 2010; Vijg and Suh 2005; Yashin et al. 2012).
In explaining slow progress in genetic analyses of aging and longevity traits the presence of pleiotropic and age-dependent genetic associations play important roles (Kulminski et al. 2010; Summers and Crespi 2010; Williams and Day 2003; Yashin et al. 1999; Yashin et al. 2000; Yashin et al. 2001). It turns out that the influence of the APOE polymorphism on health and longevity related traits showing such effects.
3.1. Effects of APOE alleles on life span and aging related diseases
From the FHS and FHSO generations, 5,182 individuals have information on the apolipoprotein E (APOE) e2/3/4 polymorphism. The association of APOE alleles and genotypes with longevity is confirmed in a number of studies, however, the pleiotropic properties of APOE polymorphism are not well known. In (Kulminski et al. 2013) we show that the APOE e4 allele can play detrimental, neutral, and protective sex-specific roles in the etiology of CVD at different ages and in different environments. Specifically, the role of the e4 allele in onset of CVD is age- and generation-specific, constituting two modes of sexually dimorphic genetic trade-offs. In offspring, the e4 allele confers risk of CVD primarily in women and can protect against cancer primarily in men of the same age. In the parental generation, genetic trade-off is seen in different age groups, with a protective role of the e4 allele against cancer in older men and its detrimental role in CVD in younger women. The aging-related processes can modulate the strength of genetic associations with total cholesterol (TC) in the same individuals at different chronological ages. Substantial differences in the effects of the same APOE allele on CVD and TC was also observed across generations (Kulminski et al. 2013). These results suggest that aging-related processes and changing environments may modulate genetic effects on healthspan. The analyses also show that the e4 allele carriers live longer without cancer than the non-carriers of this allele in each generation (Kulminski et al. 2013). The association of the APOE e4 allele with lifespan in two generations of participants of large longitudinal studies, the Framingham Heart Study and the Long Life Family Study showed that women’s lifespan is more sensitive to the e4 allele than men’s in these populations (Kulminski et al. 2014). The strongly adverse effect of the e4 allele is observed for women between 70 to 95 years of age. Cardiovascular disease, cancer, and neurodegenerative disorders did not mediated the association of the e4 allele with lifespan. However, cancer non-additively enhanced this effect resulting in 4.2 years of difference in mean lifespan for the e4 allele carriers compared to the non-carriers. These properties of genetic mechanisms manifested in different genders, ages, and environments calls for more detail and systemic analyses beyond those used in current large-scale genetic association studies.
3.2. The influence of quality control (QC) procedures used in GWAS on the results of genetic analyses
It is important to note that a substantial part of the original FHS cohort has information on life spans of the study participants. To be able to use a mixed effects model in the analyses of data on life span we have to make imputation of censored data. For this purpose, we estimated residual life spans for individuals censored at a given age by calculating average lifespan of deceased study participants who survived up to this age. In the analyses of genetic connection with lifespan we imputed the data for male and female members of the original FHS cohort with censored life spans by adding average residual lifespan to the age at censoring. Then we prepared several datasets for genetic analyses using different QC procedures. The sample call rates, SNP call rates, minimal value of minor allele frequencies (MAF) and minimal p-value to control for Hardy-Weinberg equilibrium (HWE) are specified in the diagram (Fig. 1). One can see from this diagram that the use of different sample call rates results in different numbers of study subjects participated in genetic analyses.
Figure 1. Effects of sample call rate in GWAS.
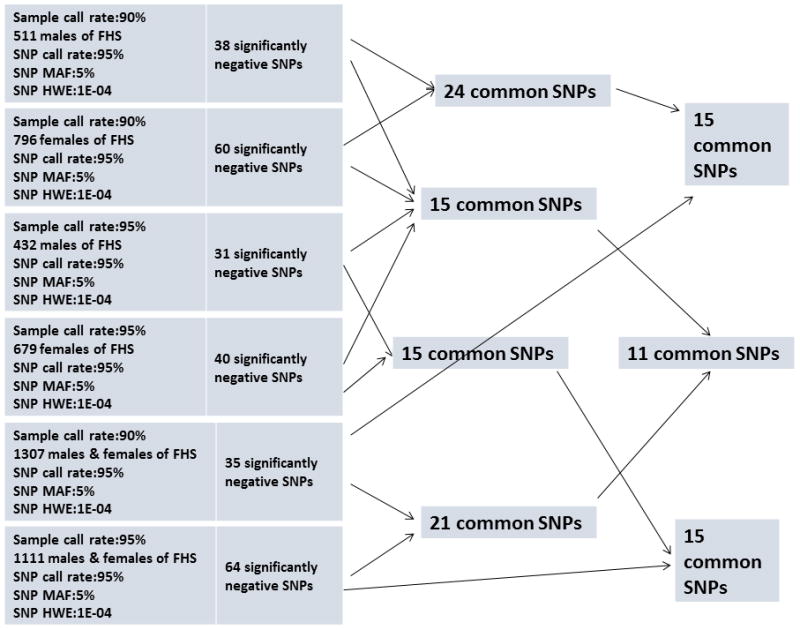
Note: The figure shows the effects of sample call rate on the number of genome-wide statistically significant genetic variants in GWAS of the Framingham original cohort.
Source: Framingham Heart Study (a limited access dataset), original cohort
Using these data and the mixed model realized in EMMAX software (Kang et al. 2010), we performed GWAS of human life span controlling for smoking (ever or never) and birth cohort. The analyses resulted in several sets of genetic variants (Fig. 1) having genome-wide significant negative associations with life span. Note that although the numbers of variants detected in these analyses differ for different datasets, a substantial portion of variants remains common for all analyses. This might be because all these analyses are performed with subgroups of the same population (genotyped individuals from the original FHS cohort). In case of independent populations the intersections among selected sets of variants could be empty because of differences in genetic backgrounds and the histories of exposure to external conditions. This explains why it might be difficult to confirm research findings by comparing them with those obtained by different research groups. The use of different QC procedures in genetic association studies of aging and longevity traits by different research groups could contribute to the non-replication of the research results. These results also cast doubt to the accuracy of the results of meta-analyses dealing with findings from studies that used different QC procedures.
One can conclude from this diagram that parameters in call rates influence the sample size as well as the number of detected genetic variants. In cases where the sample size of the data is limited, the stringent control for sample call rate may substantially reduce the number of people in the study. The difference in results of analyses indicates that differences in parameters of the QC procedures may contribute to the lack of replication using independent populations if these studies used different QC procedures. Thus, one approach that might contribute to resolving situation with lack of replication is to use similar QC procedures in different analyses. What are other methods and approaches that can improve the quality of genetic analyses?
3.3. How the quality of genetic analyses can be improved
The statistical methods used in genetic association studies of human aging and longevity are simple and convenient for performing multiple calculations relatively fast. This property makes such methods attractive for genome-wide association studies with large amounts of genetic information. However, statistical models linking genetic factors with phenotypes of interest look over-simplified from the biological point of view. The genetic analyses could benefit from using more sophisticated models adjusted to biological complexity of aging and longevity traits. The traditional approaches to genetic analyses treat each new dataset as if it is the only dataset available. Either the findings from the earlier genetic studies of human longevity, or other relevant information available in the research field that could make genetic analyses more efficient are ignored. The integration of the wealth of available knowledge about aging and longevity and its use in the analyses of data are needed. Such integration can be done, for example, by including informative data that have not been used before in the analyses. The access to longitudinal data on aging and longevity opens additional opportunities for efficient genetic analyses. Combining genetic data from the age distribution at baseline (at the time of bio-specimen collection) with those from the follow up studies in joint analyses improves the quality of genetic estimates. The advanced statistical and computer models of aging related changes and life span are capable of incorporating appropriate information on hidden biomarkers and mechanisms of aging changes in the model’s structure. Such incorporation requires understanding certain biological regularities and connections and has to be performed by the interdisciplinary research group. The use of these approaches allows for substantial improvement of the quality of genetic estimates. It also allows for addressing new fundamental research questions about the nature of aging related changes in humans.
3.3.1 Combining demographic and genetic data improves the accuracy of genetic analyses
The critical analysis of conducted genetic association studies of human aging and longevity allowed for detecting the underutilized reserves in the data that can be used to improve the accuracy of such associations with human longevity. One such reserve is the data on all-cause mortality. The benefits of using such data are based on the fact that populations, from which the samples of study subjects were taken, are genetically heterogeneous groups of individuals. The age trajectories of mortality rates in such populations result from selection process that took place in genetically heterogeneous cohorts. Each such cohort can be represented as a mixture of carriers and non-carriers of selected genetic variant. The mortality rate at a given age in such population is a weighted sum of mortality rates in sub-populations of carriers and non-carriers where the weights coincide with proportions of carriers and non-carriers in the cohort at this age. There is a one-to-one correspondence between the age trajectories of these proportions and mortality rates for the groups of carriers and non-carriers. This correspondence has simple mathematical description that can be used in joint analyses of demographic and genetic data. Such analyses improve the accuracy of genetic estimates. The information for genetic analyses consists of demographic data for the non-genotyped part of the population and genetic data for the genotyped part of this population. The demographic information is presented by data on total mortality.
The population of non-genotyped individuals is considered as a mixture of carriers and non-carriers of selected genetic variant. The genetic data for genotyped individuals are represented by the numbers of carriers and non-carriers of selected genetic variant at different ages. The carriers and non-carriers of this variant have mortality rates μ1(x) and μ0(x), respectively. The total mortality μ̄(x) is represented as weighted sum of the two mortality rates μ̄(x) = π1(x)μ1(x) + (1 − π1(x))μ0(x), where π1(x) is the proportion of carriers at age x. The null-hypothesis is that the two mortality rates are the same. This hypothesis can be tested in genetic association study by maximizing the joint likelihood of demographic and genetic data, and using the likelihood-ratio test (Yashin et al. 1999; Yashin et al. 2000).
3.3.2. The age structure of the population under study at the time of biospecimen collection
The age structure of the group of genotyped study subjects at the time of bio-specimen collection provides one with additional information about the genetics of life span. This information can also be used for improving the accuracy of genetic analyses. The idea is based on the fact that participants of prospective studies usually have different ages at the time of biospecimen collection (see figure 2). To illustrate the benefits of the approach for joint analyses of the follow-up data and the data on ages at the time of biospecimen collection compared to the analyses of the follow-up data alone, we performed a simulation study assuming that carriers and non-carriers of some hypothetical allele in a population have the Cox’s-type mortality rates μ(x | G) = μ0(x)eγG where G = 0 for non-carriers and G = 1 for carriers, and the baseline mortality is the Gompertz function, i.e., ln μ0(x) = ln a +bx. In simulation, we used ln a = −9.0 and b = 0.08, to produce reasonable survival patterns corresponding to human populations, and the proportion of carriers at birth, p0 = 0.25. The parameter γ varied from −0.5 to 0.5 with the interval 0.1 to simulate scenarios with different effect sizes. For each set of model parameters defined above, we generated life spans of 4,500 individuals from the respective probability distributions, i.e., those corresponding to the hazard μ0(x)eγ for carriers and μ0(x) for non-carriers. Then we assigned the hypothetical “ages at entry” into the study, which is also considered ages at the time of biospecimen collection, uniformly distributed over the interval between 40 and 100 years. Individuals with simulated life spans exceeding “age at entry” plus six years were considered censored at the “age at entry” plus six. Such design resembles the Long Life Family Study (Yashin et al. 2010). This procedure was repeated 1,000 times to generate 1,000 datasets (in each scenario with respective γ). We then estimated these data using the parts of the likelihood functions from Arbeev et al. (2011) containing: (1) only follow-up information, and (2) follow-up information and information on ages at biospecimen collection. We calculated the power, i.e., the proportion of datasets for which the null hypothesis γ = 0 was rejected at the 0.05 level, in these two methods for different effect sizes, i.e., the values of the regression parameter γ. The results are shown in table 1.
Figure 2. Distribution of age at time of biospecimen collection.

Source: Framingham Heart Study (a limited access dataset), original cohort
Table 1.
Power in simulation studies
| γ | RR | Follow-up only | Follow-up and ages |
|---|---|---|---|
| −0.5 | 0.607 | 1.000 | 1.000 |
| −0.4 | 0.670 | 0.997 | 1.000 |
| −0.3 | 0.741 | 0.940 | 1.000 |
| −0.2 | 0.819 | 0.663 | 0.938 |
| −0.1 | 0.905 | 0.198 | 0.435 |
| 0.0 | 1.000 | 0.058 | 0.043 |
| 0.1 | 1.105 | 0.223 | 0.464 |
| 0.2 | 1.221 | 0.666 | 0.958 |
| 0.3 | 1.350 | 0.953 | 1.000 |
| 0.4 | 1.492 | 0.996 | 1.000 |
| 0.5 | 1.649 | 1.000 | 1.000 |
Note: The table illustrates the power in simulation studies for two methods: (1) only follow-up information, and (2) follow-up information and information on ages at biospecimen collection.
The results shown in table 1 indicate that the use of information on ages at biospecimen collection in addition to the follow-up data gives a substantial increase in power compared to the traditional approach that uses the follow-up data only (note that these analyses can also be implemented to the data on ages at disease onset instead on life span data). The effect, however, depends on duration of the follow-up period. In the case of a longer follow-up period, the relative contribution of the data on ages at the time of biospecimen collection to the improvement of the accuracy of statistical estimates will be smaller. Conversely, in the case of a shorter follow-up period, the data on ages at biospecimen collection play a more important role in differentiating the allele- or genotype-specific survival patterns from the data. The results of these analyses show that the approach described above may have important implications for GWA studies of human aging, health and longevity, especially in cases with short follow-up periods (Yashin et al. 2013).
The application of this approach to the analyses of data on 24 vulnerability alleles (corresponding to one of the QC procedures in our GWAS of longevity in FHS, see next section) resulted in a substantial increase in the significance of detected p-values. Application of the method that, in addition to follow-up data on genotyped and ages at biospecimen collection, utilizes follow-up data on non-genotyped individuals (Arbeev et al. 2011) results in an additional increase in the accuracy and power of estimates in such joint analyses compared to analyses based on genetic subsample alone. Application of this method to analysis of the effect of common APOE polymorphism on survival using combined genetic and non-genetic subsamples of the FHS original cohort data showed an important result that female, but not male, carriers of the APOE e4 allele have significantly worse survival than non-carriers, whereas empirical analyses did not attain significant results for either sex (Arbeev et al. 2011).
3.4. Twenty four vulnerability alleles
Let us investigate properties of 24 genetic variants that showed associations with life span in both male and female study participants of the original FHS cohort in GWAS characterized by the QC procedure with sample call rate >=90%, SNP call rate >=90%, HWE >=10−4 and MAF>=5% (see Fig. 1). Note that all these variants have negative associations with life span, so they will be called “frailty” or “vulnerability” alleles.
Table 2 illustrates properties of 24 selected variants (SNPs). The first column shows SNP rs-number; the second -- chromosome number; the third and the fourth columns show the number of minor alleles and the total number of alleles for the corresponding SNP, respectively; the fifth, sixth, and seventh columns show the SNPs’ minor allele frequencies in our study, HapMap, and “1000 genome” databases.
Table 2.
Properties of 24 selected SNPs
| rs num | Chr | # MA | # A | MAF | MAF HP |
MAF 1000 |
|---|---|---|---|---|---|---|
| rs5491 | 19 | 224 | 2128 | 0.10563 | 0 | 0.075 |
| rs356430 | 5 | 218 | 2020 | 0.107921 | 0 | 0.017 |
| rs1399453 | 12 | 225 | 2052 | 0.109649 | 0 | 0.024 |
| rs1440483 | 11 | 190 | 2064 | 0.092054 | 0 | 0.054 |
| rs1794108 | 11 | 159 | 2104 | 0.07557 | 0 | 0 |
| rs2353447 | 8 | 230 | 2092 | 0.109943 | 0 | 0.02 |
| rs2586484 | 17 | 236 | 2074 | 0.11379 | 0.008 | 0.012 |
| rs2838566 | 21 | 252 | 2098 | 0.120114 | 0 | 0.11 |
| rs3738682 | 1 | 166 | 2026 | 0.081935 | 0.017 | 0.011 |
| rs4565533 | 9 | 447 | 2088 | 0.21408 | 0.09 | 0.06 |
| rs4904670 | 14 | 291 | 2120 | 0.137264 | 0 | 0.03 |
| rs5743998 | 11 | 198 | 2044 | 0.096869 | 0 | 0.012 |
| rs6007952 | 22 | 356 | 2058 | 0.172983 | 0.05 | 0.06 |
| rs6090342 | 20 | 266 | 2060 | 0.129126 | 0 | 0.28 |
| rs7894051 | 10 | 426 | 2136 | 0.199438 | 0.05 | 0.1 |
| rs8081943 | 17 | 148 | 2176 | 0.068015 | 0 | 0.03 |
| rs8135777 | 22 | 216 | 1996 | 0.108216 | 0 | 0.023 |
| rs9896996 | 17 | 209 | 2082 | 0.100384 | 0.035 | 0.04 |
| rs9925881 | 16 | 144 | 2068 | 0.069632 | 0 | 0.05 |
| rs9928967 | 16 | 137 | 2140 | 0.064019 | 0 | 0.03 |
| rs9971555 | 11 | 232 | 2092 | 0.110899 | 0 | 0.02 |
| rs10845099 | 12 | 380 | 2072 | 0.183398 | 0.093 | 0.323 |
| rs11536959 | 20 | 155 | 2132 | 0.072702 | 0 | 0.017 |
| rs17067605 | 5 | 167 | 2046 | 0.081623 | 0 | 0.004 |
Note: The table contains the list of SNPs selected according to one of the QC procedures (see the text) whose minor alleles have significant negative associations with life span. The columns in the table denote: (1) SNP number; (2) chromosome number; (3) number of minor alleles in a sample; (4) the total number of alleles in a sample; (5) minor allele frequencies in a sample; (6) minor allele frequencies in HapMap; (7) minor allele frequencies in the 1,000 Genome Project.
Source: Framingham Heart Study (a limited access dataset)
One can see that chromosomes 2, 3, 4, 6, 7, 9, 13, 15, 18, and 21 are not represented by the selected SNPs. Chromosome 11 is represented by 4 SNPs: rs1440483, rs1794108, rs5743998, and rs9971555. Chromosome 12 is represented by the two SNPs rs1399453 and rs1084509; three SNPs are in chromosome 17; rs2586484, rs8081943, and rs9896996; two others are on chromosome 20: rs6090342 and rs1153695; two are on chromosome 5 rs356430 and rs1706760; two are on chromosome 16 rs9925881 and rs9928967; one SNP is on chromosome 1: rs3738682. Similarly, chromosomes 8, 9, 19, 21 and 22 have only one SNP: rs2353447, rs4565533, rs2838566, rs6007952, and rs8135777, respectively.
3.4.1 Sensitivity analyses
Tables 3 and 4 show the results of additional genetic association studies that involve 24 detected variants. To test how sensitive the results of GWAS are to the lifespan imputation, we modified the life span data by considering ages at censoring for 203 censored individuals as ages at death, and performed GWAS of modified data. These analyses resulted in 21 genome-wide significant SNPs common for males and females, respectively. 15 out of these 21 SNPs also belong to the set of 24 SNPs detected earlier. These 15 SNPs are marked by “*” in Tables 3 and 4. The associations of other variants with life span remain nominally statistically significant.
Table 3.
Parameter estimates of Gompertz’s approximations of survival functions for males
| SNP | ln_a_1 | b_1 | ln_a_0 | b_0 | p-value |
|---|---|---|---|---|---|
| rs6007952# * | −5.55 | 0.045 | −8.79 | 0.078 | 4.06E-09 |
| rs9971555# * | −6.12 | 0.054 | −8.73 | 0.077 | 9.33E-14 |
| rs9896996 * | −5.27 | 0.044 | −8.57 | 0.075 | 2.49E-12 |
| rs2353447 # * | −6.20 | 0.055 | −8.38 | 0.073 | 2.12E-12 |
| rs4904670 # * | −6.24 | 0.056 | −9.81 | 0.088 | 0.00E+00 |
| rs6090342 # * | −6.13 | 0.054 | −8.74 | 0.077 | 1.12E-13 |
| rs17067605 | −5.25 | 0.044 | −8.75 | 0.078 | 1.55E-14 |
| rs1440483 | −7.25 | 0.070 | −8.65 | 0.076 | 0.00E+00 |
| rs2838566 # * | −6.06 | 0.054 | −9.47 | 0.085 | 0.00E+00 |
| rs9925881 | −5.65 | 0.049 | −8.21 | 0.071 | 2.75E-11 |
| rs4565533 # * | −5.798 | 0.048 | −9.56 | 0.086 | 2.66E-13 |
| rs5743998 | −6.03 | 0.053 | −8.23 | 0.072 | 6.10E-11 |
| rs3738682 | −6.15 | 0.056 | −8.38 | 0.075 | 4.63E-14 |
| rs7894051 # * | −6.00 | 0.051 | −9.76 | 0.088 | 1.79E-14 |
| rs2586484 * | −6.40 | 0.057 | −8.55 | 0.075 | 9.06E-14 |
| rs356430 # * | −7.10 | 0.067 | −8.26 | 0.072 | 2.80E-13 |
| rs10845099 * | −6.30 | 0.054 | −8.84 | 0.078 | 7.22E-12 |
| rs8135777 #* | −5.74 | 0.050 | −8.54 | 0.075 | 8.03E-13 |
| rs11536959 | −5.30 | 0.045 | −8.32 | 0.073 | 2.54E-12 |
| rs1399453 # * | −5.85 | 0.051 | −8.80 | 0.078 | 1.99E-14 |
| rs9928967 | −5.12 | 0.043 | −8.45 | 0.074 | 1.41E-13 |
| rs5491 # * | −6.37 | 0.056 | −8.00 | 0.069 | 4.18E-09 |
| rs1794108 | −5.50 | 0.048 | −8.55 | 0.075 | 3.50E-14 |
| rs8081943 | −5.74 | 0.050 | −8.54 | 0.075 | 8.03E-13 |
Note: The table shows the estimates of parameters of Gompertz’s approximations of survival functions for carriers and non-carriers of each of 24 vulnerability alleles for genotyped male participants of the original FHS cohort.
Column “SNP” shows rs number of the SNP. The symbols in this column denote:
: minor allele of corresponding SNP had a genome-wide significant association with Box-Cox transformed life spans;
: minor allele of corresponding SNP showed a genome-wide significant association with modified life span data (i.e., with ages at censoring for 203 censored individuals considered as ages at death).
Columns “ln_a_1” and “b_1” show the estimates of parameters of Gompertz mortality curve μ(x) = a0eb0x for carriers of minor allele of corresponding SNP.
Columns “ln_a_0” and “b_0” show the estimates of parameters of Gompertz mortality curve μ(x) = a0eb0x for non-carriers of minor allele of corresponding SNP.
Column “p-value” shows p-values for testing the null-hypothesis about the equality the survival functions among carriers and non-carriers.
Source: Framingham Heart Study (a limited access dataset)
Table 4.
Parameter estimates of Gompertz’s approximations of survival functions for females
| SNP | ln_a_1 | b_1 | ln_a_0 | b_0 | p-value |
|---|---|---|---|---|---|
| rs6007952 # * | −5.91 | 0.046 | −11.28 | 0.102 | 2.33E-15 |
| rs9971555 # * | −5.22 | 0.040 | −10.78 | 0.097 | 1.44E-15 |
| rs9896996 * | −4.48 | 0.031 | −10.85 | 0.098 | 1.11E-15 |
| rs2353447 # * | −5.00 | 0.038 | −11.41 | 0.103 | 0.00E+00 |
| rs4904670 # * | −5.86 | 0.048 | −11.52 | 0.104 | 0.00E+00 |
| rs6090342 # * | −5.62 | 0.044 | −11.08 | 0.100 | 0.00E+00 |
| rs17067605 | −4.79 | 0.036 | −10.55 | 0.094 | 3.33E-16 |
| rs1440483 | −4.81 | 0.036 | −10.76 | 0.096 | 0.00E+00 |
| rs2838566 #* | −4.88 | 0.036 | −11.56 | 0.105 | 0.00E+00 |
| rs9925881 | −5.12 | 0.040 | −10.03 | 0.089 | 3.22E-12 |
| rs4565533 #* | −5.97 | 0.047 | −12.45 | 0.114 | 0.00E+00 |
| rs5743998 | −4.74 | 0.034 | −10.82 | 0.097 | 3.33E-16 |
| rs3738682 | −4.95 | 0.038 | −10.65 | 0.095 | 0.00E+00 |
| rs7894051 # * | −5.90 | 0.047 | −12.37 | 0.113 | 0.00E+00 |
| rs2586484 * | −5.19 | 0.039 | −10.81 | 0.097 | 3.89E-15 |
| rs356430 # * | −5.45 | 0.043 | −10.61 | 0.095 | 7.77E-16 |
| rs10845099 * | −5.36 | 0.039 | −11.26 | 0.102 | 2.33E-12 |
| rs8135777 # * | −5.61 | 0.044 | −10.56 | 0.094 | 6.00E-15 |
| rs11536959 | −5.19 | 0.040 | −10.21 | 0.090 | 5.02E-13 |
| rs1399453 # * | −5.55 | 0.044 | −10.61 | 0.095 | 1.44E-15 |
| rs9928967 | −4.21 | 0.029 | −10.37 | 0.092 | 1.82E-14 |
| rs5491 # * | −6.34 | 0.054 | −10.56 | 0.094 | 0.00E+00 |
| rs1794108 | −4.81 | 0.036 | −10.38 | 0.092 | 1.38E-14 |
| rs8081943 | −4.19 | 0.029 | −10.52 | 0.094 | 0.00E+00 |
Note: The table shows the estimates of parameters of Gompertz’s approximations of survival functions for carriers and non-carriers of each of 24 vulnerability alleles for genotyped female participants of the original FHS cohort.
Column “SNP” shows rs number of the SNP. The symbols in this column denote:
: minor allele of corresponding SNP had a genome-wide significant association with Box-Cox transformed life spans;
: minor allele of corresponding SNP showed a genome-wide significant association with modified life span data (i.e., with ages at censoring for 203 censored individuals considered as ages at death).
Columns “ln_a_1” and “b_1” show the estimates of parameters of Gompertz mortality curve μ(x) = a0eb0x for carriers of minor allele of corresponding SNP.
Columns “ln_a_0” and “b_0” show the estimates of parameters of Gompertz mortality curve μ(x) = a0eb0x for non-carriers of minor allele of corresponding SNP.
Column “p-value” shows p-values for testing the null-hypothesis about the equality the survival functions among carriers and non-carriers.
Source: Framingham Heart Study (a limited access dataset)
The p-values and standard errors calculated by statistical estimation algorithms are based on the assumption on normality of data used in the analyses. The empirical distributions of lifespan for males and females usually deviate from normal. To make them more “normalized,” we performed Box-Cox transformation of these distributions. The GWAS of transformed data resulted in 43 SNPs negatively associated SNPs for females, and 33 such SNPs for males. The intersection of these sets with the set of 24 SNPs resulted in 12 SNPs. These SNPs are marked by “#”in Tables 3 and 4.
To test whether selected genetic variants have significant association with lifespan without using lifespan imputation procedure, we performed additional genetic analyses by combining the follow up data on lifespan in the original FHS cohort with data on genetic frequencies from age distribution of the age at blood collection. The method is described in section 3.4.2. In these analyses the mortality rates for carriers and non-carriers of each of 24 preselected alleles were described by the Gompertz’s curves. The parameters of these curves were estimated and the null-hypotheses about similarity of mortality rates for carriers and non-carriers of each of 24 genetic variants were tested. The results of these analyses are shown in Tables 3 and 4. They indicate that difference in mortality patterns between carriers and non-carriers of corresponding genetic variants is highly statistically significant.
3.4.2. Polygenic score index
Using 24 selected genetic variants negatively associated with life span we constructed additive polygenic risk score indices. For this purpose for each study participant we calculated weighted sums of the numbers of detected genetic variants carried by this person using estimated effect sizes as weights. We also constructed a simplified polygenic score index by counting the number of vulnerability alleles carried by each genotyped study participant (genetic dose index) (see details in Supplementary Materials in (Yashin et al. 2012)). Fig. 3 shows Kaplan-Meier estimates of conditional survival functions together with 95% confidence intervals for the three groups of individuals: (1) carriers of 2 or less vulnerability alleles, (2) carriers of more than 2 vulnerability alleles, and (3) total population for individuals survived to age 80. One can see from this figure that individuals carrying a smaller number of vulnerability alleles have better survival functions than average individuals and those who have a larger number of vulnerability alleles.
Figure 3. Survival functions of individuals with different dose of vulnerability alleles.

Note: The figure shows Kaplan-Meier estimates of conditional survival functions for carriers of two or less (dotted line) and more than two (dashed line) out of 24 vulnerability alleles. Solid line shows survival function for genotyped individuals.
Source: Framingham Heart Study (a limited access dataset), original cohort
In our earlier study, biodemographic analyses of genetic regulation of life span was done using data on longevity alleles selected in the GWAS of human life span by applying several different statistical models to the FHS data (Yashin et al. 2012). Age-specific survival curves considered as functions of the number of longevity alleles exhibited regularities known in demography as “rectangularization” of survival curves. An important finding was that the presence of such pattern confirms the results from theoretical and experimental studies about connection between longevity and stress resistance. Biodemographic analyses can thus provide important insights into the properties of genes affecting phenotypic traits (Yashin et al. 2012).
3.5. Average age trajectories of physiological variables in total genotyped sample and in carriers and non-carriers of vulnerability alleles
The inclusion of longitudinal data in the analyses allows for getting new insights into biological mechanisms that mediate effects of various influential factors on life span. In particular, using these data one can evaluate and compare average age trajectories of physiological indices and other biomarkers for different groups of study participants. Figure 4 shows average age trajectories of physiological indices for males and females. One can see from this figure that average trajectories for BG and PP were about the same for males and females, with a slight difference between ages 65 and 80 for BG and for PP before age 45, where female PP values were lower, and after age 70, where female PP values were higher.
Figure 4. Average age trajectories of physiological variables for genotyped males and females.

Source: Framingham Heart Study (a limited access dataset), original cohort; pooled data from exams 1 to 28
The average BMI values for females were lower than that of males until age 75. After this age, the curves practically coincide. The values of CH were lower for females until age 45 and then became higher until the end of the observation interval. The values of DBP were lower in females until age 75. After this age, the curves became indistinguishable. The SBP was lower for females until age 50. Then the males and females curves practically coincide until age 75. After this age, the female SBP curve became higher than that for males. The H curve for males is higher than that of females for the entire interval, and the VR curve is higher for females for the entire age interval. It is clear that the observed difference between males and females is partly of genetic origin. It is also likely that males and females experienced different exposure to external conditions.
Using data on detected genetic variants associated with life span one can evaluate and compare age trajectories of physiological indices for groups of study subjects having different genetic backgrounds. Figures 5 and 6 show average age trajectories of physiological variables for male carriers and non-carriers of minor alleles of rs5491 and rs9925881 SNPs from the original FHS cohort.
Figure 5. Physiological variables in male carriers/non-carriers of minor allele of rs5491.

Note: The figure shows the average age trajectories of eight physiological variables for male carriers and non-carriers of the minor allele (MA) of SNP rs5491.
Source: Framingham Heart Study (a limited access dataset), original cohort
Figure 6. Physiological variables in male carriers/non-carriers of minor allele of rs9925881.

Note: The figure shows the average age trajectories of eight physiological variables for male carriers and non-carriers of the minor allele (MA) of SNP rs9925881.
Source: Framingham Heart Study (a limited access dataset), original cohort
These two alleles were selected to illustrate the difference in their associations with age trajectories of physiological variables, therefore trajectories for female carriers and non-carriers are not shown. One can see from these figures that the main difference for carriers and non-carriers of the rs5491 SNP is in age trajectories of BMI and CH, and for the rs9925881 SNP, it is the average age trajectories of systolic and diastolic blood pressure.
3.6. Genetic analyses of longitudinal data on aging, health and longevity using the genetic version of the stochastic process model, GenSPM
The empirical evaluation of age trajectories of physiological indices for different groups of study subjects allows for capturing and analyses of differences in age trajectories of these indices among the groups. Such analyses, however, do not allow for studying behavior of hidden biomarkers of aging related changes that are involved in mechanisms regulating age trajectories of physiological indices measured in longitudinal studies. Many such components were discussed in gerontological literature, but were never analyzed together as a part of one mechanism of aging related changes. They include the notions of age-specific physiological norms (Lewington et al. 2002; Palatini 1999; Westin and Heath 2005), allostasis and allostatic load (Karlamangla et al. 2006; Seeman et al. 2001), the adaptive capacity (Lund et al. 2002; Troncale 1996), stress resistance with age (Hall et al. 2000; Ukraintseva and Yashin 2003; Yashin et al. 2007) and stochasticity, e.g., stochasticity associated with erratic behavior of physiological parameters (Goldberger et al. 2002). To investigate mechanisms of aging related changes with hidden and partly observed components the dynamic model describing such changes and their connection with health and survival outcomes is needed. The versions of such model were investigated in (Yashin et al. 2011; Yashin et al. 2007; Yashin et al. 2008; Yashin et al. 2012).
The key part of such models is mortality risk considered as function of physiological variables. Many epidemiological studies provide evidence of U- or J-shaped risks as functions of different physiological characteristics of health (Allison et al. 1997; Boutitie et al. 2002; Kulminski et al. 2008; Kuzuya et al. 2008; Mazza et al. 2007; Okumiya et al. 1999; Protogerou et al. 2007; Troiano et al. 1996; Witteman et al. 1994). Therefore, the use of such quadratic (U- or J-shaped) hazards in the analyses is biologically meaningful. An important class of models for joint analyses of longitudinal and time-to-event data uses a stochastic process for description of longitudinal measurements and a quadratic hazard as a function of physiological variables. An initial version of such models was put forth in a 2007 report (Yashin et al. 2007). The model’s various extensions have been formulated and applied in different contexts to investigate mechanisms of aging-related changes in connection with morbidity or mortality risks (Akushevich et al. 2012; Arbeev et al. 2009; Arbeev et al. 2011; Arbeev et al. 2012; Tolley 2012; Yashin et al. 2011; Yashin et al. 2008; Yashin et al. 2012; Yashin et al. 2010; Yashin et al. 2008; Yashin et al. 2011; Yashin et al. 2013; Yashin et al. 2009). The advantage of this approach is that it allows for incorporating the concepts and mechanisms of aging-related changes mentioned above on the basis of the common framework provided by this model.
The version of SPM for analyses of genetic data (GenSPM) was developed in a 2009 effort (Arbeev et al. 2009). This GenSPM permits:
joint analyses of genotyped and non-genotyped subsamples of longitudinal data to make use of all available information and to increase the accuracy/power of estimates compared to analyses of genotyped subsample alone;
evaluation of indirect genetic effects, e.g., associated with unobservable or unmeasured risk factors, mediated by age trajectories of physiological variables collected in a longitudinal study; and
incorporation of concepts and mechanisms of systems biology underlying aging-related changes in organisms that are not directly measured in longitudinal data but can be estimated from individual age trajectories of physiological variables and time-to-event data.
Specifically, this model permits evaluation of hidden (unobserved) biomarkers driving individual physiological change and affecting population characteristics. These include the aforementioned concepts of age-specific physiological norms, the allostatic load, homeostenosis, the decline in stress resistance with age, the short-scale stochasticity and respective hazard rates, for carriers and non-carriers of a selected allele/genotype. This model can be straightforwardly extended to incorporate “static” covariates to evaluate their modulating role in life course genetic effects.
3.6.1. Model Description
The GenSPM (Arbeev et al. 2009) was applied to the analyses of longitudinal data on serum cholesterol and diastolic blood pressure for APOE and non-APOE subsamples of the original FHS cohort. The details of model construction and the likelihood maximization procedure are described in the report (Arbeev et al. 2009). Here we give only a brief description of the model to help understand the research results.
The evolution of physiological variables Yt over age t is described by the stochastic differential equation
| (1) |
with the initial condition Yt0 ~ N(f1(t0,G), σ0G). Here G (G = 0, 1; P(G =1) = p1) is a discrete random variable characterizing the absence (G = 1) or presence (G = 0) of the APOE e4 allele in a person’s genome, Wt is a Wiener process independent of Yt0 and G. The coefficient B(t,G) was considered constant (B(t,G) = σ1G) in these applications.
The effect of allostatic adaptation f1(t,G) (Arbeev et al. 2009; Yashin et al. 2007) is described as quadratic function of t: . This choice comes from the empirical observations of the average trajectories of the physiological variables in the FHS, which generally have a quadratic form, although, of course, these average trajectories do not necessary have to follow f1(t,G).
The negative feedback coefficient a (t,G) is characterized by strength of homeostatic forces. The decline in the absolute value of this coefficient with age represents the decline in the adaptive (homeostatic) capacity with age (“homeostenosis”), which has been shown to be an important characteristic of aging (Hall et al. 2000; Lund et al. 2002; Rankin and Kushner 2009; Troncale 1996). We used a linear approximation of this coefficient as a function of age: (with and ).
The U- or J-shapes of the mortality and morbidity risks as functions of various physiological variables and other risk factors were confirmed in a number of studies (Allison et al. 1997; Boutitie et al. 2002; Kuzuya et al. 2008; Okumiya et al. 1999; Protogerou et al. 2007; van Uffelen et al. 2010). This indicates that a quadratic function can capture dependence of the risk on deviations of trajectories of a physiological variable Yt from its “optimal” values (Arbeev et al. 2009; Arbeev et al. 2011; Yashin et al. 2010; Yashin et al. 2007; Yashin et al. 2008; Yashin et al. 2009). Such function has been used to describe mortality rate conditional on Yt and G:
| (2) |
Here μ0(t,G) is the baseline hazard, f0(t,G) are “optimal” trajectories (“physiological norms”). We used the gamma-Gompertz (logistic) baseline hazards where (Vaupel et al. 1998).
The coefficient μ1(t,G) characterizes stress resistance. Its increase with age corresponds to the decline in stress resistance because it narrows U-shape of the risk, i.e., making an organism more vulnerable to deviations from the “optimal” values, which can be considered as a manifestation of the senescence process (Robb et al. 2009; Semenchenko et al. 2004). In our analyses, μ1(t,G) was approximated by a linear function of age: .
The average age trajectories of respective physiological variables in long-lived (life span ≥ 90 for females, ≥ 85 for males) carriers and non-carriers of the APOE e4 allele were considered as “optimal” trajectories f0(t,G) in the model.
The model specification allows for testing the hypotheses on the differences in aging-related characteristics, e.g., adaptive capacity and mean allostatic trajectories, between carriers and non-carriers of the e4 allele, on the decline in adaptive capacity with age, etc., using the likelihood ratio test. The likelihood optimization and the statistical tests have been performed using the optimization and statistical toolboxes in MATLAB.
The equations (1) and (2) are simplified versions of a more general model in which coefficients depend not only on genetic factor G but also on other factors measured in the study. For example, let us assume that the data on exercises are available for each study participant, and one wants to estimate effects of exercise on age trajectories of physiological indices and mortality risk. In this case in addition to genetic factor G the coefficients in equations (1) and (2) should include dependence on exercise variable Z. In the simplest case this is a “0–1” variable, where “0” mean no exercises and “1” means that person does exercises. The exercises status has a potential to change the dynamics of physiological state through equation (1) with Z-dependent coefficients, say f1(t,G, Z) and a(t,G, Z). It may also influence mortality risk in equation (2) through Z-dependent coefficients f0(t,G, Z) and Q(t,G, Z) of this equation, as well as through changes in physiological state, Yt. If the sample size of the data is large enough than stratification of study participants on sub-groups with Z=0, and Z=1 and estimating model parameters for each sub-group will provide information on the effect of exercises on coefficients of these equations and age trajectories of people who do and do not do exercises.
The model can be used for clarifying the mechanisms of alternative modes of genes action discussed in section 3.1. Indeed, the quadratic hazard (2) can be used to describe risk of disease (e.g., CVD) onset, or mortality by cause. The observed risk μ̄(t,G) = E(μ(t,Yt,G) | G,T > t), (here T is age at disease onset) can be evaluated from the analyses of longitudinal data (Arbeev et al. 2009). The age trajectories of disease risks μ̄ (t,G) specified for carriers and non-carriers of different genetic alleles may intersect at some age point, or coincide after some point. Such intersection indicates that the property of allele to be disadvantageous may take place only at some age interval. It can become advantageous or neutral at the other interval. These properties can also be represented in age patterns of corresponding probabilities of staying free of selected disease (or survival functions) evaluated for carriers and non-carriers of corresponding genotypes.
3.6.2. Results of genetic analyses using GenSPM
Table 5 shows estimates of parameters of the baseline hazard (μ0(t,G)), the multiplier in the quadratic part of the hazard (μ1 (t,G)), the adaptive capacity a (t,G), the mean allostatic trajectory (f1(t,G)) and other parameters of the GenSPM applied to the data on mortality and longitudinal measurements of CH and DBP from the original FHS cohort. The table also shows the results of testing null hypotheses about coincidence of various components of the model, such as adaptive capacity and mean allostatic trajectory, in carriers and non-carriers of the APOE e4 allele and other hypotheses on dynamic characteristics of the components of the model in the genetic groups (see note after the table). We use APOE e4 allele here because its biological properties were largely discussed in the literature and statistical modeling adds new information about effects of this allele on age trajectories of hidden biomarkers of aging. Figures 7 and 8 show estimated components of the model such as the logarithm of the baseline hazard, the multiplier in the quadratic part of the hazard, the adaptive capacity coefficient and the mean allostatic trajectory for carriers and non-carriers of the APOE e4 allele evaluated from data on CH and DBP for males and females combined.
Table 5.
Estimates of parameters of the genetic stochastic process model
| Variable | Allele | Baseline hazard (μ0(t,G)) | Multiplier in quadr. part of hazard (μ1(t, G)) | Adaptive capacity (a(t,G)) | Mean allostatic trajectory (f1(t,G)) | Other parameters | |||||||||||||||||
|---|---|---|---|---|---|---|---|---|---|---|---|---|---|---|---|---|---|---|---|---|---|---|---|
|
| |||||||||||||||||||||||
| ln |
|
|
|
|
|
|
|
|
|
|
|
p1 | |||||||||||
| CH | e4 | −5.05# | 0.042 | 0.01 | −0.0079 | 0.0021 | −0.165† | 1.993† | 258.77† | 1.016 | −0.0556 | 51.11 | 24.18 | 0.302 | |||||||||
| no e4 | −5.65 | 0.052 | 0.00 | −0.0105 | 0.0026 | −0.072 | 1.161 | 223.51 | 1.141 | −0.0492 | 38.34 | 14.11 | |||||||||||
| DBP | e4 | −5.41† | 0.067 | 0.00 | −0.1297# | 0.0371 | −0.153 | 0.000 | 94.85† | −0.073 | −0.0107 | 13.92 | 6.97 | 0.300 | |||||||||
| no e4 | −6.32 | 0.082 | 0.00 | −0.1783† | 0.0018 | −0.150 | 0.000 | 80.52 | 0.199 | 0.0115 | 9.16 | 5.07 | |||||||||||
Note: The table shows the estimates of parameters of the genetic stochastic process model applied to data on mortality and longitudinal measurements of total cholesterol and diastolic blood pressure in female and male carriers (e4) and non-carriers (no e4) of the APOE e4 allele.
The estimates of some parameters are rescaled for better visibility in the table: are multiplied by 104; are multiplied by 105; are multiplied by 103.
- Column “ ln ”: baseline hazard rates coincide in carriers and non-carriers of the e4 allele, i.e., μ0(t,noe4) = μ0(t,e4) (respective symbols are shown in rows no e4)
- Column “ ”: zero quadratic part of the hazard (separately for carriers and non-carriers), i.e., μ1 (t,noe4) =0 for rows no e4, μ1 (t,e4) =0 for rows e4
- Column “ ”: age-independent U-shapes of the hazard (separately for carriers and non-carriers), i.e., for rows no e4, for rows e4
- Column “ ”: adaptive capacities coincide in carriers and non-carriers, i.e., a (t, no e4) = a (t,e4) (respective symbols are shown in rows no e4)
- Column “ ”: no aging-related decline in the adaptive capacity (separately for carriers and non-carriers), for rows no e4, for rows e4
- Column “ ”: “mean allostatic trajectories” coincide in carriers and non-carriers, i.e., f1 (t,noe4) = f1 (t,e4) (respective symbols are shown in rows no e4)
The symbols in these columns denote:
: p < 0.0001;
: 0.0001 ≤ p <0.001;
: 0.001 ≤ p <0.01;
: 0.01 ≤ p <0.05, for respective null hypotheses. The absence of symbols after the numbers in these columns means that respective p-values exceed 0.05. Note that all other columns in the table, except the columns mentioned above, are not used to represent information on testing any null hypotheses and therefore they do not contain any symbols.
Source: Framingham Heart Study (a limited access dataset), original cohort.
Figure 7. Application of genetic stochastic process model to total cholesterol.

Note: The figure shows estimates of the logarithm of the baseline hazard (ln μ0(t,G), top left panel), the multiplier in the quadratic part of the hazard (μ1 (t,G), top right panel), the adaptive capacity (the absolute value of the feedback coefficient, | a (t,G) |, bottom left panel) and the mean allostatic trajectory (f1 (t,G), bottom right panel) for carriers (e4) and non-carriers (no e4) of the APOE e4 allele.
Source: Framingham Heart Study (a limited access dataset), original cohort
Figure 8. Application of genetic stochastic process model to diastolic blood pressure.

Note: The figure shows estimates of the logarithm of the baseline hazard (ln μ0 (t,G), top left panel), the multiplier in the quadratic part of the hazard (μ1 (t,G), top right panel), the adaptive capacity (the absolute value of the feedback coefficient, | a (t,G) |, bottom left panel) and the mean allostatic trajectory (f1 (t,G), bottom right panel) for carriers (e4) and non-carriers (no e4) of the APOE e4 allele.
Source: Framingham Heart Study (a limited access dataset), original cohort
One can see from table 5 that the null hypotheses on the equality of baseline hazard rates in carriers and non-carriers of the e4 allele (column ln ) are rejected for both physiological variables. Figures 7 and 8, top left panels, illustrate the patterns of the logarithm of baseline hazard rates estimated for both physiological variables and both sexes. They show that non-carriers of the e4 allele have lower baseline rates at younger ages, i.e., smaller ln but they increase faster, i.e., they have larger , than the rates for carriers of the e4 allele, resulting in the intersection of the rates at the oldest ages (around 100 years). This observation is in line with the findings in the literature that the effect of the e4 allele on survival diminishes with age (Ewbank 2002) and that there is a lack of association of APOE alleles with survival of centenarians (Louhija et al. 2001). The table also shows that all parameters differ among carriers and non-carriers of the e4; however, some differences are not statistically significant.
The null hypotheses on the zero quadratic part of the hazard (column in table 5 are rejected in all cases for DBP but not for CH. This suggests that deviations of DBP from the “optimal” trajectories results in a more substantial increase in the risk of death than in the case of CH. Figure 7, top right panel, shows the tendency of increasing in μ1 (t,G) for CH; however, this increase is not statistically significant. Figure 8, top right panel, shows faster increases in μ1 (t,G) for e4 carriers in the case of DBP.
This corresponds to the narrowing of the U-shape of corresponding mortality risk (as a function of DBP) with age. Hence the “price” for the same magnitude of deviation from “optimal” values of DBP (in terms of an absolute increase in the mortality risk compared to the baseline level at that age) becomes higher for carriers than for non-carriers at older ages. This can be considered as a manifestation of the decline in resistance to stresses with age (Arbeev et al. 2011; Yashin et al. 2007) which is an important characteristic of the aging process (Robb et al. 2009; Semenchenko et al. 2004), contributing to the development of aging-related diseases and death. Note that e4 non-carriers have a narrower U-shape for ages up to 85. It is important to note that our approach allows for indirect evaluation of this characteristic for carriers and non-carriers of the e4 allele in the absence of specific information on external disturbances (stresses) affecting individuals during their life course (such data are not available in the FHS).
The analyses also revealed different age dynamics of the adaptive capacity in carriers and non-carriers of the e4 allele for different physiological variables. The null hypotheses on the equality of the adaptive capacity in carriers and non-carriers (column in table 5) are rejected in case of CH. Figures 7 and 8, bottom left panels, show that carriers of the e4 allele have better adaptive capacities than non-carriers of this allele. The age dynamics of the adaptive capacity are different for CH and DBP. These observations indicate that the mechanisms underlying the decline in the adaptive capacity in carriers and non-carriers of e4 may not work universally for all physiological variables. The decline in adaptive capacity is an important feature of aging (Hall et al. 2000; Lund et al. 2002; Rankin and Kushner 2009; Troncale 1996) that may contribute to development of aging-related diseases and death. However, direct measurements of the adaptive capacity are typically lacking in available longitudinal studies of aging, health and longevity. The use of the feedback coefficient in the equation for the age dynamics of a physiological variable in our model allows us to indirectly evaluate this from the data because the absolute value of this feedback coefficient characterizes the adaptive capacity (Arbeev et al. 2009; Arbeev et al. 2011; Yashin et al. 2007; Yashin et al. 2012).
The null hypothesis on the equality of the mean allostatic trajectories in carriers and non-carriers (column in table 5) are rejected for both CH and DBP. This indicates that the processes regulating the age dynamics of physiological variables in carriers and non-carriers of the e4 allele force their age trajectories to follow different curves (which also do not coincide with the “optimal” trajectories). Figures 7 and 8, bottom right panels, show that age trajectories of both CH and DBP in e4 carriers are forced to larger values compared to non-carriers of the allele, although the difference between carriers and non-carriers diminishes at the oldest ages. Similar analyses could be performed using data on carriers and non-carriers of each of 24 genetic variants described in section 3.4, or on carriers and non-carriers of combinations of these variants. The results of such analyses will not be shown here.
The properties of the APOE alleles and their influence on aging and health related traits are discussed widely. The properties of newly detected 24 genetic variants and related genes are much less known. In the next section we will summarize available information about these genes and discuss their possible roles in regulation of aging and longevity traits.
3.7. Genes linked with detected genetic variants: Essential findings about 24 SNPs
The detected genetic variants are linked with genes whose expressions are crucial for maintaining organism’s functioning. Detected variants individually and jointly are associated with survival. The “genetic dose” index has a strong and significant effect on lifespan in the presence and in the absence of observed covariates. As any other genetic variant detected in the GWAS, our variants do not necessarily have negative effects on lifespan in any individual. Difference in personal genetic background or in the exposure to external conditions may influence the effect sign and size. These differences also explain why changes in the sample call rates result in different sets of selected genetic variants. High levels of the sample call rates reduce the number of individuals eligible for GWAS. In the case of relatively small frequencies of corresponding SNP alleles the estimated association becomes sensitive to the balance between positive and negative effects of the variant in the population of study participants.
Typical requirement in GWAS studies is that the findings has to be confirmed by other GWA studies. However, the genetic associations with longevity traits depend to a great extent on the environment, which activates some genes and suppresses others. So the populations exposed to different environments are likely to show involvement of different genetic variants in lifespan (Yashin et al. 2012). The chances that detected associations are random are likely to be small: all effects are genome-wide significant, all are negative, and show associations with lifespan for males and females in separate analyses.
The negative contribution of genetic factors to lifespan at late ages is in line with predictions of the two evolutionary theories of aging: mutation accumulation (MA) and antagonistic pleiotropy (AP). Some findings including evolutionary conserved genes and genetic pathways involved in regulation of aging are difficult to explain using MA hypothesis of aging. Such conservation would be hard to make if mutations would happen randomly and are kept in the genomes during evolutionary time in various species (Mitteldorf 2012). However, living organisms might develop universal non-specific mechanisms coping with aging to guarantee reproduction in the presence of various unpredictable genetic disturbances. Then this machinery is used to cope for post reproductive survival to compensate consequences of bad mutations with late manifestation. More studies are needed to clarify this problem.
To understand biological relevance of the 24 “vulnerability” SNPs to aging and common diseases we applied annotation programs to these SNPs and reviewed current evidence about their possible biological effects and functions of closest genes or genes linked to these SNPs using established online resources and tools for functional annotation and biological interpretation of genetic polymorphisms such as NCBI Entrez Gene and dbSNP bases, OMIM, GO, Ensembl, GeneCards, GeneTrail, Panther, as well as relevant recent publications. Results are summarized in Table 6.
Table 6.
Characteristics of 24 SNPs
| SNP name | Chr | In/Out gene | Closest gene | Gene/protein function | Associated biological processes and health disorders |
|---|---|---|---|---|---|
| rs3738682 | 1q42 | intronic | ARF-1 - ADP-ribosylation factor 1 | a small GTP-binding protein having a central role in intra-Golgi vesicular protein transport. Modulates vesicle budding and uncoating. N.B. The hydrolysis of ARF1-bound GTP is mediated by ARFGAPs. Also: member of the RAS superfamily; the downstream target of PI3K (Nishida et al. 2011). | Golgi vesicles; cell proliferation; cancer. ARF-1 is highly expressed and activated in several breast cancer cell lines and was associated with migration and invasiveness (Boulay et al. 2011) |
| rs356430 | 5q31.2 | probably LincRNA | CTB-35F21.1 (LincRNA) | CTB-35FF21.1 region may contain LincRNA. | LincRNA work in complexes with proteins and perform regulatory functions such as inhibiting transcription and translation (Yoon et al. 2013) |
| rs17067605 | 5q34 | intergenic | |||
| rs2353447 | 8q11.1 | intergenic | RP11-783P22.2 | ||
| rs4565533 | 9q34.3 | intergenic | near RXRA | N.B. no LD (r2>0.5) found between rs4565533 and SNPs in RXRA (retinoid X receptor, alpha). | |
| rs7894051 | 10q26.2 | intronic | ECHS1 - enoyl CoA hydratase, short chain, 1, mitochondrial | ECHS1 catalyzes the hydration of 2-trans-enoyl-coenzyme A (CoA). | Mitochondrial oxidation; has been implicated in cancer (metastatic melanoma) (Lake et al. 2011); downregulation potentiates apoptosis (Liu et al. 2010) |
| rs1440483 | 11q25 | intronic | B3GAT1 - beta-1,3-glucuronyltransferase 1 | B3GAT1 is involved in biosynthesis of the carbohydrate epitope HNK-1 (human natural killer-1, also known as CD57), which is present on a number of neural cell adhesion molecules (Jeffries et al. 2003) See also KLRD1 below |
associated with schizophrenia (Kahler et al. 2011); CD57 expression was linked to HCMV, and better survival from cancer (Hendricks et al. 2014; Nielsen et al. 2013). |
| rs1794108 | 11p15.5 | exon - nonsyn coding | PSMD13 - proteasome 26S subunit, non-ATPase, 13 | PSMD13 acts as a regulatory subunit of the 26S proteasome involved in the ATP-dependent degradation of ubiquitinated proteins. There is high LD between PSMD13-SIRT3. Sirtuins (SIRT1-7) play a central role in epigenetic gene silencing, DNA repair, cell-cycle, microtubule organization, and aging (Giblin et al. 2014). | Aging, longevity, cancer. PSMD13-SIRT3 haplotype pools were significantly different between centenarians and younger people (Bellizzi et al. 2007); SIRT3 has a role as a tumor promoter or tumor suppressor, depending on context (Alhazzazi et al. 2011) |
| rs5743998 | 11p15.5 | intronic | TOLLIP - toll interacting protein | TOLLIP regulates inflammatory signaling and is involved in interleukin-1 receptor trafficking and in the turnover of IL1R-associated kinase. Inhibits cell activation by microbial products. Inhibits IRAK1 phosphorylation and kinase activity | Downregulated in the aging brain (Cribbs et al. 2012); and in gastric cancers, in response to H.Pilori infection (Pimentel-Nunes et al. 2013) |
| rs9971555 | 11p13 | intronic | ABTB2 - ankyrin repeat and BTB (POZ) domain containing 2 | ||
| rs10845099 | 12p13 | intergen (linked to KLRD1 gene) | linked to KLRD1 - killer cell lectin-like receptor subfamily D, member 1 | Located between GABARAPL1 (GABA(A) receptor-associated protein like 1) and KLRD1. KLRD1 (CD94) is expressed on NK cells and plays role in recognition of HLA molecules by NK cells. | KLRD1 may be involved in immune response to viruses (Fang et al. 2011). N.B. CD94 and CD57 are both NK receptors and may both be involved in response to HCMV infection (Hendricks et al. 2014). |
| rs1399453 | 12q23.1 | intronic | ANO4 - anoctamin 4 | member of a family of Ca2+-activated Cl-channels (Tian et al. 2012) | Other members of anoctamin family are thought to play role in cancer and apoptosis (Wanitchakool et al. 2014) |
| rs4904670 | 14q32.11 | intronic | NRDE2 (C14orf102) - necessary for RNA interference, domain containing | NRDE2 is linked to near gene - PSMC1 - proteasome (prosome, macropain) 26S subunit, ATPase, 1. The latter may potentially interact with PSMD13 (host gene for above rs1794108) | N.B. one of our earlier identified 39 pro-survival SNPs (rs2282032) is in another intron of the same gene (Yashin et al. 2010) |
| rs9925881 | 16p12.2 | intergenic | between TRNAL7 and EEF2K | N.B. No proxy SNPs (by LD) were found by SNAP near (+-500K distance) of this SNP. Closest gene is EEF2K - a highly conserved protein kinase that links cell surface receptors to cell division. | The activity of EEF2K is increased in many cancers |
| rs9928967 | 16p13.3 | Exon-nonsyn coding | CORO7 - coronin 7; a.k.a. CORO7-PAM16 readthrough | CORO7 plays a role in Golgi complex morphology and function. PAM16 is suspected to be involved in increased rates of anaerobic metabolism, resistance to apoptosis and altered growth-factor sensitivity. | Golgi; characteristic of cancer cells; apoptosis |
| rs5491 | 19p13.3 | Exon-nonsyn coding | ICAM1 - intercellular adhesion molecule 1; a.k.a. CD54 | A cell surface glycoprotein which is typically expressed on endothelial cells and cells of the immune system. Mediates intracellular adhesion. | Adhesion; In case of rhinovirus infection acts as a cellular receptor for the virus. Pleiotropic gene implicated in multiple health disorders: CVD, Inflamm, AD, PD, Schizophrenia, RA. |
| rs2586484 | 17q21.33 | intergen (linked to several genes) | near COL1A1; in LD with FAM117A, CACNA1G | The SNP is in perfect LD with 7 surrounding SNPs located in or near a synteny block of genes with evolutionary conserved order, especially in FAM117A and CACNA1G. | |
| rs8081943 | 17p11.2 | intronic | RAI1 - retinoic acid induced 1 | located within the Smith-Magenis syndrome region. May function as a transcriptional regulator. Regulates transcription through chromatin remodeling. | May be important for embryonic and postnatal development. May be involved in neuronal differentiation (By similarity), neurological disorders. Pleiotropic effect : associated with both the severity of the phenotype and the response to medication in schizophrenic patients; and with Parkinson Disease |
| rs9896996 | 17p13.3 | intergen (linked to SMG6) | between MIR212 and MIR132. In LD with SMG6 (smg-6 homolog, nonsense mediated mRNA decay factor) | In LD with rs62067977 (r2= 0.62; D’= 0.79), which is intronic SNP of SMG6 gene. Its protein is part of the telomerase complex and binds single-stranded DNA at the telomeres. SMG6 also participates in mRNA decay. | |
| rs11536959 | 20q11.23 | intronic | LBP - lipopolysaccharide binding protein | Binds to the lipid A moiety of bacterial lipopolysaccharides (LPS), a glycolipid present in the outer membrane of all Gram-negative bacteria. The LBP/LPS complex seems to interact with the CD14 receptor. | Involved in the acute-phase immunologic response to gram-negative bacterial infections. levels of LBP were increased 24 h after hip fracture surgery |
| rs6090342 | 20q13.33 | intronic | ARFGAP1 - ADP-ribosylation factor GTPase activating protein 1 | Promotes GTP hydrolysis on the small G protein Arf-1 on Golgi membranes. Involved in membrane trafficking and /or vesicle transport. | Overexpression induces the redistribution of the entire Golgi complex to the endoplasmic reticulum. Role in cell adhesion, migration and cancer invasion (Sabe et al. 2006) |
| rs2838566 | 21q22.3 | intergen | between LRRC3 - and TSPEAR | N.B. No proxy snps (in LD with rs2838566) were found within +-500K distance. | |
| rs6007952 | 22q13.3 | intronic | GRAMD4 - GRAM domain containing 4 | Mitochondrial effector of E2F1 (MIM 189971)-induced apoptosis. Plays a role as a mediator of E2F1-induced apoptosis in the absence of TP53/p53. | apoptosis |
| rs8135777 | 22q13.3 | intronic | SHANK3 - SH3 and multiple ankyrin repeat domains 3 | Shank3 is a large scaffold postsynaptic density protein implicated in dendritic spinematuration and synapse formation, regulates the structural organization of neurotransmitter receptors in post-synaptic dendritic spines making it a key element in chemical binding crucial to nerve cell communication. | SHANK3 is crucial in receptor tyrosine kinase signaling and mediates sustained Erk-MAPK and PI3K signaling. Information processing; associated with the autism; haploinsufficiency |
Note: The table shows the essential characteristics of 24 SNPs and their closest genes associated with lower survival at older ages (80+).
Source: When non-referenced, the information about gene name and molecular function has been taken from established online sources, including NCBI (Entrez Gene, dbSNP, etc.), GO, Ensembl, GeneCards, OMIM, GeneTrail, PANTHER and most recent literature.
The review of current knowledge indicates that the majority of genes related to 24 “vulnerability” SNPs could be involved in cell adhesion, apoptosis, viral infections (e.g., human cytomegalovirus HCMV), cancer, and age-associated brain disorders. In our earlier study we found 27 pro-survival alleles (Yashin et al. 2012) of SNPs whose closest genes were predominantly involved in similar disorders and cell responses, though genes differed from those closest to 24 SNPs in this study.
We also found that, from the list of 19 genes linked to the 24 SNPs, at least three -- ARF1, ARFGAP1, CORO7 -- were involved in Golgi vesicular transport and membrane. The Golgi apparatus is a membranous structure in cell that processes and packs proteins made by the endoplasmic reticulum, before sending them out to their destination (in particular for secretion) using the secretory vesicle. In the process of functioning, cells synthesize a large number of different macromolecules. The Golgi apparatus plays an important role in preparing these macromolecules for cell secretion or use within the cell. It modifies proteins delivered from the endoplasmic reticulum and is also involved in the lipids’ transport around the cell, and the creation of lysosomes.
From the genes linked to our 24 SNPs and involved in the Golgi processing, two (ARFGAP1 and ARF1) are biologically closely interacting: The ARFGAP1 promotes hydrolysis of ARF1-bound GTP, which is required for the fusion of protein vesicles with Golgi compartments. The fact that our analysis identified SNPs in functionally closely connected genes, which are located on different chromosomes, is in support of the real association between cellular processes regulating the protein traffic in the Golgi apparatus and survival at oldest old ages.
There is a limited number of studies that suggest potential mechanisms of this intriguing connection. Cho and colleagues reported that the structure of the Golgi complex is significantly altered in senescent cells, and this can disturb normal protein secretion by such cells (Cho et al. 2011). The disturbed secretion may in turn partly explain often excessive and unbalanced release of pro-inflammatory factors by the senescent cells (Campisi et al. 2011), which in turn may potentially contribute to both physiological aging associated changes and pathology. The Golgi network was also linked to mTOR signaling; and aberrant Golgi trafficking was implicated in metastatic cancers (particularly in prostate cancer and melanoma) (Abraham 2009; Millarte and Farhan 2012; Sanchez-Laorden et al. 2009).
For additional information, we also tested our list of genes for over- or under-representation of Gene Ontology (GO) terms related to particular biological processes, using GeneTrail online software for Gene Set Enrichment/Overrepresentation analysis (Backes et al. 2007). We compared our list of genes (corresponding to 19 of 24 SNPs that were located in genes, or linked to genes) with the reference set of about 14.5K genes related to ~156K SNPs located within genes, and belonging to Affymetrix 500K SNP array (~437K after quality control). The GeneTrail detected overrepresentation of genes related to the Golgi apparatus and membrane (4 observed vs. 0.6 expected) in our list, with p-value 0.03. There was also specific overrepresentation of genes involved in the Golgi transport vesicle coating: 2 observed genes (ARFGAP1 and ARF1) vs. 0.013 expected, with p-value 0.007. The false positive detection rate method was used for the multiple testing adjustment in this software. This analysis strongly supports results of our review of gene functions emphasizing the role of the Golgi apparatus in normal cell functioning and organism’s chances to survive the oldest old age.
SNP rs4904670 is located in intron of NRDE2 (a.k.a. C14orf102). One of the earlier found 39 pro-survival SNPs, rs2282032 (Yashin et al. 2010), is located in another intron of the same NRDE2 gene. NRDE2 codes “NRDE-2, necessary for RNA interference, domain containing protein” and is poorly studied so far. Some SNPs of this gene, including the earlier found rs2282032 are, however, in LD with neighbor gene - PSMC1 - proteasome 26S subunit, ATPase, 1, which may potentially interact with PSMD13 gene coding another proteasome 26 subunit (Ewing et al. 2007). And the PSMD13 is host gene for rs1794108, another SNP of the identified 24 SNPs. That is, two of the 24 newly identified SNPs (rs4904670 and rs1794108) and one of 39 SNPs from an earlier study (Yashin et al. 2010) relate to two potentially interacting proteasome subunits.
The rs1794108 is located in exon of PSMD13 gene coding proteasome 26 subunit, and is respectively involved in protein degradation by the proteasome. PSMD13 is also in strong LD with neighbor SIRT3 gene, of the Silent information regulator 2 (Sir2) family of histone deacetylases (sirtuin HDACs). Sirtuins (SIRT1-7) are mammalian homologues of the Sir2 gene in yeast and play a central role in epigenetic gene silencing, DNA repair and recombination, cell-cycle, microtubule organization, and in the regulation of aging (Mahlknecht and Voelter-Mahlknecht 2011). SIRT3 also has a role as a tumor promoter or tumor suppressor, depending on context (Alhazzazi et al. 2011). There are significantly different PSMD13-SIRT3 haplotype pools between centenarians and younger people (Bellizzi et al. 2007). Close relation of the identified SNP to the candidate aging/longevity genes supports its true association with life span.
For majority of evaluated SNPs, the minor allele displays a kind of trade-off effect on female (but not male) survival. That is, it is associated with worsened survival at oldest old ages, but with better survival at younger ages.
Overall, after the age 80, the minor (“frailty”) alleles may: (i) increase cancer risk in females, but be protective against cancer in males; (ii) increase the risk of AD in females (for most SNPs: 17 of 24), and in males (for 7 of 24 SNPs); but be protective against AD in males (for about 50% of SNPs); (iii) increase risk of CHD in males (for most SNPs), and in females (for more than half of SNPs: 15 of 24).
There are no centenarians among those carrying more than two “frailty” alleles, while almost 5% among those carrying two and fewer of such alleles. This indicates that a major condition of achieving extreme longevity could be absence of detrimental alleles. It may even be more important than presence of alleles providing particular benefits to its carriers.
The negative effect of minor (“vulnerability”) alleles on survival after age 80 years may in part be explained by higher risks of CHD, which may contribute to mortality after age 80 years more substantially than cancer. Earlier decline in BMI among carriers of 2 and more of these alleles indicates possibility of accelerated aging/decline in stress resistance. Indirect indication: earlier decline in BMI in carriers of 2+ alleles.
4. Discussion
Better understanding of genetic mechanisms linking individual aging related changes, declining health status, and increasing mortality risk became a matter of high practical importance in gerontology and geriatrics. One reason for this is the need for improving health of the elderly in rapidly aging populations of developed part of the world. The idea of improving population health and longevity by properly affecting individual aging related processes stimulated studies of factors and mechanisms that link individual aging with observed variations in health span and lifespan (Butler et al. 2008; Butler et al. 2004; Goldman et al. 2013). A substantial part of these research addressed questions about the roles of genes in aging related changes and life span. Initially these studies dealt with analyzing association of candidate genes with aging and longevity traits (De Benedictis et al. 2001; Finch and Tanzi 1997). Advances in genotyping technology provided researchers with a large amount of data on the genetic backgrounds of a large number of individuals for whom phenotypic longitudinal data were collected. This information stimulated numerous genome-wide association studies of complex traits with a hope of clarifying genetic mechanisms involved in their regulation. However, the expectations that the use of genome wide association studies will rapidly explain connections between genetic factors and the traits of interest have not been met. The results of many studies were controversial. The sets of genetic variants associated with aging and longevity traits depended on population under study. Most estimated associations of genetic variants with aging and longevity traits have not reached genome wide levels of statistical significance.
For many complex traits the genetic variants detected in GWAS of these traits explain only a small portion of genetic variability in these traits, indicating that many more influential genetic factors and regulatory mechanisms still have to be discovered (Eichler et al. 2010; Makowsky et al. 2011; Manolio et al. 2009; Marian 2012; Zuk et al. 2012). The use of GWAS involves testing associations for large numbers of genetic variants. To reduce the numbers of false positive findings, such studies use correction for multiple testing (Gao et al. 2010; Li et al. 2012; Nyholt 2004). As a result, the statistical conclusions from data analyses become very conservative because many genetic variants that showed associations with such traits at the nominal level of statistical significance have not reached a genome-wide level of significance. The research findings were difficult to explain from the evolutionary theories point of view. This situation indicates the need for developing new concepts and better methods for analyzing genetic data on such traits.
The results of genetic analyses of aging- and longevity-related traits produced additional challenges for the researchers. Most genetic variants detected in earlier candidate genes studies of such traits failed to be replicated in association studies of the same traits in independent populations (Barzilai et al. 2012; Broer et al. 2015; Lunetta et al. 2007; Nebel et al. 2011; Newman et al. 2010; Walter et al. 2011). The results of GWAS of human aging and life span demonstrated sensitivity to the type of statistical model used in the allele (genotype) selection procedure (Yashin et al. 2012). This indicates that conclusions from such analyses have to be used with care, and that mechanisms of genetic influence on aging and life span require more accurate descriptions. In this paper we showed that the results of analyses are also sensitive to the set of rules used in the QC procedures, which specify sets of genetic factors and fix the sample of study subjects appropriate for genetic analyses. The fact that different researchers performing such procedures often use different sets of rules casts doubts on the legitimacy of comparison of the results of different studies, as well as on the results of meta-analyses of the research findings in which different QC procedures have been used. Another problem in genetic studies of aging and longevity is that dealing with linkage disequilibrium (LD) and Hardy-Weinberg equilibrium (HWE) in these studies follows standards used in the analyses of other complex traits. However, this strategy is likely to be erroneous in studying aging and longevity related traits because it ignores the fact that mortality selection process in a genetically heterogeneous population affects both LD and HWE parameters when population cohorts are getting older.
In our recent analysis (Yashin et al. 2012) we showed that sets of genetic variants selected in GWAS of human longevity depend on a statistical model describing the connection between longevity traits and genetic variants. To reduce the effect of the model on the selection results, we performed GWAS of life span using six such models and identified an overlapping set of 27 SNPs showing an effect on life span across all six procedures. We found that the “longevity SNPs” were located in/near genes largely involved in cell proliferation and apoptosis/senescence pathways. We investigated the polygenic influence on life span and its possible biological mechanisms. We estimated joint effects of pro-longevity SNP alleles in the FHS 550K SNPs data on human survival. We found that 27 alleles each positively associated with life span show significant additive influence on life span. The majority of these SNPs (74%) were within genes, compared to 40% of SNPs in the original 550K set. The review of current literature showed that the respective genes are largely involved in aging, cancer, and brain disorders. An important finding was that pro-longevity genes identified in this study had functional relevance to aging and aging associated diseases, which supports causal relationship between these genes and life span. The fact that genes found in our and other genetic association studies of aging/longevity have similar functions indicates high chances of true positive associations for corresponding genetic variants (Yashin et al. 2012).
In this paper we also addressed issues about possible causes of low efficiency of genetic association studies of human aging and longevity traits. The results of performed analyses demonstrated that genetic variants may have pleiotropic associations with such traits. Some genes may positively influence survival at a given age intervals. The effects of these genes may become neutral, or change their influence to the opposite at other age intervals. The genetic effects are also likely to be modulated by other genes, as well as environmental factors and living conditions. In addition, aging and longevity traits can be genetically heterogeneous. This means that the same value of a trait can be reached under influence of different genes, or sets of such genes. As a result, the genome wide association studies, performed without taking these features into account, are likely to have weak genetic signals. This also explains why detected associations are difficult to replicate in studies of independent populations.
Our analyses showed that aging and longevity traits have an important feature that distinguishes them from other complex multifactorial traits subjected to genetic analyses. This feature is manifested in the process of mortality selection that takes place in genetically heterogeneous populations. The fact that genes affecting aging and life span are involved in these processes indicates that methods currently used in GWAS of other complex traits might be inappropriate for studying genetics of aging and longevity. At the same time this feature opens new opportunities for genetic analyses of these traits using biodemographic concepts and methods. We showed how these new approaches can substantially improve the quality of genetic analyses.
The genetic analyses of complex traits often deal with population of study participants that consists of sub-groups of individuals having different ancestry. The possibility of such situation, known as “population stratification”, has to be taken into account in genetic analyses of complex traits. It is important to note that additional source of population stratification is the process of mortality selection in heterogeneous populations. This is the process in which the “longevity” or “vulnerability” alleles or genotypes can modify genetic structure in the populations of the old and oldest-old compared to the younger groups of individuals. This property indicates that controlling for possible population stratification, e.g., due to the differences in ancestry (Ma and Amos 2010; Price et al. 2006; Yang et al. 2011), has to be done with care because it could substantially reduce association of genetic variants with aging and longevity traits.
Note that many participants of the Framingham Heart Study are related individuals whose life spans and other health and longevity related traits are dependent variables. In the pre-genomic era such dependences were taken into account using multivariate survival models (Yashin and Iachine 1999). The correlation among life spans of related individuals was described using the notions of hidden correlated (shared) frailties, i.e., unobserved non-negative random variables that mediate genetic influence on life span. The genetics of life span and other longevity related traits, including hidden frailty, was investigated by calculating narrow-sense heritability of these traits (Yashin et al. 1999). The heritability estimates provide researchers with information about proportion of phenotypic variance that can be explained by the additive genetic factors in the additive models of phenotypic traits. Today, when substantial part of information about genetic structure of study participants is not hidden but is available for analyses in the sets of hundreds of thousands and millions of genetic loci (e.g., SNPs), the heritability estimates indicate how successful the results of GWAS of corresponding traits are expected to be. The results of recent analyses of genetic data for a number of phenotypic traits detected a problem of “missing heritability”: The estimates of phenotypic variation induced by additive genetic factors calculated from available genetic data are lower than corresponding estimates of these characteristics obtained from genealogical or twins data (Clarke and Cooper 2010; Katsios and Roukos 2011; Makowsky et al. 2011; Manolio et al. 2009; Zuk et al. 2012). One should keep in mind, however, that heritability estimations are based on oversimplified models, so the results of such analyses for many important traits, analyzed today, have to be used with care. In many cases, the components of phenotypic variability of a trait explained by additive genetic variation can be calculated directly from the data. The dependence among family members influences the results of GWAS and has to be taken into account in the analyses of genetic data. This is done using specially developed software, e.g., using mixed effect models (Kang et al. 2010), or shared frailty models realized in R (e.g., package coxme).
An important advantage of using longitudinal data in genetic studies of aging is the opportunity to compare survival functions for carriers and non-carriers of selected genetic variants or groups of such variants. However, genes do not affect life span directly. Their effects on this trait are mediated by aging related changes in health status, physiological variables, and other biomarkers. One more advantage of using such data is an opportunity to show how genetic variants affecting life span influence average age trajectories of physiological variables for carriers and non-carriers of these variants.
Note that physiological variables represent observed components of biological mechanism involved in regulation and manifestation of the aging process. Some important components of this mechanism including variables describing resistance to specific stresses, adaptive capacities, age dependent physiological norm, effects of allostatic adaptation, and allostatic load are hidden and not measured in most longitudinal studies. The importance of these biomarkers for understanding the process of aging has been emphasized in a number of experimental studies using animal model systems. We showed how these biomarkers can be incorporated in the model of individual aging with observed and unobserved components, and how these components can be evaluated for individuals with different genetic backgrounds. The results of these analyses demonstrated benefits of using biodemographic principles and integrative statistical models of mortality risks in genetic studies of human aging and longevity. The application of the GenSPM revealed different patterns of regularities in aging-related characteristics (adaptive capacity, decline in stress resistance, mean allostatic trajectories and the baseline hazard rate) in carriers and non-carriers of the APOE e4 allele. Such aging-related characteristics cannot be calculated directly from the longitudinal data because of the lack of respective measurements.
The analyses confirmed that genetic influences on life span are realized through dynamic mechanisms regulating changes in physiological variables during the life course. The average aging-related changes in the eight selected physiological variables are likely to be driven by hidden components of aging changes and by genetic factors. The ability of advanced methods of statistical modeling to estimate hidden components of aging changes in humans indicates that the approach can be further extended to perform more comprehensive analyses of available data by incorporating relevant biological knowledge about aging into statistical models. The use of such models in statistical analyses of data will help researchers untangle complex age-dependent dynamic relationships among biomarkers and elucidate roles of genes and non-genetic factors in aging, health and life span.
The results of genome-wide association studies of complex traits, such as life span or age at onset of chronic diseases, suggest that such traits are typically affected by a large number of small-effect alleles. Individually such alleles have little predictive values therefore they were usually excluded from further analyses. An important finding of our study was that detected alleles may jointly influence life span so that the resulting influence can be both substantial and highly statistically significant. We show that this joint influence can be described by a relatively simple “genetic dose - phenotypic response” relationship. The estimated effect of polygenic score index on life span was substantial and highly statistically significant.
The results of our analyses indicate that genetic studies of human aging and longevity traits will benefit from adjusting conceptual models used in GWAS to the inherent complexity of these traits. The new models have to take the multifactorial nature, genetic heterogeneity, pleiotropic effects of genetic factors on these traits, as well as biodemographic aspects of the problem into account. The bio-demographic aspects related to the aging and longevity traits make them different from other complex traits. The process of mortality selection in genetically heterogeneous populations, in which some genes influence mortality risks, produces changes in genetic structure of this population with increasing age. Such changes cannot be safely ignored in genetic association studies of these traits. Our results also show that exceptional longevity could be not only because of the presence of “longevity” alleles but also because of the absence of large numbers of “vulnerability” alleles. The existence of such vulnerability variants is supportive to the mutation accumulation and antagonistic pleiotropy hypothesis of aging. According to the FHS-calculated frequencies the detected “vulnerability” alleles are common genetic variants. However, according to their frequencies in HapMap and in 1000 genome projects they are rare variants which could partly be related to possible genotyping errors in the FHS data. This indicates that chances of replicating these results using data on independent populations might be small. The use of longitudinal data in genetic association studies opens additional opportunities for studying genetics of human aging and longevity. Using these data one can evaluate age trajectories of survival functions for carriers and non-carriers of respective alleles (genotypes) or average age trajectories of physiological variables. Using advanced methods of statistical modeling one can reveal genetic influence on age trajectories of hidden biomarkers of aging that play fundamental roles in aging related changes but are not measured directly in longitudinal studies.
The analyses of functional properties of genes associated with detected 24 SNPs indicate that all of them are involved in regulation of important biological processes relevant to aging and longevity traits. Integrating this information with that obtained in the analyses of longitudinal data on age trajectories of physiological indices and other biomarkers will substantially clarify biological mechanisms of aging and longevity and generate new insights into personalized approaches to maintaining high health standards and longevity in population cohorts.
It is important to note that using advanced methods is extremely important for efficient analyses of available genetic data. However, the use efficient statistical methods does not protect researchers from getting false-positive findings, if the quality of genotyping is low. The polygenic score indices constructed from the set of false-positive genetic variants are likely to produce false positive joint effects if the effects of individual variants are caused by common confounders. This means that the quality of genotyping and the presence of possible confounders have to be carefully investigated. Since the quality of genotyping is getting better with advancing technology the genotyping errors are likely to be found in the data that were prepared for genetic analyses decades ago. This issue is particularly relevant for genetic data on members of the original FHS cohort used in our analyses. This means that biological interpretations of research findings described above have to be considered as preliminary. They have to be confirmed in the results of further genetic analyses of related traits in other datasets with better quality of genetic data. The issues of the quality of genotyping and methods of their testing were partly discussed in (Yashin et al. 2015).
Acknowledgments
The FHS project is conducted and supported by the National Heart, Lung and Blood Institute (NHLBI) in collaboration with Boston University (N01 HC25195). The FHS data used for the analyses were obtained through the database of Genotypes and Phenotypes (dbGaP). The authors acknowledge the investigators that contributed the phenotype and genotype data for this study. This manuscript was not prepared in collaboration with investigators of the FHS and does not necessarily reflect the opinions or views of the FHS, Boston University or the NHLBI. Funding for SHARe Affymetrix genotyping was provided by NHLBI Contract N02-HL-64278. SHARe Illumina genotyping was provided under an agreement between Illumina and Boston University. This work was supported by the National Institutes of Health/National Institute on Aging (NIH/NIA) grants R01AG030612, R01AG030198, R01AG032319, R01AG046860, P01AG043352, and P30AG034424. The content of this paper is solely the responsibility of the authors and does not necessarily represent the official views of the NIA or the NIH.
Footnotes
JEL Classification: J11, C13, C15, C18, C33, C34
Contributor Information
Anatoliy I. Yashin, Email: aiy@duke.edu.
Konstantin G. Arbeev, Email: ka29@duke.edu.
Deqing Wu, Email: Deqing.wu@duke.edu.
Liubov Arbeeva, Email: la39@duke.edu.
Alexander Kulminski, Email: kulminsk@duke.edu.
Irina Kulminskaya, Email: irina.kulminskaya@duke.edu.
Igor Akushevich, Email: igor.akushevich@duke.edu.
Svetlana V. Ukraintseva, Email: svo@duke.edu.
References
- Abraham RT. GOLPH3 links the Golgi network to mTOR signaling and human cancer. Pigment Cell Melanoma Res. 2009;22(4):378–379. doi: 10.1111/j.1755-148X.2009.00596.x. [DOI] [PubMed] [Google Scholar]
- Akushevich I, Veremeyeva G, Kravchenko J, Ukraintseva S, Arbeev K, Akleyev AV, Yashin AI. New stochastic carcinogenesis model with covariates: an approach involving intracellular barrier mechanisms. Mathematical Biosciences. 2012;236(1):16–30. doi: 10.1016/j.mbs.2011.12.002. [DOI] [PMC free article] [PubMed] [Google Scholar]
- Albin RL. Antagonistic pleiotropy, mutation accumulation, and human genetic disease. Genetica. 1993;91(1–3):279–286. doi: 10.1007/BF01436004. [DOI] [PubMed] [Google Scholar]
- Alhazzazi TY, Kamarajan P, Verdin E, Kapila YL. SIRT3 and cancer: Tumor promoter or suppressor? Biochimica Et Biophysica Acta-Reviews on Cancer. 2011;1816(1):80–88. doi: 10.1016/j.bbcan.2011.04.004. [DOI] [PMC free article] [PubMed] [Google Scholar]
- Allison DB, Faith MS, Heo M, Kotler DP. Hypothesis concerning the U-shaped relation between body mass index and mortality. American Journal of Epidemiology. 1997;146(4):339–349. doi: 10.1093/oxfordjournals.aje.a009275. [DOI] [PubMed] [Google Scholar]
- Arbeev KG, Akushevich I, Kulminski AM, Arbeeva LS, Akushevich L, Ukraintseva SV, Culminskaya IV, Yashin AI. Genetic model for longitudinal studies of aging, health, and longevity and its potential application to incomplete data. Journal of Theoretical Biology. 2009;258(1):103–111. doi: 10.1016/j.jtbi.2009.01.023. [DOI] [PMC free article] [PubMed] [Google Scholar]
- Arbeev KG, Ukraintseva SV, Akushevich I, Kulminski AM, Arbeeva LS, Akushevich L, Culminskaya IV, Yashin AI. Age trajectories of physiological indices in relation to healthy life course. Mechanisms of Ageing and Development. 2011;132(3):93–102. doi: 10.1016/j.mad.2011.01.001. [DOI] [PMC free article] [PubMed] [Google Scholar]
- Arbeev KG, Ukraintseva SV, Arbeeva LS, Akushevich I, Kulminski AM, Yashin AI. Evaluation of genotype-specific survival using joint analysis of genetic and non-genetic subsamples of longitudinal data. Biogerontology. 2011;12(2):157–166. doi: 10.1007/s10522-010-9316-1. [DOI] [PMC free article] [PubMed] [Google Scholar]
- Arbeev KG, Ukraintseva SV, Kulminski AM, Akushevich I, Arbeeva LS, Culminskaya IV, Wu D, Yashin AI. Effect of the APOE Polymorphism and Age Trajectories of Physiological Variables on Mortality: Application of Genetic Stochastic Process Model of Aging. Scientifica. 2012;2012 doi: 10.6064/2012/568628. Article ID 568628. [DOI] [PMC free article] [PubMed] [Google Scholar]
- Atzmon G, Rincon M, Schechter CB, Shuldiner AR, Lipton RB, Bergman A, Barzilai N. Lipoprotein genotype and conserved pathway for exceptional longevity in humans. PLoS Biol. 2006;4(4):e113. doi: 10.1371/journal.pbio.0040113. [DOI] [PMC free article] [PubMed] [Google Scholar]
- Backes C, Keller A, Kuentzer J, Kneissl B, Comtesse N, Elnakady YA, Muller R, Meese E, Lenhof HP. GeneTrail--advanced gene set enrichment analysis. Nucleic Acids Res. 2007;35(Web Server issue):W186–192. doi: 10.1093/nar/gkm323. [DOI] [PMC free article] [PubMed] [Google Scholar]
- Barzilai N, Guarente L, Kirkwood TB, Partridge L, Rando TA, Slagboom PE. The place of genetics in ageing research. Nat Rev Genet. 2012;13(8):589–594. doi: 10.1038/nrg3290. [DOI] [PubMed] [Google Scholar]
- Bellizzi D, Dato S, Cavalcante P, Covello G, Di Cianni F, Passarino G, Rose G, De Benedictis G. Characterization of a bidirectional promoter shared between two human genes related to aging: SIRT3 and PSMD13. Genomics. 2007;89(1):143–150. doi: 10.1016/j.ygeno.2006.09.004. [DOI] [PubMed] [Google Scholar]
- Boulay PL, Schlienger S, Lewis-Saravalli S, Vitale N, Ferbeyre G, Claing A. ARF1 controls proliferation of breast cancer cells by regulating the retinoblastoma protein. Oncogene. 2011;30(36):3846–3861. doi: 10.1038/onc.2011.100. [DOI] [PubMed] [Google Scholar]
- Boutitie F, Gueyffier F, Pocock S, Fagard R, Boissel JP. J-shaped relationship between blood pressure and mortality in hypertensive patients: New insights from a meta-analysis of individual-patient data. Annals of Internal Medicine. 2002;136(6):438–448. doi: 10.7326/0003-4819-136-6-200203190-00007. [DOI] [PubMed] [Google Scholar]
- Broer L, Buchman AS, Deelen J, Evans DS, Faul JD, Lunetta KL, Sebastiani P, Smith JA, Smith AV, Tanaka T, Yu L, Arnold AM, Aspelund T, Benjamin EJ, De Jager PL, Eirkisdottir G, Evans DA, Garcia ME, Hofman A, Kaplan RC, Kardia SL, Kiel DP, Oostra BA, Orwoll ES, Parimi N, Psaty BM, Rivadeneira F, Rotter JI, Seshadri S, Singleton A, Tiemeier H, Uitterlinden AG, Zhao W, Bandinelli S, Bennett DA, Ferrucci L, Gudnason V, Harris TB, Karasik D, Launer LJ, Perls TT, Slagboom PE, Tranah GJ, Weir DR, Newman AB, van Duijn CM, Murabito JM. GWAS of Longevity in CHARGE Consortium Confirms APOE and FOXO3 Candidacy. J Gerontol A Biol Sci Med Sci. 2015;70(1):110–118. doi: 10.1093/gerona/glu166. [DOI] [PMC free article] [PubMed] [Google Scholar]
- Burton PR, Clayton DG, Cardon LR, Craddock N, Deloukas P, Duncanson A, Kwiatkowski DP, McCarthy MI, Ouwehand WH, Samani NJ, Todd JA, Donnelly P, Barrett JC, Davison D, Easton D, Evans D, Leung HT, Marchini JL, Morris AP, Spencer CCA, Tobin MD, Attwood AP, Boorman JP, Cant B, Everson U, Hussey JM, Jolley JD, Knight AS, Koch K, Meech E, Nutland S, Prowse CV, Stevens HE, Taylor NC, Walters GR, Walker NM, Watkins NA, Winzer T, Jones RW, McArdle WL, Ring SM, Strachan DP, Pembrey M, Breen G, St Clair D, Caesar S, Gordon-Smith K, Jones L, Fraser C, Green EK, Grozeva D, Hamshere ML, Holmans PA, Jones IR, Kirov G, Moskvina V, Nikolov I, O’Donovan MC, Owen MJ, Collier DA, Elkin A, Farmer A, Williamson R, McGuffin P, Young AH, Ferrier IN, Ball SG, Balmforth AJ, Barrett JH, Bishop DT, Iles MM, Maqbool A, Yuldasheva N, Hall AS, Braund PS, Dixon RJ, Mangino M, Stevens S, Thompson JR, Bredin F, Tremelling M, Parkes M, Drummond H, Lees CW, Nimmo ER, Satsangi J, Fisher SA, Forbes A, Lewis CM, Onnie CM, Prescott NJ, Sanderson J, Mathew CG, Barbour J, Mohiuddin MK, Todhunter CE, Mansfield JC, Ahmad T, Cummings FR, Jewell DP, Webster J, Brown MJ, Lathrop GM, Connell J, Dominiczak A, Marcano CAB, Burke B, Dobson R, Gungadoo J, Lee KL, Munroe PB, Newhouse SJ, Onipinla A, Wallace C, Xue MZ, Caulfield M, Farrall M, Barton A, Bruce IN, Donovan H, Eyre S, Gilbert PD, Hider SL, Hinks AM, John SL, Potter C, Silman AJ, Symmons DPM, Thomson W, Worthington J, Dunger DB, Widmer B, Frayling TM, Freathy RM, Lango H, Perry JRB, Shields BM, Weedon MN, Hattersley AT, Elliott KS, Groves CJ, Lindgren CM, Rayner NW, Timpson NJ, Zeggini E, Newport M, Sirugo G, Lyons E, Vannberg F, Brown MA, Franklyn JA, Heward JM, Simmonds MJ, Hill AVS, Bradbury LA, Farrar C, Pointon JJ, Wordsmith P, Gough SCL, Seal S, Stratton MR, Rahman N, Ban M, Goris A, Sawcer SJ, Compston A, Conway D, Jallow M, Bumpstead SJ, Chaney A, Downes K, Ghori MJR, Gwilliam R, Inouye M, Keniry A, King E, McGinnis R, Potter S, Ravindrarajah R, Whittaker P, Withers D, Pereira-Gale J, Hallgrimsdottir IB, Howie BN, Su Z, Teo YY, Vukcevic D, Bentley D C. Wellcome Trust Case Control, R. A. G. Biol, S. Genom Study, and C. Breast Canc Susceptib. Genome-wide association study of 14,000 cases of seven common diseases and 3,000 shared controls. Nature. 2007;447(7145):661–678. doi: 10.1038/nature05911. [DOI] [PMC free article] [PubMed] [Google Scholar]
- Butler RN, Miller RA, Perry D, Carnes BA, Williams TF, Cassel C, Brody J, Bernard MA, Partridge L, Kirkwood T, Martin GM, Olshansky SJ. New model of health promotion and disease prevention for the 21st century. British Medical Journal. 2008;337(7662):a399. doi: 10.1136/bmj.a399. [DOI] [PMC free article] [PubMed] [Google Scholar]
- Butler RN, Warner HR, Williams TF, Austad SN, Brody JA, Campisi J, Cerami A, Cohen G, Cristofalo VJ, Drachman DA, Finch CE, Fridovich I, Harley CB, Havlik RJ, Martin GM, Miller RA, Olshansky SJ, Pereira-Smith OM, Smith JR, Sprott RL, West MD, Wilmoth JR, Wright WE. The aging factor in health and disease: the promise of basic research on aging. Aging Clinical and Experimental Research. 2004;16(2):104–111. doi: 10.1007/BF03324538. discussion 111–112. [DOI] [PubMed] [Google Scholar]
- Campisi J, Andersen JK, Kapahi P, Melov S. Cellular senescence: a link between cancer and age-related degenerative disease? Semin Cancer Biol. 2011;21(6):354–359. doi: 10.1016/j.semcancer.2011.09.001. [DOI] [PMC free article] [PubMed] [Google Scholar]
- Charlesworth B. Patterns of age-specific means and genetic variances of mortality rates predicted by the mutation-accumulation theory of ageing. Journal of Theoretical Biology. 2001;210(1):47–65. doi: 10.1006/jtbi.2001.2296. [DOI] [PubMed] [Google Scholar]
- Cho JH, Saini DK, Karunarathne WK, Kalyanaraman V, Gautam N. Alteration of Golgi structure in senescent cells and its regulation by a G protein gamma subunit. Cell Signal. 2011;23(5):785–793. doi: 10.1016/j.cellsig.2011.01.001. [DOI] [PMC free article] [PubMed] [Google Scholar]
- Clarke AJ, Cooper DN. GWAS: heritability missing in action? Eur J Hum Genet. 2010;18(8):859–861. doi: 10.1038/ejhg.2010.35. [DOI] [PMC free article] [PubMed] [Google Scholar]
- Cribbs DH, Berchtold NC, Perreau V, Coleman PD, Rogers J, Tenner AJ, Cotman CW. Extensive innate immune gene activation accompanies brain aging, increasing vulnerability to cognitive decline and neurodegeneration: a microarray study. J Neuroinflammation. 2012;9:179. doi: 10.1186/1742-2094-9-179. [DOI] [PMC free article] [PubMed] [Google Scholar]
- Dawber TR, Meadors GF, Moore FE. Epidemiological approaches to heart disease: The Framingham Study. American Journal of Public Health. 1951;41(3):279–286. doi: 10.2105/ajph.41.3.279. [DOI] [PMC free article] [PubMed] [Google Scholar]
- De Benedictis G, Tan Q, Jeune B, Christensen K, Ukraintseva SV, Bonafe M, Franceschi C, Vaupel JW, Yashin AI. Recent advances in human gene-longevity association studies. Mech Ageing Dev. 2001;122(9):909–920. doi: 10.1016/s0047-6374(01)00247-0. [DOI] [PubMed] [Google Scholar]
- Deelen J, Beekman M, Uh HW, Helmer Q, Kuningas M, Christiansen L, Kremer D, van der Breggen R, Suchiman HED, Lakenberg N, van den Akker EB, Passtoors WM, Tiemeier H, van Heemst D, de Craen AJ, Rivadeneira F, de Geus EJ, Perola M, van der Ouderaa FJ, Gunn DA, Boomsma DI, Uitterlinden AG, Christensen K, van Duijn CM, Heijmans BT, Houwing-Duistermaat JJ, Westendorp RGJ, Slagboom PE. Genome-wide association study identifies a single major locus contributing to survival into old age; the APOE locus revisited. Aging Cell. 2011;10(4):686–698. doi: 10.1111/j.1474-9726.2011.00705.x. [DOI] [PMC free article] [PubMed] [Google Scholar]
- Di Rienzo A, Hudson RR. An evolutionary framework for common diseases: the ancestral-susceptibility model. Trends in Genetics. 2005;21(11):596–601. doi: 10.1016/j.tig.2005.08.007. [DOI] [PubMed] [Google Scholar]
- Eichler EE, Flint J, Gibson G, Kong A, Leal SM, Moore JH, Nadeau JH. Missing heritability and strategies for finding the underlying causes of complex disease. Nat Rev Genet. 2010;11(6):446–450. doi: 10.1038/nrg2809. [DOI] [PMC free article] [PubMed] [Google Scholar]
- Ewbank DC. Mortality differences by APOE genotype estimated from demographic synthesis. Genetic Epidemiology. 2002;22(2):146–155. doi: 10.1002/gepi.0164. [DOI] [PubMed] [Google Scholar]
- Ewing RM, Chu P, Elisma F, Li H, Taylor P, Climie S, McBroom-Cerajewski L, Robinson MD, O’Connor L, Li M, Taylor R, Dharsee M, Ho Y, Heilbut A, Moore L, Zhang S, Ornatsky O, Bukhman YV, Ethier M, Sheng Y, Vasilescu J, Abu-Farha M, Lambert JP, Duewel HS, Stewart, Kuehl B, Hogue K, Colwill K, Gladwish K, Muskat B, Kinach R, Adams SL, Moran MF, Morin GB, Topaloglou T, Figeys D. Large-scale mapping of human protein-protein interactions by mass spectrometry. Mol Syst Biol. 2007;3:89. doi: 10.1038/msb4100134. [DOI] [PMC free article] [PubMed] [Google Scholar]
- Fang M, Orr MT, Spee P, Egebjerg T, Lanier LL, Sigal LJ. CD94 is essential for NK cell-mediated resistance to a lethal viral disease. Immunity. 2011;34(4):579–589. doi: 10.1016/j.immuni.2011.02.015. [DOI] [PMC free article] [PubMed] [Google Scholar]
- Finch CE, Tanzi RE. Genetics of aging. Science. 1997;278(5337):407–411. doi: 10.1126/science.278.5337.407. [DOI] [PubMed] [Google Scholar]
- Gao X, Becker LC, Becker DM, Starmer JD, Province MA. Avoiding the High Bonferroni Penalty in Genome-Wide Association Studies. Genetic Epidemiology. 2010;34(1):100–105. doi: 10.1002/gepi.20430. [DOI] [PMC free article] [PubMed] [Google Scholar]
- Giblin W, Skinner ME, Lombard DB. Sirtuins: guardians of mammalian healthspan. Trends in Genetics. 2014 doi: 10.1016/j.tig.2014.04.007. [DOI] [PMC free article] [PubMed] [Google Scholar]
- Goldberger AL, Peng CK, Lipsitz LA. What is physiologic complexity and how does it change with aging and disease? Neurobiology of Aging. 2002;23(1):23–26. doi: 10.1016/s0197-4580(01)00266-4. [DOI] [PubMed] [Google Scholar]
- Goldman DP, Cutler D, Rowe JW, Michaud PC, Sullivan J, Peneva D, Olshansky SJ. Substantial health and economic returns from delayed aging may warrant a new focus for medical research. Health Aff (Millwood) 2013;32(10):1698–1705. doi: 10.1377/hlthaff.2013.0052. [DOI] [PMC free article] [PubMed] [Google Scholar]
- Hall DM, Xu L, Drake VJ, Oberley LW, Oberley TD, Moseley PL, Kregel KC. Aging reduces adaptive capacity and stress protein expression in the liver after heat stress. Journal of Applied Physiology. 2000;89(2):749–759. doi: 10.1152/jappl.2000.89.2.749. [DOI] [PubMed] [Google Scholar]
- Hendricks DW, Balfour HH, Jr, Dunmire SK, Schmeling DO, Hogquist KA, Lanier LL. Cutting edge: NKG2C(hi)CD57+ NK cells respond specifically to acute infection with cytomegalovirus and not Epstein-Barr virus. J Immunol. 2014;192(10):4492–4496. doi: 10.4049/jimmunol.1303211. [DOI] [PMC free article] [PubMed] [Google Scholar]
- Hughes KA, Reynolds RM. Evolutionary and mechanistic theories of aging. Annu Rev Entomol. 2005;50:421–445. doi: 10.1146/annurev.ento.50.071803.130409. [DOI] [PubMed] [Google Scholar]
- Jeffries AR, Mungall AJ, Dawson E, Halls K, Langford CF, Murray RM, Dunham I, Powell JF. beta-1,3-Glucuronyltransferase-1 gene implicated as a candidate for a schizophrenia-like psychosis through molecular analysis of a balanced translocation. Mol Psychiatry. 2003;8(7):654–663. doi: 10.1038/sj.mp.4001382. [DOI] [PubMed] [Google Scholar]
- Kahler AK, Djurovic S, Rimol LM, Brown AA, Athanasiu L, Jonsson EG, Hansen T, Gustafsson O, Hall H, Giegling I, Muglia P, Cichon S, Rietschel M, Pietilainen OP, Peltonen L, Bramon E, Collier D, St Clair D, Sigurdsson E, Petursson H, Rujescu D, Melle I, Werge T, Steen VM, Dale AM, Matthews RT, Agartz I, Andreassen OA. Candidate gene analysis of the human natural killer-1 carbohydrate pathway and perineuronal nets in schizophrenia: B3GAT2 is associated with disease risk and cortical surface area. Biol Psychiatry. 2011;69(1):90–96. doi: 10.1016/j.biopsych.2010.07.035. [DOI] [PubMed] [Google Scholar]
- Kang HM, Sul JH, Service SK, Zaitlen NA, Kong S-y, Freimer NB, Sabatti C, Eskin E. Variance component model to account for sample structure in genome-wide association studies. Nature Genetics. 2010;42(4):348–354. doi: 10.1038/ng.548. [DOI] [PMC free article] [PubMed] [Google Scholar]
- Kang J, Cho J, Zhao H. Practical Issues in Building Risk-Predicting Models for Complex Diseases. Journal of Biopharmaceutical Statistics. 2010;20(2):415–440. doi: 10.1080/10543400903572829. [DOI] [PMC free article] [PubMed] [Google Scholar]
- Kannel WB, Feinleib M, McNamara PM, Garrison RJ, Castelli WP. An investigation of coronary heart disease in families: The Framingham offspring study. American Journal of Epidemiology. 1979;110(3):281–290. doi: 10.1093/oxfordjournals.aje.a112813. [DOI] [PubMed] [Google Scholar]
- Karlamangla AS, Singer BH, Seeman TE. Reduction in allostatic load in older adults is associated with lower all-cause mortality risk: MacArthur studies of successful aging. Psychosomatic Medicine. 2006;68(3):500–507. doi: 10.1097/01.psy.0000221270.93985.82. [DOI] [PubMed] [Google Scholar]
- Katsios C, Roukos DH. Missing heritability, next-generation genome-wide association studies and primary cancer prevention: an Atlantean illusion? Future Oncol. 2011;7(4):477–480. doi: 10.2217/fon.11.29. [DOI] [PubMed] [Google Scholar]
- Kulminski AM, Arbeev KG, Culminskaya I, Arbeeva L, Ukraintseva SV, Stallard E, Christensen K, Schupf N, Province MA, Yashin AI. Age, Gender, and Cancer but Not Neurodegenerative and Cardiovascular Diseases Strongly Modulate Systemic Effect of the Apolipoprotein E4 Allele on Lifespan. PLoS Genetics. 2014;10(1):e1004141. doi: 10.1371/journal.pgen.1004141. [DOI] [PMC free article] [PubMed] [Google Scholar]
- Kulminski AM, Arbeev KG, Kulminskaya IV, Ukraintseva SV, Land K, Akushevich I, Yashin AI. Body mass index and nine-year mortality in disabled and nondisabled older U.S. Individuals. Journal of the American Geriatrics Society. 2008;56(1):105–110. doi: 10.1111/j.1532-5415.2007.01494.x. [DOI] [PubMed] [Google Scholar]
- Kulminski AM, Culminskaya I, Arbeev KG, Ukraintseva SV, Arbeeva L, Yashin AI. Trade-off in the effect of the APOE gene on the ages at onset of cardiocascular disease and cancer across ages, gender, and human generations. Rejuvenation Res. 2013;16(1):28–34. doi: 10.1089/rej.2012.1362. [DOI] [PMC free article] [PubMed] [Google Scholar]
- Kulminski AM, Culminskaya I, Arbeev KG, Ukraintseva SV, Stallard E, Arbeeva L, Yashin AI. The role of lipid-related genes, aging-related processes, and environment in healthspan. Aging Cell. 2013;12(2):237–246. doi: 10.1111/acel.12046. [DOI] [PMC free article] [PubMed] [Google Scholar]
- Kulminski AM, I, Culminskaya V, Ukraintseva SV, Arbeev KG, Akushevich I, Land KC, Yashin AI. Polymorphisms in the ACE and ADRB2 genes and risks of aging-associated phenotypes: the case of myocardial infarction. Rejuvenation Res. 2010;13(1):13–21. doi: 10.1089/rej.2009.0905. [DOI] [PMC free article] [PubMed] [Google Scholar]
- Kuzuya M, Enoki H, Iwata M, Hasegawa J, Hirakawa Y. J-shaped relationship between resting pulse rate and all-cause mortality in community-dwelling older people with disabilities. Journal of the American Geriatrics Society. 2008;56(2):367–368. doi: 10.1111/j.1532-5415.2007.01512.x. [DOI] [PubMed] [Google Scholar]
- Lake SL, Jmor F, Dopierala J, Taktak AF, Coupland SE, Damato BE. Multiplex ligation-dependent probe amplification of conjunctival melanoma reveals common BRAF V600E gene mutation and gene copy number changes. Invest Ophthalmol Vis Sci. 2011;52(8):5598–5604. doi: 10.1167/iovs.10-6934. [DOI] [PubMed] [Google Scholar]
- Lewington S, Clarke R, Qizilbash N, Peto R, Collins R. Age-specific relevance of usual blood pressure to vascular mortality: a meta-analysis of individual data for one million adults in 61 prospective studies. Lancet. 2002;360(9349):1903–1913. doi: 10.1016/s0140-6736(02)11911-8. [DOI] [PubMed] [Google Scholar]
- Li MX, Yeung JMY, Cherny SS, Sham PC. Evaluating the effective numbers of independent tests and significant p-value thresholds in commercial genotyping arrays and public imputation reference datasets. Human Genetics. 2012;131(5):747–756. doi: 10.1007/s00439-011-1118-2. [DOI] [PMC free article] [PubMed] [Google Scholar]
- Liu X, Feng R, Du L. The role of enoyl-CoA hydratase short chain 1 and peroxiredoxin 3 in PP2-induced apoptosis in human breast cancer MCF-7 cells. FEBS Lett. 2010;584(14):3185–3192. doi: 10.1016/j.febslet.2010.06.002. [DOI] [PubMed] [Google Scholar]
- Ljubuncic P, Reznick AZ. The evolutionary theories of aging revisited--a mini-review. Gerontology. 2009;55(2):205–216. doi: 10.1159/000200772. [DOI] [PubMed] [Google Scholar]
- Louhija J, Viitanen M, Aguero-Torres H, Tilvis R. Survival in Finnish centenarians in relation to apolipoprotein E polymorphism. Journal of the American Geriatrics Society. 2001;49(7):1007–1008. doi: 10.1046/j.1532-5415.2001.49199.x. [DOI] [PubMed] [Google Scholar]
- Lund J, Tedesco P, Duke K, Wang J, Kim SK, Johnson TE. Transcriptional profile of aging in C-elegans. Current Biology. 2002;12(18):1566–1573. doi: 10.1016/s0960-9822(02)01146-6. [DOI] [PubMed] [Google Scholar]
- Lunetta KL, D’Agostino RB, Sr, Karasik D, Benjamin EJ, Guo CY, Govindaraju R, Kiel DP, Kelly-Hayes M, Massaro JM, Pencina MJ, Seshadri S, Murabito JM. Genetic correlates of longevity and selected age-related phenotypes: a genome-wide association study in the Framingham Study. BMC Medical Genetics. 2007;8(Suppl 1):S13. doi: 10.1186/1471-2350-8-S1-S13. [DOI] [PMC free article] [PubMed] [Google Scholar]
- Ma J, Amos CI. Theoretical Formulation of Principal Components Analysis to Detect and Correct for Population Stratification. PLoS ONE. 2010;5(9):e12510. doi: 10.1371/journal.pone.0012510. [DOI] [PMC free article] [PubMed] [Google Scholar]
- Mahlknecht U, Voelter-Mahlknecht S. Genomic organization and localization of the NAD-dependent histone deacetylase gene sirtuin 3 (Sirt3) in the mouse. Int J Oncol. 2011;38(3):813–822. doi: 10.3892/ijo.2010.872. [DOI] [PubMed] [Google Scholar]
- Makowsky R, Pajewski NM, Klimentidis YC, Vazquez AI, Duarte CW, Allison DB, de los Campos G. Beyond missing heritability: prediction of complex traits. PLoS Genet. 2011;7(4):e1002051. doi: 10.1371/journal.pgen.1002051. [DOI] [PMC free article] [PubMed] [Google Scholar]
- Manolio TA, Collins FS, Cox NJ, Goldstein DB, Hindorff LA, Hunter DJ, McCarthy MI, Ramos EM, Cardon LR, Chakravarti A, Cho JH, Guttmacher AE, Kong A, Kruglyak L, Mardis E, Rotimi CN, Slatkin M, Valle D, Whittemore AS, Boehnke M, Clark AG, Eichler EE, Gibson G, Haines JL, Mackay TFC, McCarroll SA, Visscher PM. Finding the missing heritability of complex diseases. Nature. 2009;461(7265):747–753. doi: 10.1038/nature08494. [DOI] [PMC free article] [PubMed] [Google Scholar]
- Marian AJ. Elements of ‘missing heritability’. Curr Opin Cardiol. 2012;27(3):197–201. doi: 10.1097/HCO.0b013e328352707d. [DOI] [PubMed] [Google Scholar]
- Mazza A, Zamboni S, Rizzato E, Pessina AC, Tikhonoff V, Schiavon L, Casiglia E. Serum uric acid shows a J-shaped trend with coronary mortality in non-insulin-dependent diabetic elderly people. The CArdiovascular STudy in the ELderly (CASTEL) Acta Diabetologica. 2007;44(3):99–105. doi: 10.1007/s00592-007-0249-3. [DOI] [PubMed] [Google Scholar]
- Millarte V, Farhan H. The Golgi in cell migration: regulation by signal transduction and its implications for cancer cell metastasis. ScientificWorldJournal. 2012;2012:498278. doi: 10.1100/2012/498278. [DOI] [PMC free article] [PubMed] [Google Scholar]
- Mitteldorf JJ. Adaptive aging in the context of evolutionary theory. Biochemistry-Moscow. 2012;77(7):716–725. doi: 10.1134/S0006297912070036. [DOI] [PubMed] [Google Scholar]
- Nebel A, Kleindorp R, Caliebe A, Nothnagel M, Blanche H, Junge O, Wittig M, Ellinghaus D, Flachsbart F, Wichmann HE, Meitinger T, Nikolaus S, Franke A, Krawczak M, Lathrop M, Schreiber S. A genome-wide association study confirms APOE as the major gene influencing survival in long-lived individuals. Mechanisms of Ageing and Development. 2011;132(6–7):324–330. doi: 10.1016/j.mad.2011.06.008. [DOI] [PubMed] [Google Scholar]
- Newman AB, Walter S, Lunetta KL, Garcia ME, Slagboom PE, Christensen K, Arnold AM, Aspelund T, Aulchenko YS, Benjamin EJ, Christiansen L, D’Agostino RB, Fitzpatrick AL, Franceschini N, Glazer NL, Gudnason V, Hofman A, Kaplan R, Karasik D, Kelly-Hayes M, Kiel DP, Launer LJ, Marciante KD, Massaro JM, Miljkovic I, Nalls MA, Hernandez D, Psaty BM, Rivadeneira F, Rotter J, Seshadri S, Smith AV, Taylor KD, Tiemeier H, Uh HW, Uitterlinden AG, Vaupel JW, Walston J, Westendorp RGJ, Harris TB, Lumley T, van Duijn CM, Murabito JM. A Meta-analysis of Four Genome-Wide Association Studies of Survival to Age 90 Years or Older: The Cohorts for Heart and Aging Research in Genomic Epidemiology Consortium. Journals of Gerontology Series A Biological Sciences and Medical Sciences. 2010;65(5):478–487. doi: 10.1093/gerona/glq028. [DOI] [PMC free article] [PubMed] [Google Scholar]
- Nielsen CM, White MJ, Goodier MR, Riley EM. Functional Significance of CD57 Expression on Human NK Cells and Relevance to Disease. Front Immunol. 2013;4:422. doi: 10.3389/fimmu.2013.00422. [DOI] [PMC free article] [PubMed] [Google Scholar]
- Nishida K, Yamasaki S, Hasegawa A, Iwamatsu A, Koseki H, Hirano T. Gab2, via PI-3K, regulates ARF1 in FcepsilonRI-mediated granule translocation and mast cell degranulation. Journal of Immunology. 2011;187(2):932–941. doi: 10.4049/jimmunol.1100360. [DOI] [PubMed] [Google Scholar]
- Nyholt DR. A simple correction for multiple testing for single-nucleotide polymorphisms in linkage disequilibrium with each other. American Journal of Human Genetics. 2004;74(4):765–769. doi: 10.1086/383251. [DOI] [PMC free article] [PubMed] [Google Scholar]
- Okumiya K, Matsubayashi K, Wada T, Fujisawa M, Osaki Y, Doi Y, Yasuda N, Ozawa T. A U-shaped association between home systolic blood pressure and four-year mortality in community-dwelling older men. Journal of the American Geriatrics Society. 1999;47(12):1415–1421. doi: 10.1111/j.1532-5415.1999.tb01559.x. [DOI] [PubMed] [Google Scholar]
- Palatini P. Need for a revision of the normal limits of resting heart rate. Hypertension. 1999;33(2):622–625. doi: 10.1161/01.hyp.33.2.622. [DOI] [PubMed] [Google Scholar]
- Pawitan Y, Seng KC, Magnusson PKE. How many genetic variants remain to be discovered? PLoS ONE. 2009;4(12):e7969. doi: 10.1371/journal.pone.0007969. [DOI] [PMC free article] [PubMed] [Google Scholar]
- Pimentel-Nunes P, Goncalves N, Boal-Carvalho I, Afonso L, Lopes P, Roncon-Albuquerque R, Jr, Henrique R, Moreira-Dias L, Leite-Moreira AF, Dinis-Ribeiro M. Helicobacter pylori induces increased expression of Toll-like receptors and decreased Toll-interacting protein in gastric mucosa that persists throughout gastric carcinogenesis. Helicobacter. 2013;18(1):22–32. doi: 10.1111/hel.12008. [DOI] [PubMed] [Google Scholar]
- Price AL, Patterson NJ, Plenge RM, Weinblatt ME, Shadick NA, Reich D. Principal components analysis corrects for stratification in genome-wide association studies. Nature Genetics. 2006;38(8):904–909. doi: 10.1038/ng1847. [DOI] [PubMed] [Google Scholar]
- Protogerou AD, Safar ME, Iaria P, Safar H, Le Dudal K, Filipovsky J, Henry O, Ducimetiere P, Blacher J. Diastolic blood pressure and mortality in the elderly with cardiovascular disease. Hypertension. 2007;50(1):172–180. doi: 10.1161/HYPERTENSIONAHA.107.089797. [DOI] [PubMed] [Google Scholar]
- Rankin MM, Kushner JA. Adaptive beta-cell Proliferation Is Severely Restricted With Advanced Age. Diabetes. 2009;58(6):1365–1372. doi: 10.2337/db08-1198. [DOI] [PMC free article] [PubMed] [Google Scholar]
- Robb EL, Page MM, Stuart JA. Mitochondria, cellular stress resistance, somatic cell depletion and lifespan. Current Aging Science. 2009;2(1):12–27. doi: 10.2174/1874609810902010012. [DOI] [PubMed] [Google Scholar]
- Sabe H, Onodera Y, Mazaki Y, Hashimoto S. ArfGAP family proteins in cell adhesion, migration and tumor invasion. Curr Opin Cell Biol. 2006;18(5):558–564. doi: 10.1016/j.ceb.2006.08.002. [DOI] [PubMed] [Google Scholar]
- Sanchez-Laorden BL, Herraiz C, Valencia JC, Hearing VJ, Jimenez-Cervantes C, Garcia-Borron JC. Aberrant trafficking of human melanocortin 1 receptor variants associated with red hair and skin cancer: Steady-state retention of mutant forms in the proximal golgi. J Cell Physiol. 2009;220(3):640–654. doi: 10.1002/jcp.21804. [DOI] [PMC free article] [PubMed] [Google Scholar]
- Seeman TE, McEwen BS, Rowe JW, Singer BH. Allostatic load as a marker of cumulative biological risk: MacArthur studies of successful aging. Proceedings of the National Academy of Sciences of the United States of America. 2001;98(8):4770–4775. doi: 10.1073/pnas.081072698. [DOI] [PMC free article] [PubMed] [Google Scholar]
- Semenchenko GV, Khazaeli AA, Curtsinger JW, Yashin AI. Stress resistance declines with age: analysis of data from a survival experiment with Drosophila melanogaster. Biogerontology. 2004;5(1):17–30. doi: 10.1023/b:bgen.0000017681.46326.9e. [DOI] [PubMed] [Google Scholar]
- Splansky GL, Corey D, Yang Q, Atwood LD, Cupples LA, Benjamin EJ, D’Agostino RB, Sr, Fox CS, Larson MG, Murabito JM, O’Donnell CJ, Vasan RS, Wolf PA, Levy D. The third generation cohort of the national heart, lung, and blood institute’s Framingham Heart Study: Design, recruitment, and initial examination. American Journal of Epidemiology. 2007;165(11):1328–1335. doi: 10.1093/aje/kwm021. [DOI] [PubMed] [Google Scholar]
- Summers K, Crespi BJ. Xmrks the spot: life history tradeoffs, sexual selection and the evolutionary ecology of oncogenesis. Molecular Ecology. 2010;19(15):3022–3024. doi: 10.1111/j.1365-294x.2010.04739.x. [DOI] [PubMed] [Google Scholar]
- Teslovich TM, Musunuru K, Smith AV, Edmondson AC, Stylianou IM, Koseki M, Pirruccello JP, Ripatti S, Chasman DI, Willer CJ, Johansen CT, Fouchier SW, Isaacs A, Peloso GM, Barbalic M, Ricketts SL, Bis JC, Aulchenko YS, Thorleifsson G, Feitosa MF, Chambers J, Orho-Melander M, Melander O, Johnson T, Li X, Guo X, Li M, Cho YS, Go MJ, Kim YJ, Lee J-Y, Park T, Kim K, Sim X, Ong RT-H, Croteau-Chonka DC, Lange LA, Smith JD, Song K, Zhao JH, Yuan X, Luan Ja, Lamina C, Ziegler A, Zhang W, Zee RYL, Wright AF, Witteman JCM, Wilson JF, Willemsen G, Wichmann HE, Whitfield JB, Waterworth DM, Wareham NJ, Waeber G, Vollenweider P, Voight BF, Vitart V, Uitterlinden AG, Uda M, Tuomilehto J, Thompson JR, Tanaka T, Surakka I, Stringham HM, Spector TD, Soranzo N, Smit JH, Sinisalo J, Silander K, Sijbrands EJG, Scuteri A, Scott J, Schlessinger D, Sanna S, Salomaa V, Saharinen J, Sabatti C, Ruokonen A, Rudan I, Rose LM, Roberts R, Rieder M, Psaty BM, Pramstaller PP, Pichler I, Perola M, Penninx BWJH, Pedersen NL, Pattaro C, Parker AN, Pare G, Oostra BA, O’Donnell CJ, Nieminen MS, Nickerson DA, Montgomery GW, Meitinger T, McPherson R, McCarthy MI, McArdle W, Masson D, Martin NG, Marroni F, Mangino M, Magnusson PKE, Lucas G, Luben R, Loos RJF, Lokki M-L, Lettre G, Langenberg C, Launer LJ, Lakatta EG, Laaksonen R, Kyvik KO, Kronenberg F, Koenig IR, Khaw K-T, Kaprio J, Kaplan LM, Johansson A, Jarvelin M-R, Janssens ACJW, Ingelsson E, Igi W, Hovingh GK, Hottenga J-J, Hofman A, Hicks AA, Hengstenberg C, Heid IM, Hayward C, Havulinna AS, Hastie ND, Harris TB, Haritunians T, Hall AS, Gyllensten U, Guiducci C, Groop LC, Gonzalez E, Gieger C, Freimer NB, Ferrucci L, Erdmann J, Elliott P, Ejebe KG, Doering A, Dominiczak AF, Demissie S, Deloukas P, de Geus EJC, de Faire U, Crawford G, Collins FS, Chen Y-dI, Caulfield MJ, Campbell H, Burtt NP, Bonnycastle LL, Boomsma DI, Boekholdt SM, Bergman RN, Barroso I, Bandinelli S, Ballantyne CM, Assimes TL, Quertermous T, Altshuler D, Seielstad M, Wong TY, Tai ES, Feranil AB, Kuzawa CW, Adair LS, Taylor HA, Jr, Borecki IB, Gabriel SB, Wilson JG, Holm H, Thorsteinsdottir U, Gudnason V, Krauss RM, Mohlke KL, Ordovas JM, Munroe PB, Kooner JS, Tall AR, Hegele RA, Kastelein JJP, Schadt EE, Rotter JI, Boerwinkle E, Strachan DP, Mooser V, Stefansson K, Reilly MP, Samani NJ, Schunkert H, Cupples LA, Sandhu MS, Ridker PM, Rader DJ, van Duijn CM, Peltonen L, Abecasis GR, Boehnke M, Kathiresan S. Biological, clinical and population relevance of 95 loci for blood lipids. Nature. 2010;466(7307):707–713. doi: 10.1038/nature09270. [DOI] [PMC free article] [PubMed] [Google Scholar]
- Thomas G, Jacobs KB, Yeager M, Kraft P, Wacholder S, Orr N, Yu K, Chatterjee N, Welch R, Hutchinson A, Crenshaw A, Cancel-Tassin G, Staats BJ, Wang Z, Gonzalez-Bosquet J, Fang J, Deng X, Berndt SI, Calle EE, Feigelson HS, Thun MJ, Rodriguez C, Albanes D, Virtamo J, Weinstein S, Schumacher FR, Giovannucci E, Willett WC, Cussenot O, Valeri A, Andriole GL, Crawford ED, Tucker M, Gerhard DS, Fraumeni JF, Hoover R, Hayes RB, Hunter DJ, Chanock SJ. Multiple loci identified in a genome-wide association study of prostate cancer. Nature Genetics. 2008;40(3):310–315. doi: 10.1038/ng.91. [DOI] [PubMed] [Google Scholar]
- Tian Y, Schreiber R, Kunzelmann K. Anoctamins are a family of Ca2+-activated Cl-channels. J Cell Sci. 2012;125(Pt 21):4991–4998. doi: 10.1242/jcs.109553. [DOI] [PubMed] [Google Scholar]
- Tolley HD. Using the random walk model for understanding aging: Comments on “The quadratic hazard model for analyzing longitudinal data on aging, health, and the life span”. In: Yashin AI, et al., editors. Physics of Life Reviews. 2. Vol. 9. 2012. pp. 191–192. [DOI] [PubMed] [Google Scholar]
- Troiano RP, Frongillo EA, Sobal J, Levitsky DA. The relationship between body weight and mortality: A quantitative analysis of combined information from existing studies. International Journal of Obesity. 1996;20(1):63–75. [PubMed] [Google Scholar]
- Troncale JA. The aging process: Physiologic changes and pharmacologic implications. Postgraduate Medicine. 1996;99(5):111–114. 120–122. [PubMed] [Google Scholar]
- Ukraintseva SV, Arbeev KG, Akushevich I, Kulminski A, Arbeeva L, Culminskaya I, Akushevich L, Yashin AI. Trade-offs between cancer and other diseases: do they exist and influence longevity? Rejuvenation Res. 2010;13(4):387–396. doi: 10.1089/rej.2009.0941. [DOI] [PMC free article] [PubMed] [Google Scholar]
- Ukraintseva SV, Yashin AI. Individual aging and cancer risk: How are they related? Demographic Research. 2003;9(8):163–196. [Google Scholar]
- van Uffelen JGZ, Berecki-Gisolf J, Brown WJ, Dobson AJ. What Is a Healthy Body Mass Index for Women in Their Seventies? Results from the Australian Longitudinal Study on Women’s Health. Journals of Gerontology Series A Biological Sciences and Medical Sciences. 2010;65(8):844–850. doi: 10.1093/gerona/glq058. [DOI] [PubMed] [Google Scholar]
- Vaupel JW, Carey JR, Christensen K, Johnson TE, Yashin AI, Holm NV, Iachine IA, Kannisto V, Khazaeli AA, Liedo P, Longo VD, Zeng Y, Manton KG, Curtsinger JW. Biodemographic trajectories of longevity. Science. 1998;280(5365):855–860. doi: 10.1126/science.280.5365.855. [DOI] [PubMed] [Google Scholar]
- Vijg J, Suh Y. Genetics of longevity and aging. Annu Rev Med. 2005;56:193–212. doi: 10.1146/annurev.med.56.082103.104617. [DOI] [PubMed] [Google Scholar]
- Walter S, Atzmon G, Demerath EW, Garcia ME, Kaplan RC, Kumari M, Lunetta KL, Milaneschi Y, Tanaka T, Tranah GJ, Voelker U, Yu L, Arnold A, Benjamin EJ, Biffar R, Buchman AS, Boerwinkle E, Couper D, De Jager PL, Evans DA, Harris TB, Hoffmann W, Hofman A, Karasik D, Kiel DP, Kocher T, Kuningas M, Launer LJ, Lohman KK, Lutsey PL, Mackenbach J, Marciante K, Psaty BM, Reiman EM, Rotter JI, Seshadri S, Shardell MD, Smith AV, van Duijn C, Walston J, Zillikens MC, Bandinelli S, Baumeister SE, Bennett DA, Ferrucci L, Gudnason V, Kivimaki M, Liu Y, Murabito JM, Newman AB, Tiemeier H, Franceschini N. A genome-wide association study of aging. Neurobiology of Aging. 2011;32(11):2109e2115–2109e2128. doi: 10.1016/j.neurobiolaging.2011.05.026. [DOI] [PMC free article] [PubMed] [Google Scholar]
- Wanitchakool P, Wolf L, Koehl GE, Sirianant L, Schreiber R, Kulkarni S, Duvvuri U, Kunzelmann K. Role of anoctamins in cancer and apoptosis. Philosophical Transactions of the Royal Society of London B Biological Sciences. 2014;369(1638):20130096. doi: 10.1098/rstb.2013.0096. [DOI] [PMC free article] [PubMed] [Google Scholar]
- Westin S, Heath I. Thresholds for normal blood pressure and serum cholesterol. British Medical Journal. 2005;330(7506):1461–1462. doi: 10.1136/bmj.330.7506.1461. [DOI] [PMC free article] [PubMed] [Google Scholar]
- Williams PD, Day T. Antagonistic pleiotropy, mortality source interactions, and the evolutionary theory of senescence. Evolution. 2003;57(7):1478–1488. doi: 10.1111/j.0014-3820.2003.tb00356.x. [DOI] [PubMed] [Google Scholar]
- Witteman JCM, Grobbee DE, Valkenburg HA, Vanhemert AM, Stijnen T, Burger H, Hofman A. J-shaped relation between change in diastolic blood pressure and progression of aortic atherosclerosis. Lancet. 1994;343(8896):504–507. doi: 10.1016/s0140-6736(94)91459-1. [DOI] [PubMed] [Google Scholar]
- Woodbury MA, Manton KG. A random-walk model of human mortality and aging. Theoretical Population Biology. 1977;11(1):37–48. doi: 10.1016/0040-5809(77)90005-3. [DOI] [PubMed] [Google Scholar]
- Yang J, Visscher PM, Wray NR. Sporadic cases are the norm for complex disease. European Journal of Human Genetics. 2010;18(9):1039–1043. doi: 10.1038/ejhg.2009.177. [DOI] [PMC free article] [PubMed] [Google Scholar]
- Yang J, Weedon MN, Purcell S, Lettre G, Estrada K, Willer CJ, Smith AV, Ingelsson E, O’Connell JR, Mangino M, Magi R, Madden PA, Heath AC, Nyholt DR, Martin NG, Montgomery GW, Frayling TM, Hirschhorn JN, McCarthy MI, Goddard ME, Visscher PM. Genomic inflation factors under polygenic inheritance. European Journal of Human Genetics. 2011;19(7):807–812. doi: 10.1038/ejhg.2011.39. [DOI] [PMC free article] [PubMed] [Google Scholar]
- Yashin AI, Akushevich I, Arbeev KG, Kulminski A, Ukraintseva S. Joint analysis of health histories, physiological states, and survival. Mathematical Population Studies. 2011;18(4):207–233. [Google Scholar]
- Yashin AI, Akushevich I, Arbeev KG, Kulminski A, Ukraintseva SV. New Approach for Analyzing Longitudinal Data on Health, Physiological State, and Survival Collected Using Different Observational Plans. JSM Proceedings, Section on Government Statistics. 2011:5336–5350. [Google Scholar]
- Yashin AI, Arbeev KG, Akushevich I, Kulminski A, Akushevich L, Ukraintseva SV. Stochastic model for analysis of longitudinal data on aging and mortality. Mathematical Biosciences. 2007;208(2):538–551. doi: 10.1016/j.mbs.2006.11.006. [DOI] [PMC free article] [PubMed] [Google Scholar]
- Yashin AI, Arbeev KG, Akushevich I, Kulminski A, Akushevich L, Ukraintseva SV. Model of hidden heterogeneity in longitudinal data. Theoretical Population Biology. 2008;73(1):1–10. doi: 10.1016/j.tpb.2007.09.001. [DOI] [PMC free article] [PubMed] [Google Scholar]
- Yashin AI, Arbeev KG, Akushevich I, Kulminski A, Ukraintseva SV, Stallard E, Land KC. The quadratic hazard model for analyzing longitudinal data on aging, health, and the life span. Physics of Life Reviews. 2012;9(2):177–188. doi: 10.1016/j.plrev.2012.05.002. [DOI] [PMC free article] [PubMed] [Google Scholar]
- Yashin AI, Arbeev KG, Akushevich I, Ukraintseva SV, Kulminski A, Arbeeva LS, Culminskaya I. Exceptional survivors have lower age trajectories of blood glucose: lessons from longitudinal data. Biogerontology. 2010;11(3):257–265. doi: 10.1007/s10522-009-9243-1. [DOI] [PMC free article] [PubMed] [Google Scholar]
- Yashin AI, Arbeev KG, Kulminski A, Akushevich I, Akushevich L, Ukraintseva SV. Cumulative index of elderly disorders and its dynamic contribution to mortality and longevity. Rejuvenation Research. 2007;10(1):75–86. doi: 10.1089/rej.2006.0500. [DOI] [PubMed] [Google Scholar]
- Yashin AI, Arbeev KG, Kulminski A, Akushevich I, Akushevich L, Ukraintseva SV. Health decline, aging and mortality: how are they related? Biogerontology. 2007;8(3):291–302. doi: 10.1007/s10522-006-9073-3. [DOI] [PMC free article] [PubMed] [Google Scholar]
- Yashin AI, Arbeev KG, Kulminski A, Akushevich I, Akushevich L, Ukraintseva SV. What age trajectories of cumulative deficits and medical costs tell us about individual aging and mortality risk: Findings from the NLTCS-Medicare data. Mechanisms of Ageing and Development. 2008;129(4):191–200. doi: 10.1016/j.mad.2007.12.005. [DOI] [PMC free article] [PubMed] [Google Scholar]
- Yashin AI, Arbeev KG, Kulminski A, Borecki I, Christensen K, Barmada M, Hadley E, Rossi W, Lee JH, Cheng R, Elo IT. “Predicting” parental longevity from offspring endophenotypes: Data from the Long Life Family Study (LLFS) Mechanisms of Ageing and Development. 2010;131(3):215–222. doi: 10.1016/j.mad.2010.02.001. [DOI] [PMC free article] [PubMed] [Google Scholar]
- Yashin AI, Arbeev KG, Ukraintseva SV. The accuracy of statistical estimates in genetic studies of aging can be significantly improved. Biogerontology. 2007;8(3):243–255. doi: 10.1007/s10522-006-9072-4. [DOI] [PMC free article] [PubMed] [Google Scholar]
- Yashin AI, Arbeev KG, Ukraintseva SV, Akushevich I, Kulminski A. 2011 Living to 100 Monograph Society of Actuaries Monograph M-LI11-1. Society of Actuaries; Schaumburg, IL: 2011. Patterns of Aging Related Changes on the Way to 100: An Approach to Studying Aging, Mortality, and Longevity from Longitudinal Data. [Google Scholar]
- Yashin AI, Arbeev KG, Ukraintseva SV, Akushevich I, Kulminski A. Patterns of Aging Related Changes on the Way to 100: An Approach to Studying Aging, Mortality, and Longevity from Longitudinal Data. North American Actuarial Journal. 2012;16(4):403–433. doi: 10.1080/10920277.2016.1178588. [DOI] [PMC free article] [PubMed] [Google Scholar]
- Yashin AI, Arbeev KG, Wu D, Arbeeva LS, Kulminski A, Akushevich I, Culminskaya I, Stallard E, Ukraintseva S. How lifespan associated genes modulate aging changes: lessons from analysis of longitudinal data. Frontiers in Genetics. 2013;4 doi: 10.3389/fgene.2013.00003. article 3. [DOI] [PMC free article] [PubMed] [Google Scholar]
- Yashin AI, Arbeev KG, Wu D, Arbeeva LS, Kulminski AM, Akushevich I, Culminskaya I, Stallard E, Ukraintseva S. How the quality of GWAS of human lifespan and health span can be improved. Frontiers in Genetics. 2013;4 doi: 10.3389/fgene.2013.00125. article 125. [DOI] [PMC free article] [PubMed] [Google Scholar]
- Yashin AI, De Benedictis G, Vaupel JW, Tan Q, Andreev KF, Iachine IA, Bonafe M, DeLuca M, Valensin S, Carotenuto L, Franceschi C. Genes, demography, and life span: The contribution of demographic data in genetic studies on aging and longevity. American Journal of Human Genetics. 1999;65(4):1178–1193. doi: 10.1086/302572. [DOI] [PMC free article] [PubMed] [Google Scholar]
- Yashin AI, De Benedictis G, Vaupel JW, Tan Q, Andreev KF, Iachine IA, Bonafe M, Valensin S, De Luca M, Carotenuto L, Franceschi C. Genes and longevity: Lessons from studies of centenarians. Journals of Gerontology Series A Biological Sciences and Medical Sciences. 2000;55(7):B319–B328. doi: 10.1093/gerona/55.7.b319. [DOI] [PubMed] [Google Scholar]
- Yashin AI, I, Iachine A. Dependent hazards in multivariate survival problems. Journal of Multivariate Analysis. 1999;71(2):241–261. [Google Scholar]
- Yashin AI, I, Iachine A, Harris JR. Half of the variation in susceptibility to mortality is genetic: findings from Swedish twin survival data. Behav Genet. 1999;29(1):11–19. doi: 10.1023/a:1021481620934. [DOI] [PubMed] [Google Scholar]
- Yashin AI, Manton KG. Effects of unobserved and partially observed covariate processes on system failure: A review of models and estimation strategies. Statistical Science. 1997;12(1):20–34. [Google Scholar]
- Yashin AI, Ukraintseva SV, Arbeev KG, Akushevich I, Arbeeva LS, Kulminski AM. Maintaining physiological state for exceptional survival: What is the normal level of blood glucose and does it change with age? Mechanisms of Ageing and Development. 2009;130(9):611–618. doi: 10.1016/j.mad.2009.07.004. [DOI] [PMC free article] [PubMed] [Google Scholar]
- Yashin AI, Ukraintseva SV, De Benedictis G, Anisimov VN, Butov AA, Arbeev K, Jdanov DA, Boiko SI, Begun AS, Bonafe M, Franceschi C. Have the oldest old adults ever been frail in the past? A hypothesis that explains modern trends in survival. Journals of Gerontology Series A, Biological Sciences and Medical Sciences. 2001;56(10):B432–B442. doi: 10.1093/gerona/56.10.b432. [DOI] [PubMed] [Google Scholar]
- Yashin AI, Wu D, Arbeev KG, Stallard E, Land KC, Ukraintseva SV. How genes influence life span: the biodemography of human survival. Rejuvenation Res. 2012;15(4):374–380. doi: 10.1089/rej.2011.1290. [DOI] [PMC free article] [PubMed] [Google Scholar]
- Yashin AI, Wu D, Arbeev KG, Ukraintseva SV. Joint influence of small-effect genetic variants on human longevity. Aging (Albany NY) 2010;2(9):612–620. doi: 10.18632/aging.100191. [DOI] [PMC free article] [PubMed] [Google Scholar]
- Yashin AI, Wu D, Arbeev KG, Ukraintseva SV. Polygenic effects of common single-nucleotide polymorphisms on life span: when association meets causality. Rejuvenation Research. 2012;15(4):381–394. doi: 10.1089/rej.2011.1257. [DOI] [PMC free article] [PubMed] [Google Scholar]
- Yashin AI, Wu D, Arbeeva LS, Arbeev KG, Kulminski AM, Akushevich I, Kovtun M, Culminskaya I, Stallard E, Li M, Ukraintseva SV. Genetics of aging, health, and survival: dynamic regulation of human longevity related traits. Front Genet. 2015;6:122. doi: 10.3389/fgene.2015.00122. [DOI] [PMC free article] [PubMed] [Google Scholar]
- Yashin AI, Wu DQ, Arbeev KG, Ukraintseva SV. Joint influence of small-effect genetic variants on human longevity. Aging. 2010;2(9):612–620. doi: 10.18632/aging.100191. [DOI] [PMC free article] [PubMed] [Google Scholar]
- Yoon JH, Abdelmohsen K, Gorospe M. Posttranscriptional gene regulation by long noncoding RNA. Journal of Molecular Biology. 2013;425(19):3723–3730. doi: 10.1016/j.jmb.2012.11.024. [DOI] [PMC free article] [PubMed] [Google Scholar]
- Zeggini E, Scott LJ, Saxena R, Voight BF, Marchini JL, Hu T, de Bakker PIW, Abecasis GR, Almgren P, Andersen G, Ardlie K, Bostroem KB, Bergman RN, Bonnycastle LL, Borch-Johnsen K, Burtt NP, Chen H, Chines PS, Daly MJ, Deodhar P, Ding CJ, Doney ASF, Duren WL, Elliott KS, Erdos MR, Frayling TM, Freathy RM, Gianniny L, Grallert H, Grarup N, Groves CJ, Guiducci C, Hansen T, Herder C, Hitman GA, Hughes TE, Isomaa B, Jackson AU, Jorgensen T, Kong A, Kubalanza K, Kuruvilla FG, Kuusisto J, Langenberg C, Lango H, Lauritzen T, Li Y, Lindgren CM, Lyssenko V, Marvelle AF, Meisinger C, Midthjell K, Mohlke KL, Morken MA, Morris AD, Narisu N, Nilsson P, Owen KR, Palmer CNA, Payne F, Perry JRB, Pettersen E, Platou C, Prokopenko I, Qi L, Qin L, Rayner NW, Rees M, Roix JJ, Sandbaek A, Shields B, Sjogren M, Steinthorsdottir V, Stringham HM, Swift AJ, Thorleifsson G, Thorsteinsdottir U, Timpson NJ, Tuomi T, Tuomilehto J, Walker M, Watanabe RM, Weedon MN, Willer CJ, Illig T, Hveem K, Hu FB, Laakso M, Stefansson K, Pedersen O, Wareham NJ, Barroso I, Hattersley AT, Collins FS, Groop L, McCarthy MI, Boehnke M, Altshuler D D Consortium and Wellcome Trust Case Control C. Meta-analysis of genome-wide association data and large-scale replication identifies additional susceptibility loci for type 2 diabetes. Nature Genetics. 2008;40(5):638–645. doi: 10.1038/ng.120. [DOI] [PMC free article] [PubMed] [Google Scholar]
- Zuk O, Hechter E, Sunyaev SR, Lander ES. The mystery of missing heritability: Genetic interactions create phantom heritability. Proc Natl Acad Sci U S A. 2012;109(4):1193–1198. doi: 10.1073/pnas.1119675109. [DOI] [PMC free article] [PubMed] [Google Scholar]