

Abstract
Breathing involves a complex interplay between the brainstem automatic network and cortical voluntary command. How these brain regions communicate at rest or during inspiratory loading is unknown. This issue is crucial for several reasons: (i) increased respiratory loading is a major feature of several respiratory diseases, (ii) failure of the voluntary motor and cortical sensory processing drives is among the mechanisms that precede acute respiratory failure, (iii) several cerebral structures involved in responding to inspiratory loading participate in the perception of dyspnea, a distressing symptom in many disease. We studied functional connectivity and Granger causality of the respiratory network in controls and patients with chronic obstructive pulmonary disease (COPD), at rest and during inspiratory loading. Compared with those of controls, the motor cortex area of patients exhibited decreased connectivity with their contralateral counterparts and no connectivity with the brainstem. In the patients, the information flow was reversed at rest with the source of the network shifted from the medulla towards the motor cortex. During inspiratory loading, the system was overwhelmed and the motor cortex became the sink of the network. This major finding may help to understand why some patients with COPD are prone to acute respiratory failure. Network connectivity and causality were related to lung function and illness severity. We validated our connectivity and causality results with a mathematical model of neural network. Our findings suggest a new therapeutic strategy involving the modulation of brain activity to increase motor cortex functional connectivity and improve respiratory muscles performance in patients. Hum Brain Mapp 37:2736–2754, 2016. © 2016 The Authors Human Brain Mapping Published by Wiley Periodicals, Inc.
Keywords: breathing, brain, functional connectivity, Granger causality, neural network
INTRODUCTION
Breathing involves a complex interplay between the automatic brainstem network and the voluntary cortical command [Gandevia and Rothwell, 1987; Sharshar et al., 2004]. Both networks interact harmoniously to control respiratory muscles contraction, thereby ensuring normal blood gas levels during speech, volitional breathing and ventilatory load. Converging evidence from functional neuroimaging studies indicates that the sensorimotor cortex, medulla, pons and insula are among the critical cerebral regions activated during inspiratory loading [Gozal et al., 1995; Hess et al., 2013; Isaev et al., 2002; McKay et al., 2003; Peiffer et al., 2001]. How these brain regions communicate with one another at rest or during load increases is unknown. This issue is crucial for several reasons: (i) increased respiratory loading is a major feature of several respiratory diseases, (ii) failure of the voluntary motor and cortical sensory processing drives is among the mechanisms that precede acute respiratory failure [Davenport et al., 2000; Sassoon et al., 1996], and (iii) several cerebral structures involved in responding to inspiratory loading also participate in the perception of dyspnea [Peiffer et al., 2001; Von Leupold et al., 2008, 2009], a common and often distressing symptom in many disease.
Chronic obstructive pulmonary disease (COPD) is the most common chronic lung disease in the general population. Chronic inflammation of the distal airways, caused chiefly by tobacco smoke leads to increases in airway tree resistance and, subsequently, in ventilatory loads. Lung function is impaired with a decline in forced expiratory flow, and respiratory muscle insufficiency, which increase the neural drive to breathe [Jolley et al., 2009; Murphy et al., 2011]. Patients with end‐stage COPD have chronic respiratory failure that requires home oxygen (O2) therapy. In a previous study involving cerebral functional magnetic resonance imaging (fMRI), we found that patients with COPD exhibited specific alterations in the brainstem neural control of the respiratory muscles during spontaneous breathing with a high amplitude of low‐frequency oscillations of expiratory neuron clusters [Hess et al., 2013]. Experimental data combined with mathematical modelling of respiratory rhythmogenesis indicated that patients with COPD responded to a ventilatory load increase by reactivating the parafacial group in the brainstem in order to sustain ventilation [Hess et al., 2013]. Furthermore, transcranial magnetic stimulation (TMS) showed that the motor cortex driving the diaphragm had a low motor threshold, a high excitability level and a ceiling effect, as previously reported [Hopkinson et al., 2004]. Taken together, these findings suggest a major role for the automatic and voluntary respiratory neural networks in the pathophysiology of COPD. Surprisingly, no information is available on the connectivity pattern of the respiratory network at rest or in response to increased ventilatory loading in healthy individuals or patients with COPD.
We hypothesized that the functional architecture and information flow of the brain network controlling the respiratory muscles exhibited specific impairments in patients with COPD, and that these impairments correlated with illness severity. The selected seed regions were identified during an inspiratory load design and involved seven key areas of the network: two bilaterally in the motor cortex, two bilaterally in the somatosensory cortex, one in the brainstem region including the medulla and pons, one in the cerebellum, and one in the insula. Correlations between the seed regions and the brain were evaluated and a Granger's predictability analysis was performed during resting‐state fMRI and inspiratory loading to investigate communication within the network. We also sought support for the connectivity and causality findings by developing a mathematical model of the neural network.
METHODS
Participants
We included 15 patients with stable COPD seen at the Physiology and Respiratory disease departments of the Bichat Hospital between 2011 and 2012. Inclusion criteria were age older than 18 years, clinical and lung‐function‐test findings indicating mild‐to‐severe COPD [Pauwels et al., 2001], and absence of exacerbation in the past 4 weeks. Exclusion criteria were home O2 therapy, neurological disease, history of stroke or other cardiovascular events, psychiatric disorder, body mass index (BMI) >30 kg/m2, and contraindication to cerebral fMRI. The study was approved by the Ile‐de‐France‐1 ethics committee, and patients gave written informed consent before study inclusion. Each patient underwent a physical examination and lung function testing: forced expiratory volume in one second (FEV1), FEV1 over forced vital capacity (FEV1/FVC), total lung capacity (TLC). Dyspnea was quantified at rest and during inspiratory loading using the Medical Research Council Dyspnea Scale (MRC) [Fletcher, 1960]. We assessed COPD severity using the GOLD stage [Pauwels et al., 2001] and the multidimensional BODE index based on BMI, FEV1, dyspnea severity (MRC), and the 6‐min walking distance [Celli et al., 2004]. Age‐matched controls (n = 15) were recruited from our hospital's clinical investigation center. All controls and patients were right‐handed.
Functional Magnetic Resonance Imaging (fMRI) Acquisition
For each participant, three sets of images were acquired: structural, resting state, and block design paradigm. The participants breathed normally for structural and functional imaging at rest. For block design imaging, they breathed via a mouthpiece connected to a two‐way nonrebreathing valve (Hans Rudolph 1410 Series) and wore a nose clip. A small plastic 1‐m long tube was connected to the inspiratory limb of the T‐valve for application of a resistive load (50 cm H20/L/s). During the block design, we monitored mouth pressure at the level of the T‐valve, as a validated index of respiratory muscle effort. Before starting the fMRI sessions, the participants were allowed 5 min of familiarization with the equipment in the quiet radiology suite. Physiological monitoring was synchronized with image acquisition. Chest expansion was measured using a pneumatic belt and an electrocardiogram was recorded via chest electrodes [Glover and Chang, 2009], with sampling rates of 10 ms and 1 ms, respectively. End‐tidal pressure of carbon dioxide (PETCO2) and O2 saturation were recorded continuously at a sampling rate of 10 ms.
Imaging was performed using a 3 Tesla MR scanner (General Electrics) with a 64‐channel head coil. Structural T1‐weighted high‐resolution three‐dimensional (3D) volumetric image covering the entire brain were acquired in all participants, using the following parameters: 171 axial slices; 1.2 mm thickness with no gap; echo time [Te] = 3.4 ms; repeat time [RT] = 8.6 ms; flip angle = 12°; matrix 256 × 256; and field of view 240 mm × 240 mm. Total acquisition time was 4 min and 35 s.
T2‐weighted echoplanar images were acquired for the first acquisition run during the resting state (52 axial slices; 4 mm thickness with no gap; echo time [Te] = 19 ms; repeat time [RT] = 2,000 ms; flip angle = 90°; matrix 64 × 64; field of view 240 mm × 240 mm; and voxel dimension 3 × 3 × 4 mm). Acquisition time was 10 min and 8 s, and 300 whole brain volumes were obtained. For the resting state, the participants were instructed to “keep their eyes closed and think of nothing in particular,” to refrain from cognitive, language, and motor tasks as much as possible, and not to fall asleep.
The second set of functional images was acquired using a block design with five cycles, each consisting in alternating 36‐s rest periods and 36‐s active periods with application of a 50 cmH2O/L/s resistive load. MRI parameters were as follows: 52 axial slices; 4 mm thickness with no gap; [Te] = 33 ms; [RT] = 3,000 ms; flip angle = 90°; matrix 64 × 64; field of view 240 mm × 240 mm, and voxel dimension 3 × 3 × 4 mm. Total acquisition time was 6 min 12 s, and 120 whole‐brain volumes were obtained. A supplementary set of functional images was acquired at rest in one control and one patient, with active periods consisting of a right wrist extension for 36 s. The cerebral activation area resulting from the hand movement (HM) was taken as the representation of the right hand in the primary motor cortex, which was distinct from the respiratory muscle area [Sarfeld et al., 2012].
Image Analyses
Image processing was performed using FSL software (http://www.fmrib.ox.ac.uk/fsl, Oxford University).
Structural images
Cerebral gray and white matter volumes were estimated using the optimized voxel‐based morphometry (VBM) [Good et al., 2001] protocol FSL‐VBM (http://fsl.fmrib.ox.ac.uk/fsl/fslwiki/FSLVBM) [Douaud et al., 2007], carried out with FSL 5.0 [Smith et al., 2004]. First, structural images were brain‐extracted and gray matter‐/white matter‐segmented before being registered to the MNI 152 standard space using nonlinear registration [Andersson et al., 2007]. The resulting images were averaged and flipped along the x‐axis to create a left‐right symmetric, study‐specific grey/white matter template. Second, all native gray and white matter images were nonlinearly registered to this study‐specific template and “modulated” to correct for local expansion (or contraction) due to the nonlinear component of the spatial transformation. The modulated gray and white matter images were then smoothed using an isotropic Gaussian kernel with a sigma of 3 mm. Finally, comparisons between gray and white matter as well as of the seven volumetric regions of interest (ROIs) were performed using a voxelwise general linear model and permutation‐based nonparametric testing adjusted for differences in PaO2 (partial pressure of oxygen in arterial blood) covariate and correcting for multiple comparisons across space.
Resting state fMRI
Preprocessing steps included motion correction using MCFLIRT [Jenkinson et al., 2002], slice timing corrections using Fourier‐space time‐series phase‐shifting, non‐brain removal using BET [Smith 2002], spatial smoothing using a Gaussian kernel of full‐width‐half‐maximum 6 mm, and multiplicative mean intensity normalization of the volume at each time point. We also performed single‐session independent component analysis (ICA) [Beckmann and Smith, 2004] as implemented in MELODIC (Multivariate Exploratory Linear Decomposition into Independent Components) (FSL 5.0). The preprocessed data were whitened and projected into a 30‐dimensional subspace. The whitened observations were decomposed into sets of vectors describing signal variations across the temporal domain (time‐courses) and spatial domain (maps) by optimizing for non‐Gaussian spatial source distributions using a fixed‐point iteration technique [Hyvärinen, 1999]. Estimated component maps were divided by the standard deviation of the residual noise and thresholded by fitting a mixture model to the histogram of intensity values [Beckmann and Smith, 2004]. ICA was used to remove, among the 30 components, those identified as scanner‐related, produced by head movement and physiological noise. This step is based on visual inspection of the components in the spatial, temporal and spectral domains (Supporting Information Figs. S1 and S2).
Respiratory volume per time (RVT) was computed from the respiratory waveform (chest belt) [Birn et al., 2008]. The waveform peak‐trough difference was divided by the breathing period for each breath cycle then interpolated to the imaging repeat time (RT). The RR cardiac interval, PETCO2 and O2 saturation (maximum values per breath), were also interpolated to the imaging RT. Masks of the cerebrospinal fluid and white matter were computed from the structural images of participants using the FAST program in FSL, then moved into the functional space of the resting state and extracted as time series. The RVT, the RR cardiac interval, PETCO2 [Peng et al., 2013; Wise et al., 2004], O2 saturation, and cerebrospinal fluid and white matter time series were then included into a multivariate linear regression model to account for significant influences of these potentially confounding factors on the blood O2 level‐dependent (BOLD) signal and were regressed out.
Statistical images were then registered to high‐resolution structural and standard space images using FLIRT [Jenkinson and Smith, 2001], and further refined using FNIRT nonlinear registration.
Block design fMRI
Preprocessing steps were the same as for resting state fMRI except for the use of MELODIC, and the addition of high‐pass temporal filtering (Gaussian‐weighted least‐squares straight line fitting with sigma = 36 s). At the single level analysis, a general linear model was used and confounding covariates (RVT, PETCO2, RR cardiac interval, O2 saturation, cerebrospinal fluid and white matter, head motion) were regressed out. A voxel‐wise statistical analysis was extended to a second (group) level in a fixed‐effects analysis, and between‐group differences were then performed with the control > COPD contrast, adjusted for differences in PaO2. To correct for multiple comparisons, each cluster's estimated significance level (using Gaussian random field theory) was compared with the cluster probability threshold (Z > 4, P < 0.05). Statistical images were then registered to high‐resolution structural and standard space images using FLIRT [Jenkinson and Smith, 2001] then further refined using FNIRT nonlinear registration.
Regions of Interest (ROIs) Selection and Functional Connectivity During Resting State and Inspiratory Load Design
We used a supplementary algorithm implemented in FSL to specifically remove the effect of timepoints due to large head motions, during resting state and block design imaging. The effects of these timepoints on the analysis can be completely removed without adversely affecting the validity of the statistical results [Power et al., 2012]. This approach is designed to deal with the effects of intermediate to large movements, which corrupt images beyond anything that the linear motion parameter regression methods can fix. The method is based on the root mean square (rms) intensity difference between volume N and volume N + 1 [Power et al., 2012]. The participants did not differ significantly regarding motion or average root mean square (rms) movement at rest (controls, 0.11 ± 0.04 mm; COPD, 0.15 ± 0.09 mm), or during the block design (controls, 0.14 ± 0.07 mm; COPD, 0.18 ± 0.05 mm). We selected the seven regions of interest (ROIs) based on between‐group differences in the inspiratory load block design according to the control > COPD contrast. The seeds thus identified for the functional connectivity analyses were located in the right motor (RMC) cortex, left premotor cortex (LMC), right and left primary somatosensory cortex (LSC, RSC), medulla‐pons (MP) region of the brainstem, cerebellum, and left anterior insula (Fig. 1), according to the MNI structural and Juelich histological atlases in FSL (Supporting Information Table S1). A supplementary seed region was located in the left primary and premotor cortex and was related to the hand movement (HM) block design (LMC‐HM, Fig. 1 top panel). All seeds had the same volume (15 voxels, 120 mm3). The time series of the ROIs was extracted, by averaging the time series of all voxels within each ROI. The whole‐brain time series was also extracted and functional connectivity was processed in Matlab R2014b software (Mathworks) using a custom‐written program. The time series were first filtered between 0.01 and 0.1 Hz to remove the effects of very low frequency drift and high‐frequency noise [Fox and Raichle, 2007]. A partial correlation analysis was then performed between the seed region and the whole brain while controlling for the six rigid‐body motion parameters. These parameters were previously estimated from the motion correction of the resting state and block design functional images. The resulting processed image was a correlation coefficient map providing a quantitative assessment of correlation strength. Voxelwise statistical analyses of the functional connectivity map were performed using non‐parametric permutation testing and randomize in FSL 5.0 [Winkler et al., 2014]. The number of permutation tested was 5,000 and statistics were performed using threshold‐free cluster enhancement. Within‐ and between‐group differences were assessed using t‐tests, with voxels considered significant when P < 0.05 after family‐wise error (FWE) correction. To demonstrate the robustness of our findings against potential movement confounds, we computed correlations between movement parameters (average rms) and whole‐brain BOLD signals. We found no within‐ and between‐group correlations that might have corrupted our connectivity analyses during resting state or block design imaging. Given our focus on the respiratory neural network, we used a specific search volume for multiple comparisons. The anatomic mask was derived from the Juelich histological atlas in FSL and encompassed the entire primary and premotor cortex, the primary somatosensory cortex and the brainstem. This established method reduces the number of necessary corrections for multiple comparisons from the whole brain to relevant target brain areas. Between‐groups comparisons were performed while controlling for the PaO2 covariate.
Figure 1.
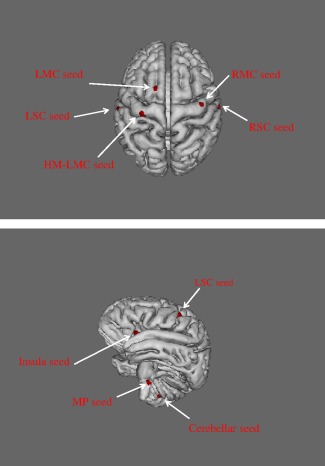
Location of the seed regions (red surface) for functional connectivity analyses: the seeds were selected during an inspiratory loading block design paradigm by using a between groups voxel‐wise contrast, controls > COPD. Top panel: the LMC seed was located in the left premotor cortex while the LSC seed belonged to the primary somatosensory cortex. The RMC seed was in the right primary and premotor cortex and the RSC seed in the right somatosensory cortex; the LMC‐HM seed (left motor cortex related to hand movements) was identified by block‐design imaging during repeated wrist extension. Bottom panel: the insula seed was in the left anterior part of the insula. The cerebellar seed was in the left cerebellar hemisphere. The MP (medulla and pons) seed was in the rostral medulla and caudal pons at the level of the fissura pontomedullaris.
We also used a one‐sample t‐test with additional covariates using the general linear model as implemented in FSL, to obtain inferences for the linear relationships between the chosen covariates (lung function (FEV1, FEV1/FVC, and TLC) and PaO2 in controls; illness severity (dyspnea, lung function, GOLD, and BODE scores), etiology (COPD vs. genetic emphysema), and PaO2 in patients) and the dependent variable (the connectivity map). We then ran randomize and permutations testing with the appropriate contrasts.
Granger Causality Analysis (GCA)
We used only six regions for the GCA to allow an accurate analysis of the network using a linear multivariate model. The six selected seed regions were the LMC, RMC, LSC, RSC, MP, and insula. Each seed region was previously regressed out for confounding covariates (RVT, PETCO2, RR cardiac interval, O2 saturation, cerebrospinal fluid and white matter and head motion). Resting‐state and inspiratory load time series were extracted by averaging the time series of all voxels within it. BOLD time series were demeaned and detrended. In addition, blind deconvolution of the hemodynamic response function was performed to retrieve the underlying neuronal process [David et al., 2008; Schippers et al., 2011; Wu et al., 2013].
In 1969, Granger introduced the idea of G‐causality in terms of linear regression modeling [Granger 1969]. A variable X 2 “Granger causes” a variable X 1 if the inclusion of past observations of X 2 reduces the prediction error of X 1 in a linear regression model of X 1 and X 2, compared with a model including only previous observations of X 1. To illustrate G‐causality, let us suppose that the temporal dynamics of two time series X 1 (t) and X 2 (t) (both of length T) can be described by a bivariate autoregressive model:
where p is the maximum number of lagged observations included in the model (the model order, p < T), A contains the coefficients of the model, and ξ1, ξ2 are the residuals (prediction errors) for each time series. If the variance of ξ1 (or ξ2) is reduced by including the X 2 (or X 1) terms in the first (or second) equation, then it is said that X 2 (or X 1) G‐causes X 1 (or X 2). Assuming that X 1 and X 2 are covariance stationarity (i.e., have unchanging mean and variance), the magnitude of this interaction can be measured by the log ratio of the prediction error variances for the restricted (R) and unrestricted (U) models:
where ξ 1 R (12) is derived from the model omitting the A 12 ,j (for all j) coefficients in the first equation and ξ1 U is derived from the full model. Importantly, it is possible to generalize to the multivariate (conditional) case in which the G‐causality of X 2 on X 1 is tested in the context of multiple additional variables X 3 … Xn [Geweke, 1982]. We estimated the information flow in the network using the multivariate granger causality (MVGC) toolbox in MATLAB R2014b [Barnett and Seth, 2014]. See Supporting Information for additional methods.
Mathematical Model of the Brain Neural Network
We derived our model from the discrete version of the FitzHugh‐Nagumo model by adding the Heaviside step function H(x). Discrete time models, known as “map‐based” models, reproduce the basic activity modes of neurons such as spiking, bursting, chaotic spiking‐bursting, subthreshold oscillations, tonic and phasic spiking, and normal excitability of real biological neurons [Courbage et al., 2007]. However, their mathematical structure is simpler than that of the FN model. In a previous study, we used our model to simulate respiratory rhythmogenesis with two synchronized map‐based models working in tandem, and we were able to reproduce the basic activity modes of neurons involved in the automatic respiratory network in healthy humans and patients with COPD [Hess et al., 2013].
Here, each neural cluster was modeled using the two‐dimensional original Courbage‐Nekorkin‐Vdovin map [Courbage et al., 2007; Courbage and Nekorkin 2010].
| (1) |
where x qualitatively defines the dynamics of the membrane potential of the neuron and y is the common variable specifying the dynamics of all outward ionic currents (recovery variable); β and d controls the threshold properties of the oscillation; ɛ is a positive parameter setting the time scale of the recovery variable y; J is associated with neuron excitability properties; F(x) is a piece‐wise linear version of the cubic function in the FN model:
where m 0 is a parameter that changes the recovery phase of the action potential and m 1 represents a balance between the excitation and the recovery phase. The parameter a changes the firing threshold of the neuron. We added Gaussian white noise activity to each neuron cluster with mean 0 and standard deviation 0.01.
In Eq. (1), I syn is the chemical synaptic coupling between neurons:
where K is the coupling strength, whose value is positive for excitatory synapse and negative for inhibitory synapse and rect is the rectangle function as described below:
where ni is the step of the ith spike in the presynaptic neuron and τ is a fixed time window during which the action potentials are considered before the synapse is reset. Δ characterizes the transmission time through the synapse. Finally, there are two parameters, K and Δ, which characterize the chemical synaptic junction between two neurons. This model allows an assessment of how correlation and causality inferences are shaped by different network characteristics, such as synaptic parameters (K and Δ), neuron excitability J, and the threshold property a. See Supporting Information for additional methods.
RESULTS
Demographic and Clinical Variables
Table 1 and Supporting Information Table S2 compare the demographic and clinical variables in the controls and patients. The patients did not differ from the controls in terms of age, gender, body mass index, or PaCO2 (partial pressure of carbon dioxide in arterial blood). The two groups differed significantly in terms of PaO2. Supporting Information Figure S4 reports RVT, PETCO2, and O2 saturation during resting‐state and block design fMRI in controls and patients. Supporting Information Figure S5 reports the mouth pressure, as an index of respiratory muscle effort, during block design fMRI in controls and patients (Unloaded breathing in controls: −4 ± 2 cmH20, COPD: −5 ± 2 cmH20; Loaded breathing in controls: −38 ± 18 cmH20, COPD: −40 ± 17 cmH20)
Table 1.
Characteristics of the participants
| Controls (n = 15) | COPD (n = 15) | P | |
|---|---|---|---|
| Age (yr) | 55 ± 9 | 56 ± 11 | NS |
| Gender (M/F) | 8/7 | 9/6 | NS |
| Height (m) | 1.71 ± 0.09 | 1.70 ± 0.1 | NS |
| Weight (kg) | 69 ± 16 | 66 ± 13 | NS |
| Body mass index | 23 ± 3 | 23 ± 3 | NS |
| FEV1/FVC (% predicted) | 79 ± 5 | 38 ± 10 | <0.001 |
| FEV1 (% predicted) | 108 ± 14 | 47 ± 23 | <0.001 |
| RV (%predicted) | 103 ± 17 | 197 ± 57 | <0.001 |
| TLC (%predicted) | 110 ± 14 | 129 ± 18 | <0.001 |
| PaO2 (kPa) | 12 ± 2 | 9.5 ± 1 | <0.001 |
| PaCO2 (kPa) | 5.3 ± 0.4 | 5 ± 0.5 | NS |
| Dyspnea at rest (MRC) | 2.3 ± 0.7 | ||
| Dyspnea during insp load (MRC) | 2.2 ± 0.6 | 2.7 ± 0.6 | <0.05 |
| BODE score | 4.5 ± 2 |
Values are mean ± SD unless otherwise indicated. Pulmonary function parameters: FEV1/FVC forced expiratory volume in 1 s/forced vital capacity.
FEV1: forced expiratory volume in 1 s; RV: residual volume; TLC: total lung capacity; PaO2: partial pressure of oxygen in arterial blood; PaCO2: partial pressure of carbon dioxide in arterial blood; Insp: inspiratory; MRC, Medical Research Council scale for dyspnea; BODE: body mass index, airflow obstruction, dyspnea, and exercise capacity index; NS: not significant.
Structural Magnetic Resonance Imaging (MRI)
There were no significant between‐group differences in gray or white matter volumes. Thus, none of the patients had cerebral atrophy (Supporting Information Table S3). Seed volumes showed no cerebral significant difference between the two groups.
Distribution of Functional MRI (fMRI) Activation During Inspiratory Loading
Figure 2 reports the distribution of cerebral activations during inspiratory loading (50cmH2O/L/s) in the controls and patients. Corresponding coordinates in MNI space are shown in Supporting Information Table S4. Areas activated in both groups were the left and right primary and premotor cortex (LMC, RMC), primary somatosensory cortex (LSC, RSC), secondary somatosensory cortex, basal ganglia (caudate and putamen nuclei (CP)), part of the limbic system including the left anterior insular cortex, the superficial group of the amygdala and the thalamus (P corrected threshold <0.05). All participants exhibited significant BOLD signal alterations of the brainstem (medulla and pons (MP)) and cerebellum (P corrected threshold <0.05). We selected seven regions of interests (ROIs) exhibiting significant BOLD signal variations according to the controls > COPD contrast: LMC and RMC, LSC and RSC, MP, cerebellum, and left anterior insula (Fig. 1, Supporting Information Table S1).
Figure 2.
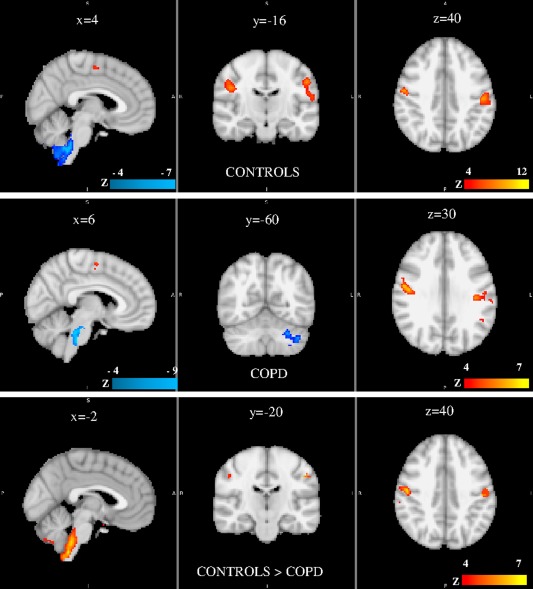
Group results of brain activation associated with inspiratory load as compared with unloaded breathing in controls (top), COPD (middle), and control > COPD contrast (bottom). Significant region are displayed with a threshold Z > 4 and a cluster probability threshold P < 0.05 (corrected for multiple comparisons using random field theory). Coordinates of clusters are given in Supporting Information Table S4. No significant cluster was evidence for the COPD > control contrast. Sagittal, coronal and axial slices are shown. See text for comments. S: superior, I: inferior, R: right, L: left, P: posterior.
Functional Connectivity During Resting State
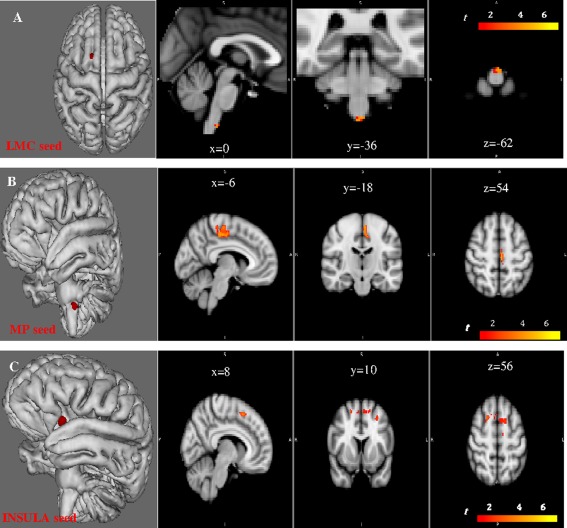
We first evaluated functional connectivity in each group (Figs. 3 and 4). The LMC seed exhibited significant connectivity with the contralateral primary motor, premotor, and primary somatosensory areas and the ipsilateral primary somatosensory area in both groups (P <0.01, FWE‐corrected). Connectivity of the LMC area extended to the MP region only in controls (Fig. 3A, Supporting Information Table S5). The RMC seed showed significant connectivity with the contralateral primary, premotor, and primary somatosensory areas and the ipsilateral somatosensory area in both groups (P <0.01, FWE‐corrected). Connectivity of the RMC area extended to the MP only in the controls (Fig. 3B, Supporting Information Table S5). The LSC displayed connectivity with the right primary somatosensory cortex, the left and right motor and premotor cortex in both groups (P <0.01, FWE‐corrected), and with the medulla only in the controls (Fig. 4A, Supporting Information Table S5). The MP seed had significant connectivity with the right premotor and primary motor cortex, the right and left somatosensory cortex in the controls (Fig. 4B, Supporting Information Table S5) but had no significant connectivity with the motor or somatosensory cortex in the patients. The cerebellar seed had significant correlations with the left and right primary and premotor cortex, the left and right primary somatosensory cortex only in the controls, and with the dorsal medulla and pons in both groups (Fig. 4C, Supporting Information Table S5). The RSC seed showed significant correlations with the left primary somatosensory, the left and right premotor and primary motor cortex in both groups (P <0.01, FWE‐corrected) (Supporting Information Fig. S6A and Table S5). The left anterior insula exhibited connectivity with the right and left somatosensory cortex, right and left motor and premotor cortex, and medulla‐pons in both groups (P <0.01, FWE‐corrected) (Supporting Information Fig. S6B and Table S5).
Figure 3.
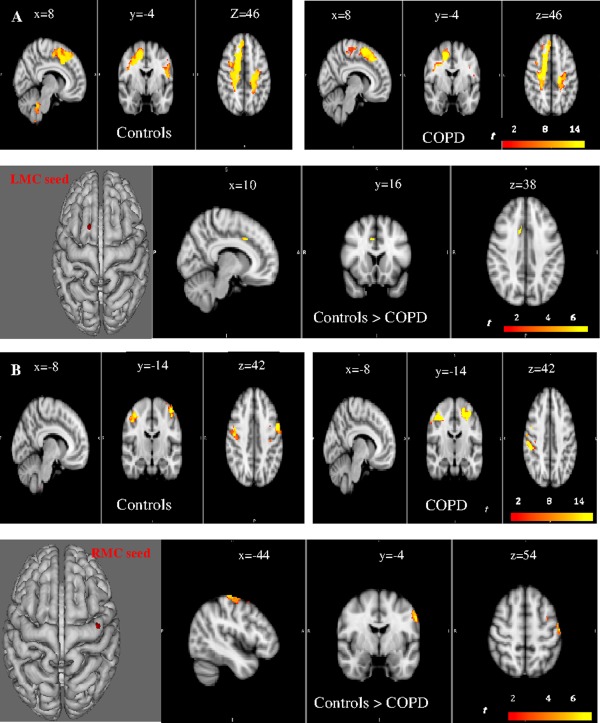
Voxel‐wise functional connectivity analyses at rest for the LMC (Left motor cortex, A) and RMC (right motor cortex, B) seeds. Sagittal, coronal and axial slices are shown. Within (P < 0.01, FWE‐corrected) and between‐group (P < 0.05, FWE‐corrected) differences are reported. A decreased connectivity of the networks linked with the right and left motor cortex seed regions is evident with contralateral motor area in the COPD group, as compared with controls. S: superior, I: inferior, R: right, L: left, P: posterior.
Figure 4.
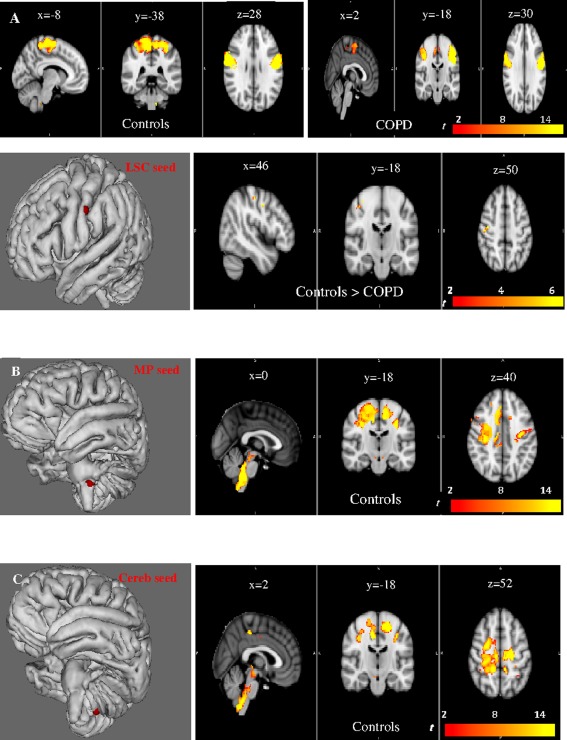
Voxel‐wise functional connectivity analyses at rest for the LSC (Left sensory cortex, A), the MP (medulla and pons, B), and cerebellar (C) seeds. Sagittal, coronal, and axial slices are shown. Within (P < 0.01, FWE‐corrected) and between‐group (P < 0.05, FWE‐corrected) differences are reported for the LSC seed. A significant lower connectivity is apparent for the network linked with the LSC seed in the right motor and somatosensory cortex in COPD, as compared with controls (A). The MP (B) and cerebellar (C) seeds exhibit correlations with the motor and sensory cortex only in the controls (P < 0.01, FWE‐corrected). S: superior, I: inferior, R: right, L: left, P: posterior.
We then assessed between‐group differences in connectivity patterns for each seed (Figs. 3 and 4). In the patients, we identified significantly lower connectivity for the networks linked with the LMC, RMC, and LSC seeds, compared with the controls (P < 0.05, FWE‐corrected) (Figs. 3A,B and 4A, Supporting Information Table S5). Of note, with the wrist‐extension block design, no between‐groups differences were present with the LMC‐HM seed and the contralateral motor and premotor cortex (Supporting Information Fig. S6C). This finding supports the specificity of our results regarding the motor area for the respiratory muscles.
Relationships of Functional Connectivity During Resting State With Lung Function and Illness Severity
In the controls, the LMC network linearly associated with PaO2 was the ventral medulla (P <0.05, FWE‐corrected) (Fig. 5A). The MP network associated with PaO2 was the left motor and premotor cortex (P <0.05, FWE‐corrected) (Fig. 5B). Finally the Insula network had relationships with the lung function parameter FEV1/FVC in the right and left premotor cortex (P <0.05, FWE‐corrected) (Fig. 5C).
Figure 5.
In the control group (n = 15), the regions of the brain that correlate with the seeds and associated with clinical parameters are indicated. From top to bottom: the LMC seed network associated with PO2 is the ventral medulla (P < 0.05, FWE‐corrected). (A) The left motor and premotor cortex (x = −6, y = −18, z = 54) associated with the MP seed region is also linked with PO2 (P < 0.05, FWE‐corrected). (B) The network connected with the insula seed had relationships with pulmonary function FEV1/FVC in the right (x = 20, y = −10, z = 56, MNI space) and left (x = −6, y = 10, z = 56) premotor cortex (P < 0.05, FWE‐corrected). S: superior, I: inferior, R: right, L: left, P: posterior.
In the patients, the RMC network correlated with the BODE severity score in the left primary motor cortex and in the right somatosensory cortex (P < 0.05, FWE‐corrected) (Fig. 6A). The LSC network correlated with the BODE score in the contralateral somatosensory cortex (P <0.05, FWE‐corrected) (Fig. 6B). The RSC network had linear relationships with TLC in the right premotor and left somatosensory cortex (P <0.05, FWE‐corrected) (Fig. 6C). Finally, the Insula network was linked with TLC in the dorsal pons, and with dyspnea in the right premotor cortex (P <0.05, FWE‐corrected) (Fig. 6D). No significant associations were evidenced between the networks and the etiology of the disease.
Figure 6.
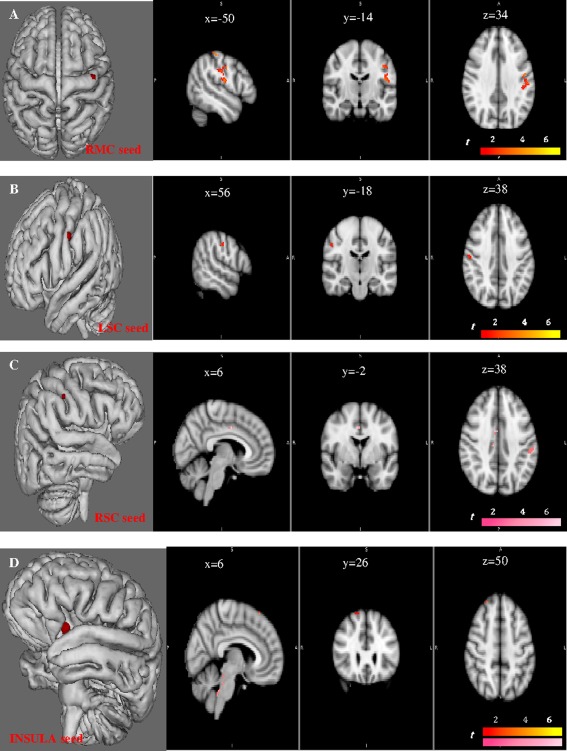
The correlations that associate each network of the RMC, LSC, RSC, and insula seeds with lung function and severity in the COPD group (n = 15) are shown. The network connected with the RMC seed region correlates with the BODE severity score in the left primary motor cortex (x = −48, y = −10, z = 34) and in the right somatosensory cortex (x = −46, y = −18, z = 34) (P < 0.05, FWE‐corrected) (A). It is also associated with PO2 in the left primary motor cortex (P < 0.05, FWE‐corrected). The network associated with the LSC seed region correlates with the BODE score in the contralateral somatosensory cortex (x = 56, y = −18, z = 39) (B). The network linked with the RSC seed region correlates with TPC (pink color) in the right premotor (x = 6, y = −2, z = 38) and left somatosensory cortex (x = −52, y = −28, z = 38) (C). Finally, the network associated with the Insula seed is also linked with TPC in the dorsal pons, and with the dyspnea in the right premotor cortex (x = 26, y = 36, z = 50) (D).
Functional Connectivity During Inspiratory Loading
We first evaluated functional connectivity in each group (Supporting Information Figs. S6D and S7). The LMC seed exhibited significant connectivity with the contralateral primary motor, premotor, and primary somatosensory areas and the ipsilateral primary somatosensory area in both groups (P < 0.01, FWE‐corrected) (Supporting Information Fig. S6D and Table S6). Connectivity of the LMC area extended to the MP region only in the controls. The RMC seed showed significant connectivity with the contralateral primary, premotor, and primary somatosensory areas and the ipsilateral somatosensory area in both groups (P <0.01, FWE‐corrected) (Supporting Information Fig. S7A and Table S6). Connectivity of the RMC area extended to the MP only in the controls. The LSC displayed connectivity with the right primary somatosensory cortex, left and right motor and premotor cortex, and midbrain in both groups, and with the medulla only in the controls (P <0.01, FWE‐corrected) (Supporting Information Fig. S7B and Table S6). The RSC seed showed significant correlations with the left primary somatosensory, left and right premotor and primary motor cortex in both groups, and with the medulla only in the controls (P <0.01, FWE‐corrected) (Supporting Information Fig. S7C and Table S6). The MP seed had significant connectivity with the right and left premotor, primary motor, and somatosensory cortex in the controls, and only with the right and left premotor cortex in the patients (P < 0.01, FWE‐corrected) (Supporting Information Fig. S7D and Table S6). The cerebellar seed had significant connectivity with the right and left premotor, primary motor, somatosensory cortex, and medulla in the controls (P < 0.01, FWE‐corrected), and with the left sensorimotor and premotor cortex in the patients (P <0.01, FWE‐corrected) (Supporting Information Fig. S7E and Table S6). The left anterior insula exhibited connectivity with the right and left somatosensory cortex, right and left motor and premotor cortex, midbrain and pons in controls (P < 0.01, FWE‐corrected, Supporting Information Table S6, figure not shown). In the patients, the network was constrained to the right and left somatosensory, left motor cortex and to the midbrain (P < 0.01, FWE‐corrected, Supporting Information Table S6, figure not shown).
We then assessed between‐group differences in connectivity patterns during inspiratory loading (Supporting Information Figs. S6D and S7A). In the patients, we identified significantly lower connectivity for the networks linked with the LMC and RMC seeds, compared with the controls (P <0.05, FWE‐corrected).
Granger Causality Analysis (GCA)
In the controls at rest, the MP region exerted a significant causal influence on the entire sensorimotor network (Figs. 7, left and 8A, Supporting Information Table S7). In the patients group, the right and left motor cortical area were both causal sources, whereas the MP was a causal sink (Figs. 7, right and 8B, Supporting Information Table S7). No between‐group differences were evidenced at rest. During inspiratory loading in the controls, the right and left motor cortex exerted a causal influence on the entire network (Figs. 9, left and 10A), whereas in the patients, the situation was reversed, with both region being causal sinks (Figs. 9, right and 10B, Supporting Information Table S7). Between‐group differences during inspiratory loading indicated a greater influence of the motor cortex as causal sources of the network in the controls, compared with the patients (Fig. 9, bottom).
Figure 7.
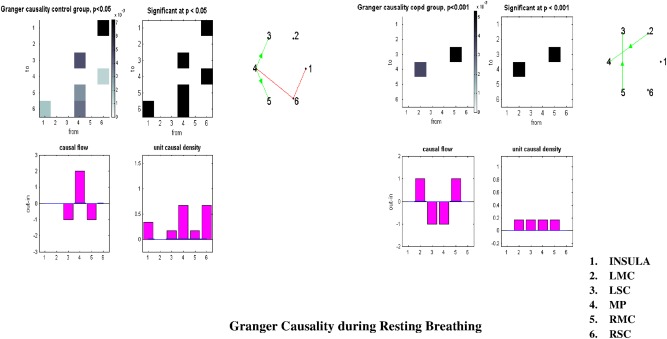
Granger causality analysis at rest between the six selected regions at rest. Control group results are reported on the left, COPD group results on the right. See text for comments. LMC: left premotor cortex, LSC: left primary somatosensory cortex, MP: medulla and pons, RMC: right motor and premotor cortex, RSC: right primary somatosensory cortex.
Figure 8.
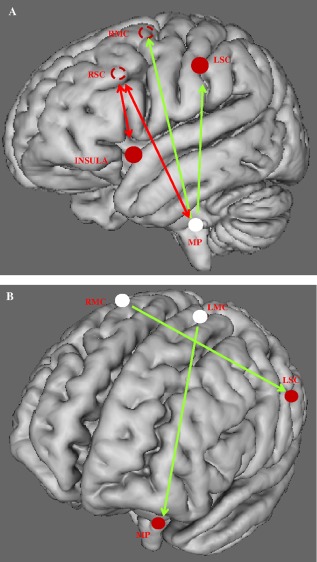
Communication within the respiratory neural network assessed through Granger's predictability during resting breathing in the control (A), and COPD (B) groups. Schematic representation of the six‐seed regions (circle) on a 3D brain. Full circles are seed regions in the ipsilateral areas of the hemisphere. Dotted circles represent the projection of the seed regions located in the contralateral hemisphere. Sources of the network are shown in white. Green arrows show unidirectional, while red arrows show bidirectional information flow. See text for comments.
Figure 9.
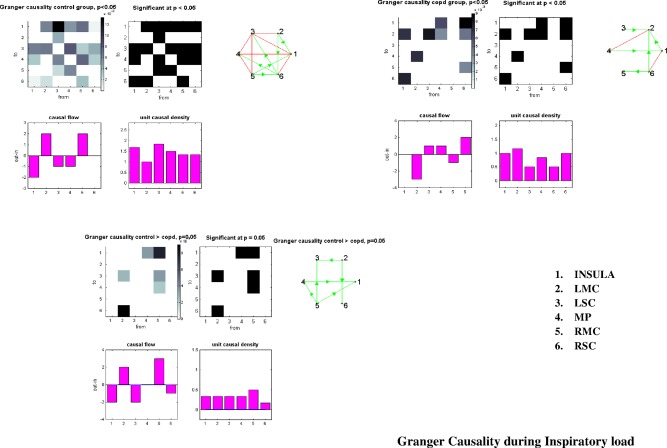
Granger causality analysis between the six selected regions during inspiratory loading. Control group results are reported on the top left, COPD group results on the top right, and controls > COPD at the bottom. See text for comments. Same abbreviations as in Figure 7.
Figure 10.
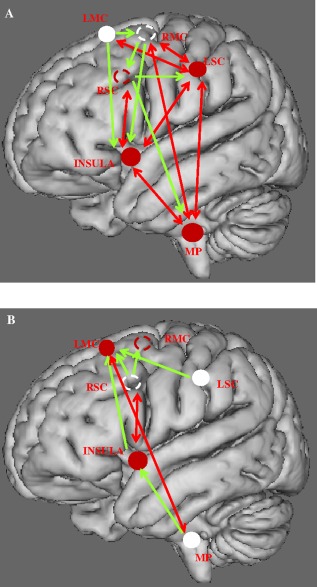
Communication within the respiratory neural network assessed through Granger's predictability during inspiratory loading in the control (A) and COPD (B) groups. Same legend as in Figure 8. Red arrows show bidirectional information flow. See text for comments.
Relationships of Granger Causality With Clinical Data and Illness Severity
During breathing at rest, no correlation was noted between Granger amplitude and clinical data or illness severity in the controls and patients, respectively. During inspiratory loading in the controls, the Granger causality amplitude from the LSC to the insula showed a significant linear relationship with FEV1 (R = −0.7, P < 0.01) while the amplitude from the Insula to the LSC was associated with PaO2 (R = −0.6, P = 0.01). Granger causality amplitude from the MP to the RMC showed significant relationship with dyspnea (R = −0.6, P = 0.05). Causality from the RMC to MP was associated with FEV1 (R = −0.7, P < 0.01).
During inspiratory loading in patients with COPD, we found an association between FEV1 and causality from the insula to the LMC (R = 0.6, P < 0.05). The Granger amplitude from the MP to the LMC correlated with TLC (R = −0.65, P = 0.01). Causality from the LMC to the MP was associated with FEV1/FVC (R = 0.5, P = 0.05).
Mathematical Model of Neural Network
To study connectivity, we simulated a network of two spiking neurons having different values for excitability (J) and different motor threshold (a). Supporting Information Figure S3 reports the results after convolution. Increasing the excitability of the two neurons significantly reduced the connectivity (Supporting Information Fig. S3B). Decreasing a, to replicate a decrease in the neuronal motor threshold, also lessened connectivity (Supporting Information Fig. S3C). We then simulated the network in a control, using specific values for J and a; and in a patient, using a higher value for J and lower value for a. The results indicated weaker network connectivity in the patient (Supporting Information Fig. S3D). In addition, reducing K (strength) and increasing Δ (delay) resulted in diminished connectivity (Supporting Information Fig. S8A). Supporting Information Figures S8 and S9 show Granger causality directionality for different values of K and Δ. These parameters provide most of the control of directionality in a network of spiking neurons with two or three nodes (Supporting Information Figs. S8 and S9). Of note, increasing neuronal excitability (J) or the network noise of two spiking neurons did not significantly change directionality.
DISCUSSION
We report the first characterization of the functional architecture and causal relationships of the brain neural network controlling the respiratory muscles at rest and during inspiratory loading in healthy individuals and patients with COPD. When breathing at rest and during inspiratory loading, the motor cortex area in the patients had weaker connectivity with their contralateral counterparts, compared with controls, and no connectivity with the brainstem. GCA in the patients breathing at rest and during inspiratory loading showed a reversal of the roles of the MP and motor cortex compared with controls. Moreover, network connectivity and causality findings were related to lung function and illness severity in the patients. Finally our mathematical model of the network provided theoretical insights, at the neuronal scale, into effects on correlation and causality inferences of various characteristics such as synaptic parameters and neuron excitability.
Functional Connectivity of the Network
Sensorimotor network
Synchronization of the sensorimotor network controlling the respiratory muscles was impaired in patients with COPD. This result is in line with previous TMS and electroencephalography studies showing impaired information processing in the motor and sensory cortex in patients with obstructive lung disease [Davenport et al., 2000; Hopkinson et al., 2004]. Transcranial magnetic stimulation in patients with COPD showed that the motor cortex driving the diaphragm had a low motor threshold, high excitability level, and ceiling effect [Hopkinson et al., 2004]. In our mathematical model of two connected spiking neurons, decreasing the motor threshold a, or increasing neuronal excitability J lessened functional connectivity (Supporting Information Fig. S3). Thus, the mathematical model helps to understand which mechanism, at the neuronal scale, may induce the change in connectivity.
We previously showed that patients with COPD had high excitability of the brainstem respiratory neuronal group responsible for respiratory rhythmogenesis [Hess et al., 2013]. Specifically, increasing neuronal excitability may enhance diaphragm recruitment in order to cope with overloading [Hess et al., 2013; Topelli et al., 2001]. Our finding of high neuronal excitability responsible for decreased functional connectivity of the motor cortex is probably due in part to the cerebral consequences of the chronic respiratory overload, impaired sensory afferents from the respiratory muscles and lungs, and hypoxia: (i) chronic inflammation of the distal airways leads to increases in airway tree resistance and, subsequently, in ventilatory loads. Increased loading induces a reflex augmentation in breathing effort with elevated respiratory muscle tension. Respiratory sensory receptors are activated and relay neuronal impulses to the central nervous system, either via the brainstem or directly to the sensory cortex. (ii) In patients with COPD, impaired neuronal inputs from the respiratory muscles [Otttenheljm et al., 2007] and lungs are transmitted to the sensory cortex. Importantly, an electroencephalogram study established that patients with severe asthma, a lung disease characterized by acute episodes of airway obstruction, had impaired neuronal processing of afferent mechanosensory signals in the somatosensory region of the cerebral cortex [Davenport et al., 2000]. We found that the connectivity of the left somatosensory seed region was decreased in patients, compared with controls. Although the pathophysiology of asthma and COPD differ, the development of these two diseases may share a number of mechanisms [De Marco et al., 2013] related to impaired central information processing; (iii) sustained hypoxia depresses the sensory processing of respiratory load increases in healthy individuals [Eckert et al., 2005]. In the controls, we found that the left motor region and part of its correlated network exhibited associations with PaO2 in the medulla (Fig. 5A). The O2 chemosensitive network is distributed throughout the brainstem, particularly in the medulla [Neubauer and Sunderram, 2004]. Alterations of central O2‐sensitive neurons during chronic hypoxia probably contribute to the blunted connectivity of the somatosensory network in patients with COPD. Thus, we found no significant association between the somatosensory network and PaO2 in the patient group. We found evidence of profound network disorganization in the COPD group with complete absence of functional connectivity linking the sensorimotor cortex to the brainstem, either at rest or during inspiratory loading.
Furthermore, the sensorimotor network correlated significantly with COPD severity. Connectivity of the right motor and left somatosensory cortex was associated with the BODE score (P < 0.05, FWE‐corrected) (Fig. 6). These associations are meaningful since the BODE score is a major marker for COPD severity that combines BMI, FEV1, the MRC dyspnea score, and the 6‐min walking distance. The specificity of the target neural network is supported by our findings that cerebral activations during HM‐block design imaging showed no differences between the patients and controls. In line with this result, patients with COPD has increased motor cortex excitability of the diaphragm, as assessed using TMS, with no increase in excitability of the corticospinal pathways driving the quadriceps muscle [Hopkinson et al., 2004].
Insula network
In our patients, the insula seed region and part of its correlated network, i.e., the premotor cortex, is associated with the dyspnea severity (Fig. 6D). The Insula is an integrated sensorimotor area of the limbic system whose anterior part is activated in response to inspiratory loading, either bilaterally [Banzett et al., 2000; Evans et al., 2002] or unilaterally [Peiffer et al., 2001; Von Leupold et al., 2008]. The insula plays a key role in dyspnea perception. Medullary respiratory neurons, chemoreceptors and pulmonary stretch receptors project to the Insula. The Insula also has more distant connections projecting to the supplementary motor area and receives afferents from the somatosensory and prefrontal cortex.
Granger Causality Analysis (GCA) of the Network
As expected in the controls at rest, the MP exerted a significant causal influence on the entire network, whereas the sensory‐motor cortex was causal sink. Conversely in the patients, the motor cortex was a neural driver, whereas the MP was a causal sink. Thus, the neural driver of the network shifted in the patients from the medulla to the motor cortex. The functional role of the motor cortex is disproportionate in patients during breathing at rest. During inspiratory loading, the right and left motor cortex were both neural drivers in the controls, and sinks in the patients. The motor network, already overburdened at rest is overwhelmed during inspiratory loading. This major finding may help to understand why patients with COPD are particularly prone to acute respiratory failure. The results at rest and during inspiratory loading also illustrate the degeneracy of respiratory‐network directionality during lung disease [Edelman and Gally, 2001]. Degeneracy, the ability of structurally different elements to perform the same function or yield the same output, is a well‐known physiological characteristic of neural networks. We postulate that lung disease forces the brain network to adapt, and that the effects on the respiratory motor cortex are hyperexcitability, decreased functional connectivity, and loss of its major role in driving the network during inspiratory loading.
Most of the salient changes related to degeneracy are thought to occur at synapses. Many distinct forms of synaptic plasticity have been studied. The results show that intercellular communication can be either potentiated or depressed [Edelman and Gally, 2001]. In line with these findings, our mathematical model identifies synaptic strength (K) and delay (Δ) as the main parameters controlling directionality in a network of spiking neurons with two or three nodes (Supporting Information Figs. S8 and S9). However, we predicted directionality for three nodes but were unable to replicate directionality above this threshold in a stable way because our simulated network had a weak chaotic dynamics [Courbage et al., 2007]. Linear predictability theory is no longer compatible with a chaotic regime. However, we hypothesize that, in patients with COPD, impairment of directionality translates at least in part alterations at the synaptic level.
Relationships of Granger causality with clinical data
During inspiratory loading, we found a bidirectional communication between the MP and RMC regions in the control group. The dyspnea negatively correlates with the statistical flow from the MP to RMC, the higher the dyspnea perception, the lower the flow. Both the MP and RMC neural structures of the network are required for the dyspnea perception. At a low level of load‐induced dyspnea, the main subcortical structures involved in the dyspnea perception in normal subjects are the medulla, the cerebellum and the Insula [Peiffer et al., 2001]. At a high level of load‐induced dyspnea, the sensorymotor cortex is activated [Von Leupoldt et al., 2008]. In controls, one would also have expected a positive relationship between the dyspnea perception and the flow from the RMC to the MP. However, it did not reach statistical significance with the 15 control subjects. During inspiratory loading in COPD, there was a significant positive relationship between the causal flow from the LMC to the MP regions and FEV1/FVC, the lower the pulmonary function, the lower the information flow. This finding reinforces our Granger causality results since the motor cortex is the causal sink of the network rather than the causal source. In patients, the motor network is already overburdened at rest and is becoming overwhelmed during inspiratory loading, justifying why the information flow is minimal in disease condition.
Study Limitations
We selected the seed regions based on significant BOLD signal alterations detected during block design imaging with the controls > COPD contrast. Therefore, this approach did not include the thalamus among seed regions although its role in gating respiratory sensory information to the cortex has been described in response to CO2 stimulation or during air hunger in healthy individuals [Evans et al., 2002; Pattinson et al., 2009]. We removed the noise from the resting state data using independent component analysis (ICA) as implemented in MELODIC (FSL software). This method has limitations as the determination of the proper dimensionality: a too restricted decomposition might fail in separating the noise from the biological signal whereas in case of a high model order dimensionality, ICA results may be split into a number of subnetworks, which may be difficult to identify and classify. We chose to constrain the number of components to 30, as the percentage of signal variance determined by the components was 80 ± 5% for all participants (Supporting Information Fig. S1A). The MP seed region is located in a region activated during inspiratory loading in the lateral part of the medulla and pons at the level of the Fissura Pontomedullaris (Fig. 1 and Supporting Information Fig. S10). It encompassed an important structure responsible for respiratory rhythmogenesis, the pre‐Bötzinger complex (Supporting Information Fig. S10). The diameter of the complex is around 5 to 6 mm, in the lateral region of the rostral medulla, 9 mm from the obex, below Fissura Pontomedullaris [Schwarzacher et al., 2011]. However, deciphering the brainstem region through fMRI is a difficult task. The Granger causality results in the control group show that the MP region is the source of the entire respiratory network, as expected for a pacemaker. This important functional argument reinforces the location of the MP seed as involving the nuclei of respiratory rhythmogenesis. Besides, we did not perform the right HM‐block design in all participants but rather carried out the task in one control and one patient. However, the coordinates of the cerebral activation area resulting from the hand movement (HM) was in agreement with a previous study [Sarfeld et al., 2012].
We found no between‐group differences in gray matter, white matter or seed region volumes, indicating that the patients had no cerebral atrophy, as reported previously [Dodd et al., 2012]. However, we cannot exclude the possibility that structural white matter abnormalities related to vascular alterations influenced our findings [Dodd et al., 2012; Lahousse et al., 2013]. We excluded patients with a history of stroke or other cardiovascular events to minimize any effect of cerebral vascular alterations on the results.
Future Directions
Our findings may open up new therapeutic avenues for COPD. Although brain networks are constrained by an anatomical structure, the strength of functional connectivity between network regions is dynamic. The intrinsic activity of the brain can be modulated using TMS [Eldaief et al., 2011]. Future works should determine how TMS of the brain, at different frequencies, affects the cortical networks, and, more specifically, the connectivity of the sensorimotor and the insular cortical areas. The results may indicate ways to improve respiratory muscle performance [Joundi et al., 2012], above all during increased loading, or clinical symptoms such as dyspnea in patients with COPD.
Supporting information
Supporting Information
Supporting Information Figure S1
Supporting Information Figure S2
Supporting Information Figure S3
Supporting Information Figure S4
Supporting Information Figure S5
Supporting Information Figure S6
Supporting Information Figure S7
Supporting Information Figure S8
Supporting Information Figure S10
Supporting Information Figure S11
Supporting Information Table S1
Supporting Information Table S2
Supporting Information Table S3
Supporting Information Table S4
Supporting Information Table S5
Supporting Information Table S6
Supporting Information Table S7
ACKNOWLEDGMENTS
Authors are grateful to the anonymous reviewers for the time and expertise they spent on our manuscript. L.M. designed the research; L.Y., M.D.M., A.H., Y.K., H.M., M.C., and L.M. performed the research; L.Y., M.D.M., A.H., M.C., and L.M. analyzed the data; F.R.A. and H.M. contributed inputs; L.M. and M.C. wrote the article.
Funding sources: PHRC APHP, Université Paris 7, Fondation du souffle, Chancellerie des Universités de Paris‐Legs Poix, Région île de France‐DIM‐Institut des Systèmes Complexes.
REFERENCES
- Andersson M, Jenkinson M, Smith SM (2007): Non‐Linear Registration, Aka Spatial Normalization. FMRIB Technical Report TR07JA2. Available at: http://www.fmrib.ox.ac.uk/analysis/techrep.
- Banzett RB, Mulnier HE, Murphy K, Rosen SD, Wise RJ, Adams L (2000): Breathleness in humans activates insular cortex. Neuroreport 11:2117–2120. [DOI] [PubMed] [Google Scholar]
- Barnett L, Seth AK (2014): The MVGC Multivariate Granger causality Toolbox: A new approach to Granger‐causal inference. J Neurosci Methods 223:50–68. [DOI] [PubMed] [Google Scholar]
- Beckmann CF, Smith SM (2004): Probabilistic independent component analysis for functional magnetic resonance imaging. IEEE Trans Med Imaging 23:137–152. [DOI] [PubMed] [Google Scholar]
- Birn R, Smith M, Jones T, Bandetti P (2008): The respiration response function: The temporal dynamics of fMRI signal fluctuations related to changes in respiration. Neuroimage 40:644–654. [DOI] [PMC free article] [PubMed] [Google Scholar]
- Celli BR, Cote CG, Marin JM, Casanova C, Montes de Oca M, Mendez RA, Pinto Plata V, Cabral HJ (2004): The body‐mass index, airflow obstruction, dyspnea, and exercise capacity index in chronic obstructive pulmonary disease. New Engl J Med 350:1005–1012. [DOI] [PubMed] [Google Scholar]
- Courbage M, Nekorkin VI, Vdovin LV (2007): Chaotic oscillations in a map based‐model of neural activity. Chaos 17:043109. [DOI] [PubMed] [Google Scholar]
- Courbage M, Nekorkin VI (2010): Map based models in neurodynamics. Int J Bif Chaos 20:1631–1651. [Google Scholar]
- Davenport PW, Cruz M, Stecenko AA, Kifle Y (2000): Respiratory‐related potentials in children with life‐threatening asthma. Am J Respir Crit Care Med 161:1830–1835. [DOI] [PubMed] [Google Scholar]
- David O, Guillemain I, Saillet S, Reyt S, Deransart C, Segebarth C, Depaulis (2008): Identifying neural drivers with functional MRI: An electrophysiological validation. PLoS Biol 6:e315. [DOI] [PMC free article] [PubMed] [Google Scholar]
- De Marco R, Pesce G, Marcon A, Accordini S, Antonicelli L, Bugiani M (2013): The coexistence of asthma and chronic obstructive pulmonary disease (COPD): Prevalence and risk factors in young, middle‐aged and elderly people from the general population. PLoS One 8:e62985. [DOI] [PMC free article] [PubMed] [Google Scholar]
- Dodd JW, Chung AW, Van den Broek MD, Barrack TR, Charlton RA, Jones PW (2012): Brain structure and function in chronic obstructive pulmonary disease. A multimodal cranial magnetic resonance imaging study. Am J Respir Crit Med 186:240–245. [DOI] [PubMed] [Google Scholar]
- Douaud G, Smith S, Jenkinson M, Behrens T, Johansen‐Berg H, Vickers J, James S, Voets N, Watkins K, Matthews PM, James A (2007): Anatomically related grey and white matter abnormalities in adolescent‐onset schizophrenia. Brain 130:2375–2386. [DOI] [PubMed] [Google Scholar]
- Eckert DJ, Catcheside PG, McDonald R, Adams AM, Webster KE, Hlavac MC, McEvoy RD (2005): Sustained hypoxia depresses sensory processing of respiratory resistive loads. Am J Respir Crit Care Med 172:1047–1054. [DOI] [PubMed] [Google Scholar]
- Edelman GM, Gally JA (2001): Degeneracy and complexity in biological systems. Proc Natl Acad Sci USA 98:13763–13768. [DOI] [PMC free article] [PubMed] [Google Scholar]
- Eldaief MC, Halko MA, Buckner RL, Pascual‐Leone A (2011): Transcranial magnetic stimulation modulates the brain's intrinsic activity in a frequency‐dependent manner. Proc Natl Acad Sci USA 108:21229–21234. [DOI] [PMC free article] [PubMed] [Google Scholar]
- Evans KC, Banzett RB, Adams L, McKay L, Frackowiak RS, Corfield DR (2002): BOLD fMRI identifies limbic, paralimbic, and cerebellar activation during air hunger. J Neurophysiol 88:1500–1511. [DOI] [PubMed] [Google Scholar]
- Fletcher CM (1960): Standardised questionnaire on respiratory symptoms: A statement prepared and approved by the MRC Committee on the Aetiology of Chronic Bronchitis (MRC breathlessness score). Brit Med J 2:1665. 13688719 [Google Scholar]
- Fox M, Raichle M (2007): Spontaneous fluctuations in brain activity observed with functional magnetic resonance imaging. Nat Rev Neurosci 8:700–711. [DOI] [PubMed] [Google Scholar]
- Gandevia SC, Rothwell JC (1987): Activation of the human diaphragm from the motor cortex. J Physiol 384:109–118. [DOI] [PMC free article] [PubMed] [Google Scholar]
- Geweke J (1982): Measurement of linear dependence and feedback between multiple time series. J Am Stat Assoc 77:304–313. [Google Scholar]
- Glover GH, Chang C (2009): Relationship between respiration, end‐tidal CO2, and BOLD signals in resting‐state fMRI. Neuroimage 47:1381–1393. [DOI] [PMC free article] [PubMed] [Google Scholar]
- Good CD, Johnsrude IS, Ashburner J, Henson RN, Friston KJ, Frackowiak RS (2001): A voxel‐based morphometric study of ageing in 465 normal adult human brains. Neuroimage 14:21–36. [DOI] [PubMed] [Google Scholar]
- Gozal D, Omidvar O, Kirlew KA, Hathout G, Hamilton R, Lufkin RB, Harper RM (1995): Identification of the human brain regions underlying responses to resistive inspiratory loading with functional magnetic resonance imaging. Proc Natl Acad Sci USA 92:6607–6611. [DOI] [PMC free article] [PubMed] [Google Scholar]
- Granger CWJ (1969): Investigatingcausal relations by econometric models and cross‐spectral methods. Econometrica 37:424–438. [Google Scholar]
- Hess A, Yu L, Klein I, De Mazancourt M, Jebrak G, Mal H, Brugière O, Fournier M, Courbage M, Dauriat G, Schouman‐Clayes E, Clerici C, Mangin L (2013): Neural mechanisms underlying breathing complexity. PLoS One 8:e75740. [DOI] [PMC free article] [PubMed] [Google Scholar]
- Hopkinson NS, Sharshar T, Ross ET, Nickol AH, Dayer MJ, Porcher R, Jonville S, Moxham J, Polkey MI (2004): Corticospinal control of respiratory muscles in chronic obstructive pulmonary disease. Respir Physiol Neurobiol 141:1–12. [DOI] [PubMed] [Google Scholar]
- Hyvärinen A (1999): Fast and robust fixed‐point algorithms for independent component analysis. IEEE Trans Neural Netw 10:626–634. [DOI] [PubMed] [Google Scholar]
- Isaev G, Murphy K, Guz A, Adams L (2002): Areas of the brain concerned with ventilatory load compensation in awake man. J Physiol 539:935–945. [DOI] [PMC free article] [PubMed] [Google Scholar]
- Jenkinson M, Smith S (2001): A global optimization method for robust affine registration of brain images. Med Image Anal 5:143–156. [DOI] [PubMed] [Google Scholar]
- Jenkinson M, Bannister P, Brady M, Smith S (2002): Improved optimisation for the robust and accurate linear registration and motion correction of brain images. Neuroimage 17:2825–2841. [DOI] [PubMed] [Google Scholar]
- Jolley CJ, Luo YM, Steier J, Reilly C, Seymour J, Lunt A, Ward K, Rafferty GF, Polkey MI, Moxham J (2009): Neural respiratory drive in healthy subjects and in COPD. Eur Respir J 33:289–297. [DOI] [PubMed] [Google Scholar]
- Joundi RA, Jenkinson N, Brittain J‐S, Aziz TZ, Brown P (2012): Driving oscillatory activity in the human cortex enhances motor performance. Curr Biol 22:403–407. [DOI] [PMC free article] [PubMed] [Google Scholar]
- Lahousse L, Vernooij MW, Darweesh SK, Akoudad S, Loth DW, Joos GF, Hofman A, Stricker BH, Ikram MA, Brusselle GG (2013): Chronic obstructive pulmonary disease and cerebral microbleeds. The Rotterdam Study. Am J Respir Crit Care Med 188:783–788. [DOI] [PubMed] [Google Scholar]
- McKay LC, Evans KC, Frackowiak RS, Corfield DR (2003): Neural correlates of voluntary breathing in humans. J Appl Physiol 95:1170–1178. [DOI] [PubMed] [Google Scholar]
- Murphy PB, Kumar A, Reilly C, Jolley C, Walterspacher S, Fedele F, Hopkinson NS, Man WD, Polkey MI, Moxham J, Hart N (2011): Neural respiratory drive as a physiological biomarker to monitor change during acute exacerbations of COPD. Thorax 66:602–608. [DOI] [PubMed] [Google Scholar]
- Neubauer JA, Sunderram J (2004): Oxygen sensing neurons in the central nervous system. J Appl Physiol 96:367–374. [DOI] [PubMed] [Google Scholar]
- Otttenheljm CA, Heunks LM, Richard Dekhuijzen PN (2007): Diaphragm muscle fiber dysfunction in chronic obstructive pulmonary disease. Am J Respir Crit Care Med 175:1233–1240. [DOI] [PubMed] [Google Scholar]
- Pattinson KT, Mitsis GD, Harvey AK, Jbabdi S, Dirckx S, Mayhew SD, Rogers R, Tracey I, Wise RG (2009): Determination of the human brainstem respiratory control network and its cortical connections in vivo using functional and structural imaging. Neuroimage 44:295–305. [DOI] [PubMed] [Google Scholar]
- Pauwels RA, Buist AS, Calverley PM, Jenkis CR, Hurd S, on behalf of the GOLD Scientific Committee (2001): Global strategy for the diagnosis, management and prevention of chronic obstructive pulmonary disease. Am J Respir Crit Care Med 163:1256–1276. [DOI] [PubMed] [Google Scholar]
- Peiffer C, Poline JB, Thivard L, Aubier M, Samson Y (2001): Neural substrates for the perception of acutely induced dyspnea. Am J Respir Crit Care Med 163:951–957. [DOI] [PubMed] [Google Scholar]
- Peng T, Niazy R, Payne SJ, Wise RG (2013): The effects of respiratory CO2 fluctuations in the resting‐state BOLD signal differ between eyes open and eyes closed. Magn Res Imaging 31:336–345. [DOI] [PubMed] [Google Scholar]
- Power JD, Barnes KA, Snyder AZ, Schlaggar BL, Petersen SE (2012): Spurious but systematic correlations in functional connectivity MRI networks arise from subject motion. Neuroimage 59:2142–2154. [DOI] [PMC free article] [PubMed] [Google Scholar]
- Sarfeld AS, Diekhoff S, Wang LE, Liuzzi G, Uludag K, Eickhoff SB, Fink GR, Grefkes C (2012): Convergence of human brain mapping tools: Neuronavigated TMS parameters and fMRI activity in the hand motor area. Hum Brain Mapp 33:1107–1123. [DOI] [PMC free article] [PubMed] [Google Scholar]
- Sassoon CS, Gruer SE, Sieck GC (1996): Temporal relationships of ventilator failure, pump fatigue, and diaphragm fatigue. J Appl Physiol 81:238–245. [DOI] [PubMed] [Google Scholar]
- Schippers MB, Renken R, Keysers C (2011): The effect of intra‐and inter‐subject variability of hemodynamic responses on group level Granger causality analyses. Neuroimage 57:22–36. [DOI] [PubMed] [Google Scholar]
- Schwarzacher SW, Rüb U, Deller T (2011): Neuroanatomical characteristics of the human pre‐Bötzinger complex and its involvement in neurodegenerative brainstem disease. Brain 134:24–35. [DOI] [PubMed] [Google Scholar]
- Sharshar T, Hopkinson NS, Jonville S, Prigent H, Carlier R, Dayer MJ, Swallow EB, Lofaso F, Moxham J, Polkey MI (2004): Demonstration of a second rapidly conducting cortico‐diaphragmatic pathway. J Physiol 560:897–908. [DOI] [PMC free article] [PubMed] [Google Scholar]
- Smith S (2002): Fast robust automated brain extraction. Hum Brain Mapp 17:143–155. [DOI] [PMC free article] [PubMed] [Google Scholar]
- Smith SM, Jenkinson M, Woolrich MW, Beckmann CF, Behrens TE, Johansen‐Berg H, Bannister PR, De Luca M, Drobnjak I, Flitney DE, Niazy RK, Saunders J, Vickers J, Zhang Y, de Stefano N, Brady JM, Matthews PM (2004): Advances in functional and structural MR image analysis and implementation as FSL. Neuroimage 23:S208–S219. [DOI] [PubMed] [Google Scholar]
- Topelli A, Laghi F, Tobin MJ (2001): The voluntary drive to breathe is not decreased in hypercapnic patients with severe COPD. Eur Respir J 18:55–60. [DOI] [PubMed] [Google Scholar]
- Von Leupoldt A, Sommer T, Kegat S, Bauman HJ, Klose H, Dahme B, Büchel C (2008): The unpleasantness of perceived dyspnea is processed in the anterior insula and amygdala. Am J Respir Crit Care Med 177, 1026–1032. [DOI] [PubMed] [Google Scholar]
- Von Leupoldt A, Sommer T, Kegat S, Eippert F, Baumann HJ, Klose H, Dahme B, Büchel C (2009): Down‐regulation of insular cortex responses to dyspnea and pain in asthma. Am J Respir Crit Care Med 180:232–238. [DOI] [PubMed] [Google Scholar]
- Winkler AM, Ridgway GR, Webster MA, Smith SM, Nichols TE (2014): Permutation inference for the general linear model. Neuroimage 92:381–397. [DOI] [PMC free article] [PubMed] [Google Scholar]
- Wise RG, Ide K, Poulin MJ, Tracey I (2004): Resting fluctuations in arterial carbon dioxide induce significant low frequency variations in BOLD signal. Neuroimage 21:1652–1664. [DOI] [PubMed] [Google Scholar]
- Wu GR, Liao W, Stramaglia S, Ding JR, Chen H, Marinazzo D (2013): A blind deconvolution approach to recover effective connectivity brain network from resting state fMRI data. Med Image Anal 17:365–374. [DOI] [PubMed] [Google Scholar]
Associated Data
This section collects any data citations, data availability statements, or supplementary materials included in this article.
Supplementary Materials
Supporting Information
Supporting Information Figure S1
Supporting Information Figure S2
Supporting Information Figure S3
Supporting Information Figure S4
Supporting Information Figure S5
Supporting Information Figure S6
Supporting Information Figure S7
Supporting Information Figure S8
Supporting Information Figure S10
Supporting Information Figure S11
Supporting Information Table S1
Supporting Information Table S2
Supporting Information Table S3
Supporting Information Table S4
Supporting Information Table S5
Supporting Information Table S6
Supporting Information Table S7