Abstract
Noninvasive measurement of oxidative markers in clinical samples has the potential to rapidly provide information for disease management, but is limited by the need for expensive analytical instrumentation that precludes home monitoring or point-of-care applications. We have developed a simple to use diagnostic platform for airway hydrogen peroxide (H2O2) that combines optimized reaction-based chemiluminescent designs with an inexpensive home-built darkbox and readily available smartphone cameras. Specialized photography software applications and analysis of pixel intensity enables quantification of sample concentrations. Using this platform, sample H2O2 concentrations as low as 264 nM can be detected. The platform has been used to measure H2O2 in the exhaled breath condensates of human subjects, showing good agreement with the standard Amplex Red assay.
Keywords: chemiluminescence, hydrogen peroxide, exhaled breath condensates, smartphone, point-of-care
Graphical Abstract
1. Introduction
The human body's capacity to regulate oxidative processes through the generation and scavenging of reactive oxygen species such as H2O2 is a critical fulcrum that balances health and disease [1]. Non-invasive monitoring of this physiological redox status using easily collected clinical samples such as exhaled breath condensate represents a promising approach for monitoring respiratory diseases such as asthma [2] and chronic obstructive pulmonary disease [3]. In the inflamed lung airways, activated eosinophils, macrophages, and neutrophils can produce superoxide (O2−), which rapidly dismutates to form the relatively stable reactive oxygen species, H2O2 [4,5]. This H2O2 is extruded with the exhaled breath and can report on inflammation and oxidative stress. Levels of H2O2 in exhaled breath condensate are elevated in both adult [6–11] and children [12] asthma patients. Although many studies have reported that H2O2 elevation tracks with disease severity and can be attenuated with corticosteroid treatment, other studies report contradictory results [13]. This uncertainty is due, in part, to a lack of fast, simple, and reliable methods for routine detection of H2O2 in exhaled breath condensates.
A variety of advanced techniques have been applied for measuring H2O2, including the Amplex Red assay [14], as well as colorimetric [15], luminescence [16], magnetic resonance [17], and electrochemical [18] methods. While useful in well-equipped laboratory environments, these methods require expensive instrumentation that limits their widespread application in low resource, home monitoring, and point-of-care settings. Technological innovations to enable diagnostic tasks normally reserved for highly trained physicians and well-equipped central hospitals to be shifted to healthcare volunteer clinics or even the patients themselves are recognized as an important strategy to address global health care challenges [19]. For example, commercial NIOX® devices [20] enable asthma patients to monitor nitric oxide levels in their exhaled breath, providing an instant reading of lung inflammation. While still expensive, these devices have helped adults and children manage their disease and track response to medication [21].
A growing trend in point-of-care medicine leverages the rising use and availability of smartphones in both the developed and developing world [22,23]. Many smartphones are equipped with sensitive complementary metal-oxide-semiconductor (CMOS) based cameras and processing capabilities that poise them to be situated as central components of low-cost platforms for clinical monitoring [24,25]. The key implementation challenge is designing effective analytical assays that can interface and be accurately and sensitively read with a smartphone device. Indeed, connecting mobile phone cameras with low-cost excitation sources and band-pass optical filters has enabled fluorescence detection and imaging of pathological biomarkers including C-reactive protein [26], immunoglobin G [27], food allergens [28], pH [29], E. coli [30], thyroid stimulating hormone [31], M. tuberculosis [32,33], β-galactosidase [34], and blood cells [35]. These innovative designs have dramatically empowered the analytical capabilities of mobile phone technology, yet many of the accessories require external power sources, multiple parts, and optical filters.
In order to develop a simplified system with minimal parts, we have optimized a chemiluminescent platform for smartphone detection of H2O2 and applied it to monitoring H2O2 in human exhaled breath condensates. Due to its high sensitivity and low background, chemiluminescence has been applied for analyte detection in vitro [36], in cells [37], and in vivo [38]. The chemiluminescent peroxyoxalate system is highly efficient at generating chemiluminescent emission and consists of an activated bis-oxalate ester, acyl transfer catalyst such as imidazole, and a fluorescent dye (Scheme 1) [39]. It proceeds via chemical reaction between H2O2 and an activated oxalate to form the high-energy molecule 1,2-dioxetanedione. Interaction with particular dyes initiates O–O bond cleavage in a reaction pathway that generates the dye in the excited state, and ultimately emits a photon of light as it relaxes to the ground state. While this chemistry has been used in combination with sophisticated photondetection equipment to measure H2O2 [40–43], we envisioned that advances in CMOS camera technology and freely available software applications could enable this chemistry to be implemented into a smartphone-based platform for monitoring H2O2. The platform consists of using the optimized peroxyoxalate chemiluminescent reaction inside of a low cost darkbox accessory and imaged using a smarthphone camera with advanced photography applications. Importantly, the use of chemiluminescence emission eliminates the need for an excitation source and optical filters, greatly simplifying data collection, and offers a platform that can be readily adopted, even in resource-limited environments.
Scheme 1.
Reaction scheme for H2O2 detection using peroxyoxalate chemiluminescence. H2O2 reacts with a bis-oxalate ester in the presence of an acyl transfer catalyst such as imidazole to generate 1,2-dioxetanedione, which in turn reacts with a fluorescent dye in a chemiluminescent reaction.
2. Experimental
2.1 General methods and materials
All chemicals were purchased from Sigma-Aldrich (St. Louis, MO) or Alfa Aesar (Ward Hill, MA) and used without further purification. Chemiluminescence emission spectra were acquired using a Hitachi F-7000 Spectrophotometer (Hitachi, Tokyo, Japan). Chemiluminescence images were acquired using an iPhone 4s or iPhone 6 (Apple, Cupertino, CA).
2.2 Darkbox design and fabrication
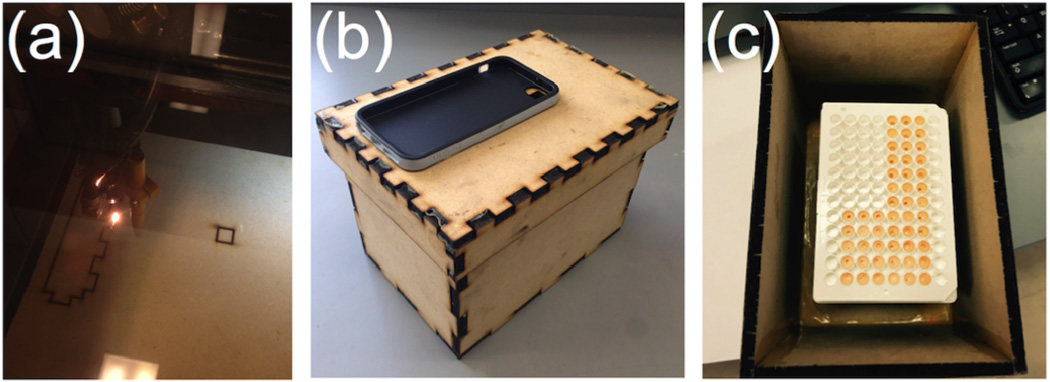
The wooden darkbox was designed using the RetinaEngrave3D software and fabricated using an FSLaser Professional Large Format (ProLF) Series Laser System (Full Spectrum Laser LLC, Las Vegas, NV) in the Innovation Gymnasium at Southern Methodist University. The floor and walls were cut with precisely fitted notches and glued together using an epoxy resin (Epoxy Quick Set, Locktite, Westlake, OH). The lid was pieced together from four side pieces and a top piece with a small square 0.5" by 0.5" hole cut into it. A plastic smartphone case was glued to the lid so that the hole in the box was flush with the hole of the lid. The dimensions of the finished box were 5" × 7.5" × 5.5 " (L × W × H). A 96-well plate is placed inside the darkbox along a pre-marked position to ensure the wells of interest are inside the field of view of the smartphone camera.
2.3 Chemiluminescence imaging
Imaging experiments were performed using the darkbox design described above and the time-lapse photography application OSnap! (Head of the Mule, New York, NY) [44], VSCO (VSCO, Oakland, CA) [45], or the stock camera application on an iPhone 4s or iPhone 6. Stock solutions of 7 mM diphenylanthracene (DPA), 7 mM rubrene, 7 mM bis(phenylethynyl)anthracene (BPEA) [46], 60 mM imidazole, 10 mM bis(2,4,6)-trichlorophenyl oxalate (TCPO), and 7 mM bis(2-carbopentyloxy-3,5,6-trichlorophenyl) oxalate (CCPO) in 9:1 EtOAc:CH3CN were used in all experiments. TCPO, CCPO, and H2O2 stock solutions were prepared on the same day of the experiment and other stock solutions were used in the same week. 180 µL DPA, rubrene, or BPEA stock solutions, 20 µL imidazole stock solutions, and 100 µL TCPO or CCPO stock solutions were added to a microwell plate inside of the imaging box. After 3 min, 25 µL or 75 µL H2O2 was added to the microwell plate and the time-lapse or photographic imaging application (OSnap!, iPhone 6 stock camera app, or VSCO) was immediately initiated, taking images at intervals ranging from 0.5–10 sec (with H2O2 addition at t = 0) or a single image 2–3 seconds after addition of H2O2. The lid was immediately placed on the imaging box. This process was repeated for each of the H2O2 stock solutions.
2.4 Image acquisition with the OSnap! application
The time-lapse imaging application OSnap! was downloaded from the Apple App Store. The following settings were used:
| Orientation: landscape | Flash: off |
| Resolution: 1080p(1920×1080) | Timer interval: 00:00:00.25s |
| Delayed start: no delay | Limit total frames: 20 frames |
| Suppress camera errors: on |
2.5 Image acquisition with Apple stock camera application
An iPhone 6 with iOS 8 was used to capture images with the stock camera app (Apple, Cupertino, CA). Flash was turned off and exposure was set to the highest setting by long pressing on the phone screen, with the camera aimed into the darkbox, until AE/AF LOCK appears and then moving the sun icon to its highest position. The testing procedure explained above was followed, and a picture was taken 2–3 seconds after addition of H2O2 to account for the time taken between addition and closing the lid of the box.
2.6 Image acquisition with VSCO application
The application VSCO (VSCO, New York, NY), was used to capture single images 2–3 seconds after addition of H2O2. The following settings were used:
| Exposure: 3.0 | ISO: 1856 |
| Shutter speed: 1/2.0. |
All other settings were left at their default settings of automatic. Because the shutter speed is longer than a normal picture, it takes about 4 seconds to capture a single image. There are sometimes camera errors with this application and the image is not taken, so to prevent data loss, it is recommended to take a “test” picture right before the addition of H2O2.
2.7 Image analysis
Images were transferred from the imaging application to a computer and analyzed in ImageJ by converting the set of images acquired using OSnap!, the Apple stock camera, or VSCO into a single stack. A circle was selected around the reaction well and the mean pixel intensity was evaluated for each image. Data shown in all figures are the average of at least three independent trials. In order to locate wells with very low emission intensity, a photograph with the flash was taken at the end of the experiment and included in the stack. The well could be identified in this photograph. Circling in ImageJ would identify the placement when scrolling through a stack of images. Accurate measurements were obtained using the mean pixel intensity from the first image acquired. Background correction consisted of evaluating the mean pixel intensity of three blank wells and subtracting this value from the mean pixel intensity of the reaction well. All reported error bars are ± standard deviation (S.D.). The limits of detection were estimated from linear plots by determining the concentration of H2O2 needed to provide a signal of 3×S.D. (LoD) above the signal generated from adding a vehicle control to the chemiluminescent reagent system.
2.8 Selectivity Studies
Analyte selectivity for the smartphone-based chemiluminescent detection system was performed using an iPhone 6 (Apple, Cupertino, CA). All measurements were repeated three times. 0, 25, 50, 100, and 200 µM solutions of H2O2, NO2−, tBuOOH, HOCl, and ONOO− (75 µL) were added to a solution of 3.4 mM BPEA, 3.2 mM imidazole, and 1.9 mM CCPO in 9:1 EtOAc:CH3CN (375 µL final volume) that was premixed and allowed to sit for 5 minutes. A picture was acquired 2–3 seconds after addition of the analyte using VSCO (VSCO, New York, NY). ONOO− was synthesized using an adaptation of a literature procedure [47,48]. 0.24 mL of H2O2 (35% wt. in H2O, 2.8 mmol, 1.4 equiv) was added to a round bottom flask containing 4.5 mL of 0.55 M NaOH and 5 mL isopropyl alcohol, after which isoamyl nitrite (0.27 mL, 2.0 mmol, 1.0 equiv) was added, and stirred at rt for 15 minutes. MnO2 (10 mg, 0.12 mmol, 0.060 equiv) was added to the reaction and stirred for an extra 5 minutes to decompose excess H2O2. The reaction mixture was filtered to remove MnO2 and washed four times with 10 mL of CH2Cl2 in a separatory funnel. The aqueous layer was removed with a Pasteur pipet, carefully avoiding CH2Cl2. The concentration was determined by UV/Vis using the absorption at 302 nm (ε = 1670 M−1 cm−1), and was diluted to make 0, 25, 50, 100, and 200 µM stock solutions.
2.9 Measuring H2O2 in human exhaled breath condensates
Participants (18–33 years old) were recruited from chemistry undergraduate and graduate research students. Exhaled breath condensate samples were collected using an R-Tube (Respiratory Research, Austin, TX). The cooling sleeve was cooled in a −20 °C freezer overnight before collection. The sleeve was placed on the R-Tube and the participant was instructed to breath tidally through the R-Tube over the course of 10 minutes. The R-Tube mouthpiece was removed and the condensate was collected from the walls using the plunger provided with the R-Tube kit. This procedure typically provided ~1 mL of exhaled breath condensate. This protocol was approved by the local Institutional Review Board (IRB# 2014–015–LIPPA) and all participants provided informed consent.
Exhaled breath condensate samples (75 µL) were added to a solution of 3.4 mM BPEA, 3.2 mM imidazole, and 1.9 mM CCPO in 9:1 EtOAc:CH3CN (375 µL final volume) that was premixed and allowed to sit for 5 minutes. A picture was acquired 2–3 seconds after addition of the exhaled breath condensate using VSCO. The concentration was determined using a calibration curve constructed from known stock H2O2 solutions at 0, 250, 500, 1000, and 1500 nM prepared on the same day as exhaled breath condensate measurement. Each data point is the mean pixel intensity from 3–4 replicates of the same exhaled breath condensate sample. The same exhaled breath condensate samples were also tested using the Amplex Red assay (Life Technologies, Carlsbad, CA) as per the manufacturer's instructions. Briefly, calibration was performed using 150 µL aliquots from stock H2O2 solutions at 0, 250, 500, 1000, and 1500 nM. The stock solutions were measured in triplicate using the Amplex Red reagent kit and by monitoring the peak fluorescence emission at 583 nm using an F-7000 Spectrophotometer (Hitachi, Tokyo, Japan). Calibrations were performed on the same day as exhaled breath condensate measurement.
3. Results and Discussion
We designed a wooden darkbox accessory using specialized RetinaEngrave3D software to precisely laser cut the individual components (Figure 1a). The pieces consisted of wooden panels with carefully measured notches to enable easy interlocking, which were found to be critical to decrease leakage of light into the box. Previous designs with un-notched wooden panels were found to be unsuitable due to small cracks between connections from warping of the wood. A small hole was laser cut into the lid and a smartphone case was glued on for easy attachment of a smartphone, and assuring flush alignment of the camera lens and the lid opening (Figure 1b). A 96-microwell plate can be inserted into the darkbox and wells visible in the camera field-of-view can be marked (Figure 1c). In situations where fabrication of a darkbox is impractical, we note that a shoebox may serve as a suitable, albeit less robust, substitute. After reagent mixing, the lid and attached smartphone could be quickly placed atop the box and imaging started within 2–3 s, using the time-lapse photography application OSnap!, VSCO, or the stock camera app equipped on the iPhone 6.
Figure 1.
Design and fabrication of a wooden darkbox accessory. (a) Photograph of wooden panels being cut using a ProLF Series Laser System. (b) Photograph of the wooden darkbox accessory for iPhone imaging of H2O2. (c) Photograph of a 96-well plate in the darkbox accessory.
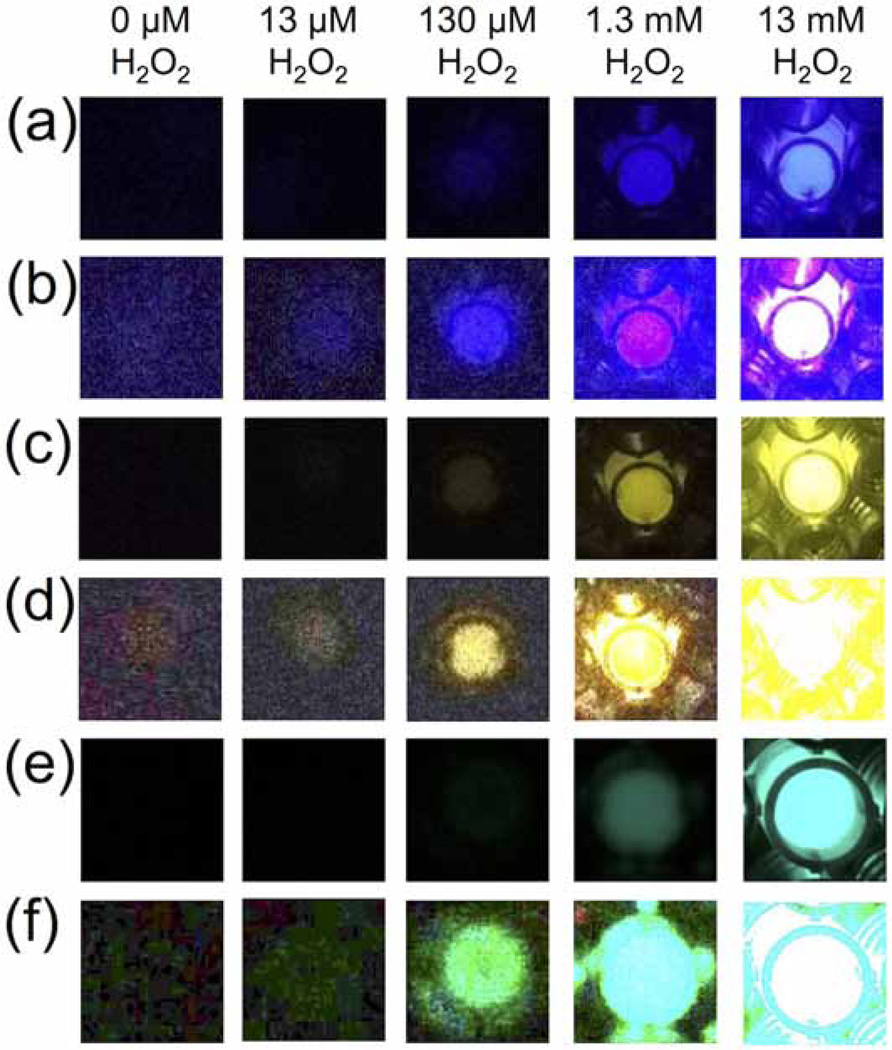
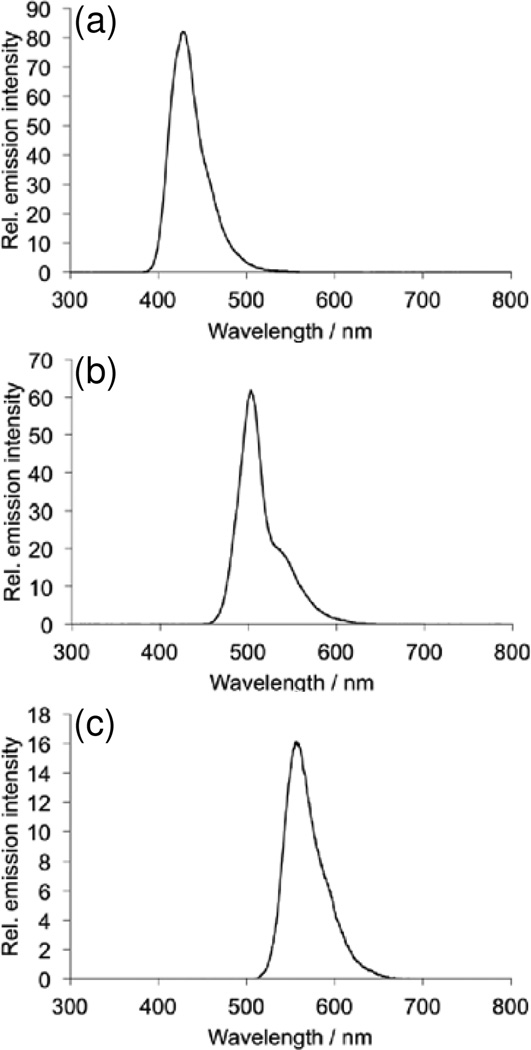
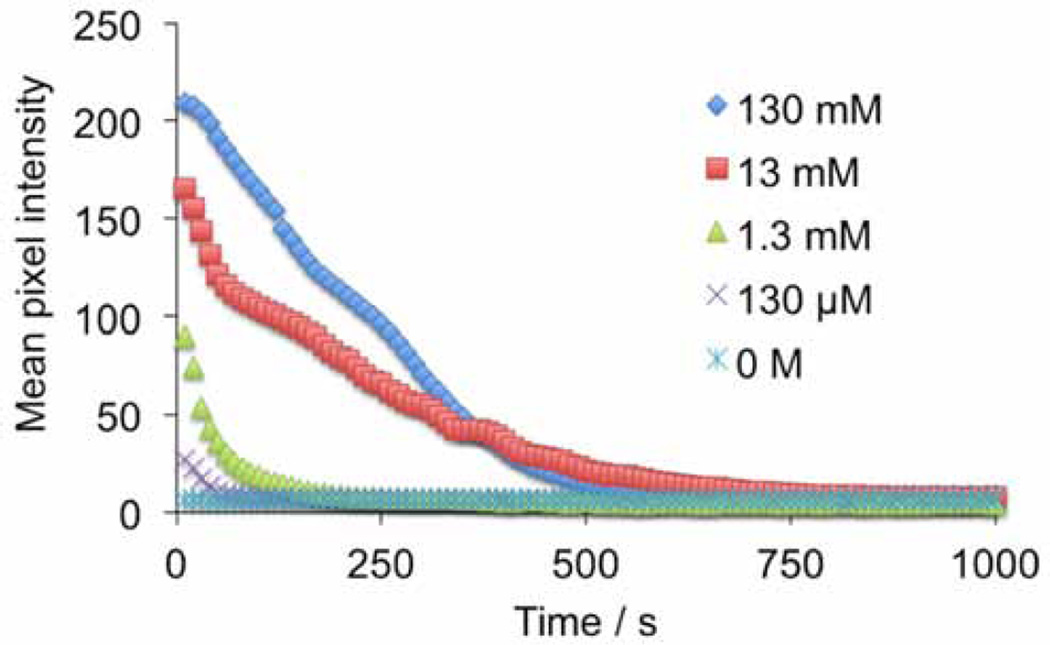
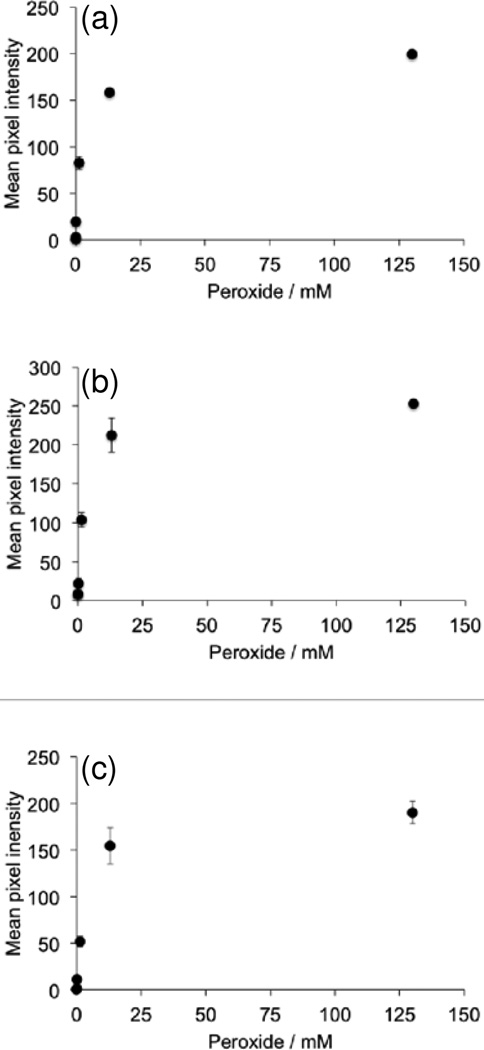
First we analyzed the ability of the platform to detect H2O2 using several different dye/chemiluminescent reagent combinations. We used the dyes diphenyl anthracene (DPA, Figure 2a,b), rubrene (Figure 2c,d), and 9,10-bis(phenylethynyl)anthracene (BPEA, Figure 2e,f). These dyes provide a range of peak emission wavelengths of 426 nm, 500 nm, and 563 nm in the chemiluminescent emission spectrum for DPA, BPEA, and rubrene, respectively (Figure 3). As well, we explored two different chemiluminescent reagents: bis(2,4,6)-trichlorophenyl oxalate (TCPO, Figure 2a–d) and bis(2-carbopentyloxy-3,5,6-trichlorophenyl) oxalate (CPPO, Figure 2e,f). We tested stock solutions in the range of 0–130 mM H2O2 by adding 25 µL aliquots to premixed solutions of the dye, imidazole acyl transfer catalyst, and chemiluminescent reagents. A dim background glow could be observed after addition of TCPO or CCPO, which subsided after 3 minutes. Addition of H2O2 before 3 minutes resulted in a falsely high signal, so all measurements were performed at least 3 minutes after TCPO or CCPO addition. This background of the peroxyoxalate reaction in the absence of H2O2 has been previously attributed to solvent impurities [40] or an uncharacterized chemiluminescent reaction [49], but its precise nature remains unclear. For every system tested, 25 µL aliquots from a stock H2O2 concentration of 130 µM (10 µM final microwell concentration) could be readily observed by eye (Figure 2a,c,e) and 13 µM stock solutions (1 µM final microwell concentration) could be visualized by adjusting the brightness of the acquired images (Figure 2b,d,f). For equal comparison, the brightness levels of the raw images were identically adjusted in ImageJ by setting the Maximum value to 35 in the Brightness/Contrast window. This adjustment saturated the images for the highest H2O2 concentrations in the experiments that used rubrene and BPEA, but enabled visualization of microwells containing lower concentrations of H2O2. While kinetic data could be readily attained using the time-lapse imaging application OSnap! (Figure 4), we generally observed accurate measurements using the mean pixel intensity from the first image collected. Careful quantification of the mean pixel intensity using ImageJ revealed a dose-dependent light emission with increasing H2O2 levels (Figure 5). The light emission reached a maximum value at H2O2 concentrations above 13 mM (final concentrations greater than 1 mM).
Figure 2.
Images of 0–13 mM H2O2 acquired using an iPhone 4s or 6, a home-built darkbox, and the time-lapse imaging application OSnap! (a) Unprocessed images and (b) images processed in ImageJ by setting the maximum pixel value to 35 using 25 µL aliquots of 0–13 mM H2O2 (0–1 mM final concentration) and 3.9 mM DPA, 3.7 mM imidazole, and 3.1 mM TCPO in 9:1 EtOAc:CH3CN. (c) Unprocessed images and (d) images processed in ImageJ by setting the maximum pixel value to 35 using 25 µL aliquots of 0–13 mM H2O2 (0–1 mM final microwell concentration) and 3.9 mM rubrene, 3.7 mM imidazole, and 3.1 mM TCPO in 9:1 EtOAc:CH3CN. (e) Unprocessed images and (f) images processed in ImageJ by setting the maximum pixel value to 35 using 25 µL aliquots of 0–13 mM H2O2 (0–1 mM final concentration) and 3.9 mM BPEA, 3.7 mM imidazole, and 2.2 mM CCPO in 9:1 EtOAc:CH3CN. Images were acquired 2–3 seconds after addition of H2O2.
Figure 3.
Chemiluminescent emission spectra of 1.9 mM CCPO, 3.2 mM imidazole, 400 nM H2O2 and (a) 3.4 mM DPA, (b) 3.4 mM BPEA, or (c) 3.4 mM Rubrene.
Figure 4.
Quantification of time-lapse images acquired every 10 s using an iPhone 4s, a home-built darkbox, and the time-lapse imaging application OSnap! of 25 µL aliquots of 0–130 mM H2O2 and 3.9 mM DPA, 3.7 mM imidazole, and 3.1 mM TCPO in 9:1 EtOAc:CH3CN.
Figure 5.
Quantification of images in Figure 2. Plots of measurements from 25 µL aliquots of 0–130 mM H2O2 (0–10 mM final concentration) versus mean pixel intensity of circular ROIs around the microwells using the reagents (a) 3.9 mM DPA, 3.7 mM imidazole, and 3.1 mM TCPO in 9:1 EtOAc:CH3CN. (b) 3.9 mM rubrene, 3.7 mM imidazole, and 3.1 mM TCPO in 9:1 EtOAc:CH3CN. (c) 3.9 mM BPEA, 3.7 mM imidazole, and 2.2 mM CCPO in 9:1 EtOAc:CH3CN. Images were acquired 2–3 seconds after addition of H2O2. Error bars are ± S.D (n = 3).
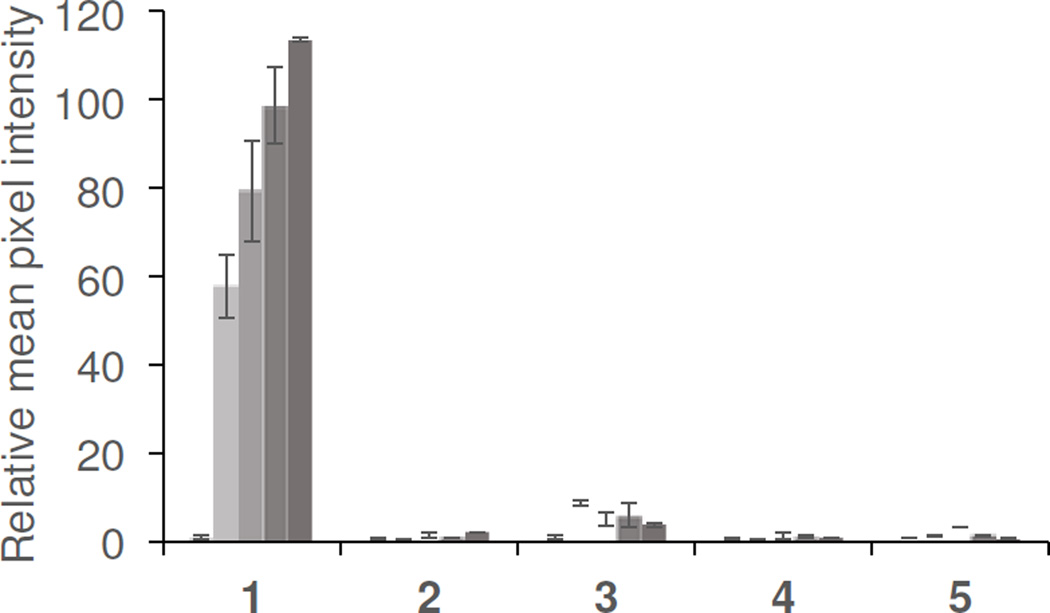
We next analyzed the limits of detection of our platform. It should be noted that an analysis of a clinical sample requires a dilution of the aqueous sample into the chemiluminescent reagent system. In our initial protocols, a 25 µL aliquot of an aqueous H2O2 solution was added to 300 µL of 9:1 EtOAc:CH3CN. At these volumes, the stock solution is diluted by a factor of 13. In order to ascertain the efficacy of our platform for clinical analysis, we evaluated the detection limits in terms of the sample concentration before dilution of the H2O2 solutions (Table 1, Column 4, Entries 1–3). Under these conditions, detection limits (3 σ) were estimated to be 10.7 µM, 32.4 µM, and 3.65 µM for the DPA, rubrene, and BPEA systems, respectively. In terms of the final microwell concentration, these detection limits correspond to 823 nM, 2.49 µM, and 281 nM H2O2 for the DPA, rubrene, and BPEA systems respectively (Table 1, Column 3, Entries 1–3). In the best performing BPEA system, the chemiluminescent reagent CCPO was used, which provided a decreased background and increased signal due to improved solubility. This decreased background is primarily responsible for the improved detection limit of this system. We tested the selectivity of the best performing BPEA/CCPO reagent formulation versus other reactive oxygen and nitrogen species that may be found in exhaled breath condensate (Figure 6). H2O2 provided up to ~100-fold increase in luminescent emission versus a blank control, and none of the other species tested, including NO2−, tBuOOH, HOCl, or ONOO− yielded a comparable response.
Table 1.
Limits of detection (3 σ).
| Entry | Dye | LoD Final [H2O2] | LoD Sample [H2O2] |
|---|---|---|---|
| 1 | DPAa | 823 nM | 10.7 µM |
| 2 | Rubrenea | 2.49 µM | 32.4 µM |
| 3 | BPEAa,b | 281 nM | 3.65 µM |
| 4 | BPEAb,c | 53 nM | 264 nM |
Images acquired using the OSnap! application and sampling 25 µL aliquots.
CCPO was used as the chemiluminescent reagent.
Images acquired using VSCO with exposure set to 3.0, ISO set to 1856, and the shutter speed set to 1/2 and sampling 75 µL aliquots.
Figure 6.
Selectivity for H2O2. Experiments were performed using 3.4 mM BPEA, 3.2 mM imidazole, and 1.9 mM CCPO in 9:1 EtOAc:CH3CN, and 75 µL aliquots of 0, 25, 50, 100, and 200 µM of (1) H2O2 (2) NO2− (3) tBuOOH (4) HOCl (5) ONOO−. Images were acquired 2–3 seconds after addition of CCPO as the final reagent. Error bars are ± S.D (n = 3) and values are normalized to the blank value for each trial.
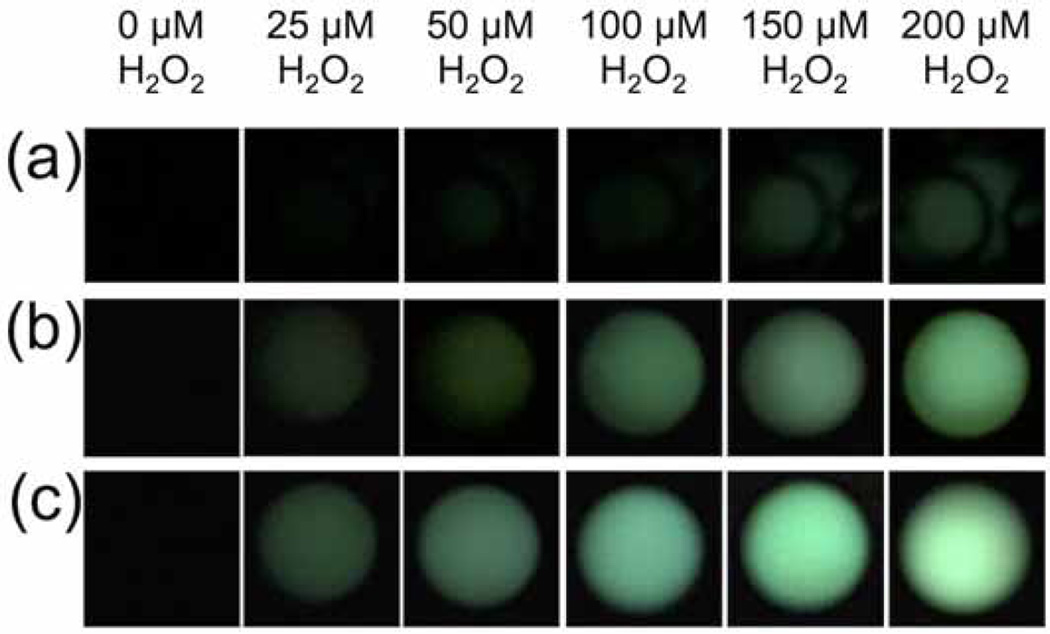
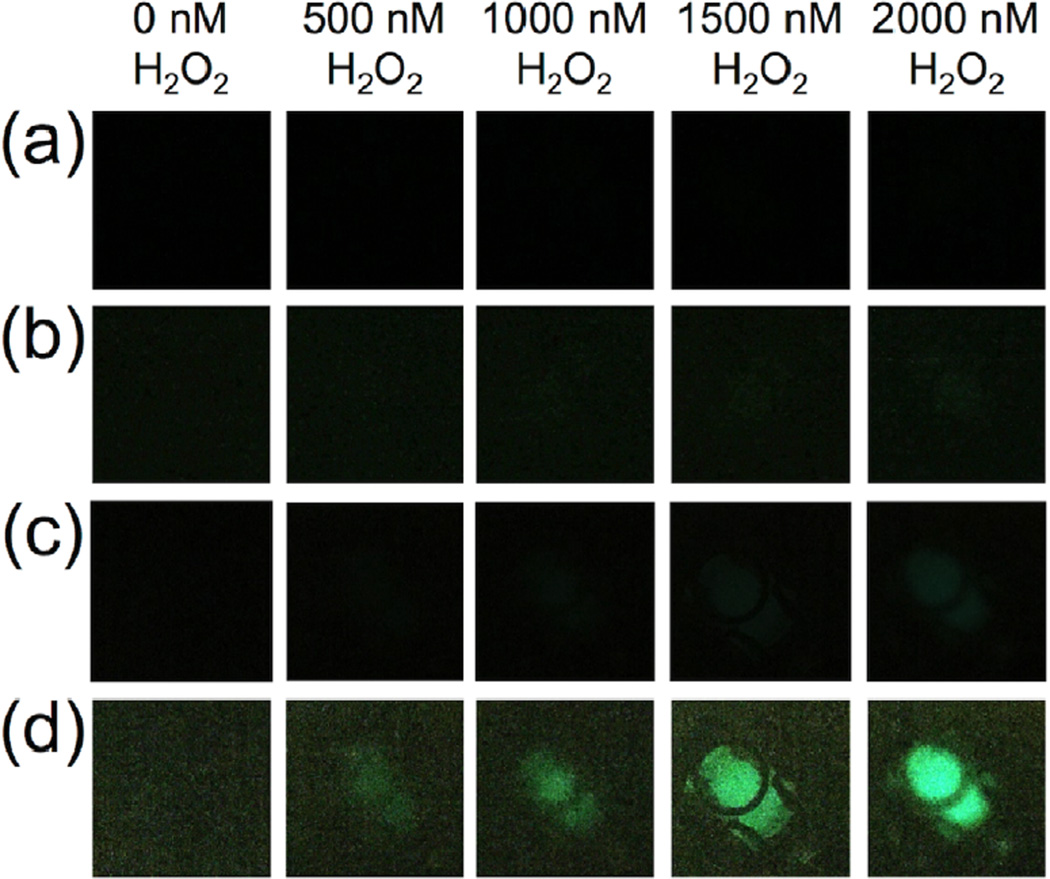
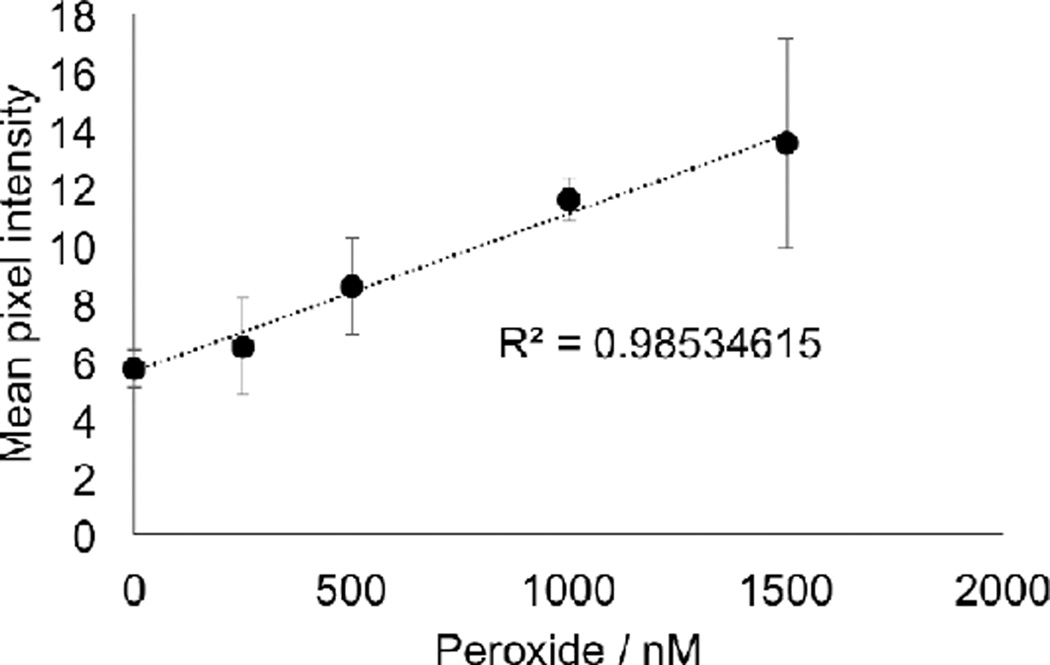
Having shown that the BPEA system provided the most sensitive response using our chemiluminescent platform for smartphone imaging of H2O2, we next explored the possibility of increasing sensitivity by optimizing the settings on the smartphone camera. We first moved from using the OSnap! time-lapse photography application to using the stock camera application on the iPhone 6. We found that by setting the exposure to the maximum setting, we could obtain a distinct improvement in sensitivity. While the visible threshold in the raw images using the OSnap! application was between 100 µM and 200 µM H2O2 (Figure 7a), stock solution concentrations as low as 25 µM H2O2 could be readily observed using the stock camera application on an iPhone 6 (Figure 7b). At this stage, we surmised that increasing the aliquot volume could provide an increase in sensitivity by increasing the total molar amount of analyte delivered. Tripling the aliquot volume from 25 µL to 75 µL yielded a clearly observable increase in light emission (Figure 7c), and this aliquot volume was used in subsequent experiments. A series of control experiments was performed to ensure that different wells within the field-of-view did not give drastically different measurements (Figure 8). We found that the variation between wells with consistent reagent concentrations did not provide large variations in comparison to other sources of error. Encouraged by the drastic increase sensitivity, we identified the software application VSCO that enabled further optimization of the camera settings. The levels of H2O2 in exhaled breath condensate are estimated to be in the range of 0–2000 nM H2O2 [2]. This range was not visible using the iPhone 6 stock camera application (Figure 9a), even with adjustment of the brightness (Figure 9b). On the other hand, maximizing the exposure and ISO setting in VSCO, while minimizing the shutter speed, 2000 nM H2O2 could be observed in the raw images (Figure 9c). We found that uniform adjustment of the brightness in ImageJ provided a clearly observable trend in this range (Figure 9d). Quantification of the mean pixel intensities displayed a linear calibration curve (Figure 10) with an estimated detection limit (3 σ) of 264 nM (Table 1, Column 4, Entry 4), within the range of previously measured values of H2O2 in exhaled breath condensates.
Figure 7.
Images of H2O2 acquired using an iPhone 6, a home-built dark box, and either (a) the time-lapse imaging application OSnap!, (b) the stock iPhone 6 camera application with exposure settings at maximum using 25 µL aliquots and aliquots of 0, 25, 50, 100, 150, and 200 µM H2O2 and 3.9 mM BPEA, 3.7 mM imidazole, and 2.2 mM CCPO in 9:1 EtOAc:CH3CN, or (c) the stock iPhone 6 camera application with exposure settings at maximum using 75 µL aliquots of 0, 25, 50, 100, 150, and 200 µM H2O2 and 3.4 mM BPEA, 3.2 mM imidazole, and 1.9 mM CCPO 9:1 EtOAc:CH3CN. Images were acquired 2–3 sec after addition of H2O2 as the final reagent.
Figure 8.
Evaluation of luminescence measurements from various wells. (a) Mean pixel intensity of 3.4 mM BPEA, 3.2 mM imidazole, and 1.9 mM CCPO before (orange markers) and after (blue markers) addition of 25 µM H2O2 in 12 different wells in the field of view. Images were acquired using an iPhone 6. (b) Photograph of a microwell plate in the darkbox after completion of the experiments. The numbering of the wells corresponds to the Well # in (a). Note that the flash was partially occluded in the acquisition of this photograph.
Figure 9.
Images of 3.4 mM BPEA, 3.2 mM imidazole, 1.9 mM CCPO in 9:1 EtOAc:CH3CN and 75 µL aliquots of 0, 500, 1000, 1500, and 2000 nM H2O2 acquired using an iPhone 6, a home-built darkbox, and different imaging applications. (a) The stock iPhone 6 camera application with exposure settings at maximum, (b) the same images in (a) adjusted in ImageJ by setting the maximum pixel intensity to 35, (c) the camera application VSCO (with exposure set to 3.0, ISO set to 1856, and the shutter speed set to 1/2) (d) the same images in (c) adjusted in ImageJ by setting the maximum pixel intensity to 35. Images were acquired 2–3 sec after addition of H2O2 as the final reagent.
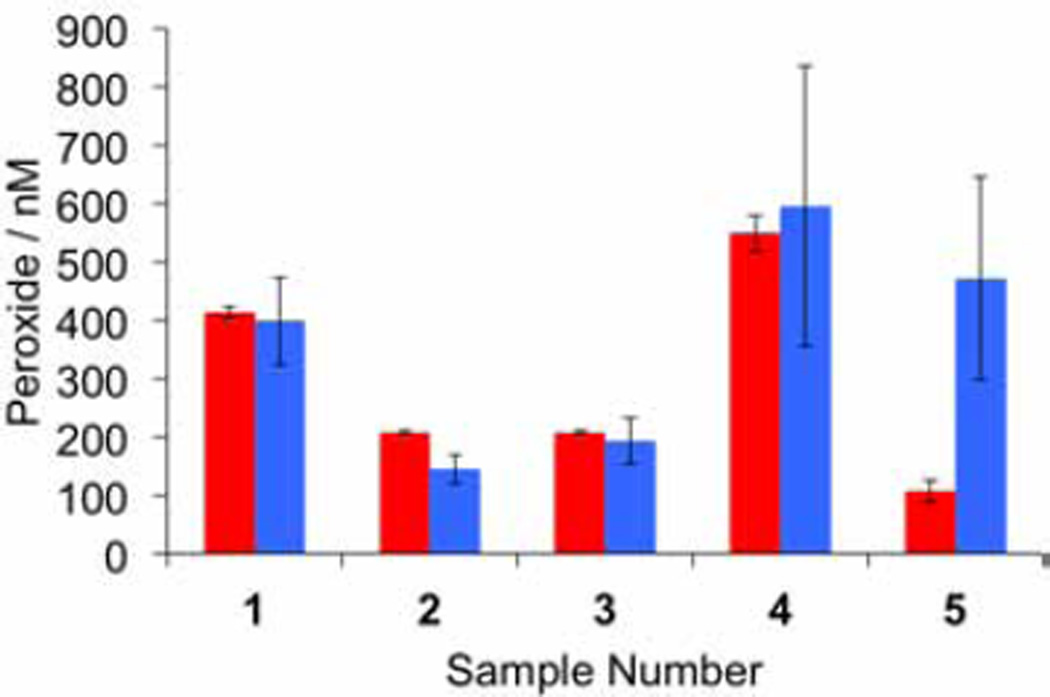
Encouraged by the achievement of a smartphone-based platform with the requisite sensitivity, we performed a validation of this system for measuring H2O2 in human exhaled breath condensates by cross referencing with the established Amplex Red assay.14 Approximately 1 mL of exhaled breath condensate sample was collected from volunteers using an R-Tube apparatus as described in our IRB approved protocols. All participants provided informed consent. A total of five samples were collected. These collected samples were measured on the same day using our optimized chemiluminescent platform by sampling 75 µL exhaled breath condensate per trial, and using the Amplex Red assay by sampling 150 µL exhaled breath condensate per trial. Same-day calibrations for each system were performed by sampling 75 µL or 150 µL aliquots from H2O2 stock solutions in the range of 0–1500 nM. For each calibration and sample measurement, three trials were performed and the average values obtained from our smartphone-based platform were compared with the average values from the Amplex Red assay. In 4 of 5 sample measurements, we obtained excellent agreement between the assays (Figure 11). The Amplex Red assay yielded less deviation between replicate measurements, but the mean values from both assays were generally consistent. In one outlier (as determined by a Grubb's test analysis on the ratio of the iPhone measurement to the Amplex Red), we found an elevated measurement in the iPhone method (Figure 11, Sample 5). In this sample, the Amplex Red assay yielded a value of 107 nM H2O2, which is below the estimated detection limit of the iPhone-based system and may have contributed to the lack of agreement. There are other factors, including the need for precise timing in these assays, variations in ambient temperature, or saliva contamination that may have also contributed and will be the subject of future investigations.
Figure 11.
Validation of the chemiluminescent platform for smartphone measurement of H2O2 in human exhaled breath condensates. Measurements were made using 3.4 mM BPEA, 3.2 mM imidazole, and 1.9 mM CCPO in 9:1 EtOAc:CH3CN, and 75 µL aliquots of exhaled breath condensate using an iPhone 6 and the camera application VSCO (with exposure set to 3.0, ISO set to 1856, and the shutter speed set to 1/2). Images were acquired 2–3 seconds after addition of the exhaled breath condensate as the final reagent. Amplex Red measurements were made according to the manufacturer's instructions using 150 µL aliquots for calibration and exhaled breath condensate measurement. Error bars are ± S.D (n = 3).
We finally evaluate the cost of this smartphone-based assay in both the context of a research laboratory operating under limited resources and on a cost-per-test basis for future development of a point-of-care assay (Table 2). Based on this analysis, we estimate a cost-per-test of ~$0.12, which incudes chemical reagents and consumable supplies. Typically three replicates are performed for each sample (~$0.36 total) and a calibration with 5 different H2O2 concentrations (13 total replicates, ~$1.80). When considering the total cost of equipment needed to perform these assays, and additional fixed cost of $3,785.85 is estimated. Much of this cost is due to the cost of an analytical balance for measuring out reagents and the iPhone 6 itself. One strategy to overcome these fixed costs would be to provide the reagents in a pre-measured kit, enabling H2O2 measurement without the need for an analytical balance, reducing these fixed costs to under $1,000. Nonetheless, eliminating the need for sophisticated photon detection equipment drastically reduces cost for low-resource research laboratories and other settings.
Table 2.
Cost Analysis.
| Item | Unit | Expenditure | Cost-per-test |
|---|---|---|---|
| CCPO | 5 g | $44.99 | $0.0043 |
| BPEA | 1 g | $31.29 | $0.015 |
| Imidazole | 100 g | $23.18 | <$0.0001 |
| H2O2 | 100 mL | $31.28 | <$0.0001 |
| 96-well plate | Case/50 | $105 | $0.065a |
| Pipette Tips | Pack/768 | $24.1 | $0.032 |
| Darkbox | ~$10 | N/A | |
| Automatic Pipettor |
$226.7 | N/A | |
| iPhone 6 | $549 | N/A | |
| Analytical Balance |
$3000.15 | N/A | |
| Totals: | $3785.85b | $0.1c | |
Based on 32 usable wells per plate.
Total non-consumable fixed costs.
Evaluated based on chemical reagents and consumable supplies.
4. Conclusions
In summary, we have developed a sensitive chemiluminescent platform that enables accurate smartphone monitoring of airway H2O2. The assays are low cost and provide an intensity-based readout compatible with widely available CMOS camera technology. Using this current platform, samples with H2O2 concentrations as low as 264 nM can be detected. The optimized system uses CCPO, BPEA, and imidazole in 9:1 EtOAc:CH3CN, the photography application VSCO, and sampling 75 µL of exhaled breath condensate (Figure 9c,d, 10–11). The utility of such a platform was demonstrated by monitoring H2O2 levels in exhaled breath condensate from human volunteers. It was found that this system provides a quantitative measure of H2O2 that showed good agreement with the "gold standard" Amplex Red assay. In future validation studies, we plan to enlist larger human subject enrollments and investigate the robustness of the assay across healthy volunteers and asthma patients where larger variations in H2O2 levels are expected. Taken together, the experiments in this study describe an affordable and widely accessible method to monitor H2O2 in exhaled breath condensate that could be optimized for home use, low resource clinics, or other point-of-care settings. Additionally, we anticipate that this method could have a broad impact on global research capacity, particularly in areas where access to spectrophotometers is a limiting factor.
Figure 10.
Calibration of 75 µL aliquots of 0–1500 nM H2O2 using 3.4 mM BPEA, 3.2 mM imidazole, and 1.9 mM CCPO in 9:1 EtOAc:CH3CN. Images were acquired 2–3 seconds after addition of H2O2 as the final reagent. Error bars are ± S.D (n = 3).
Highlights.
The peroxyoxalate chemiluminescent reaction enables smartphone detection of airway H2O2.
Optimization of reagents and camera settings provides a 264 nM detection limit.
Measurements of H2O2 in exhaled breath condensates match the Amplex Red assay.
Described methods offer low cost monitoring of ROS in human airways.
Acknowledgments
We thank Prof. Thomas Ritz, Prof. Dinesh Rajan, and Prof. Eric Bing for helpful discussions.
Funding Bodies
Research reported in this publication was supported by the National Institute of General Medical Sciences and the National Institute of Health under Award Number R15GM114792. The content is solely the responsibility of the authors and does not necessarily represent the official views of the National Institutes of Health. The authors acknowledge Southern Methodist University (start-up funds to A.R.L.) for providing financial support for this project. Additional funding was provided by the Engaged Learning program at Southern Methodist University (research funds to M.E.Q.) and the Dedman College of Humanities and Sciences Dean's Research Council Grant (research funds to A.R.L.). M.E.Q. was supported by a Hamilton Undergraduate Research Scholarship.
Footnotes
Publisher's Disclaimer: This is a PDF file of an unedited manuscript that has been accepted for publication. As a service to our customers we are providing this early version of the manuscript. The manuscript will undergo copyediting, typesetting, and review of the resulting proof before it is published in its final citable form. Please note that during the production process errors may be discovered which could affect the content, and all legal disclaimers that apply to the journal pertain.
Author Contributions
The manuscript was written through contributions of all authors. All authors have given approval to the final version of the manuscript.
Conflict of Interest
M.E.Q. and A.R.L. have a financial interest in BioLum Sciences, L.L.C., a company that develops smartphone-based devices for monitoring asthma.
References
- 1.Winterbourn CC. Reconciling the chemistry and biology of reactive oxygen species. Nat. Chem. Biol. 2008;4:278–286. doi: 10.1038/nchembio.85. [DOI] [PubMed] [Google Scholar]
- 2.Teng Y, Sun P, Zhang J, Yu R, Bai J, Yao X, Huang M, Adcock IM, Barnes PJ. Hydrogen Peroxide in Exhaled Breath Condensate in Patients with Asthma: A Promising Biomarker? Chest. 2011;140:108–116. doi: 10.1378/chest.10-2816. [DOI] [PubMed] [Google Scholar]
- 3.Murata K, Fujimoto K, Kitaguchi Y, Horiuchi T, Kubo K, Honda T. Hydrogen Peroxide Content and pH of Expired Breath Condensate from Patients with Asthma and COPD. COPD. 2014;11:81–87. doi: 10.3109/15412555.2013.830094. [DOI] [PubMed] [Google Scholar]
- 4.Loukides S, Bouros D, Papatheodorou G, Panagou P, Siafakas NM. The Relationships Among Hydrogen Peroxide in Expired Breath Condensate, Airway Inflammation, and Asthma Severity. Chest. 2002;121:338–346. doi: 10.1378/chest.121.2.338. [DOI] [PubMed] [Google Scholar]
- 5.Dozor AJ. The role of oxidative stress in the pathogenesis and treatment of asthma. Ann. N.Y. Acad. Sci. 2010;1203:133–137. doi: 10.1111/j.1749-6632.2010.05562.x. [DOI] [PubMed] [Google Scholar]
- 6.Horváth I, Donnelly LE, Kiss A, Kharitonov SA, Lim S, Chung KF, Barnes PJ. Combined Use of Exhaled Hydrogen Peroxide and Nitric Oxide in Monitoring Asthma. Am. J. Respir. Crit. Care Med. 1998;158:1042–1046. doi: 10.1164/ajrccm.158.4.9710091. [DOI] [PubMed] [Google Scholar]
- 7.Antczak A, Kurmanowska Z, Kasielski M, Nowak D. Inhaled glucocorticosteroids decrease hydrogen peroxide level in expired air condensate in asthmatic patients. Respir. Med. 2000;94:416–421. doi: 10.1053/rmed.1999.0801. [DOI] [PubMed] [Google Scholar]
- 8.Emelyanov A, Fedoseev G, Abulimity A, Rudinksi K, Fedoulov A, Karabanov A, Barnes PJ. Elevated Concentrations of Exhaled Hydrogen Peroxide in Asthmatic Patients. Chest. 2001;120:1136–1139. doi: 10.1378/chest.120.4.1136. [DOI] [PubMed] [Google Scholar]
- 9.Al Obaidi AH. Expired breath condensate hydrogen peroxide concentration and pH for screening cough variant asthma among chronic cough. Ann. Thorac. Med. 2007;2:18–22. doi: 10.4103/1817-1737.30357. [DOI] [PMC free article] [PubMed] [Google Scholar]
- 10.Ueno T, Kataoka M, Hirano A, Iio K, Tanimoto Y, Kanehiro A, Okada C, Soda R, Takahashi K, Tanimoto M. Inflammatory markers in exhaled breath condensate from patients with asthma. Respirology. 2008;13:654–663. doi: 10.1111/j.1440-1843.2008.01315.x. [DOI] [PubMed] [Google Scholar]
- 11.Caffarelli C, Calcinai E, Rinaldi L, Povesi Dascola C, Terracciano L, Corradi M. Hydrogen Peroxide in Exhaled Breath Condensate in Asthmatic Children during Acute Exacerbation and after Treatment. Respiration. 2012;84:291–298. doi: 10.1159/000341969. [DOI] [PubMed] [Google Scholar]
- 12.Dohlman AW, Black HR, Royall JA. Expired Breath Hydrogen Peroxide Is a Marker of Acute Airway Inflammation in Pediatric Patients with Asthma. Am. Rev. Respir. Dis. 1993;148:955–960. doi: 10.1164/ajrccm/148.4_Pt_1.955. [DOI] [PubMed] [Google Scholar]
- 13.Robroeks CMHHT, van de Kant KDG, Jöbsis Q, Hendriks HJE, van Gent R, Wouters EFM, Damoiseaux JGMC, Bast A, Wodzig WKWH, Dompeling E. Exhaled nitric oxide and biomarkers in exhaled breath condensate indicate the presence, severity and control of childhood asthma. Clin. Exp. Allergy. 2007;37:1303–1311. doi: 10.1111/j.1365-2222.2007.02788.x. [DOI] [PubMed] [Google Scholar]
- 14.Zhou M, Diwu Z, Panchuk-Voloshina N, Haugland RP. A Stable Nonfluorescent Derivative of Resorufin for the Fluorometric Determination of Trace Hydrogen Peroxide: Applications in Detecting the Activity of Phagocyte NADPH Oxidase and Other Oxidases. Anal. Biochem. 1997;253:162–168. doi: 10.1006/abio.1997.2391. [DOI] [PubMed] [Google Scholar]
- 15.Gallati H, Pracht I. Horseradish peroxidase: kinetic studies and optimization of peroxidase activity determination using the substrates H2O2 and 3,3’,5,5’-tetramethylbenzidine. J. Clin. Chem. Clin. Biochem. 1985;23:453–460. [PubMed] [Google Scholar]
- 16.(a) Zappacosta B, Persichilli S, Mormile F, Minucci A, Russo A, Giardina B, De Sole P. A fast chemiluminescent method for H2O2 measurement in exhaled breath condensate. Clin. Chim. Acta. 2001;310:187–191. doi: 10.1016/s0009-8981(01)00571-x. [DOI] [PubMed] [Google Scholar]; (b) Lippert AR, Van de Bittner GC, Chang CJ. Boronate Oxidation as a Bioorthogonal Reaction Approach for Studying the Chemistry of Hydrogen Peroxide in Living Systems. Acc. Chem. Res. 2011;44:793–804. doi: 10.1021/ar200126t. [DOI] [PMC free article] [PubMed] [Google Scholar]; (c) Winterbourn CC. The challenges of using fluorescent probes to detect and quantify specific reactive oxygen species in living cells. Biochim. Biophys. Acta. 2014;1840:730–738. doi: 10.1016/j.bbagen.2013.05.004. [DOI] [PubMed] [Google Scholar]
- 17.Lippert AR, Keshari KR, Kurhanewicz J, Chang CJ. A Hydrogen Peroxide-Responsive Hyperpolarized 13C MRI Contrast Agent. J. Am. Chem. Soc. 2011;133:3776–3779. doi: 10.1021/ja111589a. [DOI] [PMC free article] [PubMed] [Google Scholar]
- 18.Chen W, Cai S, Ren QQ, Wen W, Zhao YD. Recent advances in electrochemical sensing for hydrogen peroxide: a review. Analyst. 2012;137:49–58. doi: 10.1039/c1an15738h. [DOI] [PubMed] [Google Scholar]
- 19.Bing EG, Epstein MJ. Pharmacy on a Bicycle. SanFrancisco, CA: Berrett-Koehler Publishers, Inc.; 2013. [Google Scholar]
- 20.NIOX VERO® Home Page. [accessed February 20, 2016]; http://www.niox.com/en-US/ [Google Scholar]
- 21.(a) Donohue JF, Jain N. Exhaled nitric oxide to predict corticosteroid responsiveness and reduce asthma exacerbation rates. Respir. Med. 2013;107:943–952. doi: 10.1016/j.rmed.2013.02.018. [DOI] [PubMed] [Google Scholar]; (b) Peirsman EJ, Carvelli TJ, Hage PY, Hanssens LS, Pattyn L, Raes MM, Sauer KA, Vermeulen F, Desager KN. Exhaled nitric oxide in childhood allergic asthma management: a randomized controlled trial. Pediatr. Pulmonol. 2014;49:624–631. doi: 10.1002/ppul.22873. [DOI] [PubMed] [Google Scholar]
- 22.Aker JC, Mbiti IM. Washington, D.C.: Center for Global Development; 2010. [accessed February 24, 2016]. CGD Working Paper 211. http://www.cgdev.org/content/publications/detail/1424175. [Google Scholar]
- 23.(a) Vashist SK, Mundanyali O, Schneider EM, Zengerle R, Ozcan A. Cellphone-based devices for bioanalytical sciences. Anal. Biochem. Chem. 2014;406:3263–3277. doi: 10.1007/s00216-013-7473-1. [DOI] [PMC free article] [PubMed] [Google Scholar]; (b) Ozcan A. Mobile phones democratize and cultivate next-generation imaging, diagnostics and measurement tools. Lab Chip. 2014;14:3187–3194. doi: 10.1039/c4lc00010b. [DOI] [PMC free article] [PubMed] [Google Scholar]
- 24.Adiguzel Y, Kulah H. CMOS cell sensors for point-of-care diagnostics. Sensors. 2012;12:10042–10066. doi: 10.3390/s120810042. [DOI] [PMC free article] [PubMed] [Google Scholar]
- 25.Gubala V, Harris LF, Ricco AJ, Tan MX, Williams DE. Point of care diagnostics: status and future. Anal. Chem. 2012;84:487–515. doi: 10.1021/ac2030199. [DOI] [PubMed] [Google Scholar]
- 26.McGeough CM, O'Driscoll S. Camera phone-based quantitative analysis of C-reactive ELISA. IEEE Trans. Biomed. Circuits Sys. 2013;7:655–659. doi: 10.1109/TBCAS.2012.2234122. [DOI] [PubMed] [Google Scholar]
- 27.Lu Y, Shi W, Qin J, Lin B. Low cost, portable detection of gold nanoparticle-labeled microfluidic immunoassay with camera cell phone. Electrophoresis. 2009;30:579–582. doi: 10.1002/elps.200800586. [DOI] [PubMed] [Google Scholar]
- 28.Coskun AF, Wong J, Khodadadi D, Nagi R, Tey A, Ozcan A. A personalized food allergen testing platform on a cellphone. Lab Chip. 2013;13:636–640. doi: 10.1039/c2lc41152k. [DOI] [PMC free article] [PubMed] [Google Scholar]
- 29.(a) Hossain MA, Canning J, Rutledge PJ, Yen TL, Jamalipour A. Lab-in-a-Phone: Smartphone-based Portable Fluorometer for pH Field Measurements of Environmental Water. IEEE Sensors Journal. 2015;15:5095–5102. [Google Scholar]; (b) Hossain MA, Canning J, Ast S, Rutledge PJ, Jamalipour A. Early Warning Smartphone Diagnostics for Water Security and Analysis Using Real-Time pH Mapping. Photonic Sensors. 2015;5:289–297. [Google Scholar]
- 30.Zhu H, Sikora U, Ozcan A. Quantum dot enabled detection of Escherichia coli using a cell-phone. Analyst. 2012;137:2541–2544. doi: 10.1039/c2an35071h. [DOI] [PMC free article] [PubMed] [Google Scholar]
- 31.You DJ, Park TS, Yoon JY. Cell-phone-based measurement of TSH using Mie scatter optimized lateral flow assays. Biosens. Bioelectron. 2013;40:180–185. doi: 10.1016/j.bios.2012.07.014. [DOI] [PubMed] [Google Scholar]
- 32.Breslauer DN, Maamari RN, Switz NA, Lam WA, Fletcher DA. Mobile phone based clinical microscopy for global health applications. PLoS One. 2009;4:e6320. doi: 10.1371/journal.pone.0006320. [DOI] [PMC free article] [PubMed] [Google Scholar]
- 33.Xie H, Mire J, Kong Y, Chang M, Hassounah HA, Thornton CN, Sacchettini JC, Cirillo JD, Rao J. Rapid point-of-care detection of tuberculosis pathogen using a BlaC-specific fluorogenic probe. Nat. Chem. 2012;4:802–809. doi: 10.1038/nchem.1435. [DOI] [PMC free article] [PubMed] [Google Scholar]
- 34.Thom NK, Lewis GG, Yeung K, Phillips ST. Quantitative fluorescence assays using a self-powered paper-based microfluidic device and a camera-equipped cellular phone. RSC Adv. 2104;4:1334–1340. doi: 10.1039/C3RA44717K. [DOI] [PMC free article] [PubMed] [Google Scholar]
- 35.Mudanyali O, Tseng D, Oh C, Isikman SO, Sencan I, Bishara W, Oztoprak C, Seo S, Khademhosseini B, Ozcan A. Compact, light-weight and cost-effective microscope based on lensless incoherent holography for telemedicine applications. Lab Chip. 2010;10:1417–1428. doi: 10.1039/c000453g. [DOI] [PMC free article] [PubMed] [Google Scholar]
- 36.(a) Sabelle S, Renard PY, Pecorella K, de Suzzoni-Dézard S, Créminon C, Grassi J, Mioskowski C. Design and Synthesis of Chemiluminescent probes for the Detection of Cholinesterase Activity. J. Am. Chem. Soc. 2002;124:4874–4880. doi: 10.1021/ja0171299. [DOI] [PubMed] [Google Scholar]; (b) Lee D, Erigala VR, Dasari M, Yu J, Dickson RM, Murthy N. Detection of hydrogen peroxide with chemiluminescent micelles. Int. J. Nanomedicine. 2008;3:471–476. [PMC free article] [PubMed] [Google Scholar]; (c) Turan IS, Akkaya EU. Chemiluminescence Sensing of Fluoride Ions Using a Self-Immolative Amplifier. Org. Lett. 2014;16:1680–1683. doi: 10.1021/ol5003412. [DOI] [PubMed] [Google Scholar]
- 37.(a) Bailey TS, Pluth MD. Chemiluminescent Detection of Enzymatically Produced Hydrogen Sulfide: Substrate Hydrogen Bonding Influences Selectivity for H2S over Biological Thiols. J. Am. Chem. Soc. 2013;135:16697–16704. doi: 10.1021/ja408909h. [DOI] [PMC free article] [PubMed] [Google Scholar]; (b) Bag S, Tseng JC, Rochford J. A BODIPY-luminol chemiluminescent resonance energy-transfer (CRET) cassette for imaging of cellular superoxide. Org. Biomol. Chem. 2015;13:1763–1767. doi: 10.1039/c4ob02413c. [DOI] [PubMed] [Google Scholar]
- 38.(a) Lee D, Khaja S, Velasquez-Castano CJ, Dasari M, Sun C, Petros J, Taylor WR, Murthy N. In vivo imaging of hydrogen peroxide with chemiluminescent nanoparticles. Nat. Mater. 2007;6:765–769. doi: 10.1038/nmat1983. [DOI] [PubMed] [Google Scholar]; (b) Baumes JM, Gassensmith JJ, Giblin J, Lee JJ, White AG, Culligan WJ, Leevy WM, Kuno M, Smith BD. Stable, thermally activated, near-infrared chemiluminescent dyes and dye-stained microparticles for optical imaging. Nat. Chem. 2010;2:1025–1030. doi: 10.1038/nchem.871. [DOI] [PMC free article] [PubMed] [Google Scholar]; (c) Liu L, Mason RP. Imaging β-Galactosidase Activity in Human Tumor Xenografts and Transgenic Mice Using a Chemiluminescent Substrate. PLoS One. 2010;5:e12024. doi: 10.1371/journal.pone.0012024. [DOI] [PMC free article] [PubMed] [Google Scholar]; (d) Shuhendler AJ, Pu K, Cui L, Uetrecht JP, Rao J. Real-time imaging of oxidative and nitrosative stress in the liver of live animals for drug-toxicity testing. Nat. Biotechnol. 2014;32:373–380. doi: 10.1038/nbt.2838. [DOI] [PMC free article] [PubMed] [Google Scholar]; (e) Cao J, Lopez R, Thacker JM, Moon JY, Jiang C, Morris SNS, Bauer JH, Tao P, Mason RP, Lippert AR. Chemiluminescent probes for imaging H2S in living animals. Chem. Sci. 2015;6:1979–1985. doi: 10.1039/c4sc03516j. [DOI] [PMC free article] [PubMed] [Google Scholar]; (f) Cao J, Campbell J, Liu L, Mason RP, Lippert AR. In Vivo Chemiluminescent Imaging Agents for Nitroreductase and Tissue Oxygenation. Anal. Chem. 2016;88:4995–5002. doi: 10.1021/acs.analchem.6b01096. [DOI] [PMC free article] [PubMed] [Google Scholar]
- 39.(a) Ciscato LFML, Augusto FA, Weiss D, Bartoloni FH, Albrecht S, Brandl H, Zimmermann T, Baader WJ. The chemiluminescent peroxyoxalate system: state of the art almost 50 years from its discovery. ARKIVOC. 2012;iii:391–430. [Google Scholar]; (b) Augusto FA, de Souza GA, de Souza Júnior SP, Khalid M, Baader WJ. Efficiency of Electron Transfer Initiated Chemiluminescence. Photochem. Photobiol. 2013;89:1299–1317. doi: 10.1111/php.12102. [DOI] [PubMed] [Google Scholar]
- 40.Williams DC, III, Huff GF, Seitz WR. Evaluation of peroxyoxalate chemiluminescence for determination of enzyme generated peroxide. Anal. Chem. 1976;48:1003–1006. doi: 10.1021/ac60371a025. [DOI] [PubMed] [Google Scholar]
- 41.Gübitz G, van Zoonen P, Gooijer C, Velthorst NH, Frei RW. Immobilized Fluorophores in Dynamic Chemiluminescence Detection of Hydrogen Peroxide. Anal. Chem. 1985;57:2071–2074. [Google Scholar]
- 42.Stigbrand M, Pontén E, Irgum K. 1,1'-Oxalyldiimidazole as Chemiluminescence Reagent in the Determination of Low Hydrogen Peroxide Concentrations by Flow Injection Analysis. Anal. Chem. 1994;66:1766–1770. [Google Scholar]
- 43.Tsaplev YB. Chemiluminescence Determination of Hydrogen Peroxide. J. Anal. Chem. 2012;67:564–572. [Google Scholar]
- 44. [accessed February 22, 2016]; http://www.osnapphotoapp.com/ [Google Scholar]
- 45. [accessed February 22, 2016]; https://vsco.co/ [Google Scholar]
- 46.Stock solutions of BPEA were heated on a hot plate to achieve complete dissolution [Google Scholar]
- 47.Uppu RM. Synthesis of peroxynitrite using isoamyl nitrite and hydrogen peroxide in a homogeneous solvent system. Anal. Biochem. 2006;354:165–168. doi: 10.1016/j.ab.2005.11.003. [DOI] [PubMed] [Google Scholar]
- 48.Bruemmer KJ, Merrikhihaghi S, Lollar CT, Morris SNS, Bauer JH, Lippert AR. 19F magnetic resonance probes for live-cell detection of peroxynitrite using an oxidative decarbonylation reaction. Chem. Commun. 2014;50:12311–12314. doi: 10.1039/c4cc04292a. [DOI] [PubMed] [Google Scholar]
- 49.Van Zoonen P, Kamminga DA, Gooijer C, Velthorst NH, Frei RW. Flow injection determination of hydrogen peroxide by means of a solid-state peroxyoxalate chemiluminescence reactor. Anal. Chim. Acta. 1985;167:249–256. [Google Scholar]


