Abstract
The insulin/insulin-like growth factor (IGF) signaling pathway plays a critical role in the regulation of islet cell biology. However, the signaling pathway(s) utilized by insulin to directly modulate β-cells is unclear. To interrogate whether insulin exerts endocrine effects in regulating proteins in the insulin/IGF-1 signaling cascade in vivo in physiological states via the insulin receptor, we designed two experimental approaches: 1) glucose gavage and 2) hyperinsulinemic intravenous infusion, for studies in either β-cell specific insulin receptor knock-out (βIRKO) or control mice. Immunostaining of sections of pancreas (collected immediately after glucose gavage or insulin infusion) from controls showed significant increases in pAKT+, p-p70S6K+, and pERK+ β-cells and a significant decrease in % nuclear FoxO1+ β-cells compared with corresponding vehicle-treated groups. In contrast, in βIRKOs, we observed no significant changes in pAKT+ or p-p70S6K+ β-cells in either experiment; however, pERK+ β-cells were significantly increased, and an attenuated decrease in % nuclear FoxO1+ β cells was evident in response to glucose gavage or insulin infusion. Treatment of control and βIRKO β-cell lines with glucose or insulin showed significantly decreased % nuclear FoxO1+ β-cells suggesting direct effects. Furthermore, blocking MAPK signaling had virtually no effect on FoxO1 nuclear export in controls, in contrast to attenuated export in βIRKO β-cells. These data suggest insulin acts on β-cells in an endocrine manner in the normal situation; and that in β-cells lacking insulin receptors, insulin and glucose minimally activate the Akt pathway, while ERK phosphorylation and FoxO1 nuclear export occur independently of insulin signaling.
Keywords: beta cell (β-cell), FOXO, insulin, insulin receptor, signal transduction
Introduction
Multiple lines of evidence support the view that the pancreatic β-cell is an insulin/IGF-1 (insulin-like growth factor 1)3 responsive tissue, and that insulin itself contributes to the regulation of insulin secretion, proliferation, and survival of pancreatic β-cells (1–3). For example, insulin and IGF-1 receptors and the major insulin receptor substrates (IRS-1 through IRS-4) are present and functional in mammalian β-cells (4–7). Our laboratory has previously reported that mice with insulin receptor knock-out in β-cells (βIRKO) exhibit defects in glucose-stimulated insulin secretion and age-dependent progressive glucose intolerance that resembles human T2D (8–9). Poor cell cycle progression, nuclear restriction of FoxO1, and reduced expression of cell cycle proteins favoring growth arrest are key defects exhibited by islets derived from βIRKO mice (7–9). Although these observations are consistent with a role for insulin in the regulation of β-cell biology (reviewed in Ref. 3), it is still unclear how physiological changes in the levels of circulating (systemic) insulin directly impact downstream insulin signaling proteins in vivo.
This lack of clarity is, in part, related to the difficulty in interpreting data on potential independent effects of exogenous insulin versus endogenous insulin on β-cell biology in cultured β-cells and/or isolated islets due to continuous secretion of the hormone via the regulated and/or constitutive pathways. Furthermore, the lack of a suitable model precludes accurate estimates of local concentrations of insulin in close proximity to β-cells to assess its effects in the islet in a living organism. Whereas we and others have focused efforts to investigate the relevance of exogenous insulin on β-cell secretion in humans (10–12) the immediate alterations that occur in signaling proteins in the β-cells in vivo continue to be poorly understood. To reverse this state of ignorance we designed two independent experiments to simulate physiological states, in order to specifically examine the signaling effects of exogenous versus endogenous insulin on β-cells in vivo in mice: 1) a glucose gavage to simulate a physiological example of glucose-induced endogenous insulin secretion, and 2) a hyperinsulinemic i.v. infusion to examine the endocrine effects of mildly elevated circulating insulin on β-cells. Both protocols were performed in control mice and compared with mice lacking insulin receptors in β-cells (βIRKO) to dissect the role of the insulin receptor-mediated pathway in the regulation of downstream proteins. We report that, in the models we used, insulin acts in an endocrine manner to modulate β-cell signaling proteins in vivo in the normal state. Our results also indicate that, in β-cells lacking insulin receptors, insulin and glucose minimally activate the Akt pathway in β-cells, while ERK phosphorylation and nuclear export of FoxO1 occur independent of insulin signaling.
Results
Effects of Glucose-stimulated Insulin Secretion on Signaling Proteins in β-Cells in Vivo
We first investigated the effects of a physiological stimulus by a glucose gavage (Fig. 1A). Fasting glucose and insulin concentrations at time 0, as well as glycemia and insulin levels achieved 15 min after the gavages were comparable in control and βIRKO mice (Fig. 1, B and C). As expected, glucose levels were significantly increased in the glucose gavage groups compared with respective controls receiving saline gavage (p < 0.01 for both groups versus respective controls; Fig. 1B). Similarly, circulating insulin levels were elevated, and in the upper physiological range (13, 14), after the mice received glucose gavage compared with those receiving saline in both control and βIRKO mice (p < 0.05 for both groups versus respective control; Fig. 1C).
FIGURE 1.
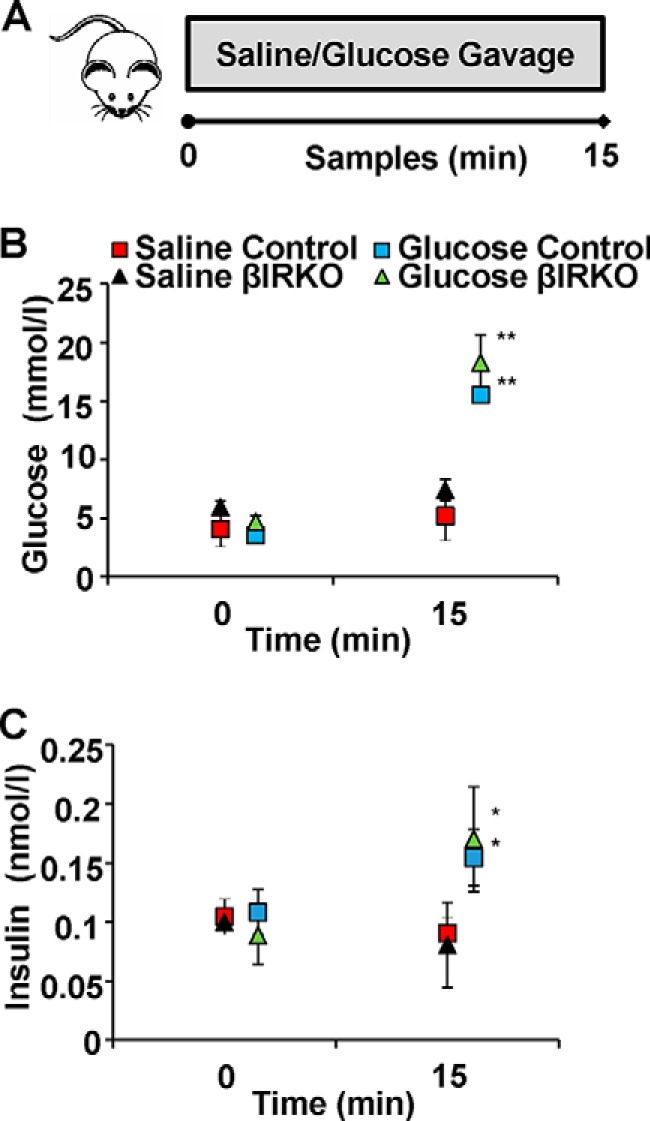
Experimental design and glucose and insulin levels during gavage studies. A, schematic of Experiment 1. Control mice (n = 6) or βIRKO mice (n = 8) underwent saline or glucose gavage as described in “Experimental Procedures.” Blood samples were collected at baseline and 15 min after the gavage. Pancreas was harvested and prepared for immunohistochemical analysis. B, glucose levels following saline gavage (red and black) and glucose gavage (blue and green) in controls (square) or βIRKOs (triangle). C, circulating insulin levels at baseline and following saline (red and black symbols) or glucose gavage (blue and green) in controls (square) or βIRKOs (triangle). *, p < 0.05; **, p < 0.01 compared with respective controls.
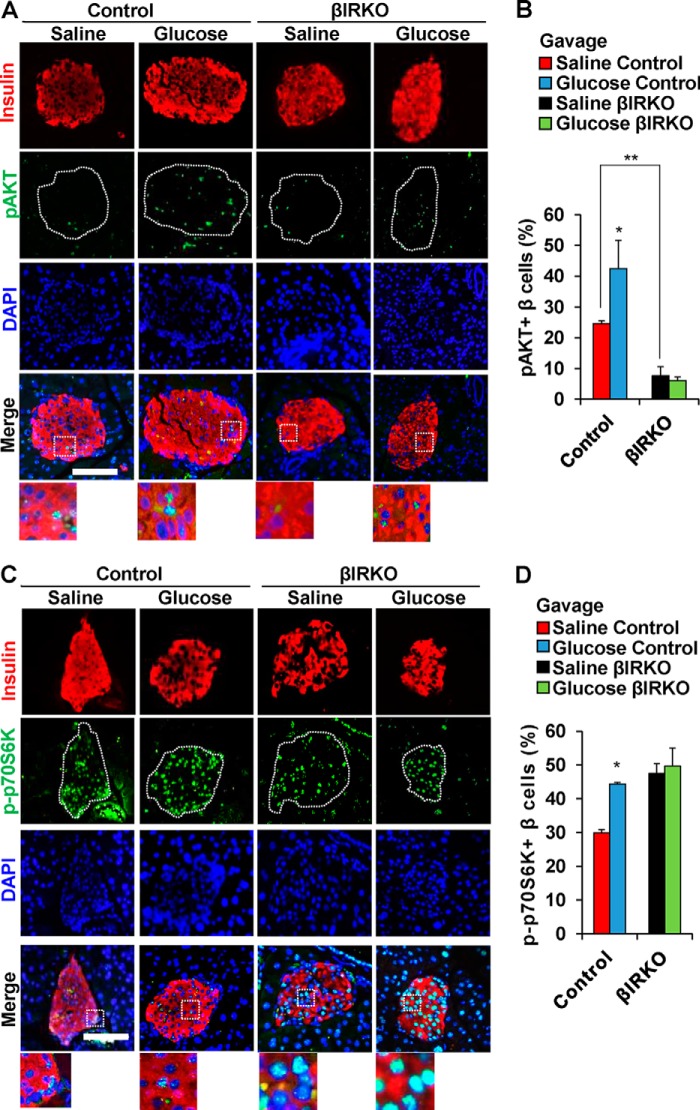
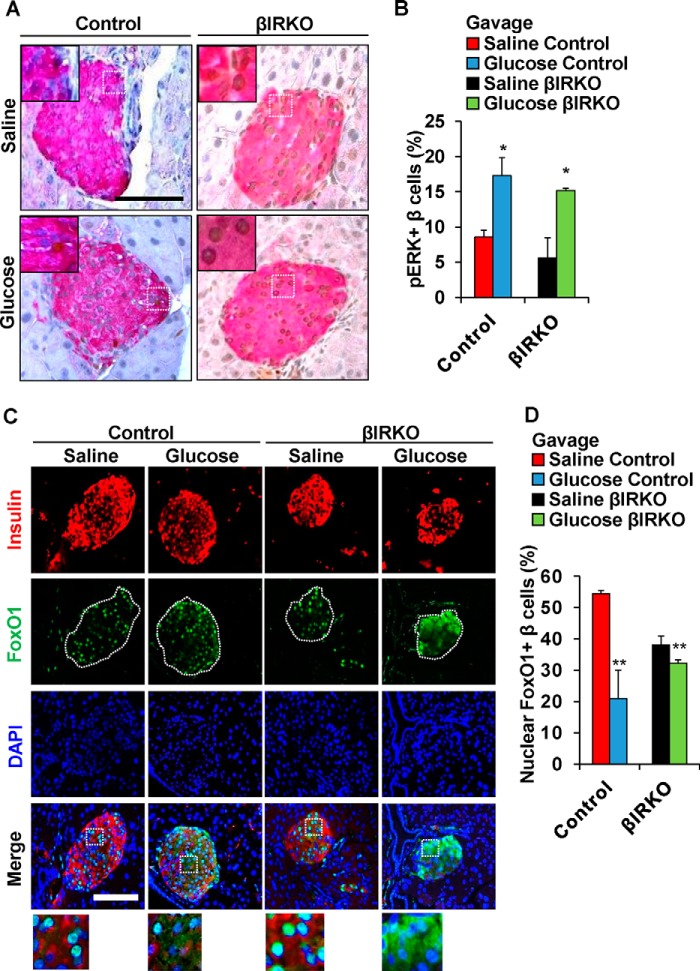
To examine the effects of secreted insulin on the insulin signaling pathway in β-cells, we used immunohistochemistry to analyze pancreas sections collected immediately after the end of the glucose or saline gavage. The % of β-cells that were positive for pAKT in the basal state were significantly lower in the βIRKOs compared with controls (p < 0.01, Fig. 2, A and B). We observed an increased % of β-cells that co-immunostained for pAKT in control mice after glucose gavage compared with controls with a saline gavage (p = 0.03, Fig. 2, A and B); in contrast to lack of significant changes in the βIRKOs (p = 0.30, Fig. 2, A and B). Similarly, there was an increased % of β-cells that co-immunostained for p-p70S6K in control mice that underwent glucose gavage compared with controls (p = 0.04, Fig. 2, C and D), while no changes were detected in % of β-cells that co-immunostained for p-p70S6K in βIRKO mice (p = 0.364, Fig. 2, C and D). Interestingly, the % of β-cells that co-immunostained for pERK was enhanced in both control and βIRKO mice that underwent glucose gavage compared with saline-gavaged controls (p = 0.04 and p = 0.02 respectively, Fig. 3, A and B). Consistently, we observed increased nuclear export of FoxO1 in both control and βIRKO mice that underwent glucose gavage compared with their respective controls, although the magnitude of change was much lower in the βIRKOs (p < 0.01 for both comparisons, Fig. 3, C and D).
FIGURE 2.
Alterations in pAKT and p-p70S6K in control or βIRKO mice following saline or glucose gavage. A, representative pictures of islets after saline or glucose gavage in control or βIRKO mice. Immunostaining for insulin (red) and pAKT (green) and DAPI (blue). 40× objective, scale bar 100 μm. 3× magnified images are shown from the Merge panel. B, percentage of β-cells positive for p-AKT following saline (red bar) or glucose gavage (blue bar) in control or following saline (black bar) or glucose gavage (green bar) in βIRKO mice. C, representative pictures of islets after saline or glucose gavage in Control or βIRKO mice. Immunostaining for insulin (red), p-p70S6K (green), and DAPI (blue) immunostaining. 40× objective, scale bar 100 μm. 3× magnified images are shown from the Merge panel. D, percentage of β-cells positive for p-p70S6K following following saline (red bar) or glucose gavage (blue bar) in control or following saline (black bar) or glucose gavage (green bar) in βIRKO mice. *, p < 0.05, compared with respective controls; **, p < 0.01 between saline control and saline βIRKO.
FIGURE 3.
Alterations pERK and nuclear versus cytosolic localization of FoxO1 in control or βIRKO mice following saline or glucose gavage. A, representative pictures of islets after saline or glucose gavage in Control or βIRKO mice. Immunostaining for insulin (red), and pERK (brown) immunostaining. 40× objective, scale bar 100 μm. Insets show representative magnified images. B, percentage of β-cells positive for pERK following saline (red bar) or glucose gavage (blue bar) in control or following saline (black bar) or glucose gavage (green bar) in βIRKO mice. C, representative pictures of islets after saline or glucose gavage in control or βIRKO mice. Immunostaining for insulin (red) and pFoxO1 (green) and DAPI (blue). 40× objective, scale bar 100 μm. 3× magnified images are shown from the Merge panel. D, percentage of β-cells positive for pFoxO1 following saline (red bar) or glucose gavage (blue bar) in control or following saline (black bar) or glucose gavage (green bar) in βIRKO mice. *, p < 0.05; **, p < 0.01 compared with respective controls.
Effects of Exogenous Insulin Infusion on Signaling Proteins in β-Cells in Vivo
We next explored the relevance of circulating insulin using a modified hyperinsulinemic clamp (Fig. 4A). Fasting glucose and insulin concentrations, as well as glycemia and insulin levels achieved 15 min after saline or insulin infusion, were comparable in the two groups (time 0, Fig. 4, B and C). As expected, glucose levels were decreased in insulin infusion groups compared with those undergoing saline infusions (time 15, p < 0.05 for both groups versus respective controls; Fig. 4B). Furthermore, circulating insulin levels were significantly raised after insulin infusion compared with saline infusion in both control and βIRKO groups (p < 0.01 for both groups versus respective control; Fig. 4C).
FIGURE 4.
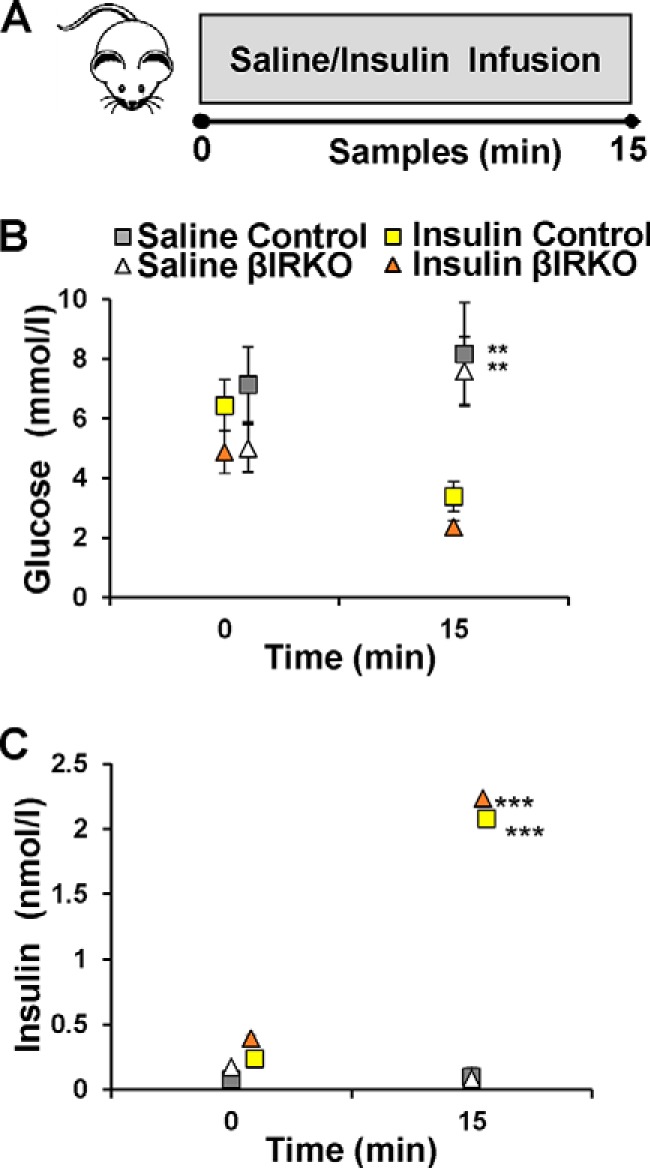
Experimental design and glucose and insulin levels during insulin infusion studies. A, schematic of experiment 2. Control mice (n = 6) or βIRKO mice (n = 8) underwent saline infusion or insulin infusion as described in “Experimental Procedures.” Blood samples were collected at baseline and 15 min after infusion. Pancreas was harvested for immunohistochemical analysis. B, glucose levels following saline infusion (gray and white) and insulin infusion (yellow and orange) in control (square) or βIRKOs (triangle). C, circulating insulin levels at baseline and following saline infusion (gray and white) and insulin infusion (yellow and orange) in control (square) or βIRKOs (triangle). **, p < 0.01 and ***, p < 0.001 compared with respective controls.
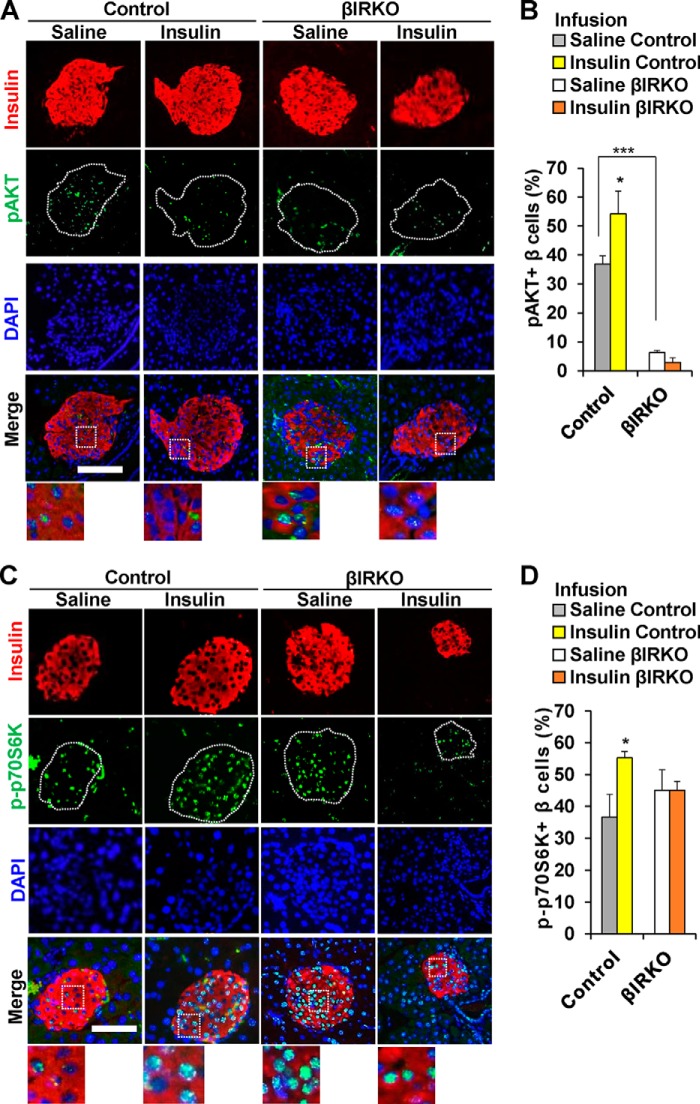
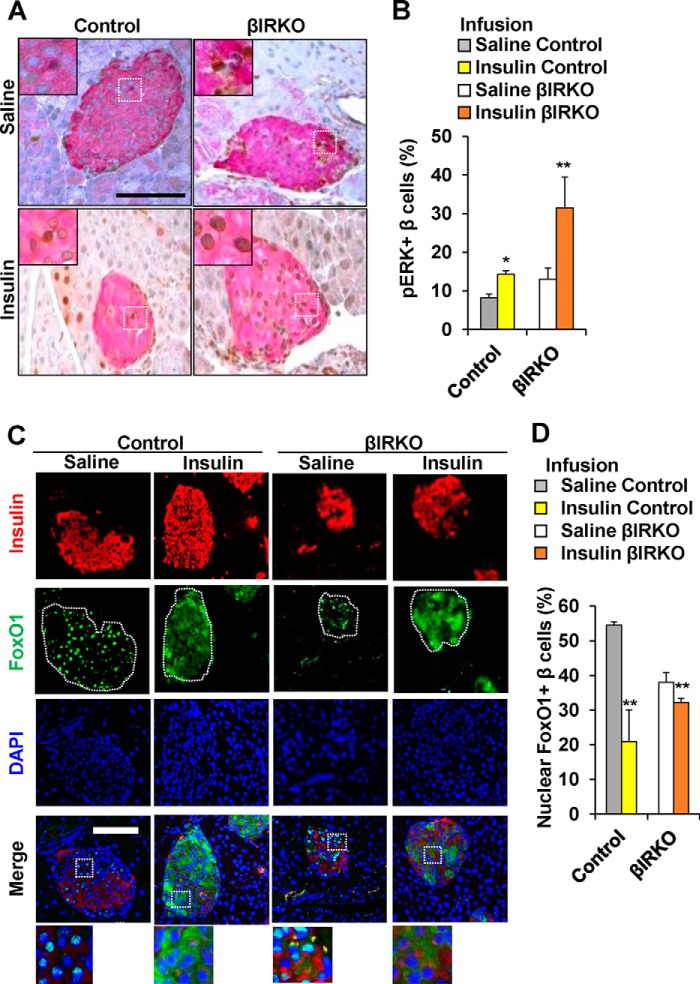
To examine whether exogenous insulin modulates the insulin signaling pathway of β-cells in an endocrine manner, we undertook immunohistochemistry of sections of pancreas harvested immediately after the end of the saline or insulin infusions. Similar to our observations in the gavage studies the % β-cells that were positive for pAKT in the basal state were significantly lower in the βIRKOs (p < 0.001, Fig. 5, A and B). The number of β-cells that co-immunostained for pAKT in control mice that underwent insulin infusion was significantly higher compared with those undergoing saline infusion (p = 0.03, Fig. 5, A and B), while no significant differences were evident between the two treatments in the βIRKO group (p = 0.30, Fig. 5, A and B). Control mice that underwent an insulin infusion showed increased % of β-cells that co-immunostained for p-p70S6K (p = 0.04, Fig. 5, C and D), compared with a lack of significant change in βIRKOs (p = 0.364, Fig. 5, C and D). Both control and βIRKO groups exhibited an increase in β-cells that co-immunostained for pERK after the insulin infusion (p = 0.04 and p = 0.02, respectively, Fig. 6, A and B), and the magnitude of change was somewhat greater in the βIRKOs.
FIGURE 5.
Alterations in pAKTand p-p70S6K in control or βIRKO mice following saline or insulin infusion. A, representative pictures of islets after saline or insulin infusion in Control or βIRKO mice. Immunostaining for insulin (red), pAKT (green), and DAPI (blue). 40× objective, scale bar 100 μm. 3× magnified images are shown from the Merge panel. B, percentage of β-cells positive for pAKT following saline (gray bar) or insulin infusion (yellow bar) in control or following saline (white bar) or insulin infusion (orange bar) in βIRKO mice. C, representative pictures of islets after saline or insulin infusion in control or βIRKO mice. Immunostaining for insulin (red), p-p70S6K (green), and DAPI (blue). 40× objective, scale bar 100 μm. 3× magnified images are shown from the Merge panel. D, percentage of β-cells positive for p-p70S6K following saline (gray bar) or insulin infusion (yellow bar) in control or following saline (white bar) or insulin infusion (orange bar) in βIRKO mice. *, p < 0.05, compared with respective controls; ***, p < 0.001 comparing saline control and saline βIRKO.
FIGURE 6.
Alterations in pERK and localization of FoxO1 in control or βIRKO mice following saline or insulin infusion. A, representative pictures of islets after saline or insulin infusion in both Control or βIRKO mice. Immunostaining for insulin (red), and pERK (brown). 40× objective, scale bar 100 μm. Insets show representative magnified images. B, percentage of β-cells positive for pERK following saline (gray bar) or insulin infusion (yellow bar) in control or following saline (white bar) or insulin infusion (orange bar) in βIRKO mice. C, representative pictures of islets after saline or insulin infusion in Control or βIRKO mice. Immunostaining for insulin (red) and pFoxO1 (green) and DAPI (blue). 40× objective, scale bar 100 μm. 3× magnified images are shown from the Merge panel. D, percentage of β-cells positive for pFoxO1 following saline (gray bar) or insulin infusion (yellow bar) in control or following saline (white bar) or insulin infusion (orange bar) in βIRKO mice. *, p < 0.05; **, p < 0.01 compared to respective controls.
The increase in nuclear export of FoxO1 was evident in both control and βIRKO mice that underwent insulin infusion compared with respective controls with the change in βIRKOs being smaller (p < 0.01 for both comparisons, Fig. 6, C and D) and was similar to that seen in the gavage studies.
Effects of Exogenous Glucose versus Exogenous Insulin Stimulation on Nuclear versus Cytoplasmic Localization of FoxO1 in β-Cells in Vitro
To examine the independent effects of hyperglycemia versus insulin signaling directly on the localization of FoxO1, we stimulated control or βIRKO β-cell lines either with glucose or exogenous insulin. After starvation, βIRKO cells demonstrated a trend toward reduced proportion of nuclear FoxO1 compared with control cells in the basal unstimulated condition (vehicle, Fig. 7, A and B). This difference reached statistical significance between groups in the presence of the PI3K inhibitor LY294002 (p = 0.03, LY294002, Fig. 7, A and B). Stimulation with 22.2 mm glucose for 30 min led to FoxO1 exclusion from the nucleus in βIRKO cells, but showed little effect in control cells (p < 0.01, High Glucose in Fig. 7, A and B). In contrast, and as expected, insulin (10 nm) stimulation for 30 min exported FoxO1 from the nucleus into the cytosol in controls, but had virtually no effect in β-cells lacking insulin receptors (βIRKO) (p < 0.01, Insulin, Fig. 7, A and B). These results indicate that glucose stimulation is sufficient to exclude FoxO1 from the nucleus in insulin receptor-deficient β-cells, while an insulin-mediated signal is necessary for a similar effect of glucose in controls. It is also possible that in this in vitro cell culture model the secreted insulin accumulated in the media acts via IGF-1 receptors to activate downstream signaling proteins that are common to the two ligands.
FIGURE 7.
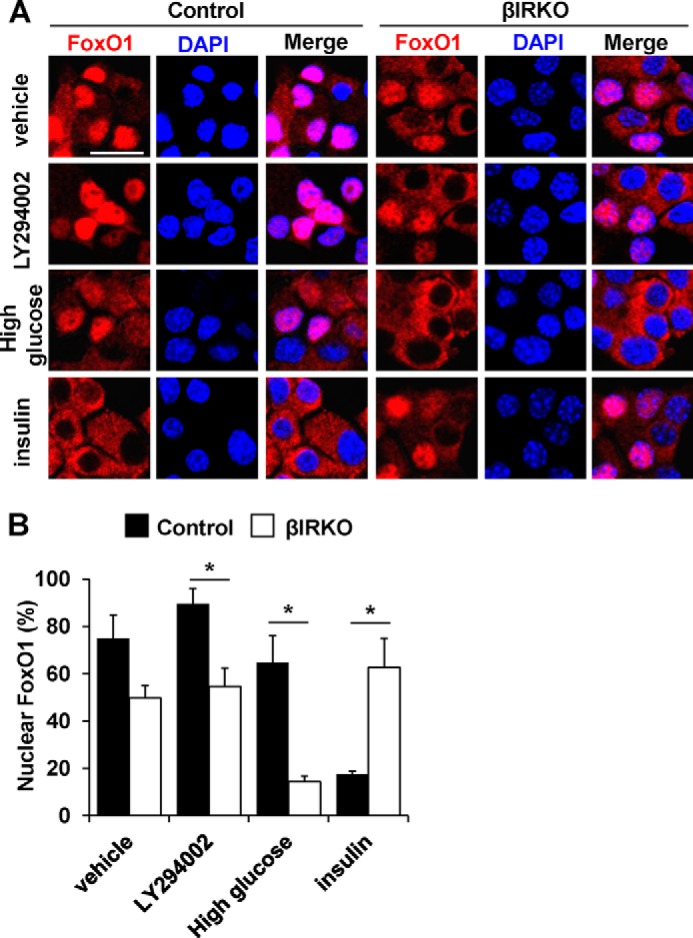
Effects of glucose or insulin stimulation on FoxO1 localization in β-cells. After starvation, control or βIRKO β-cell lines were treated with vehicle (PBS), PI3K inhibitor LY294002, high glucose (450 mg/dL), or insulin (10 nm) for 30 min. A, representative pictures of β-cells immunostained for FoxO1 (red) and DAPI (blue). The scale bar indicates 20 μm. B, the proportions of nuclear FoxO1-positive cells in control (filled bars) or βIRKO (empty bars) β-cell line. Data are mean ± S.E. *, p < 0.05 compared with respective controls.
Effects of Inhibition of the ERK1/2 Pathway on Insulin-independent Export of FoxO1 in β-Cells in Vitro
To assess the involvement of insulin receptor-mediated signals in the regulation of FoxO1 localization in βIRKO cells, we next examined the effects of multiple inhibitors individually including: 1) the PI3K inhibitor, LY294002; 2) the insulin/IGF-1 receptor dual inhibitor, OSI-906; 3), the Akt1/2 inhibitor, MK-2206; or 4) the MEK1/2 inhibitor U0126, on nuclear export of FoxO1 induced by a combination of glucose and insulin stimulation. The combination of glucose (22.2 mm) and insulin (10 nm) stimulation significantly reduced the proportion of nuclear FoxO1 in both control and βIRKO β-cells (Fig. 8, A and B). While the % of cells with nuclear FoxO1 localization was elevated in both groups the change was lower in βIRKO β-cells as compared with control β-cells treated with the PI3K inhibitor (LY294002), the dual insulin/IGF-1 receptor inhibitor (OSI-906), or its downstream Akt inhibitor (MK-2206), respectively (Fig. 8, A and B, LY294002, OSI-906, MK-2206). However, blocking ERK1/2 signaling with a Mek1/2 inhibitor (U0126) had virtually no effect on FoxO1 nuclear export in control β-cells (compared with vehicle), in contrast to significantly attenuated FoxO1-nuclear export in βIRKO cells (p < 0.01, U0126, Fig. 8, A and B). These data suggest that ERK-mediated FoxO1 nuclear export occurs partly independent of insulin signaling in βIRKO β-cells.
FIGURE 8.
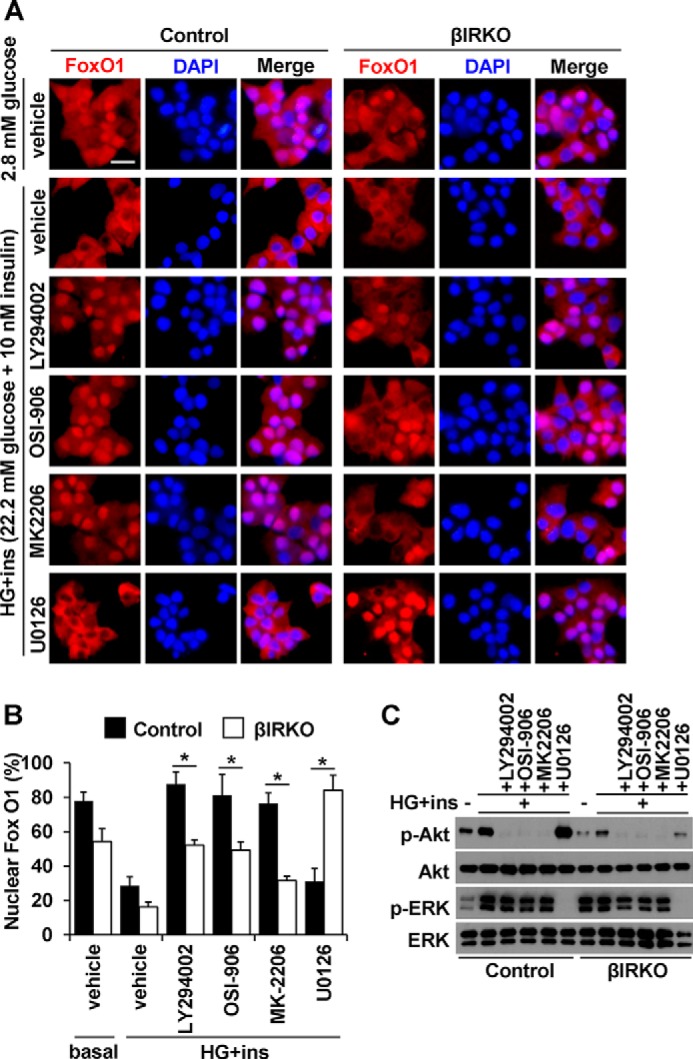
Effects of inhibitors on FoxO1 localization induced by insulin and glucose stimulation in β-cells. After starvation, control or βIRKO β-cell lines were treated with insulin (10 nm) in combination with high glucose (450 mg/dL), in the presence or absence of PI3K inhibitor LY294002, insulin receptor, and IGF1 receptor dual inhibitor OSI-906, Akt inhibitor MK2206, or MEK1/2 inhibitor U0126 for 30 min. A, representative pictures of β-cells immunostained for FoxO1 (red) and DAPI (blue). The scale bar indicates 20 μm. B, proportions of nuclear FoxO1 positive cells in control (filled bars) or βIRKO (white bars) β-cell line. C, Western blotting analysis of indicated proteins in control and βIRKO β-cell lines under the conditions described in A. Data are mean ± S.E. *, p < 0.05 compared with respective controls.
We confirmed the phosphorylation state of Akt and ERK in the presence of inhibitors described above. Stimulation of the cells with glucose or insulin promoted phosphorylation of Akt in both control and βIRKO cells, with the latter exhibiting reduced Akt phosphorylation both before and after stimulation (Fig. 8C and supplemental Fig. S1). This Akt phosphorylation was blunted when the stimulation with both glucose and insulin was performed independently in the presence of the PI3K inhibitor, the dual insulin/IGF-1 receptor inhibitor, or the Akt inhibitor, but not the MEK1/2 inhibitor. ERK was activated in the basal state in βIRKO cells, while the increase in the ratio of ERK phosphorylation to total ERK level was smaller in βIRKO cells (Fig. 8C and supplemental Fig. S1). The presence of the MEK1/2 inhibitor completely blocked ERK phosphorylation when the cells were stimulated with glucose and insulin in both control and βIRKO cells (Fig. 8C and supplemental Fig. S1).
Potential Role for IGF-1 Receptor Signaling in ERK1/2-mediated FoxO1 Nuclear Export in βIRKO β-Cells
To investigate the roles of insulin receptor and IGF-1 receptor-mediated signaling in FoxO1 localization in control and βIRKO cells, we used the dual insulin/IGF-1 receptor inhibitor (OSI-906). The presence of the dual inhibitor led to nuclear accumulation of FoxO1 after stimulation with insulin or glucose in control cells (Fig. 9, A and B). Notably, FoxO1-nuclear export was significantly reduced by the blockade of both insulin and IGF-1 receptor in βIRKO cells in basal, insulin stimulated, or glucose-stimulated conditions (Fig. 9, A and B). These results suggest that in β-cells lacking insulin receptors the nuclear export of FoxO1 induced by glucose is secondary to IGF-1R-mediated signaling.
FIGURE 9.
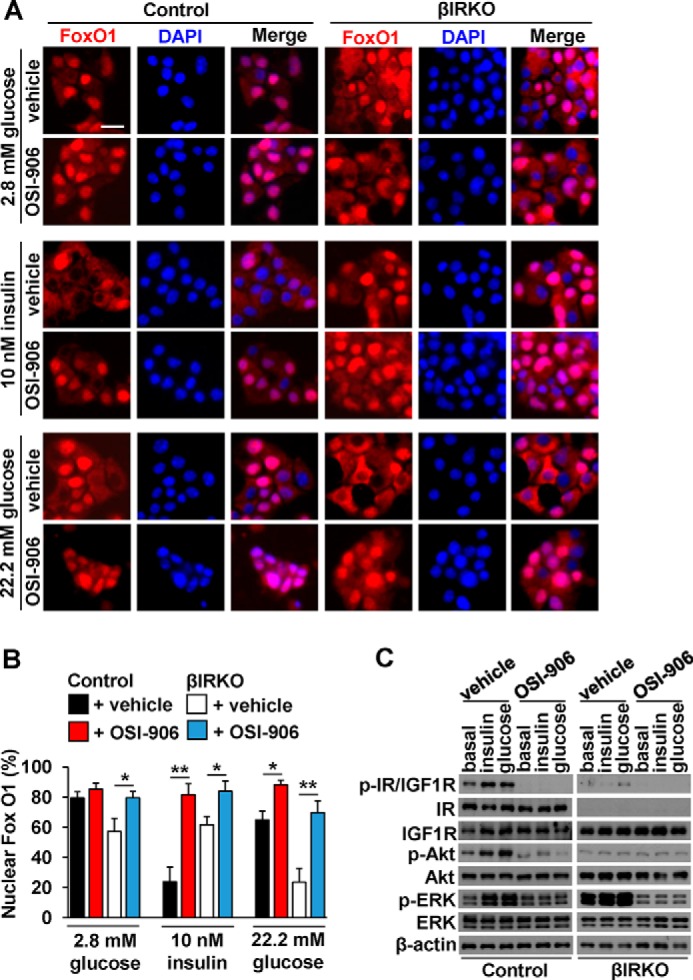
The role of IGF-1 receptor in FoxO1 localization induced by glucose stimulation in βIRKO cells. After starvation, control or βIRKO β-cell lines were treated with insulin (10 nm) or high glucose (450 mg/dL), in the presence or absence of insulin receptor and IGF1 receptor dual inhibitor OSI-906 for 30 min. A, representative pictures of β-cells immunostained for FoxO1 (red) and DAPI (blue). The scale bar indicates 20 μm. B, proportions of nuclear FoxO1-positive cells in control (black bars: vehicle, red bars: OSI-906), or βIRKO (white bars: vehicle, blue bars: OSI-906) β-cell line. C, Western blotting analysis of indicated proteins in control and βIRKO β-cell lines under the conditions described in A. Data are mean ± S.E. *, p < 0.05; **, p < 0.01 compared with respective vehicle.
We validated that the inhibitor, OSI-906, completely blocked phosphorylation of insulin and IGF-1 receptor evoked by insulin or glucose stimulation in both control and βIRKO cells (Fig. 9C and supplemental Fig. S2). Phosphorylation of Akt and ERK were also attenuated by the simultaneous inhibition of insulin and IGF-1 receptors in control cells. In βIRKO cells, treatment with OSI-906 significantly reduced phosphorylation levels of ERK in the basal state as well as stimulated conditions (Fig. 9C and supplemental Fig. S2). Together, these data indicate that in addition to the effects of insulin receptor activation, IGF-1 receptor-mediated signaling, contributes to ERK phosphorylation and FoxO1 localization in β-cells.
Discussion
In this study, we designed in vivo experiments to directly investigate the ability of insulin to modulate proteins in the growth factor (insulin/IGF-1) signaling pathway in β-cells. We report that signaling proteins downstream of the insulin/IGF-1 receptors are activated by circulating insulin levels and support a potential endocrine role for the hormone in regulating β-cell biology. We also observed that β-cells in mice with conditional disruption of functional insulin receptors (e.g. βIRKO) exhibit minimal activation of AKT pathways in response to glucose or insulin stimulation, in contrast to ERK and FoxO1 proteins, which were phosphorylated independently of insulin receptor signaling.
The effects of glucose and insulin to regulate signaling proteins to regulate β-cell secretion and/or proliferation continues to be a significant area of research because of the technical difficulties in evaluating the direct effects of ambient insulin in a cell type that also secretes the hormone. While we and several other investigators have developed in vitro models (15, 16, 18, 23, 24) the interpretation of data from in vivo models is especially limited by the tedious timeline (hours) to isolate islets after an in vivo stimulation experiment that does not accurately reflect immediate changes occurring in protein expression in the β-cells. This is in contrast to signaling effects easily discernible in homogeneous tissues such as skeletal muscle, liver, or adipose each of which can be rapidly isolated (minutes) after injection of stimuli in vivo. Studies in cultured islets are also not entirely physiological because they do not maintain their normal anatomical blood supply. Using an in vivo glucose infusion model, Alonso et al. (17) recently reported that, surprisingly, the effects of glucose on β-cell proliferation do not require the insulin receptor. In contrast, Martinez et al. (18), also using a knockdown (80% decrease in insulin receptors) approach, reported that glucose effects on β-cells are mediated primarily through insulin acting upon its own receptor. Our own studies, using a β-cell line with a knock-out of the insulin receptor, clearly indicate that glucose effects on signaling proteins in β-cells require functional insulin receptors (15). In addition to the limitations of using isolated islets/cell lines discussed above an additional confounding factor contributing to the divergent conclusions of the different studies could be because Alonso and colleagues used β-cells with an incomplete (50%) knockdown of the insulin receptor in contrast to a “knock-out” model used in our studies and a higher KD (80%) in the studies by Martinez et al. To clarify these issues, we carefully designed experiments in this study to capture the alterations in signaling proteins in β-cells in response to changes in circulating levels of glucose and/or insulin in vivo by harvesting the pancreas immediately after ending the stimulus for immunohistochemical analyses.
To evaluate insulin effects in vivo, we used glucose gavage as a physiological stimulus to increase insulin secretion. After gavage, both groups of animals showed a significant increase in blood glucose levels (16.6–19.4 mmol/liter) and circulating levels of insulin, albeit, elevated to a relatively physiological range (∼0.17 nmol/liter). In controls, the enhanced phosphorylation of Akt, ERK and p70S6K and nuclear exclusion of FoxO1 could be ascribed to the combined effects of elevated glucose and insulin. In the βIRKOs, the lack of phosphorylation of Akt and p70S6K suggests that the effects in the controls are solely due to glucose, and are dependent on insulin and not IGF-1 receptors. In the basal state, however, the increase in phosphorylation of p70S6K in the βIRKO islets may reflect altered mTORC1 activity due to changes in protein translation (19). On the other hand, a persistent phosphorylation of ERK, and a small but significant effect on nuclear exclusion of FoxO1 even in mice lacking insulin receptors in β-cells indicate that these effects of glucose in the βIRKOs occur independent of the insulin receptor and potentially secondary to IGF-1 receptor-mediated signaling. Collectively these data are consistent with our previous observations of a lack of increase in pAkt, while pERK is enhanced in βIRKO cell lines in response to glucose stimulation (15).
Next, the studies using i.v. infusion provided supra-physiological levels of insulin (2.06 nmol/liter) in the presence of relatively low blood glucose (3.33 mmol/liter), compared with the levels observed in the gavage study. While the overall response in signaling proteins was similar in the β-cells in the two experimental groups of animals, the magnitude of the increase in phosphorylation of ERK in the βIRKOs was greater compared with the corresponding response in the gavage study. A more striking observation was the near total nuclear exclusion of FoxO1 in the βIRKOs. Since glucose levels were much lower and insulin levels were higher in the infusion, compared with gavage studies, one interpretation of these data is that insulin modulates downstream effects via IGF-1 receptors, which are reported to be up-regulated in βIRKO cells (18).
Elevating insulin in vivo can also lead to secondary factors that, in turn, have the potential to impact islet cells. For example, nutrient, neural and/or hormonal activation of growth factor signaling and the post-transcriptional modification of a variety of genes, miRNA or via the microbiome and peptides acting on the CNS (reviewed in Refs. 20–22) all have the potential to indirectly regulate β-cell biology. Therefore, we also used β-cell lines derived from control or βIRKO mice to investigate the direct effects of glucose versus insulin in the context of FoxO1 translocation (8). The absence of a significant effect of high glucose or treatment with the PI3K inhibitor (LY294002) on the localization of FoxO1 in control β-cells suggests that either the effects of glucose on excluding FoxO1 from the nucleus are difficult to appreciate and/or the effects of insulin are dominant in control β-cells. Additional evidence for direct effects of insulin on β-cells was evident from treating β-cell lines with inhibitors. Thus, consistent with the in vivo experiments, stimulation with a combination of (glucose+insulin) promoted nuclear exclusion of FoxO1 in both control and βIRKO β-cell lines. Furthermore, inhibition of PI3K, IR, and IGF1R, or Akt1/2 with specific inhibitors in independent experiments, minimized translocation of FoxO1 from the nucleus induced by the combined treatment of (glucose+insulin) in both control and βIRKO β-cells. These data suggest that the effects of glucose are reversed by blocking PI3K and Akt, which are known to be involved in the regulation of FoxO1 (1, 17). The ability of OSI-906, which blocks both insulin and IGF-1 receptors, to reverse the effects of the combination of (glucose+insulin) suggests that the effects of glucose on FoxO1 are dependent, in part, on insulin/IGF-1 receptors. Although glucose has been shown to activate Akt, in MIN6 and INS-1 cells, for which FoxO1 is a known substrate (17, 23–25), the ability of OSI-906 to reverse glucose-induced nuclear export of FoxO1 to near basal levels in βIRKO cells, suggests that the effects of glucose are linked to IGF-1 receptor signaling.
Our observation of potential effects of glucose regulating ERK pathways that directly promotes FoxO1 export to allow transcriptional effects in β-cells could explain, in part, the 15-fold activation of MAP kinase in response to physiological concentrations of glucose (3–12 mm) in INS-1 β-cells (23). It is also evident from our studies that this effect is independent from the insulin signaling/AKT pathway, and is observed when β-cells are stimulated either by a glucose gavage or when circulating insulin is enhanced in an infusion setting. Of note, blocking ERK1/2 signaling attenuated FoxO1-nuclear export in βIRKOs, suggesting that ERK phosphorylation and FoxO1 nuclear export occur independently of insulin signaling. This is in agreement with previous data (18, 26) that the effects of glucose on ERK activity occur in the absence of insulin signaling. While these data indicate that FoxO1 proteins are major targets of insulin action, they also support the possibility that FoxO1 can be activated independent of insulin signaling. The inhibition of insulin receptor and IGF-1 receptor signaling with OSI-906 resulted in the dephosphorylation and nuclear retention of ERK in βIRKO cells. Further studies are warranted to dissect the mechanism(s) of glucose versus insulin/IGF-1 in the regulation of specific target proteins involved in proliferation and/or secretory function in β-cells in dynamic and context-specific states.
Experimental Procedures
Animals
12-week-old β-cell specific insulin receptor knock-out (βIRKO) mice (expressing Cre recombinase on the rat insulin promoter or RIP-Cre) and backcrossed on the C57Bl/6 background for at least 15 generations (8) were studied along with control (C57Bl/6) mice. Mice were housed in controlled temperature (23 °C) conditions with 12-hour light/dark cycle in the Animal Care Facility at Joslin Diabetes Center, Boston. All studies conducted and protocols used were approved by the Institutional Animal Care and Use Committee of the Joslin Diabetes Center and in accordance with National Institute of Health guidelines.
Study Design and Experimental Procedures
To investigate how insulin regulates downstream signaling proteins in vivo, we designed two experimental approaches. First, we simulated the effects of a physiological stimulus by performing either a glucose (GG) (1 g/kg) or saline gavage (SG) separately in β-cell specific insulin receptor knock-out (βIRKO) or control mice (Experiment 1, n = 3–4 each group, total 4 groups). Second, to explore the potential endocrine effects of circulating insulin we performed either a 15-min saline infusion or an insulin infusion (150 mUI/kg priming followed by 15 pmol·kg−1·min−1 insulin infusion rate) (Experiment 2, n = 3–4 each group, total 4 groups). Plasma glucose and plasma insulin levels were measured at time 0 min (fasting) and at 15 min (Figs. 1A and 3A). Blood samples (∼2 μl) were collected from the tail vein (27).
Experiment 1
All mice were fasted overnight for 14 h followed by an oral saline or glucose (1 g/kg body wt.) gavage. Blood glucose was measured using an automatic glucometer (Glucometer Elite; Bayer) immediately before (time 0) and 15 min after the injection.
Experiment 2
At least 4 days before infusion experiments mice were anesthetized with an intraperitoneal injection of ketamine (100 mg/kg body wt.) and xylazine (10 mg/kg body wt.), and an indwelling catheter was inserted into the right internal jugular vein as previously described (28, 29). On the day of the infusion experiment, a three-way connector was attached to the jugular vein catheter to deliver solutions intravenously (e.g. saline or insulin), and blood samples were obtained from the tail vein. The infusion experiments were performed in the awake state after an overnight fast in both controls and βIRKO mice. During the saline infusion, normal saline was infused for 15 min at a rate that matched the volume required during a hyperinsulinemic clamp. Consistent with a standard hyperinsulinemic euglycemic clamp experiment, a hyperinsulinemic i.v. infusion was conducted with a primed (150 mU/kg body wt) and continuous infusion of B28 Asp-insulin (NovologTM, NovoNordisk, Bagsvaerd, Denmark) at a rate of 15 pmol·kg−1·min−1 to raise plasma insulin within the physiological range (∼200 pm) (30). Since the insulin infusion finished before a significant drop in glycemia, glucose was not infused during the infusion experiments.
Assays
Blood glucose was monitored using an automated glucose monitor (Glucometer Elite, Bayer), and plasma insulin levels were detected by ELISA (Insulin Mouse ELISA, Crystal Chem) at the Joslin Assay Core Facility.
Immunohistochemistry
At the end of each in vivo experiment, mice were anesthetized, and the pancreas was rapidly dissected (∼3 min), fixed in Z-fix, and then embedded in paraffin. Five-micrometer thin sections were stained using antibodies to p-AKT (Cell Signaling, cat. 37879); p-p70S6K (Cell Signaling, cat. 9204), p-ERK (Cell Signaling, cat. 4370), FoXO1 (Cell Signaling), or insulin (Cell Signaling, rabbit mono, cat. 3014) and appropriate secondary antibodies and counterstained with DAPI as the nuclear marker.
All islets in the pancreas sections were imaged at 200x (20× objective) or 400× (40× objective) by a fluorescent microscope (Olympus BX-61; Olympus America, Melville, NY) equipped with a DP72 digital camera and the number of insulin-positive cells was manually counted in a blinded fashion by a single observer. Insulin+ cells showing nuclear DAPI staining were scored as β-cells. Between 1,000 and 2,000 β-cell nuclei were counted for each pancreas section, and data were expressed as mean percentage of p-AKT, p-p70S6K, p-ERK, or pFoxO1+ β-cells for both control and βIRKO mice in each experiment.
Cell Culture Methods
β-Cell lines generated from βIRKO or controls have been reported previously (8). Cell lines were maintained in DMEM containing 25 mm glucose supplemented with 10% (v/v) FBS and 100 units/ml penicillin/streptomycin. Experiments were performed using 80–90% confluent cells. Cells were starved 12 h in 2.8 mm glucose-containing medium without serum. Cells were treated with 22.2 mm glucose (Sigma Aldrich) and/or 10 nm human insulin (Sigma-Aldrich) in DMEM medium for 30 min in the presence or absence of LY294002 (50 μm, PI3K inhibitor, Cell signaling), OSI-906 (200 nm, IR and IGF1R dual inhibitor, Selleck) MK-2206 (5 μm, specific Akt inhibitor, Santa Cruz Biotechnology), or U0126 (20 μm, MEK1/2 inhibitor, Cell Signaling).
Immunofluorescence
Cells were incubated on poly-l-lysine pre-coated cover slips during starvation and stimulation. Cells on coverslips were fixed with 1% formaldehyde and stained with FoxO1 antibody (Cell Signaling), followed by anti-rabbit IgG-Alexa594 (Jackson). Coverslips were treated with mounting media (DAKO), and cells were analyzed using a LSM710 confocal laser scanning microscope (Carl Zeiss). The nuclear localization of FoxO1 was determined by fluorescent intensity measured with Image J software. At least 200 cells per group were counted in each experiment.
Western Blotting Analysis
For Western blotting analysis, cells were lysed in ice-cold M-PER buffer (Pierce) with protease inhibitor and phosphatase inhibitors (Sigma). The samples were incubated with primary antibodies overnight at 4 °C, and Western blotting analysis was performed as reported previously (15). Insulin receptor β-subunit (3025), IGF-1 receptor β-subunit (no. 3124), phospho-insulin receptor/IGF-1 receptor (no. 3024), Akt (no. 9272), phospho-Akt (Ser-473, no. 9271), β-actin (no. 6967), ERK (no. 9162), and p-ERK (no. 4370) antibodies are from Cell Signaling.
Statistical Analysis
Statistical analysis was performed by Student's t test or ANOVA as appropriate. All values are expressed as means ± S.E., and statistical significance was set at p < 0.05.
Author Contributions
T. M., J. S., and R. N. K. conceived the idea. T. M. and J. S. generated the data and wrote/reviewed/edited the manuscript. R. N. K. reviewed/edited manuscript. J. H. and R. M. researched data. A. G. edited the manuscript.
Supplementary Material
This work was supported by Grants R01 DK67536 (to R. N. K.) and R01 DK103215 (to R. N. K.) from the National Institutes of Health, Diabete Ricerca (to A. G. and T. M.), European Society for Clinical Nutrition and Metabolism (to T. M.), European Foundation for the study of Diabetes and Università Cattolica del Sacro Cuore, Linea D3.2 2015 (to A. G.), and the Japan Society for the Promotion of Science (JSPS) (to J. S.). The authors declare that they have no conflicts of interest with the contents of this article. The content is solely the responsibility of the authors and does not necessarily represent the official views of the National Institutes of Health.

This article contains supplemental Figs. S1–S2.
- IGF
- insulin-like growth factor
- βIRKO
- β-cell specific insulin receptor knock-out
- IRS
- insulin receptor substrate.
References
- 1. Accili D. (2004) Lilly lecture 2003: The struggle for mastery in insulin action: from triumvirate to republic. Diabetes 53, 1633–1642 [DOI] [PubMed] [Google Scholar]
- 2. LeRoith D., and Gavrilova O. (2006) Mouse models created to study the pathophysiology of Type 2 diabetes. Int. J. Biochem. Cell Biol. 38, 904–912 [DOI] [PubMed] [Google Scholar]
- 3. Goldfine A. B., and Kulkarni R. N. (2012) Modulation of β-cell function: a translational journey from the bench to the bedside. Diabetes Obes. Metab. 14, 152–160 [DOI] [PubMed] [Google Scholar]
- 4. Assmann A., Hinault C., and Kulkarni R. N. (2009) Growth factor control of pancreatic islet regeneration and function. Pediatr. Diabetes 10, 14–32 [DOI] [PMC free article] [PubMed] [Google Scholar]
- 5. Gunton J. E., Kulkarni R. N., Yim S., Okada T., Hawthorne W. J., Tseng Y. H., Roberson R. S., Ricordi C., O'Connell P. J., Gonzalez F. J., and Kahn C. R. (2005) Loss of ARNT/HIF1β mediates altered gene expression and pancreatic-islet dysfunction in human type 2 diabetes. Cell 122, 337–349 [DOI] [PubMed] [Google Scholar]
- 6. Leibiger I. B., Leibiger B., Moede T., and Berggren P. O. (1998) Exocytosis of insulin promotes insulin gene transcription via the insulin receptor/PI-3 kinase/p70 s6 kinase and CaM kinase pathways. Mol Cell 1, 933–938 [DOI] [PubMed] [Google Scholar]
- 7. Muller D., Huang G. C., Amiel S., Jones P. M., and Persaud S. J. (2006) Identification of insulin signaling elements in human beta-cells: autocrine regulation of insulin gene expression. Diabetes 55, 2835–2842 [DOI] [PubMed] [Google Scholar]
- 8. Kulkarni R. N., Brüning J. C., Winnay J. N., Postic C., Magnuson M. A., and Kahn C. R. (1999) Tissue-specific knockout of the insulin receptor in pancreatic beta cells creates an insulin secretory defect similar to that in type 2 diabetes. Cell 96, 329–339 [DOI] [PubMed] [Google Scholar]
- 9. Kulkarni R. N., Winnay J. N., Daniels M., Brüning J. C., Flier S. N., Hanahan D., and Kahn C. R. (1999) Altered function of insulin receptor substrate-1-deficient mouse islets and cultured beta-cell lines. J. Clin. Invest. 104, R69–R75 [DOI] [PMC free article] [PubMed] [Google Scholar]
- 10. Halperin F., Lopez X., Manning R., Kahn C. R., Kulkarni R. N., and Goldfine A. B. (2012) Insulin augmentation of glucose-stimulated insulin secretion is impaired in insulin-resistant humans. Diabetes 61, 301–309 [DOI] [PMC free article] [PubMed] [Google Scholar]
- 11. Lopez X., Cypess A., Manning R., O'Shea S., Kulkarni R. N., and Goldfine A. B. (2011) Exogenous insulin enhances glucose-stimulated insulin response in healthy humans independent of changes in free fatty acids. J. Clin. Endocrinol. Metab. 96, 3811–3821 [DOI] [PMC free article] [PubMed] [Google Scholar]
- 12. Mari A., Tura A., Natali A., Anderwald C., Balkau B., Lalic N., Walker M., Ferrannini E., RISC Investigators. (2011) Influence of hyperinsulinemia and insulin resistance on in vivo β-cell function: their role in human β-cell dysfunction. Diabetes 60, 3141–3147 [DOI] [PMC free article] [PubMed] [Google Scholar]
- 13. Goren H. J., Kulkarni R. N., and Kahn C. R. (2004) Glucose Homeostasis and Tissue Transcript Content of Insulin Signaling Intermediates in Four Inbred Strains of Mice: C57BL/6, C57BLKS/6, DBA/2, and 129X1H. Endocrinology 145, 3307–3323 [DOI] [PubMed] [Google Scholar]
- 14. Andrikopoulos S., Blair A. R., Deluca N., Fam B. C., and Proietto J. (2008) Evaluating the glucose tolerance test in mice. Am. J. Physiol. Endocrinol. Metab. 295, E1323–E1332 [DOI] [PubMed] [Google Scholar]
- 15. Assmann A., Ueki K., Winnay J. N., Kadowaki T., and Kulkarni R. N. (2009) Glucose effects on beta-cell growth and survival require activation of insulin receptors and insulin receptor substrate 2. Mol. Cell Biol. 29, 3219–3228 [DOI] [PMC free article] [PubMed] [Google Scholar]
- 16. Dickson L. M., Lingohr M. K., McCuaig J., Hugl S. R., Snow L., Kahn B. B., Myers M. G. Jr, and Rhodes C. J. (2001) Differential activation of protein kinase B and p70(S6)K by glucose and insulin-like growth factor 1 in pancreatic beta-cells (INS-1). J. Biol. Chem. 276, 21110–21120 [DOI] [PubMed] [Google Scholar]
- 17. Stamateris R. E., Sharma R. B., Kong Y., Ebrahimpour P., Panday D., Ranganath P., Zou B., Levitt H., Parambil N. A., O'Donnell C. P., Garcia-Ocana A., and Alonso L. C. (2016) Glucose induces mouse beta cell proliferation via IRS2, mTOR and cyclin D2 but not the insulin receptor. Diabetes 65, 981–995 [DOI] [PMC free article] [PubMed] [Google Scholar]
- 18. Martinez S. C., Cras-Méneur C., Bernal-Mizrachi E., and Permutt M. A. (2006) Glucose regulates Foxo1 through insulin receptor signaling in the pancreatic islet beta-cell. Diabetes 55, 1581–1591 [DOI] [PubMed] [Google Scholar]
- 19. Liew C. W., Assmann A., Templin A. T., Raum J. C., Lipson K. L., Rajan S., Qiang G., Hu J., Kawamori D., Lindberg I., Philipson L. H., Sonenberg N., Goldfine A. B., Stoffers D. A., Mirmira R. G., Urano F., and Kulkarni R. N. (2014) Insulin regulates carboxypeptidase E by modulating translation initiation scaffolding protein eIF4G1 in pancreatic β cells. Proc. Natl. Acad. Sci. U.S.A. 111, E2319–E2328 [DOI] [PMC free article] [PubMed] [Google Scholar]
- 20. Mezza T., and Kulkarni R. N. (2014) The regulation of pre- and post-maturational plasticity of mammalian islet cell mass. Diabetologia. 57, 1291–1303 [DOI] [PubMed] [Google Scholar]
- 21. Zhang C., Caldwell T. A., Mirbolooki M. R., Duong D., Park E. J., Chi N. W., and Chessler S. D. (2016) Extracellular CADM1 interactions influence insulin secretion by rat and human islet β-cells and promote clustering of syntaxin-1. Am. J. Physiol. Endocrinol. Metab. 310, E874–E885 [DOI] [PMC free article] [PubMed] [Google Scholar]
- 22. Perry R. J., Peng L., Barry N. A., Cline G. W., Zhang D., Cardone R. L., Petersen K. F., Kibbey R. G., Goodman A. L., and Shulman G. I. (2016) Acetate mediates a microbiome-brain-β-cell axis to promote metabolic syndrome. Nature 534, 213–217 [DOI] [PMC free article] [PubMed] [Google Scholar]
- 23. Ohsugi M., Cras-Méneur C., Zhou Y., Bernal-Mizrachi E., Johnson J. D., Luciani D. S., Polonsky K. S., and Permutt M. A. (2005) Reduced expression of the insulin receptor in mouse insulinoma (MIN6) cells reveals multiple roles of insulin signaling in gene expression, proliferation, insulin content, and secretion. J. Biol. Chem. 280, 4992–5003 [DOI] [PubMed] [Google Scholar]
- 24. Da Silva Xavier G., Qian Q., Cullen P. J., and Rutter G. A. (2004) Distinct roles for insulin and insulin-like growth factor-1 receptors in pancreatic beta-cell glucose sensing revealed by RNA silencing. Biochem. J. 377, 149–158 [DOI] [PMC free article] [PubMed] [Google Scholar]
- 25. Wrede C. E., Dickson L. M., Lingohr M. K., Briaud I., and Rhodes C. J. (2002) Protein kinase B/Akt prevents fatty acid-induced apoptosis in pancreatic beta-cells (INS-1). J. Biol. Chem. 277, 49676–49684 [DOI] [PubMed] [Google Scholar]
- 26. Khoo S., and Cobb M. H. (1997) Activation of MAP kinase by glucose is not required for insulin secretion. Proc. Natl. Acad. Sci. U.S.A. 94, 5599–5604 [DOI] [PMC free article] [PubMed] [Google Scholar]
- 27. Ayala J. E., Samuel V. T., Morton G. J., Obici S., Croniger C. M., Shulman G. I., Wasserman D. H., McGuinness O. P., and NIH Mouse Metabolic Phenotyping Center Consortium. (2010) Standard operating procedures for describing and performing metabolic tests of glucose homeostasis in mice. Dis. Model. Mech. 3, 525–534 [DOI] [PMC free article] [PubMed] [Google Scholar]
- 28. Kim J. K., Michael M. D., Previs S. F., Peroni O. D., Mauvais-Jarvis F., Neschen S., Kahn B. B., Kahn C. R., and Shulman G. I. (2000) Redistribution of substrates to adipose tissue promotes obesity in mice with selective insulin resistance in muscle. J. Clin. Invest. 105, 1791–1797 [DOI] [PMC free article] [PubMed] [Google Scholar]
- 29. Fabrizi M., Marchetti V., Mavilio M., Marino A., Casagrande V., Cavalera M., Moreno-Navarrete J. M., Mezza T., Sorice G. P., Fiorentino L., Menghini R., Lauro R., Monteleone G., Giaccari A., Fernandez Real J. M., and Federici M. (2014) IL-21 is a major negative regulator of IRF4-dependent lipolysis affecting Tregs in adipose tissue and systemic insulin sensitivity. Diabetes 63, 2086–2096 [DOI] [PubMed] [Google Scholar]
- 30. Kim J. K. (2009) Hyperinsulinemic-euglycemic clamp to assess insulin sensitivity in vivo. Methods. Mol. Biol. 560, 221–238 [DOI] [PubMed] [Google Scholar]
Associated Data
This section collects any data citations, data availability statements, or supplementary materials included in this article.


