

Abstract
Background
Gulf War Illness (GWI) has affected many Gulf War veterans. It involves several organs, most notably the brain. Neurological-cognitive-mood-related symptoms frequently dominate and are at the root of chronic ill-health and disability in GWI. Here we investigated the neural mechanisms underlying brain dysfunction in GWI in the absence of mental health disorders.
Methods
Eighty-six veterans completed diagnostic interviews to establish the presence of GWI and assess mental health status. Participants diagnosed with GWI met both Center for Disease Control and Kansas criteria. We studied 46 healthy controls and 40 veterans with GWI without mental illness. They all underwent a resting-state magnetoencephalographic (MEG) scan to assess brain communication based on synchronous neural interactions (SNI; Georgopoulos et al., 2007).
Findings
We found substantial differences in SNI between control and GWI groups centered on the cerebellum and frontal cortex. In addition, using the maxima and minima of SNI per sensor as predictors, we successfully classified 94.2% of the 86 participants (95% sensitivity, 93.5% specificity).
Interpretation
These findings document distinct differences in brain function between control and GWI in the absence of mental health comorbidities, differences that are excellent predictors of GWI.
Funding
U.S. Department of Veterans Affairs and University of Minnesota.
Keywords: Gulf War Illness (GWI), Magnetoencephalography, Veterans, Cerebellum, Brain areas
Highlights
-
•
This is the first study of brain mechanisms in Gulf War Illness using magnetoencephalography.
-
•
Substantial differences in brain synchronicity were found in veterans with Gulf War Illness compared to control Gulf War veterans.
-
•
These differences involved mainly the cerebellum and frontal cortex.
Gulf War Illness is a debilitating disorder of unknown etiology that has affected a substantial number of veterans who served in the 1990–91 Gulf War. A prominent feature of the disease is the presence of neurological, cognitive and mood disorders. Here we assessed dynamic brain function in veterans suffering from Gulf War Illness (in the absence of mental illness) using magnetoencephalography, a high-fidelity method that measures brain activity. We found neural miscommunication in Gulf War Illness (as compared to control participants) entered mainly on the cerebellum and frontal cortex. These results document dynamic brain anomalies in Gulf War Illness and pave the way for further investigations to elucidate the mechanisms leading to those anomalies.
1. Introduction
Many Allied military personnel who served in the 1990–1991 Persian Gulf War experience various chronic physical and neurocognitive complaints, now commonly referred to as Gulf War Illness (GWI). At least 25% of Gulf War veterans have been affected by diffuse symptoms such as fatigue, musculoskeletal pain, neurological/cognitive/mood (NCM) complaints, respiratory symptoms, gastrointestinal problems, and rashes (Fukuda et al., 1998, Gray et al., 2002, Kang et al., 2009, Steele, 2000). Several population-based studies have demonstrated that these symptoms occur at significantly higher rates in Gulf War veterans relative to their non-deployed peers and other veteran groups (Fukuda et al., 1998, Kang et al., 2009, Steele, 2000).
However, these symptoms typically do not meet criteria for established medical diagnoses, fueling speculation that they primarily reflect psychological distress and related psychiatric disorders (e.g., Posttraumatic Stress Disorder, PTSD) superimposed on vulnerable organ systems (Engel et al., 2000, Weiner et al., 2011), a supposition that has been refuted (National Research Council, 2010). Brain-based objective indicators of psychiatric and medical disorders are increasingly being identified, allowing a fresh approach to this challenge. Burgeoning evidence supports the utility of magnetoencephalography (MEG) in identifying aberrant and disease-specific neural activity (Engdahl et al., 2010, Georgopoulos et al., 2007, Georgopoulos et al., 2010, James et al., 2013, Wilson et al., 2016). One approach focuses on characteristic anomalies in synchronized neural interactions (SNI) derived from task-free MEG. Using that approach, we have demonstrated that SNI anomalies accurately discriminate various brain disorders, including PTSD, multiple sclerosis, Alzheimer's disease, schizophrenia, Sjögren's syndrome, temporomandibular pain disorder, and chronic alcoholism from normal healthy brain function, providing compelling evidence of candidate biomarkers (Georgopoulos et al., 2007). Similarly, we hypothesized that GWI could also be characterized by SNI abnormalities, i.e., neural miscommunication patterns. Here, by applying MEG to GWI, we sought, first, to identify differences in SNI between GWI and controls and, second, to investigate the possibility that such differences may serve as predictors of GWI.
2. Materials and Methods
2.1. Study Participants
A total of 86 Gulf War veterans participated in this study as paid volunteers. VA medical records were reviewed to identify potential participants. Veterans who had completed the Gulf War Registry Examination (Murphy et al., 1999) and did not meet exclusionary criteria were recruited for participation. Exclusionary criteria included cardiac pacemakers or implanted ferrous metal (due to magnetic effects on MEG), central nervous system disorders (e.g. Parkinson's disease, dementia, cerebrovascular accidents, a history of traumatic brain injury, etc.), lifetime psychotic diagnoses, and current alcohol or drug dependence. Since our participants fulfilled the Kansas GWI case definition (Steele, 2000), they did not suffer from any additional conditions specified as exclusionary by that Kansas GWI criteria. Veterans who might have difficulty with the protocol were also excluded. Study participants provided written informed consent prior to initiating study procedures and participants were compensated for their time. The study protocol was approved by the Institutional Review Board at the Minneapolis VA Health Care System.
All participants completed diagnostic interviews to rule out psychiatric diagnoses and underwent a MEG scan. The Clinician-Administered PTSD Scale for DSM-IV (CAPS; Blake et al., 1995) was administered to evaluate current PTSD diagnostic status. Non-PTSD Axis I diagnostic status was determined using the Structured Clinical Interview for DSM-IV-TR Axis I Disorders (SCID; First et al., 2002). SCID screening questions were administered to all participants; positive screening items were further evaluated with the relevant SCID module. All participants completed a GWI symptom questionnaire developed for use in Kansas Gulf War veterans (Steele, 2000) that evaluates the presence and severity of 6 kinds of symptoms characteristic of GWI – namely, fatigue, pain, neurological/mood/cognitive, gastrointestinal, skin rashes, and respiratory. Items are rated on a scale from 0 to 3 (absent, mild, moderate and severe, respectively). The questionnaire permits determination of case status according to either the Centers for Disease Control and Prevention (CDC) criteria (Fukuda et al., 1998) or the Kansas GWI case definition (Steele, 2000). Only participants meeting both sets of criteria were included in this study. Participants were thus assigned into the following 2 groups: healthy controls (N = 46) and GWI (N = 40).
2.2. Data Acquisition
As described previously (Georgopoulos et al., 2007, Georgopoulos et al., 2010), subjects lay supine within the electromagnetically shielded chamber and fixated their eyes on a spot ~ 65 cm in front of them, for 60s. MEG data were acquired using a 248-channel axial gradiometer system (Magnes 3600WH, 4-D Neuroimaging, San Diego, CA), band-filtered between 0.1 and 400 Hz, and sampled at 1017.25 Hz. Data with artifacts (e.g. from non-removable metal or excessive subject motion) were eliminated from further analysis.
2.3. Data Analysis
2.3.1. General
Standard statistical methods were used to analyze the data, including analysis of covariance (ANCOVA), two-sample Kolmogorov-Smirnov test, binary logistic regression, etc. The following packages were employed: IBM-SPSS statistical package, version 23, Matlab (version R2015b), and ad hoc Fortran computer programs employing the International Mathematics and Statistics Library (IMSL; Rogue Wave Software, Louisville, CO, USA) statistical and mathematical libraries. Prewhitening of the raw MEG series (see below) was performed using programs in Python (Mahan et al., 2015).
2.3.2. Analysis of MEG Data
2.3.2.1. Preprocessing
Single trial MEG data from all sensors underwent ‘prewhitening’ (Box and Jenkins, 1976, Priestley, 1971) using a (50,1,3) ARIMA model (Mahan et al., 2015) to obtain innovations (i.e. residuals). All possible pairwise zero-lag crosscorrelations (N = 30,628, given 248 sensors) were computed between the prewhitened MEG time series. Finally, the partial zero-lag crosscorrelations PCCij0 between i and j sensors were computed for all sensor pairs (synchronous neural interactions; SNI); thus, for any given pair of sensors (from a total of 248) the effects of the remaining 246 sensors were partialed out. The PCCij0 was transformed to zij0 using Fisher's (Fisher, 1958) z-transformation to normalize its distribution:
| (1) |
2.3.2.2. Group Comparisons
Overall SNI frequency distributions were compared between the 2 groups using the two-sample Kolmogorov-Smirnov test. For each {i, j} sensor pair, parametric SNI group differences were assessed using an ANCOVA, where Group was a fixed factor and age and gender were covariates.
2.3.2.3. GWI Prediction
There were 247 SNIs for each MEG sensor. Spatial plots of those SNIs for individual sensors (see below) revealed an orderly variation in their sign and magnitude suggesting a spatial tuning. Two unique, characteristic values of this distribution are its highest and lowest SNI. We used these two values per sensor as predictors of GWI in a binary logistic regression analysis.
3. Results
3.1. Demographics
Both groups comprised predominantly men (44/46 controls, 33/40 GWI; statistically not significantly different proportions). The control group participants were older (53.2 ± 1.58, mean ± SEM) than those in the GWI group (48.7 ± 1.0) (P = 0.018, t-test, equal variances not assumed).
3.2. Group Differences in SNI
The SNI distributions differed significantly among the 2 groups (P < 0.025, Kolmogorov-Smirnov test). The parametric ANCOVA carried out for each sensor pair yielded results that helped identify differential involvement of neural interactions. The basic finding was that, for a given sensor, the Group F-statistic in the ANCOVA (essentially, a signal-to-noise ratio) varied between that sensor and the remaining 247 sensors (this sensor's “domain”) in a graded fashion, an example is illustrated in Fig. 1. When the F-values for each sensor were rank-ordered, aligned to their maximum, averaged across sensors, and plotted against their rank, an orderly decline in the average F-value was observed with small variation within each rank (Fig. 2). This indicates a very similar distribution of the F-values from sensor to sensor, although the spatial (in sensor space) distribution per sensor was quite distinct. The relative importance of each sensor in distinguishing between control and GWI groups was visualized by a heatmap (Fig. 3) where the color in a given sensor location was varied according to the maximum F-value of that sensor, among the 247 F-values associated with it. It can be seen that major effects were centered around the cerebellum and frontal lobes bilaterally, and frontal lobe midline.
Fig. 1.
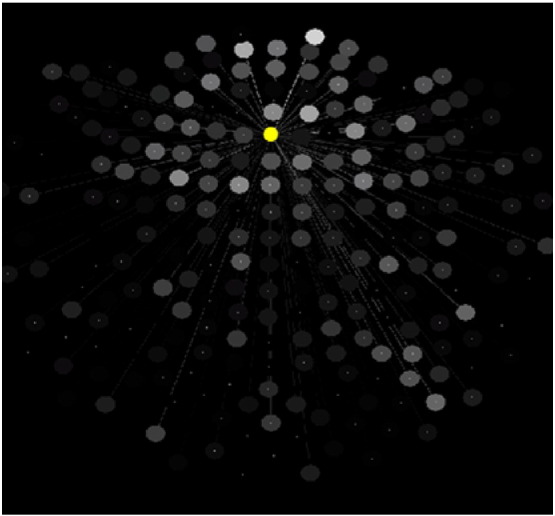
Relations of a given, reference sensor (yellow filled circle) to the remaining 247 sensors with respect to Group effect in the ANCOVA (see text). The grayscale is proportional to the F value of the Group effect (brighter circles correspond to higher F values) on the SNI between the reference sensor and the gray one, indicated by connecting line.
Fig. 2.
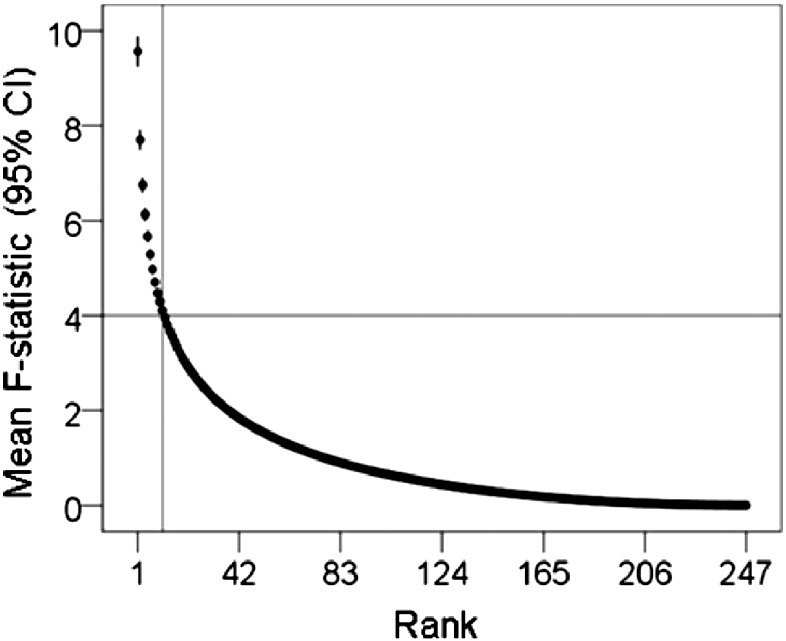
The average, ranked F-value (± 95% Confidence Interval [CI], N = 248 sensors, highest rank = 1) from the ANCOVA is plotted against its rank. It can be seen that F decreases steeply and with small variation (vertical bars) as its rank increases. These findings indicate that, although a given sensor has widespread relations with other sensors (Fig. 1), the most influential relations are with 11 other sensors, on the average (vertical line), corresponding to F(1,82) > 4.0 (P < 0.05, uncorrected; horizontal line).
Fig. 3.

3-D and 2-D heatmaps of distribution of Group effects in sensor space. The color scale is proportional to F value in the ANCOVA (uncorrected probability range). White ellipses demarcate approximate areas (a, cerebellum; b, right frontal cortex; c, medial frontal; d, left frontal cortex).
3.3. Participant Classification
The finding that ANCOVA-based group differences varied within a sensor SNI domain in a graded fashion suggested that the variation of SNIs themselves may be good predictors of group assignment. We investigated this possibility by assessing, first, the distribution of SNIs within a sensor domain. We found that SNIs varied in a graded fashion, as illustrated for a specific sensor in Fig. 4. Two characteristic values of these SNI distributions are their highest (maximum) and lowest (minimum) values, as seen in Fig. 4, Fig. 5. Therefore we used those two values per sensor as predictors (total predictors = 248 sensors × 2 predictors per sensor = 496) in a stepwise binary logistic regression where the group membership of a participant (control, GWI) was the dependent variable. We carried out this analysis using the Forward Conditional option in the IBM-SPSS statistical package (version 23). This analysis identified 9 predictors which yielded a 94.2% correct classification (Table 1). The sensitivity was 95% (38/40) and the specificity 93.5% (43/46). Fig. 6 shows the Receiver Operating Characteristic (ROC) curve; the area ± SE under the curve was 0.942 ± 0.029 (P = 1.8 × 10− 12). We carried out two validation procedures of this classification. In the first, we selected randomly 25 participants from each group and applied the binary logistic regression analysis using the 9 predictors above on 1000 such random samples. The mean ± SEM correct classification rate was 99.5 ± 0.063%; the median was at 100% correct. In the second analysis, we applied the logistic regression analysis to 1000 random bootstrap samples of 46 control and 40 GWI participants. The mean correct classification rate was 99.6.0 ± 0.047%; the median was at 100% correct.
Fig. 4.
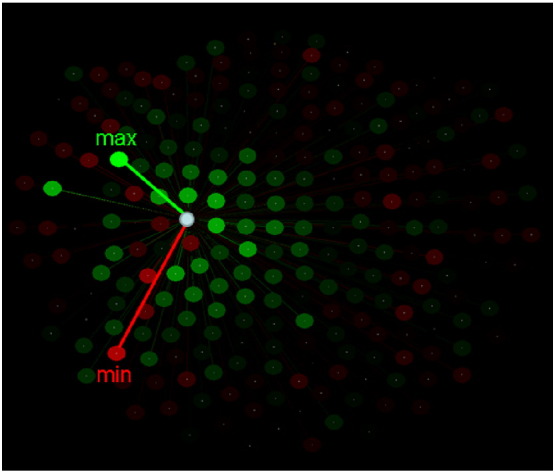
Spatial distribution of SNIs of a single sensor (white circle) to illustrate the maximum and minimum SNI. Color intensity is proportional to the absolute SNI value. Green and red correspond to positive and negative SNIs, respectively.
Fig. 5.
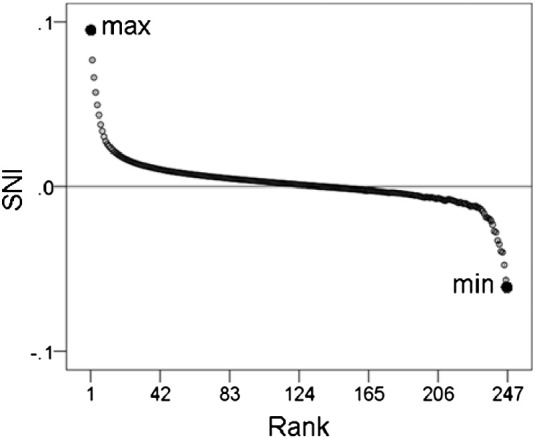
Average SNI (over 248 sensors) are plotted against their rank to illustrate the maximum and minimum points.
Table 1.
Participant classification results yielded by the binary logistic regression. (see text for details.)
| A. Classification table | ||||
|---|---|---|---|---|
| Predicted |
Total | |||
| GWI | Control | |||
| Observed | GWI | 38 | 2 | 40 |
| Control | 3 | 43 | 46 | |
| Total | 41 | 45 | 86 | |
| B. Analysis of the two-way classification table | |||
|---|---|---|---|
| Test | Value | DF | Significance (2-sided) |
| Pearson Chi-square (corrected for continuity) | 63.6 | 1 | P = 1.49 × 10− 15 |
| Fisher's exact test | P = 2.19 × 10− 18 | ||
| C. Mantel-Haenszel common odds ratio estimate | |||
|---|---|---|---|
| Estimated odds ratio () 272.3 | ln () | SE of ln () | Asymptotic significance (2-sided) |
| 95% lower bound: 43.2 95% upper bound: 1717.6 |
5.61 | 0.94 | P = 2.41 × 10− 9 |
Fig. 6.
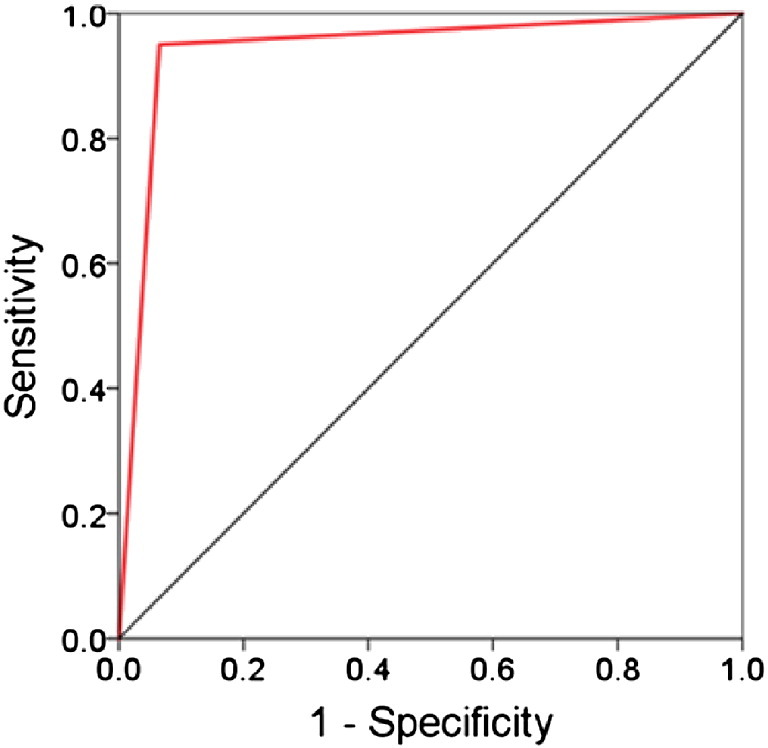
ROC curve of the classification outcomes (see text for details).
Finally, it should be pointed out that the 9 predictors above were minima or maxima of 9 specific sensors. Thus, although those 9 sensors were the same across brains, the specific minimum or maximum value for a specific sensor could refer to the SNI of the pair between that (fixed) sensor-predictor and any of the remaining 247 sensors. Now, we found that sensors involved in those minimum or maximum SNIs (for each one of the 9 sensor-predictors) were very similar from brain to brain. Fig. 7 outlines the approximate SNI territories of those sensor pairs superimposed on the similarly scaled heatmap of Fig. 3. It can be seen that these territories roughly correspond to the areas in Fig. 3 that showed strong Group effects in the ANCOVA.
Fig. 7.
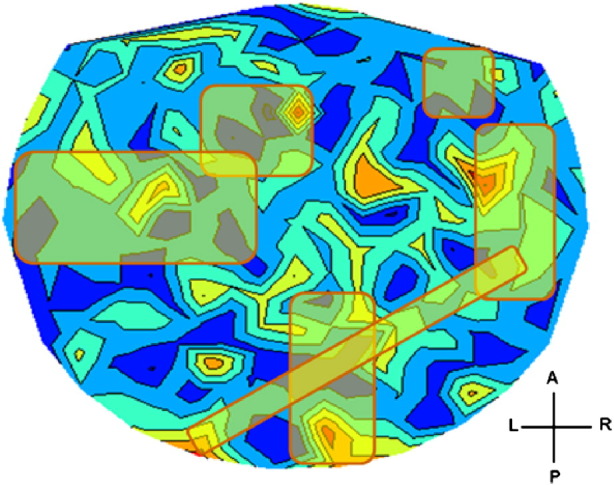
Approximate SNI territories of the 10 successful sensor predictors in predicting GWI (see text for details).
4. Discussion
Here, using MEG, we investigated dynamic brain function in control and GWI participants in the absence of mental illness. Specifically, we tested the hypothesis that GWI could be characterized by anomalies in synchronized neural activity, as assessed by the SNI test (Georgopoulos et al., 2007). Our results provide strong evidence for this hypothesis at the group level and, moreover, extend the application of the SNI test to the classification of participants based on the variation (maxima and/or minima) of SNI distributions of individual sensors.
4.1. SNI Anomalies in GWI
We have previously demonstrated the power of SNI derived from task-free MEG in successfully discriminating various brain diseases from healthy brain function. Given that several GWI symptoms involve the brain including memory loss, word finding difficulty, concentration problems, dizziness, tremor, and mood changes, we similarly expected and confirmed SNI differences between Gulf War veterans with and without GWI. Moreover, we demonstrated that the differences were localized primarily around the cerebellum and frontal lobes. Prior studies have identified various brain abnormalities in GWI involving the hippocampus, brainstem, basal ganglia, and frontal lobes (for review, see White et al., 2016); few have investigated cerebellar abnormalities and the findings have been mixed. Using magnetic resonance imaging, Rayhan et al. (2013) reported reduced cerebellar volume and functional anomalies in a small sample of GWI veterans. Others have identified enhanced cerebellar activation to noxious heat, presumably reflecting increased pain perception, in some GWI veterans relative to controls (Gopinath et al., 2012). In contrast, researchers using magnetic resonance spectroscopy found no significant differences in metabolites in various brain regions when comparing veterans with GWI to controls (Weiner et al., 2011). The present study adds to this small body of literature and provides evidence of robust resting-state differences in the cerebellum and frontal lobes between veterans with GWI and healthy controls, as identified by MEG.
There is a remarkable parallel between the brain-related symptoms observed in GWI and those observed in the “cerebellar cognitive affective syndrome”; (CCAS; Schmahmann & Sherman, 1998). In the case of CCAS, cerebellar lesions disrupt cerebellar modulation of motor, sensory, cognitive, affective, and autonomic systems, giving rise to executive function impairments, visuospatial difficulties, language deficits, and personality change. Given the similarities between GWI and CCAS at the symptom level, additional research aimed at further investigating cerebellar functional and structural anomalies in GWI and the relation of those anomalies to symptoms characteristic of GWI is warranted.
4.2. Classification
Using properties of the SNIs, specifically the maxima and minima SNI per sensor, we were able to correctly classify 93% of participants as either GWI or control. The excellent results of random permutation and bootstrap tests attested to the robustness of this finding across participants, although a large sample would be needed for more extensive validation. Remarkably, correct classification was obtained with merely 9 (out of 496) possible predictors. We hypothesize that this is due to the kind of predictors used in this analysis, namely that were the maxima and minima of interactions (SNIs) of a given sensor with the other sensors, in contrast to previous studies (Georgopoulos et al., 2007, Georgopoulos et al., 2010, James et al., 2014) where individual SNIs were used as predictors. Since the current predictors were extracted from SNI distributions (per sensor), it is reasonable to suppose that they are more informative, hence more effective and efficient in classification. It would be interesting to investigate whether such an approach would be successful in other applications, including studies based on fMRI (Christova et al., 2015).
Contributions
BEE, LMJ, and RDM contributed to data collection and clinical evaluation; SML and AFC contributed to neurological evaluation; APG and JJ contributed to data analysis; APG and LMJ wrote the paper. All authors contributed to extensive editing of the paper.
Declaration of interests
The authors do not report any financial disclosures or conflicts of interest.
Role of the Funding Source
Partial funding for this study was provided by the US Department of Veterans Affairs and the University of Minnesota (American Legion Brain Sciences Chair to APG). The sponsors had no role in the current study design, analysis or interpretation, or in the writing of this paper.
Acknowledgments
This work was partially supported by a service directed grant from the United States Department of Veterans Affairs. The contents do not represent the views of the U.S. Department of Veterans Affairs or the United States Government.
We wish to especially thank our veteran participants and express our appreciation for the assistance of Kari Resel, Alina Shub and Alexandra Alcorn.
References
- Blake D., Weathers F., Nagy L.M. National Center for PTSD; Boston: 1995. Clinician-Administered PTSD Scale. [DOI] [PubMed] [Google Scholar]
- Box G.E.P., Jenkins G.M. Holden-Day; San Francisco: 1976. Time Series Analysis: Forecasting and Control. [Google Scholar]
- Christova P., James L.M., Engdahl B.E., Lewis S.M., Georgopoulos A.P. Diagnosis of posttraumatic stress disorder (PTSD) based on correlations of prewhitened fMRI data: outcomes and areas involved. Exp. Brain Res. 2015;233:2695–2705. doi: 10.1007/s00221-015-4339-0. [DOI] [PubMed] [Google Scholar]
- Engdahl B., Leuthold A., Tan H.R. Post-traumatic stress disorder: a right temporal lobe syndrome? J. Neural Eng. 2010;7:066005. doi: 10.1088/1741-2560/7/6/066005. [DOI] [PubMed] [Google Scholar]
- Engel C.C., Liu X., McCarthy B.D. Relationship of physical symptoms to posttraumatic stress disorder among veterans seeking care for gulf war-related health concerns. Psychosom. Med. 2000;62:739–745. doi: 10.1097/00006842-200011000-00001. [DOI] [PubMed] [Google Scholar]
- First M.B., Spitzer R.L., Gibbon M. Biometrics Research, New York State Psychiatric Institute; New York: 2002. Structural Clinical Interview for DSM-IV-TR Axis I Disorders, Research Version, Non-patient Edition (SCID-I/NP) [Google Scholar]
- Fisher R.A. 13th edition. Oliver and Boyd; Edinburgh: 1958. Statistical Methods for Research Workers. [Google Scholar]
- Fukuda K., Nisenbaum R., Stewart G. Chronic multisymptom illness affecting air force veterans of the gulf war. JAMA. 1998;280:981–988. doi: 10.1001/jama.280.11.981. [DOI] [PubMed] [Google Scholar]
- Georgopoulos A.P., Karageorgiou E., Leuthold A. Synchronous neural interactions assessed by magnetoencephalography: a functional biomarker for brain disorders. J. Neural Eng. 2007;4:349–355. doi: 10.1088/1741-2560/4/4/001. [DOI] [PubMed] [Google Scholar]
- Georgopoulos A.P., Tan H.R.M., Lewis S.M. The synchronous neural interactions test as a functional neuromarker for post-traumatic stress disorder (PTSD): a robust classification method based on the bootstrap. J. Neural Eng. 2010;7:016011. doi: 10.1088/1741-2560/7/1/016011. [DOI] [PubMed] [Google Scholar]
- Gopinath K., Gandhi P., Goyal A. FMRI reveals abnormal central processing of sensory and pain stimuli in ill gulf war veterans. Neurotoxicology. 2012;33:261–271. doi: 10.1016/j.neuro.2012.01.014. [DOI] [PMC free article] [PubMed] [Google Scholar]
- Gray G.C., Reed R.J., Kaiser K.S., Smith T.C., Gastanaga V.M. Self-reported symptoms and medical conditions among 11,868 gulf war-era veterans: the Seabee health study. Am. J. Epidemiol. 2002;155(11):1033–1044. doi: 10.1093/aje/155.11.1033. [DOI] [PubMed] [Google Scholar]
- James L.M., Engdahl B.E., Lewis S. Differences in neural network modulation by trauma between veterans with PTSD and resilient controls. JAMA Psychiatry. 2013;70:410–418. doi: 10.1001/jamapsychiatry.2013.878. [DOI] [PubMed] [Google Scholar]
- James L.M., Belitskaya-Levy I., Lu Y., Wang H., Engdahl B.E., Leuthold A.C., Georgopoulos A.P. Development and application of a diagnostic algorithm for posttraumatic stress disorder. Psychiatry Res. 2014;231:1–7. doi: 10.1016/j.pscychresns.2014.11.007. [DOI] [PubMed] [Google Scholar]
- Kang H.K., Li B., Mahan C.M. Health of US veterans of 1991 gulf war: a follow-up survey in 10 years. J. Occup. Environ. Med. 2009;51:401–410. doi: 10.1097/JOM.0b013e3181a2feeb. [DOI] [PubMed] [Google Scholar]
- Mahan M.Y., Chorn C.R., Georgopoulos A.P. White Noise Test: detecting autocorrelation and nonstationarities in long time series after ARIMA modeling; Proceedings 14th Python in Science Conference (Scipy 2015), Austin, TX; 2015. [Google Scholar]
- Murphy F.M., Kang H.K., Dalager N. The health status of gulf war veterans: lessons learned from the Department of Veterans Affairs Health Registry. Mil. Med. 1999;164:327–331. [PubMed] [Google Scholar]
- National Research Council . Health Effects of Serving in the Gulf War, Update 2009. vol. 8. The National Academies Press; Washington, DC: 2010. Gulf War and Health. [Google Scholar]
- Priestley M.B. Academic; San Diego: 1971. Spectral Analysis and Time Series. [Google Scholar]
- Rayhan R.U., Stevens B.W., Raksit M.P., Ripple J.A., Timbol C.R., Adewuyi O. Exercise challenge in Gulf War Illness reveals two subgroups with altered brain structure and function. PLoS One. 2013;8(6):e63903. doi: 10.1371/journal.pone.0063903. [DOI] [PMC free article] [PubMed] [Google Scholar]
- Steele L. Prevalence and patterns of gulf war illness in Kansas veterans: association of symptoms with characteristics of person, place, and time of military service. Am. J. Epidemiol. 2000;152:992–1002. doi: 10.1093/aje/152.10.992. [DOI] [PubMed] [Google Scholar]
- Weiner M.W., Meyerhoff D.J., Neylan T.C. The relationship between Gulf War Illness, brain N–acetylaspartate, and post-traumatic stress disorder. Mil. Med. 2011;176:896–902. doi: 10.7205/milmed-d-10-00332. [DOI] [PMC free article] [PubMed] [Google Scholar]
- White R.F., Steele L., O'Callaghan J.P. Recent research on gulf war illness and other health problems in veterans of the 1991 gulf war: effects of toxicant exposures during deployment. Cortex. 2016;74:449–475. doi: 10.1016/j.cortex.2015.08.022. [DOI] [PMC free article] [PubMed] [Google Scholar]
- Wilson T.W., Heinrichs-Graham E., Proskovec A.L., McDermott T.J. Neuroimaging with magnetoencephalography: a dynamic view of brain pathophysiology. Transl. Res. 2016 doi: 10.1016/j.trsl.2016.01.007. (epub ahead of print) [DOI] [PMC free article] [PubMed] [Google Scholar]