

Abstract
A major challenge in developing anticancer therapies is determining the efficacies of drugs and their combinations in physiologically relevant microenvironments. We describe here our application of “constrained fuzzy logic” (CFL) ensemble modeling of the intracellular signaling network for predicting inhibitor treatments that reduce the phospho‐levels of key transcription factors downstream of growth factors and inflammatory cytokines representative of hepatocellular carcinoma (HCC) microenvironments. We observed that the CFL models successfully predicted the effects of several kinase inhibitor combinations. Furthermore, the ensemble predictions revealed ambiguous predictions that could be traced to a specific structural feature of these models, which we resolved with dedicated experiments, finding that IL‐1α activates downstream signals through TAK1 and not MEKK1 in HepG2 cells. We conclude that CFL‐Q2LM (Querying Quantitative Logic Models) is a promising approach for predicting effective anticancer drug combinations in cancer‐relevant microenvironments.
Study Highlights.
WHAT IS THE CURRENT KNOWLEDGE ON THE TOPIC?
☑ Drug combinations are most likely needed to effectively address complex pathologies such as cancer and inflammatory diseases. However, there has been little demonstration of capability for ascertaining efficacious combinations, because experimental studies become impractical and computational models have generally not been adequate for predicting drug combination effects especially across the anticipated landscape of diverse physiological contexts.
WHAT QUESTION DID THIS STUDY ADDRESS?
☑ This study addressed the issue of predicting drug combination effects across a spectrum of diverse physiological contexts, for hepatocellular carcinoma cells stimulated by growth factors and inflammatory cytokines.
WHAT THIS STUDY ADDS TO OUR KNOWLEDGE
☑ We constructed a constrained fuzzy logic model for signaling network activities in hepatocellular carcinoma cells stimulated by various permutations of IL‐1α, TNFα, TGFα, and/or IGF1. This model then was able to predict effects of combinations of small molecule targeted kinase signaling inhibitors differentially under the diverse stimulation conditions.
HOW THIS MIGHT CHANGE DRUG DISCOVERY, DEVELOPMENT, AND/OR THERAPEUTICS
☑ Constrained fuzzy logic modeling may be useful for prediction of drug combination effectiveness across broad physiological contexts.
The treatment of many cancers remains elusive, such that new drugs and therapeutic strategies are needed. An important determinant of lesion responsiveness to anticancer therapies is tissue context, or the “tumor microenvironment.”1 Tissue context includes extracellular ligands such as growth factors and inflammatory cytokines, which regulate the activities of intracellular signaling networks, and which can potently affect the sensitivities of tumor cells to kinase‐targeted drugs.2, 3 Inflammatory microenvironments are particularly relevant to the pathogenesis of hepatocellular carcinoma (HCC), because inflammation precedes the cirrhotic environment that promotes carcinogenesis and tumor progression.4, 5 Existing HCC treatments do not target these microenvironmental factors, which may explain in part their deficient clinical effectiveness.5, 6
Preclinical studies of new therapies should involve efficacy tests in physiologically relevant microenvironments. Existing experimental methods for simulating microenvironments include orthotopic xenograft models7 and tissue‐engineered constructs.8, 9 Both, however, are limited by throughput and feasibility. The challenge is compounded by the increasing need to test combinations of therapies. For example, the main chemotherapy for HCC, the multikinase inhibitor sorafenib, has been tested for enhanced efficacy with numerous other drugs.10 The feasibility problem for testing drug combinations is well established: ∼2,000 US Federal Drug Administration‐approved drugs exist, such that it is infeasible to exhaustively test all possible combinations of drugs that might be relevant to a particular disease. The problem of testing drug combinations in realistic microenvironments is a major challenge for drug discovery going forward.
Computational modeling is emerging as an efficient means for examining the efficacy of therapies and their combinations across diverse microenvironmental contexts. A spectrum of frameworks exists for the modeling of cell signaling networks, each with its own strengths and weaknesses.11, 12, 13 We recently established a formalism for modeling quantitative logic relationships called constrained fuzzy logic (CFL), which allows for the modeling of larger networks than would be feasible using differential equations while providing enhanced insights compared to simpler Boolean logic models.14 We have also developed software named Querying Quantitative Logic Models (Q2LM) to efficiently simulate CFL models in response to multiple microenvironments and drug treatments.15 However, the capability of CFL models to generate accurate predictions concerning signaling inhibitors has not yet been rigorously evaluated.
The goal of the present study was to assess the validity of predictions from Q2LM‐driven simulations of CFL models trained to experimental data featuring combinations of kinase inhibitors applied to cancer cells in diverse microenvironments. We focused on HCC as our main application because of its treatment intractability. A further consideration was that our study implicitly assessed the effects of model nonidentifiability on prediction accuracy because the models represent large networks but are built on limited experimental data. A secondary goal of our study, therefore, was to assess whether discrepant predictions could guide the collection of new data useful for further constraining the models and enhancing identifiability. We accomplished our first goal by successfully identifying drug combinations that inhibit tumor‐promoting signaling activities across microenvironments, including the heretofore untested combined inhibition of transforming growth factor‐β‐activated kinase 1 (TAK1) and phosphoinositide‐3‐kinase (PI3K). We accomplished our second goal by investigating discrepant predictions regarding whether interleukin (IL)‐1α could signal via MEK kinase 1 (MEKK1) in addition to TAK1, confirming via dedicated experiments that TAK1 is the principal target. We conclude that systematic modeling of signaling networks using CFL‐Q2LM is a promising approach for ascertaining combination anticancer therapies in diverse microenvironments.
METHODS
Detailed methods are provided as Supplementary Information.
Study design
Our study consisted of four parts: 1) calibration of the CFL models, 2) Q2LM‐mediated predictions of anticancer efficacy, 3) validation experiments, and 4) follow‐up experiments to address discrepant predictions. To calibrate the models, we measured the levels of 17 intracellular signaling phospho‐proteins in the lysates of HepG2 HCC cells that we had sequentially treated with combinations of four small‐molecule inhibitors and four growth factors or inflammatory cytokines, each at various doses (Figure 1 , Supplementary Tables 1–3). The small‐molecule inhibitors targeted MEK1, p38 MAPK, mTOR, and PI3K. Each of the cytokine/growth factor conditions mimicked one of three microenvironmental scenarios: “Inflammatory Environments”—IL‐1α and/or tumor necrosis factor alpha (TNFα) stimulation; “Growth Environment”—transforming growth factor alpha (TGFα) and/or IGF1 stimulation; and “Inflammatory Growth Environment”—TGFα in combination with IL‐1α or TNFα stimulation. Based on the modeling predictions, we employed additional inhibitors against TAK1 and IκB kinase (IKK) (Supplementary Table 1) in validation experiments, in combination with some of the previously used inhibitors. The anticancer efficacy was defined as reductions in the phospho‐levels of six transcription factors that have each been implicated in HCC (cJun,16, 17, 18 Hsp27,19 IκB‐α,20 CREB,21, 22 S6RP,23 and p70S6k24).
Figure 1.
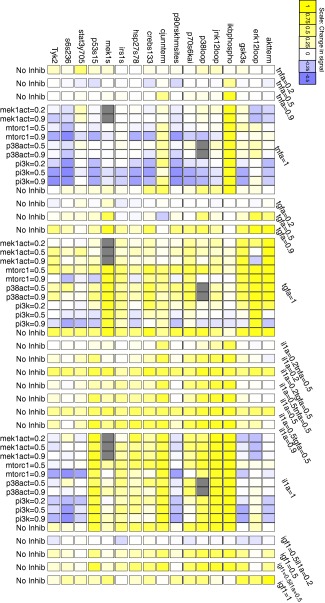
Initial dose–response dataset. We measured phospho‐protein levels in response to cotreatments consisting of different doses of small‐molecule inhibitors and cytokine/growth factor stimulation (see Supplementary Tables 1, 2, for abbreviation definitions). The cytokines and growth factors and their relative doses (0 = absent, 1 = maximum dose) are listed along the right side of the plot, while the inhibitors and their relative doses are listed along the left side of the plot. The phospho‐proteins are listed along the top of the plot (see Supplementary Table 3 for abbreviation definitions). The box colors indicate the phospho‐protein levels relative to those observed in vehicle‐treated cells. For each signaling protein, the normalized data represent the relative fold change of signal poststimulation compared to its basal value. Relative fold change has been scaled such that the maximum for each signal is one49; The yellow and purple colors scale with the magnitude of increase or decrease, respectively. The gray boxes denote phospho‐proteins whose kinase activities were inhibited by the inhibitor, such that their phospho‐levels did not correspond to their kinase activities.
Experiments
For most experiments, we treated serum‐starved HepG2 HCC cells seeded at 1,500 cells/mm2 with combinations of small‐molecule‐kinase inhibitors PD325901, ZSTK474, rapamycin, PHA818637, (5Z)−7‐oxozeaenol, and BMS‐345541 (Supplementary Table 1) for a minimum of 30 minutes. We then added cytokines and growth factors to the cell media for an additional 30 minutes (IGF‐1, IL‐1α, TGF‐α, and TNF‐α) (Supplementary Table 2). At the end of the experimental treatments, we aspirated the media, washed the cells with ice‐cold phosphate‐buffered saline, snap‐froze them with liquid N2, and stored them at −80°C. We used multiplexed bead‐based flow cytometric immunoassays to measure the relative levels of 17 phospho‐proteins (Supplementary Table 3). For the short‐interfering RNA (siRNA) experiments, we transiently transfected HepG2 cells with siRNA pools targeting MEKK1 and TAK1, as well as a nontargeting control pool and a fluorescently labeled siRNA. Approximately 70 hours posttransfection, we treated the cells with the indicated stimulatory ligands and processed them for subsequent immunoblot or quantitative reverse‐transcriptase polymerase chain reaction analyses.
Computational modeling
We implemented a modified version of our CFL algorithm.14 The workflow consisted of data normalization, prior knowledge network (PKN) construction, model simulation, and model training (topology and parameter estimation). We constructed the PKN (Supplementary Figure S1) based on the one from Morris et al.14 but extended it to include information describing phosphorylation of different protein domains. We modified the CellNOpt training process14 to add a PKN processing step that added nodes and interactions to allow for the algorithm to capture the effects of inhibition on the basal signal values (Supplementary Figure S2). We also modified the training algorithm to select transfer functions from a predefined suite of nine transfer functions consisting of a single Hill coefficient (n = 3) and all combinations of EC50 = {0.3, 0.5, 0.7} and g = {0.3, 0.7, 1} for the estimation of all Hill equations.
We applied the Q2LM algorithm15 to the resulting CFL model ensemble, which enabled us to efficiently generate model predictions. Q2LM provides a convenient structure for addressing the following question: What inhibitors, alone or in combination, accomplish a predefined task under different environmental conditions? The software compares conditions with inhibitors to those without and determines the inhibitor treatments that accomplish a defined goal such as reducing the activity of a protein or set of proteins by a specific amount.
RESULTS
Calibration of the CFL models
Our dataset reproduced the known effects of TGFα on ERK, MEK, and Akt and those of TNFα and IL‐1α on IκB‐α, JNK, and c‐Jun (Figure 1). In addition, the expected inhibitor effects were evident, with higher doses of the MEK inhibitor reducing phospho‐ERK levels, PI3K inhibitor reducing Akt and GSK‐3 phospho‐levels, and high doses of the p38 inhibitor reducing CREB phosphorylation in response to inflammatory cytokines (Figure 1). IL‐1α and TGF‐α activated more targets than TNF‐α and IGF‐1, and cotreating cells with IL‐1α and TGF‐α increased the phospho‐levels of virtually all 17 proteins (Figure 1).
Next, we implemented the CFL algorithm to generate an ensemble of models capable of describing the data. We applied the CellNOpt training procedure ∼1,000 times and selected the top 120 models that best fit the data for subsequent analyses. The resulting consensus network topology and the fit of the ensemble of models to the data are shown in Figures 2 and 3, respectively. We observed that the models generally fit the data well, as demonstrated by the majority of the boxes in Figure 3 a being colored green and the strong correlation between observed and predicted values in Figure 3 b. However, some analytes, in particular phospho‐STAT3, were associated with several conditions for which the model fits were poorer. Furthermore, some treatments, such as TGFα = 0.5 (no inhibition), were associated with several analytes whose data were less well fit by the models. In both cases, the poorer fits occurred in single samples within a dose–response, suggesting that noise in the data was responsible, rather than deficiencies with the models.
Figure 2.
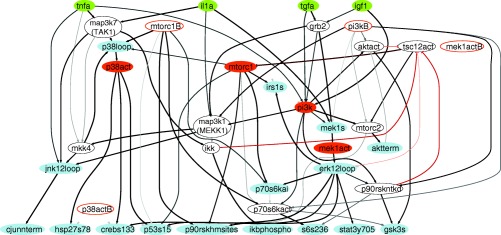
Ensemble of trained CFL models. The prior knowledge network shown in Supplementary Figure 3 was trained to the data from Figure 1. Green nodes denote stimulatory cytokines or growth factors, blue nodes indicate measured phospho‐proteins, orange nodes denote inhibited kinases, and white nodes denote nonmeasured or nonperturbed proteins whose inclusion in the models is necessary for logical consistency. Gray/black edges denote activation while orange‐red edges denote inhibition. The relative thickness and darkness of the edges are proportional to the number of models of the ensemble in which the edge is included.
Figure 3.
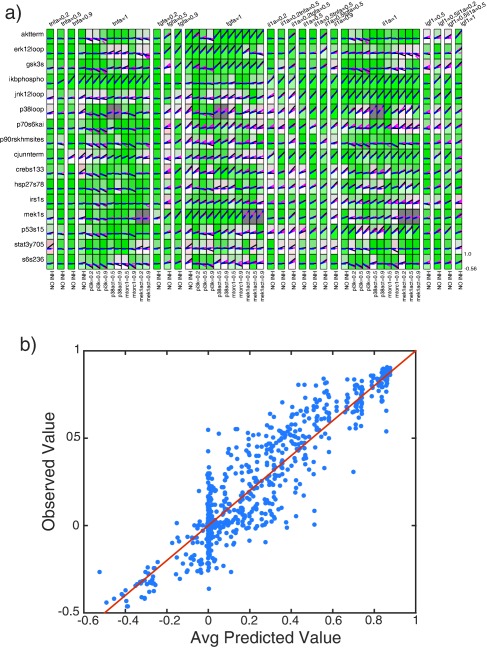
CFL model goodness of fit. (a) The plot layout is the same as for Figure 1, but in this case the box shading color is proportional to the goodness‐of‐fit, with green corresponding to a better and red to a less good fit. The black lines represent the data, the blue lines represent the mean of the model ensemble predictions, and the pink lines represent the individual model predictions. (b) Scatterplot showing the average model‐predicted values on the x‐axis and experimentally measured values on the y‐axis (R2 = 0.85). The red line denotes the line of identity (i.e., x = y).
To further investigate the quality of our models, we performed a 10‐fold cross‐validation (Supplementary Figure S3). In this test, we randomly divided the data into 10 subsets and reserved one as a test set while training with the remaining nine data subsets. We repeated this procedure for all 10 subsets and observed that the fit of the models trained on 90% of the data to the remaining 10% was slightly worse than, but still comparable to, their ability to fit the data on which they were trained (R2 = 0.79 for the training data vs. 0.71 for the test data). Also, the difference in the fit to training and test data was not dependent on model size as measured by selection threshold. Together, these results indicated that the models were predictive and not overfit.
Predicting anticancer efficacies using Q2LM
We next investigated the ability of the models, in an “ensemble” sense, to predict how several kinase inhibitors would alter the phosphorylation state of key signaling network nodes across the diverse microenvironmental scenarios using the Q2LM algorithm. In this case, we specified “Scenarios” consisting of a Microenvironment, which consisted of doses of cytokines and growth factors applied alone or in combination, and a Perturbation, which consisted of doses of small‐molecule inhibitors applied alone or in combination (Table 1). The perturbation targets were TAK1, p38, IKK, PI3K, and MEK. Note that TAK1 and IKK inhibitions were not tested in the original dataset, such that they represent a means to validate the approach. We simulated 48 environmental conditions in combination with five inhibitors at four dose levels alone or in combination. In total, we simulated 8,688 unique scenarios with the ensemble of trained CFL models from Figure 2. We then searched for inhibitor conditions that the models predicted would reduce the phospho‐levels of several transcription factors implicated in hepatocellular carcinoma. Specifically, we selected those that would decrease phosphorylation of all transcription factors in one of two sets: cJun, Hsp27, and IκB‐α (downstream of inflammatory stimuli) or CREB, S6RP, and p70S6k (downstream of growth stimuli).
Table 1.
Scenarios simulated by Q2LM for predicting therapeutic effects
| Simulated “scenario” | Environmental stimuli (partial and full activation) | Inhibitor perturbations (different doses of single inhibitors and all pairs) |
|---|---|---|
| Inflammatory | TNFα and IL‐1α alone or in combination | TAK1, p38, IKK, PI3K, MEK |
| Growth | TGFα and IGF1 alone or in combination | TAK1, p38, IKK, PI3K, MEK |
| Mixed growth and inflammatory | TGFα in combination with TNFα or IL‐1α | TAK1, p38, IKK, PI3K, MEK |
Validation experiments
We performed subsequent experiments to test several inhibitor treatments that the models predicted would have broad downstream effects. The experiments involved perturbations and combinations that were not included in our training dataset. For cases in which multiple inhibitor combinations were predicted to be effective, we chose the one with fewest inhibitors. Although we were initially interested in evaluating TAK1 inhibition in isolation, its inhibitor, 5Z‐7‐Oxozeaenol, appeared to inhibit MEK as well, which had been previously observed by us and others.25, 26 Henceforth in the model, we specified that this inhibitor acted to inhibit both TAK1 and MEK.
Experimental data for these prediction tests are shown in Figure 4, and comparison between predictions and validation test outcomes are shown in Figure 5. We found that, for most protein signals, the top 120 CFL models accurately predicted whether the signal would decrease the true‐positive rate of 86% and false‐positive rate of 44% (Figure 5 a,b). We emphasize, however, that the computed accuracy of the predictions was dependent on the exact threshold for considering a decrease significant. In the case of the experimental data, this threshold was applied to the percent decrease measured, whereas for the simulated values, the threshold was applied to the average percent decrease predicted by the models.
Figure 4.
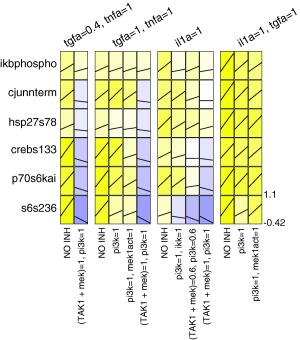
Dataset for model validation. We performed independent experiments to generate data against which the model predictions were compared. The plot layout is similar to that of Figure 1 except the relative changes compared to unstimulated value were additionally shown using black lines. The color map is the same as that used in Figure 1. Note that while we intended to test TAK1 inhibition in isolation, the inhibitor compound features off‐target activity towards MEK. Thus, conditions featuring this inhibitor are denoted by (TAK1 + MEK).
Figure 5.
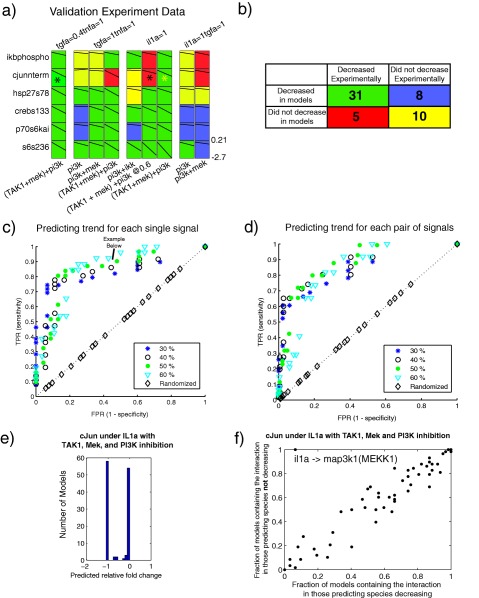
Experimental validation of Q2LM predictions. (a) Fold changes of inhibition for the experimental data. For the case in which the thresholds were defined as the average model value decreasing by 50% and average experimental value decreasing by 40%, the boxes are colored green if a decrease was both predicted and observed (true positive) or yellow if a decrease was not predicted and not observed (true negative). If the prediction and data did not match, the boxes were colored red (false negative) or purple (false positive). The species marked with an asterisk were predicted to decrease in some models but remained the same in others, resulting in a distribution of (ambivalent) predictions. (b) A summary of true positives, false positives, true negatives, and false negatives from panel a. This contingency table is statistically significant (P = 0.0028 by two‐sided Fisher exact test), with a true‐positive rate of 86% and false‐positive rate of 44%. (c,d) Receiver‐operating characteristic (ROC) curves for different percentage decreases of the levels of single (c) and pairs of (d) phospho‐proteins. Each point color/shape indicates a different experimental data threshold to consider a phospho‐signal as “decreased.” The true‐positive rate (TPR, or sensitivity) indicates that the model accurately predicted that the phospho‐protein levels decreased below the indicated percentage, whereas the false‐positive rate (FPR, 1‐specificity) denotes that the model accurately predicted cases for which the levels did not drop below the indicated percentage. (e) Bimodal predictions of phospho‐cJun levels in response to IL‐1α and TAK1, PI3K, and MEK inhibition. (f) Topological basis of the ambivalent cJun predictions. We divided the models into two sets: those that predicted cJun phosphorylation would decrease and those that did not. We then plotted the fraction of models containing each interaction in the processed PKN for each set. We observed one outlying data point (top lefthand corner between il1a and map3k1).
In order to fully characterize our prediction accuracy, we computed receiver operator characteristic (ROC) curves by varying these thresholds and calculating the true‐positive rate (TPR) and false‐positive rate (FPR) for each threshold pair. The ROC curves indicated that model predictions accurately predicted significant decreases in phosphorylation of single (Figure 5 c) and pairs (Figure 5 d) of transcription factors. These results demonstrate the effectiveness of the CFL‐Q2LM approach in predicting drug combinations that can manipulate cancer cell signaling in a targeted manner.
We observed that most models of the ensemble agreed on the predictions for a given scenario in the Q2LM simulations. However, we also observed several ambivalent model predictions, in which some models predicted that a signal would substantially decrease, whereas others did not. In extreme cases, this ambivalence yielded a bimodal prediction of response of a signaling node to an inhibitor. For example, we observed a bimodal distribution for the predicted level of phospho‐cJun in conditions with IL‐1α stimulation and TAK1 and PI3K inhibition (Figure 5 e). We conclude that the model ensemble as a whole was predictive of the data but that in some cases ambivalent predictions required further investigation.
Exploiting prediction imprecision to refine network topology
We hypothesized that the discrepant predictions were caused by differences in the topologies between models in the ensemble. To test this hypothesis, we systematically compared the topologies of models that predicted that the signal decreased under the relevant scenarios to those that did not by plotting the fraction of models in each set that contained each interaction in the processed PKN (Figure 5 f). We found that all models that predicted a lack of decrease in phospho‐cJun in the relevant scenarios contained an edge linking IL‐1α and MEKK1, whereas the models that predicted phospho‐cJun would decrease did not contain this interaction. The fact that phospho‐cJun did decrease in the experimental test of this prediction (Figure 4) indicated that models that did not contain this interaction were more able to make more accurate cJun predictions. We viewed the edge linking IL‐1α and MEKK1 as particularly interesting because it implicated MEKK1 as a key node in the network that could allow growth factors to activate some inflammatory pathways, which could exacerbate the tumor phenotype. In contrast, the models predicted that inflammatory cytokines activated only proinflammatory signaling pathways primarily through TAK1.
Does IL‐1 signal through MEKK1 in HepG2 cells?
Given the potential importance of MEKK1, we experimentally tested whether IL‐1 signaled through MEKK1 in HepG2 cells. MEKK1 is generally not considered part of canonical IL‐1 signaling27 but it is activated downstream of IL‐1 signaling in some cell types28 such that its inclusion in our PKN was justified. We first checked whether MEKK1 was expressed and functional in HepG2 cells. A search of online databases revealed that MEKK1 mRNA is present in HepG2 cells at higher levels than in normal liver samples as assessed by microarray analysis (CellMinerHCC database29). MEKK1 protein has also been detected in HepG2 cells (Swiss‐2DPAGE database30). Exogenously expressing wildtype or dominant‐negative forms of MEKK1 can respectively activate31 or inhibit32 JNK signaling in HepG2 cells. We were able to detect MEKK1 mRNA in our HepG2 cells using quantitative reverse‐transcription polymerase chain reaction (qRT‐PCR) (see below) but we were unable to detect MEKK1 protein via immunoblotting using an antibody that is capable of detecting endogenous MEKK1 in other cell lines.33
We next exposed HepG2 cells to stimuli known to induce JNK phosphorylation. The stimuli included lysophosphatidic acid (LPA), sorbitol, and cold stress, each of which cause MEKK1‐dependent JNK phosphorylation in mouse embryonic cells,34 as well as thrombin,35 TGF‐α, TNF‐α, and IL‐1α, for which MEKK1 involvement is unknown. Sorbitol and IL‐1α strongly induced JNK phosphorylation, thrombin and TNF‐α induced weak JNK phosphorylation, and LPA, cold stress, and TGF‐α failed to induce observable JNK phosphorylation (Figure 6 a,b). In all cases, the putative TAK1 inhibitor (5Z)−7‐oxozeaenol inhibited JNK phosphorylation (Figure 6 a). However, the inhibitor is nonspecific, such that this result alone was insufficient for demonstrating that TAK1 was the principal kinase operating downstream of IL‐1.
Figure 6.
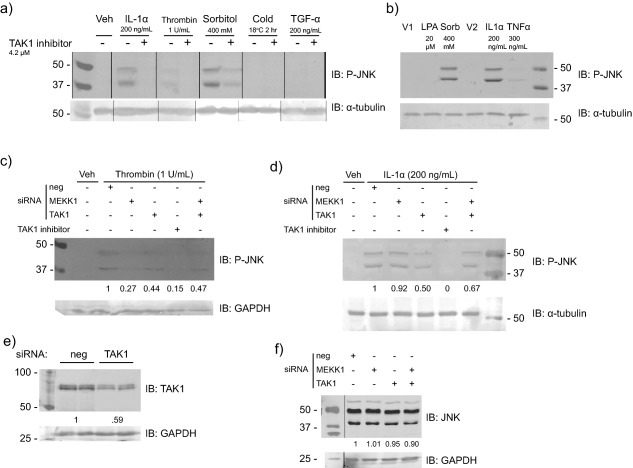
MEKK1 is not a critical downstream kinase of IL‐1 signaling in HepG2 cells. (a) Immunoblot for phospho‐JNK (P‐JNK) protein in response to IL‐1α, thrombin, sorbitol, cold stress, and TGF‐α in the presence and absence of the putative TAK1 inhibitor, (5Z)−7‐oxozeaenol, at a dose corresponding to its IC90. “Veh” corresponds to the vehicle treatment, which was 0.1% bovine serum albumin (BSA) diluted to the amount corresponding to that in the media of the stimulated cells. Phospho‐JNK comprises two isoforms whose molecular weights are 46 and 54 kDa but that migrate just below 50 and at ∼40 kDa in our sodium dodecyl sulfate‐polyacrylamide gel electrophoresis (SDS‐PAGE) gels. Note that this image consists of separate portions of a larger image taken of two gels that were processed together. The image portions were appended together and the black lines were drawn to indicate the separate images. (b) Immunoblot for P‐JNK protein in response to lysophosphatidic acid (LPA), sorbitol, IL‐1α, and TNF‐α. “V1” denotes the vehicle for LPA and sorbitol, which was culture medium, and “V2” denotes the vehicle for IL‐1α and TNF‐α, which was 0.1% BSA. (c) Immunoblot for P‐JNK protein in response to thrombin treatment in the presence or absence of the indicated short‐interfering RNA (siRNA). HepG2 cells were transfected with the siRNA ∼70 hours prior to treatment with thrombin. “Veh” was the vehicle for thrombin (0.1% BSA). The relative band densities are shown underneath each lane. (d) Immunoblot for P‐JNK protein in response to IL‐1α treatment in the presence or absence of the indicated siRNA. The relative band densities are shown underneath each lane. (e) Immunoblot for TAK1 protein in response to nontargeted control siRNA pool (“neg”) and siRNA pool against TAK1 (“TAK1”). The relative band densities are shown underneath each lane. (f) Immunoblot for total JNK protein levels in response to nontargeted control siRNA pool (“neg”) and siRNA pools against MEKK1 and TAK1. The relative band densities are shown beneath each lane.
To ascertain a possible role of MEKK1 acting downstream of sorbitol and thrombin, we reduced MEKK1 levels in HepG2 cells using siRNA, followed by treating the cells with the various stimuli known to activate MEKK1 and measuring JNK phosphorylation. MEKK1 siRNA treatment reduced JNK phosphorylation in the thrombin‐treated cells but not the sorbitol‐treated cells (data not shown, but see below), which suggested that thrombin could serve as a positive control for MEKK1 signaling.
To discern the roles of MEKK1 and TAK1 in IL‐1 signaling in HepG2 cells, we treated cells with siRNAs against MEKK1 and TAK1 as well as an siRNA with a scrambled sequence that served as a negative control. We then applied thrombin and IL‐1α in the presence and absence of (5Z)−7‐oxozeaenol and measured JNK phosphorylation. MEKK1 knockdown reduced phospho‐JNK levels in response to thrombin but not IL‐1α (Figure 6 c,d). Quantitative RT‐PCR of mRNA from cells treated in parallel with the siRNA showed that MEKK1 mRNA was reduced by 60–65% in MEKK1‐knockdown cells vs. those treated with control siRNA. TAK1 siRNA had little to no effect on either thrombin‐ or IL‐1α‐induced JNK phosphorylation (Figure 6 c,d), whereas treatment with (5Z)−7‐oxozeaenol abolished JNK phosphorylation. However, the knockdown of TAK1 protein with TAK1 siRNA was partial (41%; Figure 6 e), implying that residual TAK1 could have phosphorylated JNK. Total JNK levels were unaffected by the various siRNA treatments (Figure 6 f). Taken together, the data indicate that MEKK1 is expressed and functional in HepG2 cells but that it is not a major mediator of signaling downstream of IL‐1α.
DISCUSSION
The primary goal of our study was to assess the validity of predictions from Q2LM‐driven simulations of calibrated CFL models regarding combined inhibitor effects on cancer cell signaling in diverse microenvironments. We achieved this goal by identifying drug combinations that decreased the phospho‐levels of transcription factors implicated in HCC in simulated progrowth and proinflammatory microenvironments. In particular, our data showed the effectiveness of inhibition of both transforming growth factor‐β‐activated kinase 1 (TAK1) and phosphoinositide‐3‐kinase (PI3K). Our secondary goal was to determine whether discrepant predictions caused by model nonidentifiability could be leveraged to discover new biology. We accomplished this goal by resolving discrepant predictions regarding whether IL‐1α signaled via MEKK1 in addition to TAK1 in HepG2 cells. Specifically, we provided experimental evidence that TAK1 is a principal mediator of IL‐1α signaling in these cells, whereas MEKK1 has little, if any, functional relevance in this regard.
TAK1 is considered a tumor suppressor in hepatocytes.36 However, signaling network topologies are different between hepatocytes and HCC cells, and specific changes to the connections involving MEKK1 and TAK1 in HCC have been observed.37 Furthermore, the major drug currently used in treating advanced HCC, the multikinase inhibitor sorafenib,10 was recently shown to inhibit TAK1 activity in keratinocytes.38 These data suggest that HCC may involve co‐opting TAK1 signaling in later stages of disease progression. TAK1 may therefore be a novel target for therapy in HCC. However, targeting TAK1 alone is unlikely to work because clinical trials of targeted therapies in HCC have typically failed.39 A next step is to test combinations of chemotherapies in treating HCC,10, 40 but the possibility exists that even combination therapies will need to be personalized to the patient.39 The PI3K/Akt/mTOR pathway is a known driver of HCC and is thus considered a primary target for inhibition,10, 41 and we found that inhibiting both PI3K and TAK1 were required to reduce the phospho‐levels of all six HCC‐relevant transcription factors that we studied. Hence, our approach enables the rational targeting of signaling protein activities that may be therapeutically relevant to HCC treatment. In this way, our approach may be useful in personalizing HCC treatments. Given that primary HCC cells from a patient can be harvested and expanded in culture,42 our approach is feasible for generating signaling network models in individual patients, which could then be used to predict effective combination therapies. Sampling of interstitial fluid within tumors43 may also provide information about patient‐specific microenvironments, thus enabling their simulation in vitro.
Our approach complements others seeking to improve discovery of anticancer combination therapies by targeting phospho‐protein signaling networks. First, our focus on testing therapies in different microenvironments is currently underemphasized in existing methods.44, 45 The microenvironments we chose to mimic were simple but nevertheless disease‐relevant because they featured progrowth and inflammatory aspects of the tumor microenvironment. Second, in using CFL, which models logical relationships quantitatively, our approach extends Boolean logic‐based approaches, which models relationships in an on‐off manner.46 Third, the CFL algorithm provides as output an ensemble of best‐fit models instead of a single best‐fit model.14 In other work, we have investigated if we could we develop methods to determine experimental conditions that would distinguish models a priori, i.e., before any data has been collected.26 In this work, we show that this ensemble approach can lead to discrepant predictions due to model nonidentifiability, which can be leveraged as an opportunity to gain knowledge about the system.
Here we vigorously pursued the opportunity to leverage nonidentifiability by addressing a key discrepancy regarding the effects of inhibitor combinations on phospho‐cJun, in which some members of the model ensemble predicted the inhibitors to have no effect, while others predicted they would decrease this signal. We examined the topologies of these ensemble subsets and observed that the subset producing the accurate prediction did not contain an edge from the IL‐1α cytokine to MEKK1. However, published data indicated that IL‐1 signals through MEKK1 in other cell types.28, 47, 48 We therefore decided to resolve experimentally whether IL‐1α signals through MEKK1 in HepG2 cells, which would represent a stringent test of whether our approach could be used to further understanding of the signaling network. As shown in Figure 6, we found that MEKK1 is not significantly activated by IL‐1α in HepG2 cells, even though it is expressed and functional. Accordingly, the increase of cJun phosphorylation in response to inflammation is likely to be due to signaling through TAK1 and not MEKK1.
The strengths of our method are counterbalanced by some tradeoffs. First, our method leverages the inferential power of using prior knowledge, such that subsequent discoveries depend in part on that information. Our PKN was initially assembled from pathways included in the Ingenuity Pathway Analysis (IPA) software. The underlying IPA Knowledge Base consists of information curated from diverse literature and third‐party database sources, all of which is manually reviewed by experts. Nevertheless, inaccuracies and omissions in IPA‐based pathways have been reported,49, 50 which may compromise the quality of the PKN. Here we modified the PKN by incorporating published knowledge regarding the biochemistry of several of the key nodes in the network (see “Prior Knowledge Network” subsection of the Methods section in the Supplementary Information for details). We anticipate that the quality of the PKN will continue to improve as new understanding about the pathways becomes available.
Second, our discoveries also depended on the quantity and quality of experimental data used to train the models. The phospho‐protein data were collected using commercial multiplexed bead‐based flow cytometric immunoassays. These assays are of high quality: they feature good specificity and linearity. They are limited, however, by the possibility for crossreactivity between antibodies, which limits the number of detection reagents that can be multiplexed. Furthermore, the analytes are restricted to the available assays, such that only a subset of signaling phospho‐proteins can be measured. Here we partially accommodated this limitation by using small‐molecule inhibitors to perturb the activities of nonmeasured molecules. We anticipate that our future work will benefit from new assays and technologies that expand the repertoire of assayable signaling pathways.
In summary, we provide a method for predicting drug combinations to target phospho‐levels of signaling proteins in cancer cells in different microenvironments. Our method is based on the quantitative CFL modeling framework and its associated simulation software, Q2LM. We applied our approach to predict drug combinations in HCC and to resolve gaps in knowledge regarding IL‐1α signaling in HCC cells. Our approach can be used to test new drug combinations in more physiologically relevant microenvironments, which we hope will lead to improved anticancer therapies.
Supporting information
Supporting Information
Supporting Information
Supporting Information
Supporting Information
Supporting Information
Supporting Information
Supporting Information
Supporting Information
Supporting Information
Supporting Information
Acknowledgments
The first two authors contributed equally to this work. Present address for MK Morris: Novartis Institutes for Biomedical Research, Cambridge, Massachusetts, USA. Present address for DC Clarke: Department of Biomedical Physiology and Kinesiology, Simon Fraser University, Burnaby, BC, Canada. Present address for LC Osimiri: UC Berkeley – UCSF Graduate Program in Bioengineering, Berkeley CA, USA. We thank Julio Saez‐Rodriguez for helpful comments on an early draft as well as Sarah Schrier and members of the Lauffenburger lab for technical assistance and insightful discussions. This work was supported by the Institute for Collaborative Biotechnologies through grant W911NF‐09‐0001 from the US Army Research Office.
Author Contributions
D.A.L., M.K.M., and D.C. wrote the article; D.A.L., M.K.M., and D.C. designed the research; M.K.M., D.C., and L.C.O. performed the research; M.K.M. and D.C. analyzed the data.
Conflict of Interest
The authors declare no conflicts of interest.
References
- 1. Cohen R.L. & Settleman, J. From cancer genomics to precision oncology—tissue's still an. Cell 157, 1509–1514 (2014). [DOI] [PubMed] [Google Scholar]
- 2. Wilson, T.R. et al Widespread potential for growth‐factor‐driven resistance to anticancer kinase inhibitors. Nature 487, 505–509 (2012). [DOI] [PMC free article] [PubMed] [Google Scholar]
- 3. DiDonato, J.A. , Mercurio, F. & Karin, M. NF‐kB and the link between inflammation and cancer. Immunol. Rev. 246, 379–400 (2012). [DOI] [PubMed] [Google Scholar]
- 4. Sun, B. & Karin, M. Inflammation and liver tumorigenesis. Front. Med. 7, 242–254 (2013). [DOI] [PubMed] [Google Scholar]
- 5. Giannelli G., Rani B., Dituri F., Cao Y. & Palasciano G.. Moving towards personalised therapy in patients with hepatocellular carcinoma: the role of the microenvironment. Gut 63, 1668–1676 (2014). [DOI] [PubMed] [Google Scholar]
- 6. Llovet, J.M. & Hernandez‐Gea, V. Hepatocellular carcinoma: reasons for phase III failure and novel perspectives on trial design. Clin. Cancer Res. 20, 2072–2079 (2014). [DOI] [PubMed] [Google Scholar]
- 7. Chaudary, N. , Hedley, D.W. & Hill, R.P. Orthotopic xenograft model of cervical cancer for studying microenvironmental effects on metastasis formation and response to drug treatment. Curr. Protoc. Pharmacol Chapter 14, Unit 14.19 (2011). [DOI] [PubMed]
- 8. Griffith, L.G. & Swartz, M.A. Capturing complex 3D tissue physiology in vitro. Nat. Rev. Mol. Cell Biol. 7, 211–224 (2006). [DOI] [PubMed] [Google Scholar]
- 9. Shamir, E.R. & Ewald, A.J. Three‐dimensional organotypic culture: experimental models of mammalian biology and disease. Nat. Rev. Mol. Cell Biol. 15, 647–664 (2014). [DOI] [PMC free article] [PubMed] [Google Scholar]
- 10. Gao, J.‐J. , Shi, Z.‐Y. , Xia, J.‐F. , Inagaki, Y. & Tang, W. Sorafenib‐based combined molecule targeting in treatment of hepatocellular carcinoma. World J. Gastroenterol. 21, 12059–12070 (2015). [DOI] [PMC free article] [PubMed] [Google Scholar]
- 11. Machado, D. et al Modeling formalisms in systems biology. AMB Express 1, 45 (2011). [DOI] [PMC free article] [PubMed] [Google Scholar]
- 12. Kumar, N. , Hendriks, B.S. , Janes, K.A. , de Graaf, D. & Lauffenburger, D.A. Applying computational modeling to drug discovery and development. Drug Discov. Today 11, 806–811 (2006). [DOI] [PubMed] [Google Scholar]
- 13. Janes, K.A. & Lauffenburger, D.A. A biological approach to computational models of proteomic networks. Curr. Opin. Chem. Biol. 10, 73–80 (2006). [DOI] [PubMed] [Google Scholar]
- 14. Morris, M.K. , Saez‐Rodriguez, J. , Clarke, D.C. , Sorger, P.K. & Lauffenburger, D.A. Training signaling pathway maps to biochemical data with constrained fuzzy logic: quantitative analysis of liver cell responses to inflammatory stimuli. PLoS Comput. Biol. 7, e1001099 (2011). [DOI] [PMC free article] [PubMed] [Google Scholar]
- 15. Morris, M.K. , Shriver, Z. , Sasisekharan, R. & Lauffenburger, D.A. Querying quantitative logic models (Q2LM) to study intracellular signaling networks and cell-cytokine interactions. Biotechnol. J. 7, 374–386 (2012). [DOI] [PMC free article] [PubMed] [Google Scholar]
- 16. Liu, J. et al miR‐1285‐3p acts as a potential tumor suppressor miRNA via downregulating JUN expression in hepatocellular carcinoma. Tumour Biol. 36, 219–225 (2015). [DOI] [PubMed] [Google Scholar]
- 17. Guo, L. , Guo, Y. , Xiao, S. & Shi, X. Protein kinase p‐JNK is correlated with the activation of AP‐1 and its associated Jun family proteins in hepatocellular carcinoma. Life Sci. 77, 1869–1878 (2005). [DOI] [PubMed] [Google Scholar]
- 18. Koike, K. Expression of junB is markedly stimulated by glycyrrhizin in a human hepatoma cell line. Oncol. Rep. 25, 609–617 (2011). [DOI] [PubMed] [Google Scholar]
- 19. Sharma, A. , Upadhyay, A.K. & Bhat, M.K. Inhibition of Hsp27 and Hsp40 potentiates 5‐fluorouracil and carboplatin mediated cell killing in hepatoma cells. Cancer Biol. Ther. 8, 2106–2113 (2009). [DOI] [PubMed] [Google Scholar]
- 20. Cavin, L.G. et al Inhibition of CK2 activity by TGF‐beta1 promotes IkappaB‐alpha protein stabilization and apoptosis of immortalized hepatocytes. Hepatology 38, 1540–1551 (2003). [DOI] [PubMed] [Google Scholar]
- 21. Wang, J. et al Mutual interaction between YAP and CREB promotes tumorigenesis in liver cancer. Hepatology 58, 1011–1020 (2013). [DOI] [PubMed] [Google Scholar]
- 22. Song, R. et al Cyclic adenosine monophosphate response element‐binding protein transcriptionally regulates CHCHD2 associated with the molecular pathogenesis of hepatocellular carcinoma. Mol. Med. Rep. 11, 4053–4062 (2015). [DOI] [PMC free article] [PubMed] [Google Scholar]
- 23. Calvisi, D.F. et al Increased lipogenesis, induced by AKT‐mTORC1‐RPS6 signaling, promotes development of human hepatocellular carcinoma. Gastroenterology 140, 1071–1083 (2011). [DOI] [PMC free article] [PubMed] [Google Scholar]
- 24. Baba, H.A. et al Phosphorylation of p70S6 kinase predicts overall survival in patients with clear margin‐resected hepatocellular carcinoma. Liver Int. 29, 399–405 (2009). [DOI] [PubMed] [Google Scholar]
- 25. Ninomiya‐Tsuji, J. et al A resorcylic acid lactone, 5Z‐7‐Oxozeaenol, prevents inflammation by inhibiting the catalytic activity of TAK1 MAPK kinase. J. Biol. Chem. 278, 18485–18490 (2003). [DOI] [PubMed] [Google Scholar]
- 26. Morris, M.K. Development of constrained fuzzy logic for modeling biological regulatory networks and predicting contextual therapeutic effects. Ph.D. thesis, Massachusetts Institute of Technology, Cambridge, MA; 2012.
- 27. Weber, A. , Wasiliew, P. & Kracht, M. Interleukin‐1 (IL‐1) pathway. Sci Signal 3, cm1 (2010). [DOI] [PubMed] [Google Scholar]
- 28. Al‐Sadi, R. , Ye, D. , Said, H.M. & Ma, T.Y. IL‐1beta‐induced increase in intestinal epithelial tight junction permeability is mediated by MEKK‐1 activation of canonical NF‐kappaB pathway. Am. J. Pathol. 177, 2310–2322 (2010). [DOI] [PMC free article] [PubMed] [Google Scholar]
- 29. Staib, F. et al CellMinerHCC: a microarray‐based expression database for hepatocellular carcinoma cell lines. Liver Int. 34, 621–631 (2014). [DOI] [PMC free article] [PubMed] [Google Scholar]
- 30. Sanchez, J.C. et al Inside SWISS‐2DPAGE database. Electrophoresis 16, 1131–1151 (1995). [DOI] [PubMed] [Google Scholar]
- 31. Yu, R. et al Activation of mitogen‐activated protein kinase pathways induces antioxidant response element‐mediated gene expression via a Nrf2‐dependent mechanism. J. Biol. Chem. 275, 39907–39913 (2000). [DOI] [PubMed] [Google Scholar]
- 32. Minet, E. et al c‐JUN gene induction and AP‐1 activity is regulated by a JNK‐dependent pathway in hypoxic HepG2 cells. Exp. Cell Res. 265, 114–124 (2001). [DOI] [PubMed] [Google Scholar]
- 33. Schichl, Y.M. , Resch, U. , Lemberger, C.E. , Stichlberger, D. & de Martin, R. Novel phosphorylation‐dependent ubiquitination of tristetraprolin by mitogen‐activated protein kinase/extracellular signal‐regulated kinase kinase kinase 1 (MEKK1) and tumor necrosis factor receptor‐associated factor 2 (TRAF2). J. Biol. Chem. 286, 38466–3877 (2011). [DOI] [PMC free article] [PubMed] [Google Scholar]
- 34. Yujiri, T. , Sather, S. , Fanger, G.R. & Johnson, G.L. Role of MEKK1 in cell survival and activation of JNK and ERK pathways defined by targeted gene disruption. Science 282, 1911–1914 (1998). [DOI] [PubMed] [Google Scholar]
- 35. Mitsui, H. , Maruyama, T. , Kimura, S. & Takuwa, Y. Thrombin activates two stress‐activated protein kinases, c‐Jun N‐terminal kinase and p38, in HepG2 cells. Hepatology 27, 1362–1267 (1998). [DOI] [PubMed] [Google Scholar]
- 36. Inokuchi, S. et al Disruption of TAK1 in hepatocytes causes hepatic injury, inflammation, fibrosis, and carcinogenesis. Proc. Natl. Acad. Sci. U. S. A. 107, 844–849 (2010). [DOI] [PMC free article] [PubMed] [Google Scholar]
- 37. Saez‐Rodriguez, J. et al Comparing signaling networks between normal and transformed hepatocytes using discrete logical models. Cancer Res. 71, 5400–5411 (2011). [DOI] [PMC free article] [PubMed] [Google Scholar]
- 38. Zimmerman, E.I. et al Multikinase inhibitors induce cutaneous toxicity through OAT6‐mediated uptake and MAP3K7‐driven cell death. Cancer Res. 76, 117–126 (2016). [DOI] [PMC free article] [PubMed] [Google Scholar]
- 39. Llovet, J.M. , Villanueva, A. , Lachenmayer, A. & Finn, R.S. Advances in targeted therapies for hepatocellular carcinoma in the genomic era. Nat. Rev. Clin. Oncol. 12, 408–424 (2015). [DOI] [PubMed] [Google Scholar]
- 40. Llovet, J.M. & Bruix, J. Molecular targeted therapies in hepatocellular carcinoma. Hepatology 48, 1312–1327 (2008). [DOI] [PMC free article] [PubMed] [Google Scholar]
- 41. Zhou, Q. , Lui, V.W.Y. & Yeo, W. Targeting the PI3K/Akt/mTOR pathway in hepatocellular carcinoma. Future Oncol. 7, 1149–1167 (2011). [DOI] [PubMed] [Google Scholar]
- 42. Zhang, Q. et al Dihydromyricetin promotes hepatocellular carcinoma regression via a p53 activation‐dependent mechanism. Sci. Rep. 4, 4628 (2014). [DOI] [PMC free article] [PubMed] [Google Scholar]
- 43. Hsieh, S.‐Y. et al Secreted ERBB3 isoforms are serum markers for early hepatoma in patients with chronic hepatitis and cirrhosis. J. Proteome Res. 10, 4715–4724 (2011). [DOI] [PubMed] [Google Scholar]
- 44. Feala, J.D. et al Systems approaches and algorithms for discovery of combinatorial therapies. Wiley Interdiscip. Rev. Syst. Biol. Med. 2, 181–193 (2010). [DOI] [PubMed] [Google Scholar]
- 45. Ryall, K.A. & Tan, A.C. Systems biology approaches for advancing the discovery of effective drug combinations. J. Cheminform. 7, 7 (2015). [DOI] [PMC free article] [PubMed] [Google Scholar]
- 46. Flobak, Å. et al Discovery of drug synergies in gastric cancer cells predicted by logical modeling. PLoS Comput. Biol. 11, e1004426 (2015). [DOI] [PMC free article] [PubMed] [Google Scholar]
- 47. Zhang, Y. et al MEKK1‐MKK4‐JNK‐AP1 pathway negatively regulates Rgs4 expression in colonic smooth muscle cells. PLoS One 7, e35646 (2012). [DOI] [PMC free article] [PubMed] [Google Scholar]
- 48. Sakai, A. , Han, J. , Cato, A.C.B. , Akira, S. & Li, J.‐D. MEKK1‐MKK4‐JNK‐AP1 pathway negatively regulates Rgs4 expression in colonic smooth muscle cells. BMC Mol. Biol. 5, 2 (2004). [DOI] [PMC free article] [PubMed] [Google Scholar]
- 49. Saez‐Rodriguez, J. et al Discrete logic modelling as a means to link protein signalling networks with functional analysis of mammalian signal transduction. Mol. Syst. Biol. 5, 331 (2009). [DOI] [PMC free article] [PubMed] [Google Scholar]
- 50. Müller, T. et al Sense and nonsense of pathway analysis software in proteomics. J. Proteome Res. 10, 5398–5408 (2011). [DOI] [PubMed] [Google Scholar]
Associated Data
This section collects any data citations, data availability statements, or supplementary materials included in this article.
Supplementary Materials
Supporting Information
Supporting Information
Supporting Information
Supporting Information
Supporting Information
Supporting Information
Supporting Information
Supporting Information
Supporting Information
Supporting Information