Significance
We report an essential regulator of insulin sensitivity. Mutations affecting this protein, KBTBD2, cause severe insulin-resistant diabetes, lipodystrophy, hepatic steatosis, and growth retardation. KBTBD2 is the substrate recognition subunit of a ubiquitin ligase, and its essential molecular target is p85α, the regulatory subunit of phosphoinositol-3-kinase. KBTBD2 is highly conserved among vertebrates and expressed in liver, brain, muscle, and adipocytes. In the absence of KBTBD2, p85α levels rise 30-fold in adipocytes, interrupting the insulin signal, which is fully restored by p85α knockout. Transfer of KBTBD2-sufficient adipose tissue to KBTBD2-deficient animals rescues insulin-resistant hyperglycemia. Within adipocytes, KBTBD2 expression is markedly down-regulated in response to a high-fat diet. This appears to be an important cause of the insulin resistance caused by obesity.
Keywords: diabetes, insulin resistance, Kbtbd2, p85α, ubiquitination
Abstract
We describe a metabolic disorder characterized by lipodystrophy, hepatic steatosis, insulin resistance, severe diabetes, and growth retardation observed in mice carrying N-ethyl-N-nitrosourea (ENU)–induced mutations. The disorder was ascribed to a mutation of kelch repeat and BTB (POZ) domain containing 2 (Kbtbd2) and was mimicked by a CRISPR/Cas9-targeted null allele of the same gene. Kbtbd2 encodes a BTB-Kelch family substrate recognition subunit of the Cullin-3–based E3 ubiquitin ligase. KBTBD2 targeted p85α, the regulatory subunit of the phosphoinositol-3-kinase (PI3K) heterodimer, causing p85α ubiquitination and proteasome-mediated degradation. In the absence of KBTBD2, p85α accumulated to 30-fold greater levels than in wild-type adipocytes, and excessive p110-free p85α blocked the binding of p85α-p110 heterodimers to IRS1, interrupting the insulin signal. Both transplantation of wild-type adipose tissue and homozygous germ line inactivation of the p85α-encoding gene Pik3r1 rescued diabetes and hepatic steatosis phenotypes of Kbtbd2−/− mice. Kbtbd2 was down-regulated in diet-induced obese insulin-resistant mice in a leptin-dependent manner. KBTBD2 is an essential regulator of the insulin-signaling pathway, modulating insulin sensitivity by limiting p85α abundance.
The insulin-signaling pathway regulates energy homeostasis by promoting glucose and triglyceride uptake into fat, muscle, and other insulin-sensitive cells, stimulating lipogenesis and inhibiting lipolysis, glycogenolysis, and gluconeogenesis (1, 2). Insulin resistance, present in metabolic disorders including obesity and type 2 diabetes, dysregulates these processes and results in chronic elevation of circulating glucose and lipids. Insulin signaling depends on several downstream pathways, including the phosphoinositol 3-kinase (PI3K) pathway, in which PI3Ks are recruited to the plasma membrane by tyrosine-phosphorylated insulin receptor substrates (IRS1 and 2). PI3Ks catalyze the phosphorylation of phosphoinositide 4,5-bisphosphate (PIP2) to produce phosphoinositide 3,5-triphosphate (PIP3). PIP3 recruits to the cell membrane and activates pleckstrin homology domain-containing proteins, including PDK1 and AKT, ultimately leading to glucose transport, lipid and glycogen synthesis, and regulated gene expression.
Class IA PI3Ks, which mediate signaling from the insulin receptor, are heterodimers of a p85 regulatory subunit and a p110 catalytic subunit (3). Although p85 binds and stabilizes p110, p85 also conformationally inhibits p110 catalytic activity (4–8). On activation by insulin, binding to tyrosine-phosphorylated IRS1 relieves the inhibitory conformation of p85, resulting in activation of p110 catalytic activity (4, 8–10). Previous reports have suggested that when present in the cell in excess of stoichiometric amounts, p110-free p85 can bind to tyrosine-phosphorylated IRS1, sequestering IRS1 from prospective catalytically active p85-p110 heterodimers and thereby inhibiting PI3K (11–13).
Here we report a Cullin-3 (Cul3)-based ubiquitination mechanism that limits p85α protein abundance and is essential for normal insulin signaling.
Results
Diabetes, Lipodystrophy, and Hepatic Steatosis in teeny Mice.
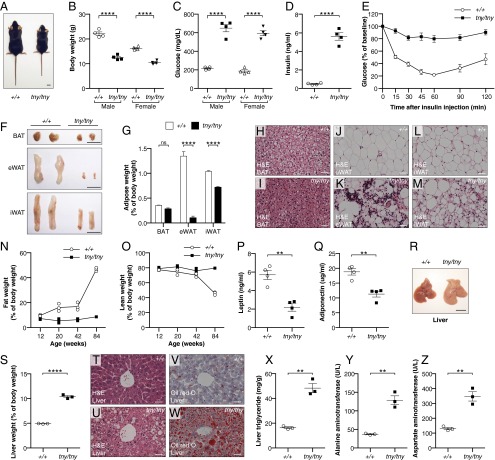
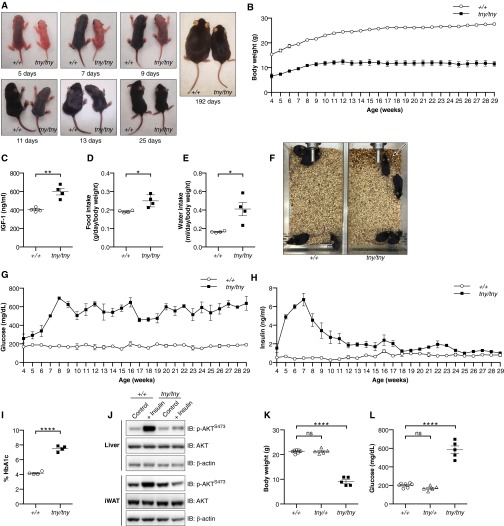
A phenotype observed among third-generation (G3) C57BL/6J mice homozygous for mutations induced by N-ethyl-N-nitrosourea (ENU), termed teeny (tny) (14), was characterized by reduced body size and weight within the first few days and throughout postnatal life (Fig. 1 A and B and Fig. S1 A and B). Normal amounts of IGF1 were detected in the serum of homozygous tny mice (Fig. S1C), which consumed more food and water per gram of body weight and produced more urine than wild-type (WT) mice (Fig. S1 D–F). Between 4 and 8 wk of age, fasting blood glucose and insulin concentrations increased dramatically in tny/tny mice compared with WT mice; thereafter, hyperglycemia persisted, whereas insulin levels declined to near those of WT mice (Fig. 1 C and D and Fig. S1 G–I). Insulin tolerance testing showed insulin resistance in 8-wk-old tny/tny mice (Fig. 1E). We also found that even at 4 wk of age, liver and inguinal white adipose tissue (iWAT) of tny/tny mice failed to respond to insulin, as indicated by impaired phosphorylation of AKT Ser473 (Fig. S1J). These data demonstrate altered glucose metabolism, characterized by hyperglycemia, hyperinsulinemia, and insulin resistance, in homozygous tny mice.
Fig. 1.
The teeny phenotype. (A) Photograph of a male tny homozygote (tny/tny) and WT (+/+) littermate at 8 wk of age. (Scale bar: 1 cm.) (B–D) Body weight (B), blood glucose (C), and serum insulin (D) of 8-wk-old mice. Glucose and insulin were measured after a 6-h fast. (E) Insulin tolerance test. Blood glucose was measured at indicated times after i.p. insulin injection in 8-wk-old male mice (n = 3). The baseline blood glucose levels (0 min) of tny/tny and WT littermates were 626 ± 31 mg/dL and 168 ± 8 mg/dL, respectively. (F) Representative photographs of BAT, eWAT, and iWAT from 20-wk-old male mice. (Scale bars: 1 cm.) (G) Weights of BAT, eWAT, and iWAT normalized to body weight in 20-wk-old male mice (n = 3). (H–M) H&E staining of sections from different adipose tissues of 20-wk-old male mice. (Scale bars: 30 μm.) (N and O) Fat weight (N) and lean weight (O) normalized to body weight of male mice at indicated ages by MRI (n = 3). (P and Q) Serum leptin (P) and adiponectin (Q) in 8-wk-old male mice. (R) Representative photographs of liver from 8-wk-old male mice. (Scale bar: 1 cm.) (S) Liver weight normalized to body weight in 8-wk-old male mice (n = 3). (T–W) Liver sections of 20-wk-old male mice stained with H&E (T and U) and Oil red O (V and W). (Scale bars: 30 μm.) (X–Z) Liver triglyceride (X), serum ALT (Y), and AST (Z) in 8-wk-old male mice. In B–D, N–Q, S, and X–Z, data points represent individual mice. P values were determined by Student’s t test.
Fig. S1.
The teeny phenotype. (A) Photographs of homozygous tny mice and WT littermates at different ages after birth. (B) Growth curve of male homozygous tny mice (n = 3) and WT littermates (n = 3) from 4 wk of age to 29 wk of age. (C) Serum IGF1 in 8-wk-old male mice. (D and E) Food (D) and water (E) intake of 8-wk-old male mice. (F) Photographs of cages with 8-wk-old male homozygous tny mice (n = 4) or WT littermates (n = 4) at 2 d after cage change. The tny/tny cage was wetted with urine (arrow). (G and H) Blood glucose (G) and serum insulin (H) were measured in male homozygous tny mice (n = 3) and WT littermates (n = 3) at weekly intervals, each time after a 6-h fast, beginning at 4 wk of age. (I) HbA1c in the blood of 8-wk-old male mice. (J) Immunoblots of liver and adipose tissue lysates from 4-wk-old male homozygous tny/tny mice and WT littermates, with or without insulin injection. Insulin or saline was injected i.p. at a dose of 1.5 U/kg body weight. Tissues were removed for analysis at 30 min postinjection. (K and L) Body weight (K) and blood glucose levels (L) of male homozygous tny, heterozygous tny, and WT mice at 8 wk of age. Glucose was measured after a 6-h fast. In C–E, H, K, and L, data points represent individual mice. P values were determined by Student’s t test.
Necropsy revealed that adipose tissue beds of tny/tny mice were reduced in size relative to those in WT mice, a finding most evident in epididymal white adipose tissue (eWAT) but also apparent in iWAT (Fig. 1 F and G). Hematoxylin and eosin (H&E) staining revealed irregular and shriveled adipocytes (Fig. 1 H–M). Magnetic resonance imaging (MRI) showed that tny/tny mice were lean throughout life compared with WT littermates (Fig. 1 N and O). Presumably as a result of lipodystrophy, tny/tny mice had reduced adipokines, such as leptin and adiponectin, in the serum (Fig. 1 P and Q). In addition, 8-wk-old tny mice had large, pallid livers (Fig. 1 R and S), and Oil Red O (ORO) staining showed an abundance of stored lipid (Fig. 1 T–W), possibly a consequence of compromised adipose tissue fat storage caused by impaired insulin signaling (15). Liver extracts of fasting tny mice showed increased stored triglyceride compared with WT mice (Fig. 1X). Both aspartate aminotransferase (AST) and alanine aminotransferase (ALT) were increased in the serum of tny mice, suggesting liver damage caused by lipid accumulation (Fig. 1 Y and Z).
Both male and female tny homozygotes were infertile; females became pregnant but failed to deliver pups. Crosses of heterozygous mice yielded a non-Mendelian birth ratio among offspring (Table S1), suggesting prenatal attrition of homozygotes.
Table S1.
Non-Mendelian birth ratio of tny heterozygous breedings
| Genotype | Pup numbers | Percentage |
| +/+ | 131 | 32.5% |
| tny/+ | 236 | 58.6% |
| tny/tny | 36 | 8.9% |
Tny Phenotypes Are Caused by a Kbtbd2 Mutation.
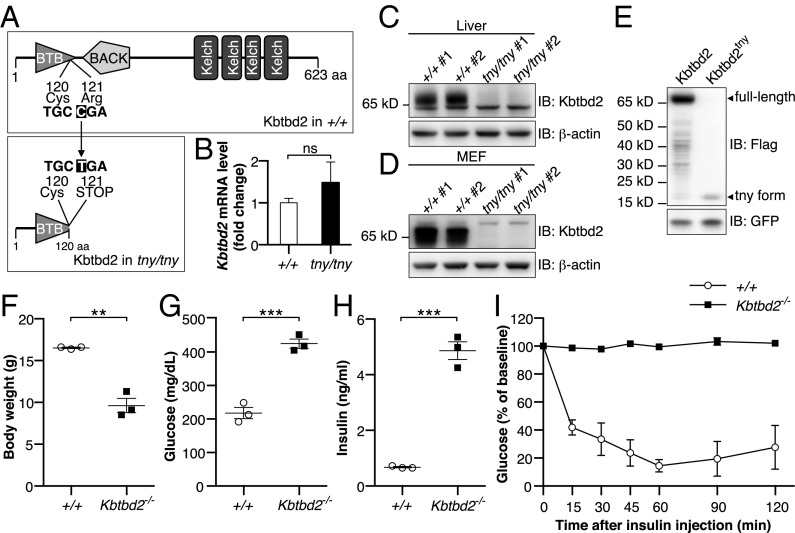
Tny was earlier mapped to a premature stop codon in kelch repeat and BTB (POZ) domain containing 2 (Kbtbd2) using body weight as a quantitative trait under a recessive model of inheritance (Fig. 2A) (14). No tny phenotypes were observed in heterozygous mice (Fig. S1 K and L). Although normal levels of Kbtbd2 mRNA were detected in Kbtbd2tny/tny liver (Fig. 2B), expression of endogenous KBTBD2 was undetectable by immunoblotting in Kbtbd2tny/tny liver or mouse embryonic fibroblast (MEF) lysates (Fig. 2 C and D), and no full-length protein was detected when a tagged version of KBTBD2tny was overexpressed in 293T cells (Fig. 2E). We confirmed that the tny phenotype was caused by Kbtbd2 mutation in mice homozygous for a second null allele of Kbtbd2 generated by CRISPR/Cas9 gene targeting (Kbtbd2−/−), which fully recapitulated all aspects of the tny phenotype (Fig. 2 F–I). Taken together, these findings indicate that insulin resistance, diabetes, lipodystrophy, and fatty liver stem from a homozygous null allele of Kbtbd2 in tny mice.
Fig. 2.
Mutations of Kbtbd2 cause the tny phenotype. (A) Protein domains of WT mouse KBTBD2 (Upper) and position of tny mutation (Lower). The tny mutation is an arginine to premature stop codon substitution at position 121 of the protein. (B) Relative Kbtbd2 mRNA level (normalized to Actb mRNA) measured by RT-qPCR of mRNA isolated from livers of three male homozygous tny mice or WT littermates. (C and D) Immunoblots of liver (C) and MEF (D) lysates from two male homozygous tny mice and WT littermates. (E) Immunoblots of lysates of 293T cells expressing 3×FLAG-tagged full-length WT KBTBD2 or KBTBD2tny. GFP was coexpressed as a loading control. (F–H) Body weight (F), blood glucose (G), and serum insulin (H) values in 6-wk-old male homozygous Kbtbd2 KO (Kbtbd2−/−) and WT littermates. Glucose and insulin were measured after a 6-h fast. (I) Insulin tolerance test. Blood glucose was measured at indicated times after i.p. insulin injection in male Kbtbd2−/− mice (n = 4) and WT littermates (n = 3) at 16 wk of age. The baseline blood glucose levels (0 min) of Kbtbd2−/− mice and WT littermates were 728 ± 18 mg/dL and 298 ± 28 mg/dL, respectively. In F–H, data points represent individual mice. P values were determined by Student’s t test.
Rescue of the tny Phenotype by WT Adipose Tissue.
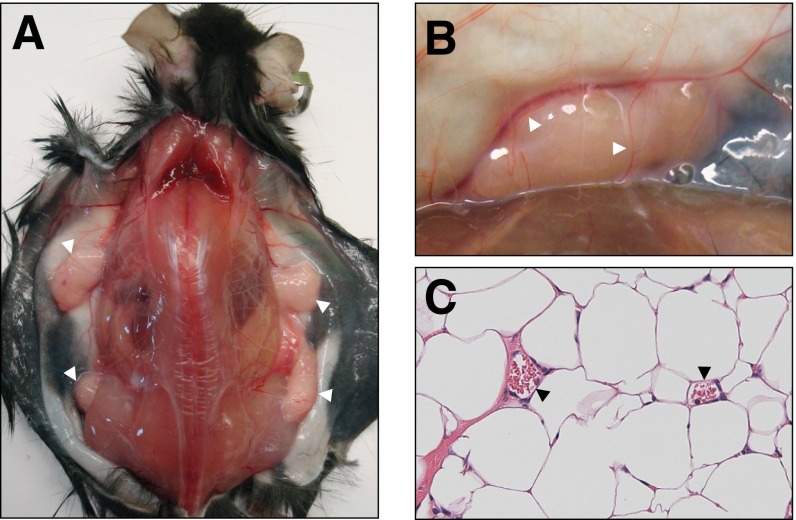
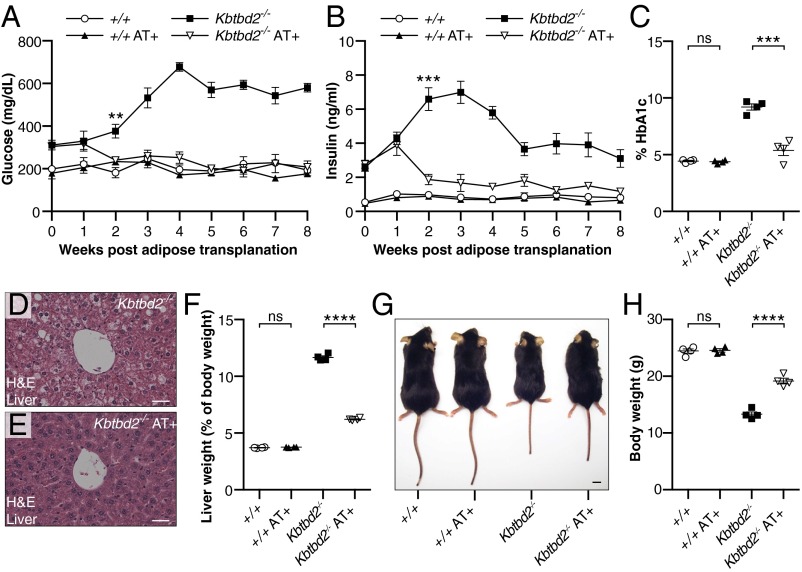
Lipodystrophies are often associated with insulin resistance, diabetes, dyslipidemia, and hepatic steatosis. Thus, we tested whether s.c. implantation of WT adipose tissue into 4-wk-old Kbtbd2−/− mice could rescue the hyperglycemia, hyperinsulinemia, and hepatic steatosis observed in these mice. At 12 wk after surgery, transplanted eWAT grafts had a healthy, vascularized appearance, indicating host acceptance of the tissue (Fig. S2). Strikingly, by 2 wk postsurgery, blood glucose and insulin in transplanted Kbtbd2−/− mice had decreased to concentrations similar to those in WT mice, and were maintained through 8 wk postsurgery (Fig. 3 A and B). HbA1c levels were normal in transplanted Kbtbd2−/− mice at 8 wk postsurgery (Fig. 3C). Moreover, hepatic steatosis in Kbtbd2−/− mice was reversed by adipose transplantation (Fig. 3 D and E); liver weight was similarly restored toward WT levels (Fig. 3F). Adipose transplantation also partially rescued the growth retardation of Kbtbd2−/− mice (Fig. 3 G and H). Thus, adipose tissue expressing functional KBTBD2 is by itself sufficient to rescue hyperglycemia, hyperinsulinemia, and hepatic steatosis in Kbtbd2−/− mice.
Fig. S2.
Adipose transplantation of tny mice. (A) Representative photograph of a Kbtbd2−/− mouse at 12 wk after transplantation of adipose tissue from a WT mouse (Kbtbd2−/− AT+). Skin was dissected to show the adipose tissue grafts (white arrowheads). (B) Enlarged view of an adipose tissue graft showing the blood vessels (arrowheads) supplying the graft. (C) H&E staining of a section of grafted adipose tissue. Red blood cells are visible (arrowheads) in the blood vessels.
Fig. 3.
WT adipose tissue transplantation rescues the tny phenotype. Surgery was performed at 4 wk of age, and mice received WT adipose tissue (AT+) or PBS (n = 4 mice of the indicated genotype per condition). (A and B) Blood glucose (A) and serum insulin (B) in mice before (0 wk) and at the indicated times after adipose transplantation. (C) HbA1c in blood of mice 8 wk after transplantation. (D and E) H&E staining of sections from liver of Kbtbd2−/− or Kbtbd2−/− AT+ mice at 12 wk after transplantation. (Scale bars: 30 μm.) (F–H) Liver weight normalized to body weight (F), representative photograph (G), or body weight (I) of mice at 12 wk after transplantation. (Scale bar in G: 1 cm.) Data points represent individual mice (C, F, and H). P values were determined by Student’s t test.
Elevated p85α Expression in KBTBD2-Deficient Mice.
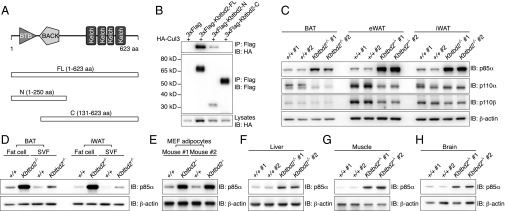
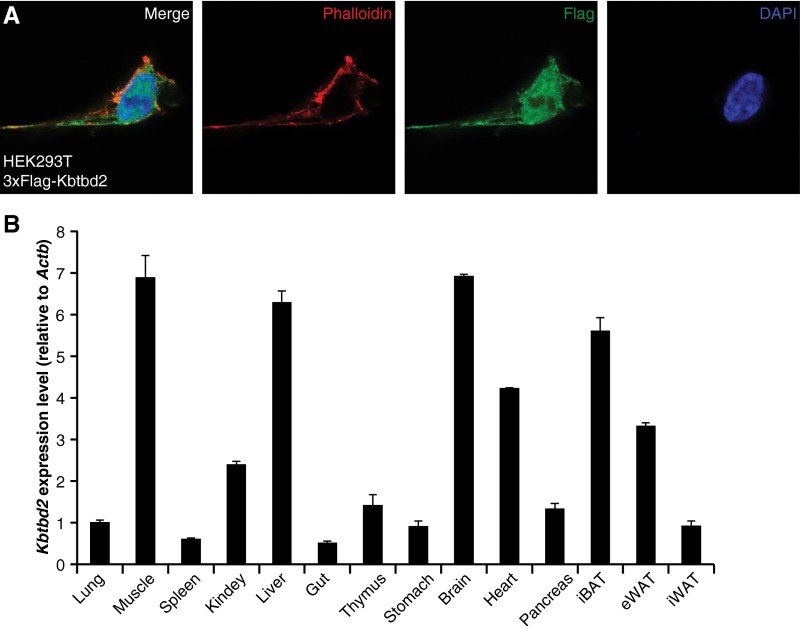
The 623-aa KBTBD2 protein, for which no function has been reported previously, contains BTB (Broad-complex, Tramtrack, and Bric à brac) and BACK (BTB and C-terminal Kelch) domains at its N terminus and four tandem Kelch motifs at its C terminus (Fig. 4A), similar to other BTB-BACK-Kelch proteins (16). The mouse protein is 98.6% identical to human KBTBD2; highly similar homologs are found in other vertebrates (Table S2), but are not present in invertebrate organisms (17, 18). KBTBD2 was observed both in the nucleus and cytoplasm on overexpression in 293T cells (Fig. S3A). Kbtbd2 mRNA was detected in a variety of mouse tissues, with relatively higher expression in muscle, liver, brain, iBAT, heart, and eWAT (Fig. S3B).
Fig. 4.
Elevated p85α Expression in KBTBD2-deficient Mice. (A) Protein domains of mouse KBTBD2 and truncated forms for mapping the protein interaction region. (B) Immunoblot analysis of immunoprecipitates (Top and Middle) or lysates (Bottom) of 293T cells expressing HA-tagged Cul3 and 3×FLAG-tagged full-length (FL) or truncated KBTBD2. (C) Immunoblots of lysates of different adipose tissues from two 8-wk-old male Kbtbd2−/− mice or WT littermates. (D) Immunoblots of lysates of isolated fat cells or SVF from different adipose tissues of 8-wk-old WT or Kbtbd2−/− mice. (E) Immunoblots of lysates of 10-d-differentiated MEF-derived adipocytes from two different mice. (F–H) Immunoblots of liver (F), muscle (G), and brain (H) lysates from 8-wk-old WT or Kbtbd2−/− mice.
Table S2.
Percent pairwise identity of KBTBD2 amino acid sequences
| Species | Mus musculus | Homo sapiens | Pan troglodytes | Macaca mulatta | Canis lupus | Bos taurus | Rattus norvegicus | Gallus gallus | Xenopus tropicalis | Danio rerio |
| Mus musculus | 100.0 | |||||||||
| Homo sapiens | 98.6 | 100.0 | ||||||||
| Pan troglodytes | 98.4 | 99.8 | 100.0 | |||||||
| Macaca mulatta | 98.6 | 100 | 99.8 | 100.0 | ||||||
| Canis lupus | 99.0 | 99.4 | 99.2 | 99.4 | 100.0 | |||||
| Bos taurus | 99.4 | 98.9 | 98.7 | 98.9 | 99.4 | 100.0 | ||||
| Rattus norvegicus | 99.7 | 98.7 | 98.6 | 98.7 | 99.0 | 99.4 | 100.0 | |||
| Gallus gallus | 93.7 | 94.4 | 94.2 | 94.4 | 94.7 | 93.6 | 94.1 | 100.0 | ||
| Xenopus tropicalis | 84.7 | 85.0 | 84.9 | 85.0 | 85.4 | 82.3 | 85.0 | 86.2 | 100.0 | |
| Danio rerio | 79.3 | 79.0 | 78.8 | 79.0 | 79.3 | 78.5 | 79.6 | 80.1 | 74.4 | 100.0 |
Fig. S3.
Subcellular location of the KBTBD2 protein and expression profile of Kbtbd2 transcript. (A) 293T cells expressing 3×FLAG-tagged KBTBD2 protein were immunostained with FLAG (green) antibody, phalloidin (red) to visualize F-actin, and DAPI (blue) to visualize nuclei. (B) Kbtbd2 transcript levels normalized to Actb mRNA in different tissues of male C57BL/6J mice at 8 wk of age (n = 3).
Numerous BTB-BACK-Kelch proteins function as substrate recognition components of Cul3-based E3 ubiquitin (Ub) ligase complexes (16, 19). Coimmunoprecipitation (co-IP) experiments showed that full-length KBTBD2 interacted with Cul3 through the KBTBD2 N-terminal BTB domain (Fig. 4 A and B), suggesting that KBTBD2 might fulfill a similar function. We hypothesized that putative KBTBD2-specified substrates of the Cul3 Ub ligase complex accumulate in Kbtbd2 mutant mice, and sought to identify these by semiquantitative mass spectrometry analysis of proteins in white adipose tissues of WT or Kbtbd2−/− mice. Among the 1,171 proteins identified in all samples (Dataset S1), six proteins were greater than fivefold more abundant in both eWAT and iWAT from Kbtbd2−/− mice relative to WT mice (Table S3). p85α, a regulatory subunit of PI3K, was elevated by 40- and 24-fold in Kbtbd2−/− eWAT and iWAT, respectively, and we considered it highly relevant to the tny phenotype because of its key role in PI3K regulation.
Table S3.
Proteins identified by mass spectrometry that were increased by more than fivefold in multiple Kbtbd2−/− adipose tissue samples relative to WT samples
We verified the specific accumulation of p85α in Kbtbd2−/− adipose tissues, in which normal to reduced amounts of the PI3K catalytic subunits p110α and p110β were detected (Fig. 4C). Within adipose tissues, fat cells accumulated greater amounts of p85α than stromal vascular fraction (SVF) cells (Fig. 4D). Similarly, p85α protein accumulated in Kbtbd2−/− adipocyte-like cells differentiated from MEFs (MEF-derived adipocytes) (Fig. 4E). We observed accumulation of p85α in Kbtbd2−/− liver, muscle, and brain (Fig. 4 F–H). Knockdown of KBTBD2 in differentiated human adipocytes also increased p85α protein levels (Fig. S4A). These data demonstrate that KBTBD2 deficiency results in elevated p85α expression in mouse tissues with high expression levels of Kbtbd2, including adipose tissue, liver, muscle, and brain, as well as in human adipocytes.
Fig. S4.
KBTBD2 regulates p85α in differentiated human adipocytes. (A) Immunoblots of lysates of differentiated human adipocytes expressing control shRNA or two different Kbtbd2 shRNAs. (B) Immunoblot analysis of immunoprecipitates (Top and Middle) or lysates (Bottom) of differentiated human adipocytes expressing the indicated tagged proteins. (C) Immunoblots of lysates of differentiated human adipocytes expressing control shRNA or two different Kbtbd2 shRNAs with or without insulin treatment.
KBTBD2 Interaction with Cul3 and p85α Results in p85α Ubiquitination.
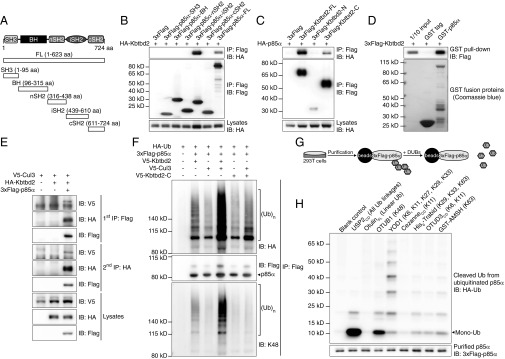
KBTBD2 interacted with p85α when expressed in 293T cells; the p85α inter-SH2 domain (iSH2; Fig. 5 A and B) and the KBTBD2 C-terminal Kelch domains were required for this interaction (Figs. 4A and 5C). In vitro GST pull-down experiments supported a direct interaction between KBTBD2 and p85α (Fig. 5D). Human KBTBD2 also interacted with human p85α in differentiated adipocytes (Fig. S4B). Moreover, two-step IP demonstrated simultaneous binding of p85α and Cul3 to KBTBD2 to form a three-protein complex (Fig. 5E). Coexpression of KBTBD2, p85α, Cul3, and Ub in 293T cells resulted in p85α polyubiquitination, which was reduced in the absence of Cul3 or KBTBD2 (Fig. 5F). The BTB domain is critical for the recruitment of Cul3 Ub ligase complexes, because KBTBD2-C failed to mediate p85α ubiquitination (Fig. 5F). These polyubiquitin chains were K48-linked (Fig. 5 F–H), which serves as a degradation signal for the proteasome. These data suggest that KBTBD2 recruits p85α to Cul3 Ub ligase complexes for K48-linked ubiquitination, leading to proteasome-mediated degradation of p85α.
Fig. 5.
Interaction of KBTBD2 with Cul3 and p85α results in p85α ubiquitination. (A) Protein domains of mouse p85α and truncated forms for mapping the protein interaction region. (B) Immunoblot analysis of immunoprecipitates (Top and Middle) or lysates (Bottom) of 293T cells expressing HA-tagged KBTBD2 and 3×FLAG-tagged full-length (FL) or truncated p85α. (C) Immunoblot analysis of immunoprecipitates (Top and Middle) or lysates (Bottom) of 293T cells expressing HA-tagged p85α and 3×FLAG-tagged full-length (FL) or truncated KBTBD2. (D) Purified 3×FLAG-tagged KBTBD2 was incubated with GST or GST-tagged p85α. After GST pull-down, bound protein was analyzed by FLAG immunoblot (Top). The amounts of GST and GST-p85α were visualized by Coomassie blue staining (Bottom). (E) Immunoblot analysis of lysates of 293T cells expressing the indicated proteins and subjected to two-step IP to detect the three-protein complex. (F) IP analysis of lysates of 293T cells expressing HA-tagged Ub and the indicated proteins. (G) Flowchart of experimental procedures for data in H. HA-tagged Ub and 3×FLAG-tagged p85α were expressed in 293T cells. Immunoprecipitated 3×FLAG-p85α was treated with the indicated deubiquitinating enzymes (DUBs), which specifically cleave particular Ub linkages. The released HA-Ub in the reaction supernatant was immunoblotted with HA antibody. The deubiquitinated 3×FLAG-p85α was immunoblotted with FLAG antibody. (H) Immunoblot analysis of HA-tagged Ub (Top) released by the indicated DUBs from ubiquitinated 3×FLAG-tagged p85α (Bottom). Mono-Ub, monoubiquitin.
Impaired PI3K Signaling due to Elevated p85α in Kbtbd2−/− Mice.
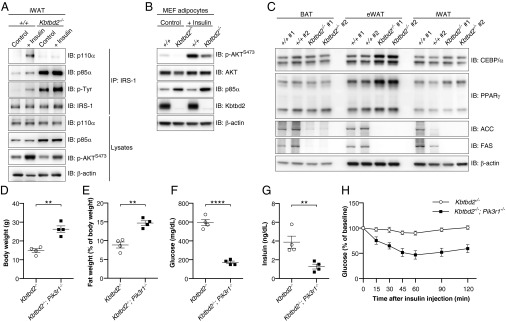
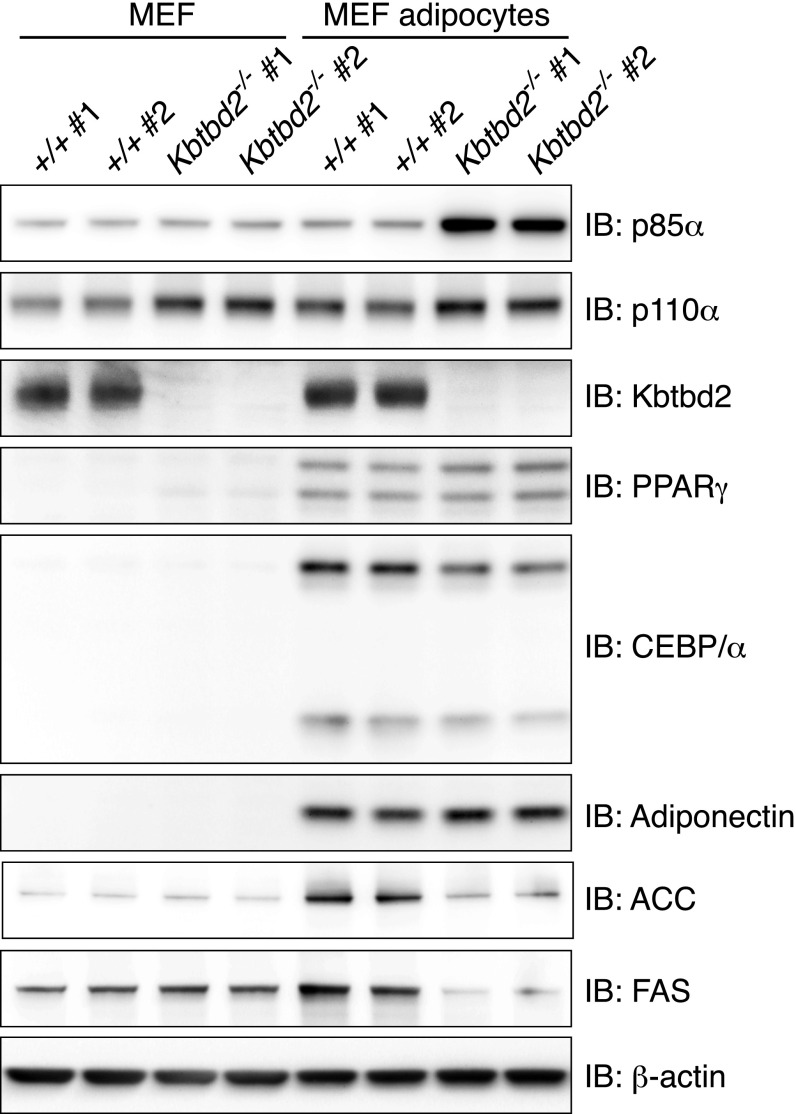
Based on its striking rescue of metabolic phenotypes, we focused on adipose tissue to determine the effect of increased p85α expression on insulin signaling. We examined Kbtbd2−/− adipose tissue in vivo for the association between PI3K subunits and IRS-1 and AKT S473 phosphorylation before and after i.p. injection of insulin in WT or Kbtbd2−/− mice. In WT iWAT, insulin induced tyrosine phosphorylation of IRS-1, and formation of a complex containing IRS-1, p110α, and p85α (Fig. 6A). In contrast, IRS-1 was associated with large amounts of p85α in Kbtbd2−/− iWAT independent of insulin stimulation, and p110α bound minimally to IRS-1 either before or after insulin stimulation (Fig. 6A). Moreover, phosphorylation of AKT S473 increased in WT iWAT after insulin stimulation, but this response was diminished in Kbtbd2−/− iWAT (Fig. 6A). We also observed increased levels of insulin-independent tyrosine phosphorylation on IRS-1 in Kbtbd2−/− iWAT, likely a result of elevated endogenous insulin in the mice (Fig. 6A). These data suggest that elevated p85α expression in Kbtbd2−/− adipose tissue results in impaired PI3K signaling. These signaling defects are likely adipocyte-intrinsic, given that Kbtbd2−/− MEF-derived adipocytes and human adipocytes in which KBTBD2 was knocked down also exhibited impaired AKT S473 phosphorylation in response to insulin (Fig. 6B and Fig. S4C). Moreover, the expression of adipocyte differentiation markers PPARγ and C/EBPα was normal in Kbtbd2−/− MEF-derived adipocytes and adipose tissues, whereas the expression of fatty acid synthase (FAS) and acetyl-CoA carboxylase (ACC), enzymes involved in fatty acid synthesis, was reduced, suggesting that KBTBD2 deficiency impairs the metabolic function of adipocytes, but not their differentiation (Fig. 6C and Fig. S5).
Fig. 6.
p85α accumulation impairs PI3K signaling and causes the tny phenotype. (A) Immunoblot analysis of immunoprecipitates and lysates of iWAT before (Control, anesthesia alone) or 5–6 min after i.v. injection of insulin (+Insulin). (B) Immunoblots of lysates of 10-d-differentiated MEF-derived adipocytes. (C) Immunoblots of lysates of different adipose tissues from two 8-wk-old male Kbtbd2−/− mice or WT littermates. (D–G) Body weight (D), normalized fat weight (E), blood glucose levels (F), and serum insulin levels (G) of 11-wk-old male Kbtbd2−/− and Kbtbd2−/−; Pik3r1−/− mice. Glucose and insulin were measured after a 6-h fast. (H) Insulin tolerance test. Blood glucose was measured at indicated times after i.p. insulin injection in male Kbtbd2−/− mice (n = 4) and Kbtbd2−/−; Pik3r1−/− mice (n = 4) at 11 wk of age. The baseline blood glucose levels (0 min) of Kbtbd2−/− mice and Kbtbd2−/−; Pik3r1−/− mice were 594 ± 32 mg/dL and 172 ± 14 mg/dL, respectively. In D–G, data points represent individual mice. P values were determined by Student’s t test.
Fig. S5.
KBTBD2 deficiency impairs the metabolic function of MEF-derived adipocytes. MEF cells isolated from two WT embryos or Kbtbd2−/− embryos were differentiated in vitro for 10 d to generate MEF-derived adipocytes. Immunoblots of lysates of original MEFs or MEF-derived adipocytes are shown.
To confirm that elevated p85α was the biological anomaly responsible for the observed PI3K signaling defects and tny phenotype, we generated mice deficient in both KBTBD2 and p85α (Kbtbd2−/−; Pik3r1−/−). Compared with Kbtbd2−/− mice, Kbtbd2−/−; Pik3r1−/− mice had increased body weight, restored fat storage, and decreased blood glucose and insulin (Fig. 6 D–G). Furthermore, loss of p85α restored insulin sensitivity in the Kbtbd2−/− background (Fig. 6H). These findings indicate that PI3K signaling in response to insulin is impaired in KBTBD2-deficient mice owing to increased amounts of p85α, and that accumulated p85α causes the tny phenotype.
KBTBD2 Suppression Within Adipocytes Occurs in Diet-Induced Obesity.
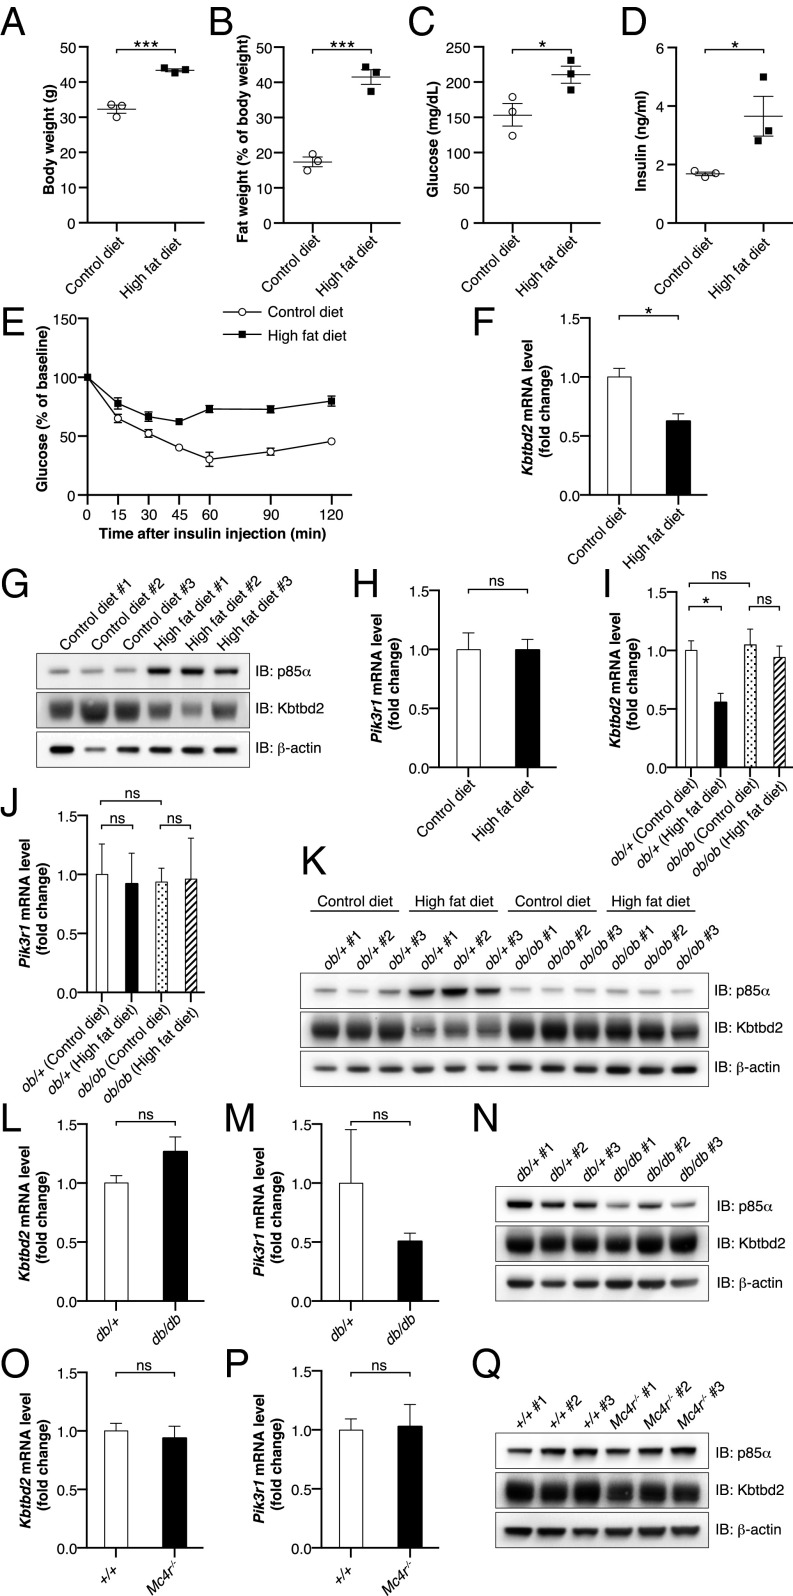
Obesity is strongly associated with insulin resistance (20, 21), and the clear requirement for KBTBD2 in the maintenance of insulin sensitivity prompted us to determine whether KBTBD2 might be modulated by diet-induced obesity. WT C57BL/6J mice maintained on a high-fat diet for 18 wk exhibited higher body weight owing to obesity, increased fasting glucose levels, and insulin resistance (Fig. 7 A–E). We also observed reduced KBTBD2 mRNA and protein expression and increased p85α protein expression in adipose tissue from these mice (Fig. 7 F and G). No effect on p85α mRNA was detected (Fig. 7H), consistent with posttranslational regulation via the proteasome. These data suggest that KBTBD2 may be modulated by diet-induced obesity.
Fig. 7.
Down-regulation of KBTBD2 during diet-induced obesity. (A–H) Male C57BL/6J mice were maintained on a control diet (10 kcal% fat; n = 3) or high-fat diet (60 kcal% fat; n = 3) for 16 wk, beginning at 6 wk of age. Experiments were conducted at 22 wk of age. (A) Body weight. (B) Normalized fat weight. (C) Blood glucose. (D) Serum insulin. Glucose and insulin were measured after a 6-h fast. (E) Insulin tolerance test. Blood glucose was measured at indicated times after i.p. insulin injection. The baseline blood glucose levels (0 min) were 154 ± 16 mg/dL in the mice fed the control diet and 211 ± 12 mg/dL in the mice fed the high-fat diet. (F) Transcript levels of Kbtbd2 (normalized to Actb) by RT-qPCR of RNA isolated from iWAT. (G) Immunoblots of iWAT lysates. (H) Transcript levels of Pik3r1 (normalized to Actb) by RT-qPCR of RNA isolated from iWAT. (I–K) Male Lepob/+ (ob/+) or Lepob/ob (ob/ob) littermates were maintained on the control diet (n = 3) or high-fat diet (n = 3) for 8 wk, beginning at 6 wk of age. Experiments were conducted at 14 wk of age. (I and J) Transcript levels of Kbtbd2 and Pik3r1 (normalized to Actb) by RT-qPCR of RNA isolated from iWAT. (K) Immunoblots of iWAT lysates. (L–N) Male Leprdb/+ (db/+; n = 3) and Leprdb/db (db/db; n = 3) littermates were maintained on standard chow from birth. Experiments were conducted at 16 wk of age. (L and M) Transcript levels of Kbtbd2 and Pik3r1 (normalized to Actb) by RT-qPCR of RNA isolated from iWAT. (N) Immunoblots of iWAT lysates. (O–Q) Male Mc4r−/− mice (n = 3) and WT mice (+/+; n = 3) were maintained on standard chow from birth. Experiments were conducted at 9 wk of age. (O and P) Transcript levels of Kbtbd2 and Pik3r1 (normalized to Actb) by RT-qPCR of RNA isolated from iWAT. (Q) Immunoblots of iWAT lysates. In A–D, data points represent individual mice. P values were determined by Student’s t test.
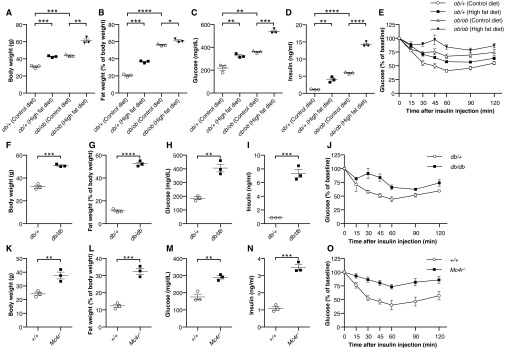
We also measured KBTBD2 and p85α expression in isolated adipocytes from several genetic mouse models of obesity. Leptin-deficient (Fig. S6 A–E), leptin receptor-deficient (Fig. S6 F–J), and melanocortin 4 receptor (Mc4r)-deficient mice (Fig. S6 K–O) fed a control diet or standard chow were hyperphagic and became obese, hyperglycemic, and insulin-resistant compared with control mice. However, KBTBD2 and p85α mRNA and protein expression levels in the mutants were similar to those in control mice (Fig. 7 I–Q). To determine whether a high-fat diet could induce suppression of KBTBD2 in the obese mutant mice, Lepob/ob (ob/ob) mice were fed a high-fat diet for 8 wk, after which the ob/ob mice were significantly more obese, hyperglycemic, and insulin-resistant than the ob/ob mice fed the control diet (Fig. S6 A–E). Nonetheless, KBTBD2 and p85α mRNA and protein levels were similar in the ob/ob mice fed the control diet and those fed a high-fat diet (Fig. 7 I–K). These data suggest that leptin receptor signaling is necessary for the regulation of KBTBD2 in diet-induced obesity.
Fig. S6.
Phenotypes of Lepob/ob, Leprdb/db, and Mc4r−/− mice. (A–E) Male Lepob/+ (ob/+) or Lepob/ob (ob/ob) littermates were maintained on the control diet (n = 3) or high-fat diet (n = 3) for 8 wk, beginning at 6 wk of age. Experiments were conducted at 14 wk of age. (F–J) Male Leprdb/+ (db/+; n = 3) and Leprdb/db (db/db; n = 3) littermates were maintained on standard chow from birth. Experiments were conducted at 16 wk of age. (K–O) Male Mc4r−/− mice (n = 3) and WT mice (+/+; n = 3) were maintained on standard chow from birth. Experiments were conducted at 9 wk of age. (A, F, and K) Body weight. (B, G, and L) Normalized fat weight. (C, H, and M) Blood glucose levels. (D, I, and N) Serum insulin levels. Glucose and insulin were measured after a 6-h fast. (E, J, and O) Insulin tolerance test. Blood glucose was measured at indicated times after i.p. insulin injection. Baseline blood glucose levels (0 min): control diet [ob/+, 218 ± 20 mg/dL; ob/ob, 361 ± 6 mg/dL]; high-fat diet [ob/+, 325 ± 10 mg/dL; ob/ob, 539 ± 12 mg/dL; db/+, 186 ± 11 mg/dL; db/db, 406 ± 28 mg/dL; Mc4r+/+, 176 ± 17 mg/dL; Mc4r−/−, 290 ± 10 mg/dL]. In A–D, F–I, and K–N, data points represent individual mice. P values were determined by Student’s t test.
Discussion
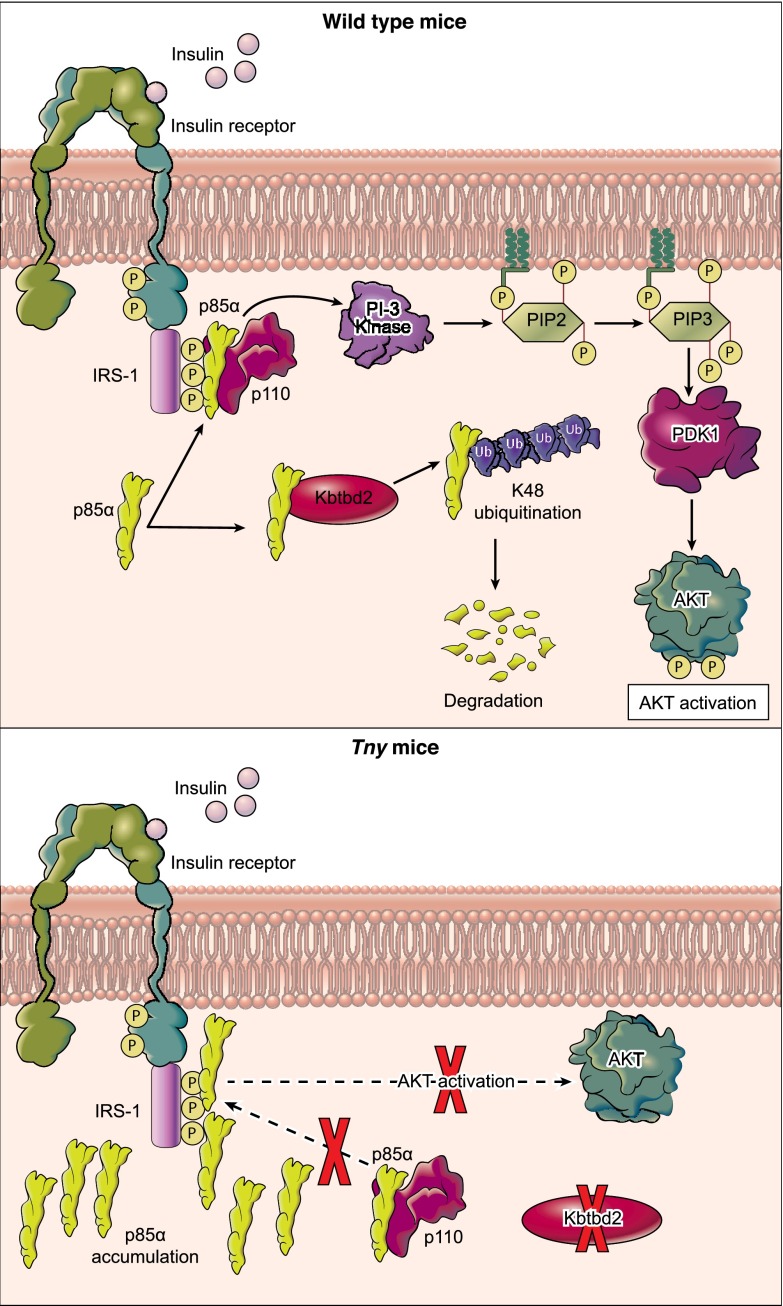
We have shown that KBTBD2 is a p85α-specific recognition subunit for the Cul3-based E3 Ub ligase complex, which regulates p85α protein abundance in vivo (Fig. 8). In particular, KBTBD2 binds exclusively to p110-free p85α, leading to its Ub-mediated degradation. Moreover, in KBTBD2-deficient tissue, excess p85α constitutively precludes the association of p110 with IRS1, resulting in impaired PI3K signaling in response to insulin. Our findings support a model (11–13) in which p110-free p85α competes with the p85α-p110 heterodimer for binding to tyrosine-phosphorylated IRS1 and thereby negatively regulates PI3K signaling. Indeed, a similar mechanism has been reported for the regulation of p85β, which is targeted to SCF Ub ligase complexes by the F-box protein FBXL2 (22). The control of specific p85 isoforms by distinct substrate recognition proteins of Ub ligase complexes suggests a mechanism by which the isoforms may be differentially regulated to carry out nonredundant functions in cells.
Fig. 8.
Regulation of p85α by KBTBD2 in WT and tny/tny mice. In WT mice, KBTBD2 regulates p85α protein abundance through degradation mediated by K48 ubiquitination. Insulin induces phosphorylated IRS-1 to recruit p85α-p110 heterodimers, leading to activation of PI3K catalytic activity and downstream signaling. In KBTBD2-deficient tny/tny mice, excess p85α constitutively precludes the association of p85-p110 heterodimers with phosphorylated IRS-1, resulting in impaired PI3K signaling in response to insulin.
It is not excluded that in addition to the insulin receptor, other receptors and pathways linked to activation of the p110 subunit of PI3K are affected by Kbtbd2 mutations. We note that tny/tny mice exhibited high levels of serum IGF1, indicative of elevated growth hormone (GH) secretion. IGF1 mediates many of the physiological effects of GH, and also acts as a negative feedback regulator of GH gene expression through the transcription factors POU1F1 and CBP (23–26). These effects occur through signaling primarily via IRS1/IRS2, PI3K, and Akt (26, 27). We hypothesize that IGF1 receptor signaling is also dependent on KBTBD2-induced degradation of p85α, the buildup of which disrupts PI3K signaling and leads to a form of dwarfism and an increase in GH secretion.
In humans, autosomal dominant mutations of PIK3R1, encoding p85α and the alternatively spliced isoforms p55α and p50α, cause SHORT syndrome (short stature, hyperextensibility of joints and/or inguinal hernia, ocular depression, Rieger anomaly, and teething delay), a condition also characterized by insulin resistance, lipodystrophy, and impaired PI3K signaling (28–30). The commonality of these latter phenotypes in KBTBD2-deficient mice and SHORT syndrome patients suggests that the human PIK3R1 mutations exert a dominant negative effect that mimics p85α overexpression. This hypothesis is supported by the autosomal dominant inheritance of reported SHORT syndrome mutations, and also by the observation of insulin hypersensitivity in mice lacking p85α (31–34). In its C-terminal half, p85α contains two SH2 domains separated by a coiled-coil inter-SH2 domain, which together bind p110 or tyrosine-phosphorylated IRS1. The positions of reported SHORT syndrome mutations within p85α SH2 domains or the inter-SH2 domain, but not elsewhere in the protein (28–30), suggest a mechanism in which the mutant p85α proteins may constitutively bind to IRS1, blocking insulin-induced WT p85α-p110 binding. Alternatively, mutant p85α may constitutively bind to p110 in the inhibitory conformation, blocking p110 catalytic activity. Our findings raise the possibility that mutations of KBTBD2 underlie SHORT syndrome in patients without PIK3R1 mutations.
Among the multiple isoforms of p85, p85α is the predominant isoform in insulin-sensitive tissues (11). p85α-deficient mice exhibit increased insulin signaling, enhanced insulin sensitivity, and hypoglycemia (31–34), whereas p85α overexpression has been reported to reduce PI3K signaling, leading to insulin resistance (35, 36). Consistent with these observations, KBTBD2-deficient mice accumulated p85α in adipose, liver, muscle, brain, and possibly other tissues and displayed insulin resistance, diabetes, and liver steatosis. p85α knockout entirely prevented all of these effects of KBTBD2 deficiency. Moreover, transplantation of WT adipose tissue into Kbtbd2−/− mice was sufficient to rescue the hyperglycemia and hepatic steatosis phenotypes of these animals, indicating that adipocytes alone are capable of managing the burden of glucose and lipid present in these animals, provided that they have normal insulin sensitivity.
We observed reduced KBTBD2 expression in adipocytes, and consequent elevated adipocyte p85α expression, during high-fat diet-induced obesity associated with insulin resistance and hyperglycemia. These data suggest that diet-induced obesity results in down-regulation of KBTBD2, which may contribute to the development of insulin resistance. Interestingly, no down-regulation of KBTBD2 expression was observed in obese insulin-resistant mice lacking leptin or melanocortin 4 receptor signaling, suggesting that the regulation of KBTBD2 by diet-induced obesity is leptin-dependent. Moreover, a KBTBD2-independent mechanism is apparently responsible for the development of insulin resistance and diabetes in ob/ob, db/db, and Mc4r−/− mice.
The strong evolutionary conservation of KBTBD2 in vertebrates suggests that it may fulfill a similar function in many vertebrate species, in which the need for multiple controls of insulin responsiveness may have developed as organisms increased in complexity from invertebrates. The KBTBD2 protein is 98.6% identical in humans and mice, and we hypothesize that KBTBD2 may regulate systemic insulin sensitivity by controlling the cytoplasmic concentration of p85α in adipose and other tissues in humans as in mice.
Materials and Methods
Mice.
C57BL/6J, Lepob, Leprdb, and Mc4r−/− mice were purchased from The Jackson Laboratory. The tny strain (C57BL/6J-Kbtbd2tny) was generated by ENU mutagenesis and is described at mutagenetix.utsouthwestern.edu. Kbtbd2−/− and Kbtbd2−/−; Pik3r1−/− double-knockout mice were generated in our laboratory using the CRISPR/Cas9 system as described previously (37) with the Kbtbd2 (5′-CCGCTGATTTGCATAAGGTT-3′) and Pik3r1 (5′-AGTCGTACAGTGCTCTGTAC-3′) small base-pairing guide RNA. Mice were maintained at the University of Texas Southwestern Medical Center and studies were performed in accordance with institutionally approved protocols. All experiments in this study were approved by the University of Texas Southwestern Medical Center Institutional Animal Care and Use Committee. All mice were fed standard chow (2016 Teklad Global 16% Protein Rodent Diet) except mice with diet-induced obesity, which were fed with control diet (10 kcal% fat; Research Diets) or high-fat diet (60 kcal% fat; Research Diets) from 6 wk of age.
Blood/Serum Chemistries, ELISA, and Insulin Stimulation.
Mice were fasted for 6 h (7:00 AM–1:00 PM) for glucose and insulin tests. Blood glucose was tested with the AlphaTRAK glucometer and test strips. ELISA kits were used to measure insulin (Crystal Chem), leptin (Crystal Chem), IGF1 (R&D Systems), and adiponection (B-Bridge) in the serum according to the manufacturer’s instructions. AST and ALT in the serum were tested using a Vitros 250 chemistry analyzer (Johnson & Johnson). HbA1c in the whole EDTA blood was measured with a mouse HbA1c assay kit (Crystal Chem). Triglyceride was measured with Infinity Triglycerides Reagent (Thermo Fisher Scientific). The insulin tolerance test was initiated by i.p. injection with human insulin (0.75 U/kg; Sigma-Aldrich) after a 6-h fast. For in vivo insulin stimulation (Fig. S1J), insulin or saline was injected i.p. at a dose of 1.5 U/kg body weight after a 6-h fast. Different tissues were collected at 30 min postinjection. For in vivo insulin stimulation (Fig. 6A), the mice were fasted for 6 h before surgery. After anesthetization, the skin was opened, and the left iWAT was quickly removed and then snap-frozen in liquid nitrogen. Then 10 U/kg insulin was injected into the portal vein. The iWAT on the right side was taken at 5–6 min after insulin stimulation and frozen in liquid nitrogen. These iWATs were lysed with Nonidet P-40 lysis buffer for IP.
Adipose Transplantation.
Transplantation of WT donor fat pads into Kbtbd2−/− mice was performed as described previously (38). Details are provided in SI Materials and Methods.
Immunohistochemistry and Immunostaining.
Samples for routine histology and special stainings were harvested from anesthetized mice and fixed according to standard procedures (39, 40) with modifications for tissue size and stains. Cell immunostaining was performed according to standard protocols. Details are provided in SI Materials and Methods.
Cell Culture, Transfection, MEF-Derived Adipocytes, Murine Primary Adipocytes, Human Adipocytes, and shRNA Knockdown.
The 293T cells were purchased from American Type Culture Collection (ATCC) and grown at 37 °C in DMEM (Life Technologies)/10% (vol/vol) FBS (Gibco)/antibiotics (Life Technologies) in 5% CO2. Transfection of plasmids was carried out using Lipofectamine 2000 (Life Technologies) according to the manufacturer’s instructions. Cells were harvested between 36 and 48 h posttransfection. MEF cells were isolated using standard protocols by trypsin (Gibco) digestion of minced E13.5 embryos. MEF cells were grown in DMEM/10% (vol/vol) FBS/antibiotics medium. For differentiation, 2-d postconfluent cells (day 0) were treated with grown medium containing 5 μg/mL insulin, 1 μM dexamethasone, 0.5 mM methylisobutylxanthine, and 0.5 μM rosiglitazone (all from Sigma-Aldrich). From day 2, MEF cells were maintained in medium containing 5 μg/mL insulin (Sigma-Aldrich) and 0.5 μM rosiglitazone (Sigma-Aldrich), which was changed every other day. MEF cells were fully differentiated and harvested at day 10. Isolation and separation of murine primary adipocytes and SVF cells from different adipose tissues (BAT, iWAT) was done as described previously (41). Primary s.c. preadipocytes were purchased from ATCC and grown in complete growth medium (ATCC). Knockdown of KBTBD2 in human preadipocytes by shRNA was mediated by lentivirus infection following standard protocols. Differentiation was initiated with 2-d postconfluent cells (day 0) with the Adipocyte Differentiation Toolkit for Preadipocytes (ATCC). Fully differentiated adipocytes were harvested at day 15.
Sample Preparation, IP, Ubiquitination, Ub Chain Assay, GST Pull-Down, and Western Blot Analysis.
Standard procedures were used for GST pull-down, Western blot analysis, and IP, with modifications for the ubiquitination assay. For two-step IP, anti-FLAG M2 affinity gel (Sigma-Aldrich) was used to purify 3×FLAG-p85α complex in the first-step IP (first IP). Beads from the first IP were eluted with 3×FLAG peptide (Sigma-Aldrich) and then mixed with anti-HA beads (Thermo Fisher Scientific) to purify the HA-Kbtbd2 complex in the second-step IP (second IP). The Ub chain assay was done with the UbiCREST Deubiquitinase Enzyme Kit (Boston Biochem). Further details are provided in SI Materials and Methods.
RNA Isolation, Reverse Transcription, and RT-qPCR.
Tissue samples were lysed in TRIzol (Invitrogen) for RNA isolation following a standard protocol, and 1 μg of RNA was used for reverse transcription by SuperScript III First-Strand Synthesis SuperMix. RT-qPCR was performed with ABI StepOnePlus with Powerup SYBR Green Master Mix (Life Technologies). The 2-ΔΔCt method was used for relative quantification. The following primer pairs were used: Kbtbd2, 5′-ATACCGAATATGCTGTGTCCT-3′ (forward), 5′-AACATGGCCCTGAAATAGGAG-3′ (reverse); Pik3r1, 5′-GACATCTCAAGGGAAGAAGTG-3′ (forward), 5′-TTAGTGTAAGAGTGTAATCGCC-3′ (reverse); Actb, 5′-CACCACACCTTCTACAATGAG-3′ (forward), 5′-GTCTCAAACATGATCTGGGTC-3′ (reverse).
Mass Spectrometry Analysis of Proteins in Adipose Tissues.
Here 100 μg of adipose lysates were loaded onto 12% (wt/vol) SDS/PAGE gel and run ∼1 cm into separation gel. The gel was stained with Coomassie blue, and whole stained lanes were subjected to semiquantitative mass spectrometry analysis (LC/MS/MS), as described in SI Materials and Methods.
Statistical Analyses.
Data represent mean ± SEM in all graphs depicting error bars. The statistical significance of differences between experimental groups was determined by Student’s t test using GraphPad Prism 6. *P ≤ 0.05; **P ≤ 0.01; ***P ≤ 0.001; ****P ≤ 0.0001; ns, not significant with P > 0.05.
SI Materials and Methods
Adipose Transplantation.
The hair in the abdominal and dorsal regions of mice was shaved before surgery. During surgery, recipient mice were anesthetized under isofluorane vapor [2–5% (vol/vol), 2% O2]. Donor fat pads were freshly isolated from mice euthanized by CO2 inhalation and cervical dislocation and placed into sterile PBS, then immediately loaded in a syringe through the plunger end. The injection was done immediately, to ensure a warm ischemia time of <10 min. iWATs from three 4-wk-old male C57BL/6J donor mice (six iWATs total) were transplanted into one 4-wk-old male recipient mouse. Multiple injections of donor fat pads were made s.c. with 16-gauge needles. Injection volume was kept between 100–150 μL per injection site. The injections were first made in the abdominal region and then, if needed, into the dorsal region. The injection sites were closed with tissue adhesive.
Immunohistochemisty and Immunostaining.
Samples for routine H&E were immersion-fixed for 48 h in 10% (vol/vol) neutral-buffered formalin and stored briefly in 50% (vol/vol) ethanol, and samples for ORO staining were fixed in methanol-free 4% (vol/vol) paraformaldehyde for 48 h before equilibration in 18% (wt/vol) sucrose. Subsequent paraffin processing and embedding (H&E) and cryoembedding (ORO) were carried out, and sections were cut on a rotary microtome and cryostat, respectively. The resulting sections were stained for routine histopathological evaluation by regressive H&E on a Sakura Finetek DRS-601 robotic staining system using Leica Selectech reagents (hematoxylin 560 and alcoholic eosin Y 515). Foamy and vacuolated histopathological lesions were differentially determined to consist of lipid accumulations by ORO staining, performed manually according to established protocols.
For immunostaining, 293T cells cultured in chambers were washed with PBS and fixed in freshly made 4% (vol/vol) formaldehyde in PBS buffer at room temperature for 10 min, then washed again with PBS, treated with PBST [PBS and 0.25% (vol/vol) Triton X-100] for permeabilization, and blocked with PBSA [PBS and 1% (wt/vol) BSA] for 15 min. Cells were incubated with primary antibody diluted in PBSA for 1 h at room temperature, then washed with PBS and incubated with secondary antibody diluted in PBSA for 30 min at room temperature, and finally mounted in mounting medium with DAPI (Life Technologies).
Sample Preparation, IP, Ubiquitination, Ub Chain Assay, GST Pull-Down, and Western Blot Analysis.
For direct Western blot analysis, cells were harvested in 1× NuPAGE LDS sample buffer (Life Technologies) with 2.5% (vol/vol) 2-mercaptoethanol (Sigma-Aldrich). Tissue proteins were isolated from standard TRIzol protocol as pellets and dissolved in denaturing buffer [1% (wt/vol) SDS, 50 mM Tris⋅Cl, pH 7.5, 0.5 mM EDTA, and 1 mM DTT]. The protein concentration was determined using the Pierce BCA Protein Assay Kit (Thermo Fisher Scientific). For regular IP, cells were lysed in Nonidet P-40 buffer [50 mM Tris⋅Cl, pH 8.0, 0.1 M NaCl, 10 mM sodium fluoride, 1 mM sodium vanadate, 1% (vol/vol) Nonidet P-40, 10% (vol/vol) glycerol, 1.5 mM EDTA, and Protease Inhibitor Mixture] for 30 min at 4 °C. For IP in the ubiquitination assay, cells were first lysed in denaturing buffer. After incubation for 5 min at 100 °C, the lysates were diluted 10-fold with Nonidet P-40 buffer. After centrifugation, lysates were incubated with indicated antibody-conjugated beads for 2 h at 4 °C. Beads were washed three times with 1 mL of Nonidet P-40 buffer and then boiled in 30 μL of 1× NuPAGE LDS sample buffer with 2.5% (vol/vol) 2-mercaptoethanol.
The Ub chain assay was performed with the UbiCREST Deubiquitinase Enzyme Kit (Boston Biochem). Ubiquitinated p85α was purified with anti-FLAG M2 affinity gel (Sigma-Aldrich) under the same conditions as for the ubiquitination assay. Purified ubiquitinated p85α beads were mixed with different deubiquitinating enzymes at 37 °C for 30 min. The supernatants of reactions were collected for immunoblotting to detect released Ub, and the beads were collected for immunoblotting to detect p85α.
GST fusion proteins were produced in Escherichia coli BL21 and purified with glutathione agarose beads (GE Healthcare). GST fusion protein-loaded beads were incubated with 3×FLAG-Kbtbd2 purified from 293T cells in GST pull-down lysis buffer [20 mM Tris⋅Cl, pH 8.0, 200 mM NaCl, 1 mM EDTA, 0.5% (vol/vol) Nonidet P-40, and PMSF] at 4 °C for 1 h. The beads were washed three times with lysis buffer, followed by Western blot analysis.
In a typical Western blot, samples were resolved by NuPAGE 4–12% (wt/vol) Bis-Tris gels (Thermo Fisher Scientific), transferred to NC membranes (Bio-Rad), blotted with the primary antibody at 4 °C overnight and the secondary antibody for 1 h at room temperature, and then visualized by chemiluminescent substrate (Thermo Fisher Scientific). The following primary antibodies were used in this study: mouse anti-HA, anti-FLAG, anti-Cul3 (Sigma-Aldrich), anti-V5 (Invitrogen), anti-K48 linkage (Millipore), rabbit anti-p85α, anti-p85β, anti-p110β, anti–p-Tyr, anti–IRS-1, anti-AKT, anti–p-AKTS473, anti–β-actin, anti-PPARγ, anti-CEBP/α, anti-FAS, anti-ACC (Cell Signaling Technology), and anti-Kbtbd2 (Abcam).
Mass Spectrometry Analysis of Proteins in Adipose Tissues.
Proteins in gel bands were reduced and alkylated with DTT and iodoacetamide (Sigma-Aldrich), then digested overnight with trypsin (Pierce). Following solid-phase extraction cleanup with Oasis HLB plates (Waters), the resulting peptides were reconstituted in 10 μL of 2% (vol/vol) acetonitrile (ACN) and 0.1% trifluoroacetic acid in water. Then 2 μL of this mixture was injected and analyzed by LC/MS/MS using an Orbitrap Elite mass spectrometer (Thermo Fisher Scientific) coupled to an Ultimate 3000 RSLC-Nano liquid chromatography system (Dionex). Samples were separated on a 75-μm-i.d., 50-cm Easy Spray column (Thermo Fisher Scientific) packed with 2-µ C18 beads, and eluted with a gradient from 1% to 28% buffer B over 60 min at a flow rate of 250 nL/min. Buffer A contained 2% (vol/vol) ACN and 0.1% formic acid in water, and buffer B contained 80% (vol/vol) ACN, 10% (vol/vol) trifluoroethanol, and 0.08% formic acid in water. The mass spectrometer was operated in positive ion mode with a source voltage of 2.4 kV, capillary temperature of 250 °C, and S-lens RF level at 60.0%. MS scans were acquired at 240,000 resolution, and up to 14 MS/MS spectra were obtained for each full spectrum acquired using collisionally induced dissociation for ions with charge ≥2.
Raw MS data files were converted to a peak list format and analyzed using the Central Proteomics Facilities Pipeline (CPFP), version 2.0.3 (42). Peptide identification was performed using the Tandem (43) and Open MS Search Algorithm (OMSSA) (44) search engines against the mouse protein database from Uniprot, with common contaminants and reversed decoy sequences appended (45). Fragment and precursor tolerances of 20 ppm and 0.5 Da were specified, and three missed cleavages were allowed. Carbamidomethylation of Cys was set as a fixed modification, with oxidation of Met set as a variable modification.
Supplementary Material
Acknowledgments
We thank Peter Jurek for expert assistance in preparing the figures; Zhe Chen for assistance with MRI; John Shelton, Dr. James A. Richardson, and the staff of the Molecular Pathology Core at the University of Texas Southwestern Medical Center for assistance with histology; and the staff of the Proteomics Core at the University of Texas Southwestern Medical Center for assistance with mass spectrometry. This work was supported by generous donations from the Lyda Hill Foundation and the Kent and JoAnn Foster Family Foundation, and by NIH Grants P01 AI070167 and U19 AI100627.
Footnotes
The authors declare no conflict of interest.
This article contains supporting information online at www.pnas.org/lookup/suppl/doi:10.1073/pnas.1614467113/-/DCSupplemental.
References
- 1.Leney SE, Tavaré JM. The molecular basis of insulin-stimulated glucose uptake: Signalling, trafficking and potential drug targets. J Endocrinol. 2009;203(1):1–18. doi: 10.1677/JOE-09-0037. [DOI] [PubMed] [Google Scholar]
- 2.Saltiel AR, Kahn CR. Insulin signalling and the regulation of glucose and lipid metabolism. Nature. 2001;414(6865):799–806. doi: 10.1038/414799a. [DOI] [PubMed] [Google Scholar]
- 3.Fritsch R, Downward J. SnapShot: Class I PI3K isoform signaling. Cell. 2013;154(4):940–940.e1. doi: 10.1016/j.cell.2013.07.045. [DOI] [PubMed] [Google Scholar]
- 4.Burke JE, et al. Dynamics of the phosphoinositide 3-kinase p110δ interaction with p85α and membranes reveals aspects of regulation distinct from p110α. Structure. 2011;19(8):1127–1137. doi: 10.1016/j.str.2011.06.003. [DOI] [PMC free article] [PubMed] [Google Scholar]
- 5.Wu H, et al. Regulation of class IA PI 3-kinases: C2 domain-iSH2 domain contacts inhibit p85/p110alpha and are disrupted in oncogenic p85 mutants. Proc Natl Acad Sci USA. 2009;106(48):20258–20263. doi: 10.1073/pnas.0902369106. [DOI] [PMC free article] [PubMed] [Google Scholar]
- 6.Yu J, Wjasow C, Backer JM. Regulation of the p85/p110alpha phosphatidylinositol 3′-kinase: Distinct roles for the n-terminal and c-terminal SH2 domains. J Biol Chem. 1998;273(46):30199–30203. doi: 10.1074/jbc.273.46.30199. [DOI] [PubMed] [Google Scholar]
- 7.Yu J, et al. Regulation of the p85/p110 phosphatidylinositol 3′-kinase: Stabilization and inhibition of the p110alpha catalytic subunit by the p85 regulatory subunit. Mol Cell Biol. 1998;18(3):1379–1387. doi: 10.1128/mcb.18.3.1379. [DOI] [PMC free article] [PubMed] [Google Scholar]
- 8.Zhang X, et al. Structure of lipid kinase p110β/p85β elucidates an unusual SH2 domain-mediated inhibitory mechanism. Mol Cell. 2011;41(5):567–578. doi: 10.1016/j.molcel.2011.01.026. [DOI] [PMC free article] [PubMed] [Google Scholar]
- 9.Carpenter CL, et al. Phosphoinositide 3-kinase is activated by phosphopeptides that bind to the SH2 domains of the 85-kDa subunit. J Biol Chem. 1993;268(13):9478–9483. [PubMed] [Google Scholar]
- 10.Rordorf-Nikolic T, Van Horn DJ, Chen D, White MF, Backer JM. Regulation of phosphatidylinositol 3′-kinase by tyrosyl phosphoproteins: Full activation requires occupancy of both SH2 domains in the 85-kDa regulatory subunit. J Biol Chem. 1995;270(8):3662–3666. doi: 10.1074/jbc.270.8.3662. [DOI] [PubMed] [Google Scholar]
- 11.Ueki K, et al. Molecular balance between the regulatory and catalytic subunits of phosphoinositide 3-kinase regulates cell signaling and survival. Mol Cell Biol. 2002;22(3):965–977. doi: 10.1128/MCB.22.3.965-977.2002. [DOI] [PMC free article] [PubMed] [Google Scholar]
- 12.Ueki K, et al. Positive and negative roles of p85 alpha and p85 beta regulatory subunits of phosphoinositide 3-kinase in insulin signaling. J Biol Chem. 2003;278(48):48453–48466. doi: 10.1074/jbc.M305602200. [DOI] [PubMed] [Google Scholar]
- 13.Luo J, Field SJ, Lee JY, Engelman JA, Cantley LC. The p85 regulatory subunit of phosphoinositide 3-kinase down-regulates IRS-1 signaling via the formation of a sequestration complex. J Cell Biol. 2005;170(3):455–464. doi: 10.1083/jcb.200503088. [DOI] [PMC free article] [PubMed] [Google Scholar]
- 14.Wang T, et al. Real-time resolution of point mutations that cause phenovariance in mice. Proc Natl Acad Sci USA. 2015;112(5):E440–E449. doi: 10.1073/pnas.1423216112. [DOI] [PMC free article] [PubMed] [Google Scholar]
- 15.Borén J, Taskinen MR, Olofsson SO, Levin M. Ectopic lipid storage and insulin resistance: A harmful relationship. J Intern Med. 2013;274(1):25–40. doi: 10.1111/joim.12071. [DOI] [PubMed] [Google Scholar]
- 16.Stogios PJ, Privé GG. The BACK domain in BTB-kelch proteins. Trends Biochem Sci. 2004;29(12):634–637. doi: 10.1016/j.tibs.2004.10.003. [DOI] [PubMed] [Google Scholar]
- 17.Ruan J, et al. TreeFam: 2008 update. Nucleic Acids Res. 2008;36(Database issue):D735–D740. doi: 10.1093/nar/gkm1005. [DOI] [PMC free article] [PubMed] [Google Scholar]
- 18.NCBI Resource Coordinators Database resources of the National Center for Biotechnology Information. Nucleic Acids Res. 2016;44(D1):D7–D19. doi: 10.1093/nar/gkv1290. [DOI] [PMC free article] [PubMed] [Google Scholar]
- 19.Furukawa M, He YJ, Borchers C, Xiong Y. Targeting of protein ubiquitination by BTB-Cullin 3-Roc1 ubiquitin ligases. Nat Cell Biol. 2003;5(11):1001–1007. doi: 10.1038/ncb1056. [DOI] [PubMed] [Google Scholar]
- 20.Cooper MS, Seibel MJ, Zhou H. Glucocorticoids, bone and energy metabolism. Bone. 2016;82:64–68. doi: 10.1016/j.bone.2015.05.038. [DOI] [PubMed] [Google Scholar]
- 21.Qatanani M, Lazar MA. Mechanisms of obesity-associated insulin resistance: Many choices on the menu. Genes Dev. 2007;21(12):1443–1455. doi: 10.1101/gad.1550907. [DOI] [PubMed] [Google Scholar]
- 22.Kuchay S, et al. FBXL2- and PTPL1-mediated degradation of p110-free p85β regulatory subunit controls the PI(3)K signalling cascade. Nat Cell Biol. 2013;15(5):472–480. doi: 10.1038/ncb2731. [DOI] [PMC free article] [PubMed] [Google Scholar]
- 23.Bodner M, et al. The pituitary-specific transcription factor GHF-1 is a homeobox-containing protein. Cell. 1988;55(3):505–518. doi: 10.1016/0092-8674(88)90037-2. [DOI] [PubMed] [Google Scholar]
- 24.Cohen LE, Hashimoto Y, Zanger K, Wondisford F, Radovick S. CREB-independent regulation by CBP is a novel mechanism of human growth hormone gene expression. J Clin Invest. 1999;104(8):1123–1130. doi: 10.1172/JCI7308. [DOI] [PMC free article] [PubMed] [Google Scholar]
- 25.Kishimoto M, et al. Novel function of the transactivation domain of a pituitary-specific transcription factor, Pit-1. J Biol Chem. 2002;277(47):45141–45148. doi: 10.1074/jbc.M202991200. [DOI] [PubMed] [Google Scholar]
- 26.Romero CJ, et al. Insulin-like growth factor 1 mediates negative feedback to somatotroph GH expression via POU1F1/CREB binding protein interactions. Mol Cell Biol. 2012;32(21):4258–4269. doi: 10.1128/MCB.00171-12. [DOI] [PMC free article] [PubMed] [Google Scholar]
- 27.Bondy CA, Cheng CM. Signaling by insulin-like growth factor 1 in brain. Eur J Pharmacol. 2004;490(1-3):25–31. doi: 10.1016/j.ejphar.2004.02.042. [DOI] [PubMed] [Google Scholar]
- 28.Thauvin-Robinet C, et al. PIK3R1 mutations cause syndromic insulin resistance with lipoatrophy. Am J Hum Genet. 2013;93(1):141–149. doi: 10.1016/j.ajhg.2013.05.019. [DOI] [PMC free article] [PubMed] [Google Scholar]
- 29.Dyment DA, et al. FORGE Canada Consortium Mutations in PIK3R1 cause SHORT syndrome. Am J Hum Genet. 2013;93(1):158–166. doi: 10.1016/j.ajhg.2013.06.005. [DOI] [PMC free article] [PubMed] [Google Scholar]
- 30.Chudasama KK, et al. SHORT syndrome with partial lipodystrophy due to impaired phosphatidylinositol 3 kinase signaling. Am J Hum Genet. 2013;93(1):150–157. doi: 10.1016/j.ajhg.2013.05.023. [DOI] [PMC free article] [PubMed] [Google Scholar]
- 31.Chen D, et al. p50alpha/p55alpha phosphoinositide 3-kinase knockout mice exhibit enhanced insulin sensitivity. Mol Cell Biol. 2004;24(1):320–329. doi: 10.1128/MCB.24.1.320-329.2004. [DOI] [PMC free article] [PubMed] [Google Scholar]
- 32.Fruman DA, et al. Hypoglycaemia, liver necrosis and perinatal death in mice lacking all isoforms of phosphoinositide 3-kinase p85 alpha. Nat Genet. 2000;26(3):379–382. doi: 10.1038/81715. [DOI] [PubMed] [Google Scholar]
- 33.Mauvais-Jarvis F, et al. Reduced expression of the murine p85alpha subunit of phosphoinositide 3-kinase improves insulin signaling and ameliorates diabetes. J Clin Invest. 2002;109(1):141–149. doi: 10.1172/JCI13305. [DOI] [PMC free article] [PubMed] [Google Scholar]
- 34.Terauchi Y, et al. Increased insulin sensitivity and hypoglycaemia in mice lacking the p85 alpha subunit of phosphoinositide 3-kinase. Nat Genet. 1999;21(2):230–235. doi: 10.1038/6023. [DOI] [PubMed] [Google Scholar]
- 35.Barbour LA, et al. Human placental growth hormone increases expression of the p85 regulatory unit of phosphatidylinositol 3-kinase and triggers severe insulin resistance in skeletal muscle. Endocrinology. 2004;145(3):1144–1150. doi: 10.1210/en.2003-1297. [DOI] [PubMed] [Google Scholar]
- 36.Ueki K, Algenstaedt P, Mauvais-Jarvis F, Kahn CR. Positive and negative regulation of phosphoinositide 3-kinase–dependent signaling pathways by three different gene products of the p85alpha regulatory subunit. Mol Cell Biol. 2000;20(21):8035–8046. doi: 10.1128/mcb.20.21.8035-8046.2000. [DOI] [PMC free article] [PubMed] [Google Scholar]
- 37.Ran FA, et al. Genome engineering using the CRISPR-Cas9 system. Nat Protoc. 2013;8(11):2281–2308. doi: 10.1038/nprot.2013.143. [DOI] [PMC free article] [PubMed] [Google Scholar]
- 38.Klebanov S, Astle CM, DeSimone O, Ablamunits V, Harrison DE. Adipose tissue transplantation protects ob/ob mice from obesity, normalizes insulin sensitivity, and restores fertility. J Endocrinol. 2005;186(1):203–211. doi: 10.1677/joe.1.06150. [DOI] [PubMed] [Google Scholar]
- 39.Sheehan DC, Hrapchak BB. Theory and Practice of Histotechnology. Ed 2 Battelle Press; Columbus, OH: 1980. [Google Scholar]
- 40.Woods AE, Ellis RC. Laboratory Histopathology: A Complete Reference. Churchill Livingstone; London: 1996. [Google Scholar]
- 41.Viswanadha S, Londos C. Determination of lipolysis in isolated primary adipocytes. Methods Mol Biol. 2008;456:299–306. doi: 10.1007/978-1-59745-245-8_22. [DOI] [PubMed] [Google Scholar]
- 42.Trudgian DC, Mirzaei H. Cloud CPFP: A shotgun proteomics data analysis pipeline using cloud and high performance computing. J Proteome Res. 2012;11(12):6282–6290. doi: 10.1021/pr300694b. [DOI] [PubMed] [Google Scholar]
- 43.Craig R, Beavis RC. TANDEM: Matching proteins with tandem mass spectra. Bioinformatics. 2004;20(9):1466–1467. doi: 10.1093/bioinformatics/bth092. [DOI] [PubMed] [Google Scholar]
- 44.Geer LY, et al. Open mass spectrometry search algorithm. J Proteome Res. 2004;3(5):958–964. doi: 10.1021/pr0499491. [DOI] [PubMed] [Google Scholar]
- 45.Elias JE, Gygi SP. Target-decoy search strategy for increased confidence in large-scale protein identifications by mass spectrometry. Nat Methods. 2007;4(3):207–214. doi: 10.1038/nmeth1019. [DOI] [PubMed] [Google Scholar]
Associated Data
This section collects any data citations, data availability statements, or supplementary materials included in this article.


