

Introduction
Similar to other allergic diseases, the prevalence of food allergy has been increasing for the last several decades.1,2 While the cause for this increase in food allergy has not yet been elucidated, an interaction between genetic and environmental factors including the timing and route of allergen exposure has been implicated.3-7 Sensitization, or presence of allergic antibody, is a prerequisite for development of an allergic response to an allergen. Patterns of sensitization to environmental and food allergens have previously been studied in children in an effort to better understand allergy development. Notably, differences in biologic sex have been observed with a higher prevalence of sensitization in boys though this finding has not been shown to be consistent in all age ranges.8,9
Previous studies have assessed patterns of allergen sensitization in adults and differences in biologic sex among families. In the United States, the prevalence of allergen sensitization in the adult population has previously been estimated using the National Health and Nutrition Examination Survey (NHANES). NHANES 2005-2006 measured serum specific IgE (sIgE) concentrations to multiple food and environmental allergens. Subjects were tested to 15 inhalant allergens and 4 food allergens (egg, milk, peanut and shrimp). Nearly half (44.6%) of those surveyed had sIgE to at least 1 of the 19 allergens tested, highlighting a high prevalence of allergen sensitization in the United States.9 High prevalence has been reported in other nations as well. A European multi-country survey of adults ages 20-54 found a high prevalence of sIgE to foods (range 6.6% to 23.6%).10 In this study, higher prevalence of sensitization was specifically noted to food allergens that are related to pollen allergens such as apple (6.5%), peach (7.9%) and hazel nut (9.3%).10
Our family-based population study of food-allergic children and their parents provided a unique opportunity to assess sensitization to foods and aeroallergens in an atopic population. Previously this cohort was used to investigate familial aggregation of food allergy. Significant positive associations between parents and offspring were observed for total IgE and sIgE to all the examined food allergens and aeroallergens. An estimated heritability for food-specific IgE ranged from 0.15 to 0.35 and for aeroallegens from 0.24 to 0.38.11 Our objective was to use this population of parents of food-allergic children to investigate patterns of food and aeroallergen sensitization and biologic sex differences in sensitization.
Methods
Study population and data collection
This study was part of a family-based food allergy study in Chicago, IL. Local families were recruited from both hospital clinics and the community setting from August 2005 through May 2008. Eligible families had 1 index child (0 to 21) with any food allergy and 2 or more family members (biological parents and/or siblings). Clinical criteria for food allergy in the child were met if positive tests (specific IgE or skin test to that food) corroborated typical symptoms of an allergic reaction to a food with onset within 2 hours of ingestion. A positive test or sensitization to a food was defined as either a positive ImmunoCAP or a positive skin prick test. Symptoms included any one of the following: skin (hives or angioedema); respiratory tract (difficulty breathing, shortness of breath, repetitive coughing, wheezing, or chest tightness); oropharyngeal (throat tightness, choking, or difficulty swallowing; tongue swelling); cardiovascular (fainting, dizziness, light-headedness, or decreased level of consciousness); or gastrointestinal (vomiting).12 (ref Kumar paper) Parents of children with chronic health conditions other than asthma, eczema, or allergic rhinitis in the index child were excluded. Information regarding home environment, history of atopic diseases and food allergy of each family member was collected via questionnaire-based self-report. Skin prick testing was performed. Venous blood samples were obtained from each participating family member. Allergen sensitization was defined as having sIgE > 0.35 kUA/L or a positive skin test. The Institutional Review Board (IRB) of the former Children's Memorial Hospital (now the Ann & Robert H. Lurie Children's Hospital of Chicago) approved the study. All participating adults and children over 12 years of age provided written informed consent or assent as per IRB guidelines prior to entry.
Total and specific IgE measurement
Total serum IgE, sIgE for 9 food allergens (egg white, sesame, peanut, soy, milk, shrimp, walnut, cod fish, and wheat) and for 6 perennial environmental allergens (cat dander, dog dander, cockroach, Dermatophagoides pteronyssinus, Dermatophagoides farinae and Alternaria alternata) were measured for each subject using Phadia ImmunoCAP. Total serum IgE was reported in a range from 2.0 to 5,000 kU/L. sIgE was reported as a value from 0.1 to 100 kUA/L, with >0.35 kUA/L considered positive. All total and sIgE assays were performed by the Clinical Immunology Laboratory at Children's Memorial Hospital. Quality control and recalibration for the assays were performed as previously published.11 Allergen sensitization was defined as having sIgE > 0.35 kUA/L or a positive skin test.
Skin prick testing
Skin prick tests were performed on participants using the Multitest II device (Lincoln Diagnostics) to 9 food allergens (cow milk, soy, egg white, wheat, fish mix [cod, flounder, halibut, mackerel, tuna], shellfish mix [clam, crab, oyster, scallops, shrimp], peanut, sesame, and English walnut) and to 5 perennial environmental allergens (cat hair, dog epithelia, cockroach mix [American and German cockroach], house dust mite mix [equal parts mixture of D. farinae and D. pteronyssinus] and Alternaria alternata). Any skin test with a mean wheal diameter at least 3 mm greater than the saline control was considered positive. Histamine was used as a positive control.
Statistical Analysis
We compared the sensitization rates in our population of adults for 4 food allergens with publically available NHANES 2005-2006 sensitization data using one-sample binomial tests for the matching sex and age groups. Chi-square tests or Fisher's exact tests with a significance level of 0.05 were performed to compare the sensitization rates to each individual allergen between mothers and fathers. A pairwise analysis was also performed. Chi-square tests were used to compare parents who self-reported food allergy with those who did not self-report food allergy. Finally, we looked at the potential predictors of self-report of food allergy in fathers and mothers by fitting two separate logistic regression models. All statistical analyses were performed using SAS 9.3 (SAS Institute, Cary NC), IBM SPSS Statistics, version 22 (SPSS Inc., Chicago IL) and GraphPad Prism version 6.03 (GraphPad Software Inc., San Diego, CA).
Results
Full data was available for 1252 mothers and 1225 fathers of food-allergic children. Demographic information for the population is provided in Table 1. 13.7% of all parents reported current food allergy with 3.6% reporting allergy to shellfish, 2.1% to milk, 2.1% to peanut, 2.1% to tree nuts, 1.4% to fish, 1.1% to egg, 1.0% to soy, 0.9% to wheat and 0.3% to sesame. Two-thirds of adults (66.1%) were sensitized to either a food or aeroallergen. Table 2 shows the prevalence of allergen sensitization (positive skin prick test or sIgE >0.35) for mothers and fathers. 14.5% of mothers and 12.7% of fathers reported current food allergy. For mothers and fathers combined, the prevalence of sensitization to peanut (15.1%) and sesame (14.4%) were substantially higher than milk (4.4%), egg (3.3%) and fish (1.2%). In their children, the most prevalent allergen was peanut (37.3%) followed by milk (29%) and egg (22.1%).
Table I. Demographics.
| Mother (N=1252) | Father (N=1225) | p-value | ||
|---|---|---|---|---|
|
| ||||
| Age | Mean (Std) | 38.0 (5.6) | 39.6 (5.9) | NA |
|
| ||||
| Race (%) | ||||
| Black | 3.5 | 4.3 | ||
| White | 85.6 | 86.3 | ||
| Asian | 6.2 | 5.6 | ||
| American Indian | 0.2 | 0 | ||
| Native Hawaiian | 0.2 | 0.3 | ||
| ore than one race | 2.3 | 2.1 | ||
| Unknown | 2.2 | 1.6 | NA | |
|
| ||||
| Hispanic/Latino (%) | 6.9 | 5.2 | NA | |
|
| ||||
| Annual Household Income (%) | ||||
| < $30K | 4.5 | |||
| $30-60K | 8.0 | |||
| $60-100K | 26.4 | |||
| $100K | 57.8 | |||
| Unknown | 3.3 | NA | ||
|
| ||||
| Education (highest level) (%) | ||||
| Elementary School | 0 | 0.1 | ||
| Some Secondary School | 0.6 | 0.6 | ||
| High School graduate or GED | 3.7 | 6.0 | ||
| Some College | 11.0 | 10.4 | ||
| College Degree | 48.6 | 44.2 | ||
| Graduate School Degree | 28.3 | 27.2 | ||
| Post Graduate | 7.8 | 11.6 | NA | |
|
| ||||
| Comorbid Asthma (%) | 15.1 | 14.2 | 0.55 | |
|
| ||||
| Eczema (%) | 19.1 | 14.3 | 0.01 | |
|
| ||||
| Environmental Allergy (%) | 41.2 | 35.1 | <0.01 | |
|
| ||||
| Self-report of current FA (%) | 14.5 | 12.7 | 0.21 | |
|
| ||||
| Self-report of outgrown FA (%) | 6.9 | 4.7 | 0.03 | |
|
| ||||
| MD diagnosis of FA (%) | 13.3 | 8.9 | <0.01 | |
|
| ||||
| Log10 Total IgE Median (Std) | 1.5 (0.6) | 1.7 (0.6) | <0.01 | |
p-values represent significant differences between mothers and fathers
Abbreviations: NA, not applicable; Std, standard deviation; FA, food allergy
Table II. Percent prevalence of sensitization to food and aeroallergens in mothers and fathers.
| Mother (N=1224) | Father (N=1071) | p-value | |
|---|---|---|---|
| Any food | 27.9 | 36.8 | <0.01 |
| Any aeroallergen | 57.7 | 67 | <0.01 |
| Milk | 3.7 | 5.2 | 0.07 |
| Egg | 2.7 | 3.9 | 0.1 |
| Peanut | 11.8 | 19.0 | <0.01 |
| Walnut | 6.5 | 11.8 | <0.01 |
| Fish | 0.8 | 1.6 | 0.09 |
| Shellfish | 9.0 | 12.6 | <0.01 |
| Wheat | 5.7 | 12.0 | <0.01 |
| Soy | 6.9 | 14.0 | <0.01 |
| Sesame | 10.0 | 19.3 | <0.01 |
| Dust mite | 36.1 | 44.3 | <0.01 |
| Cockroach | 8.7 | 16.5 | <0.01 |
| Dog | 22 | 21.8 | 0.98 |
| Cat | 34 | 34.4 | 0.88 |
| Alternaria Alternata | 24.5 | 32.5 | <0.01 |
p-values represent significant differences between mothers and fathers
Of the parents who self-reported food allergy, only 28.4 % had sensitization to the food allergen in question. The percentage of parents who reported a food allergy and who were sensitized to that food ranged from 10.7% for fish to 55.6% for peanut. We assessed the proportion of adults with sensitization (a positive skin test or sIgE >0.35) who reported food allergy to the food in question. For skin prick testing, this ranged from 11.8% for egg to 33.3% to fish and for positive sIgE from 21.7% for egg to 72.7% for fish (eTable 1). For comparison purposes, the correlation between testing results and food allergy report in the child cohort is presented in eTable 2. Notably, the proportion of children meeting stringent or probable criteria for food allergy by history with sensitization to that food was higher for milk, egg, wheat, shrimp, peanut, and walnut.
Figure 1 shows the distribution of log transformed geometric mean food sIgE concentrations. The mean sIgEs were low. The lowest mean sensitization in mothers was to cod fish (0.65kUa/L) and the highest mean was to peanut (1.31 kUa/L,). In fathers, the lowest mean sensitization was to soy (0.73 kUa/L) and the highest mean was to shrimp (1.20 kUa/L).
Figure 1. Distribution of Mean Food sIgE Concentrations in Father and Mothers.

Standard chi-squared tests were performed to compare the prevalence of sensitization to each specific allergen between mothers and fathers in our cohort (Table 2). Pairwise analyses were also performed for each set of parents to control for possible household/environmental confounders. No significant differences were found between the pairwise analyses and the analysis reported in Table 2.
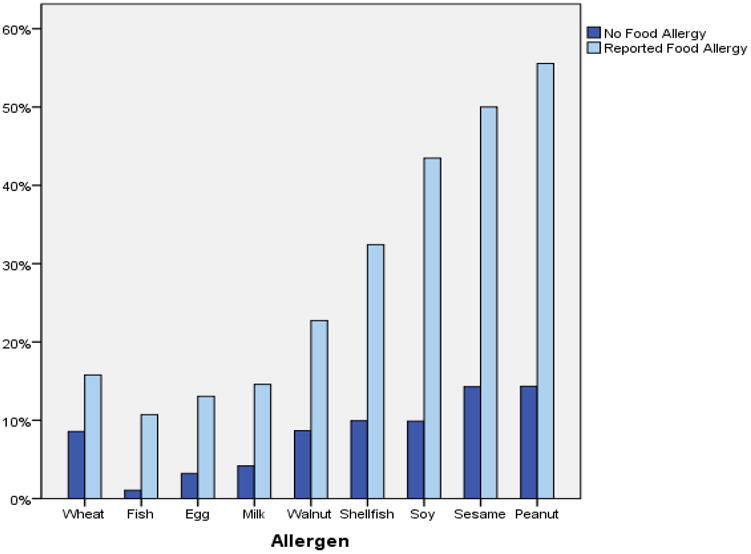
Environmental sensitization was common in this cohort. Sensitization to dust mites and cats had the highest prevalence. Mothers and fathers who self-reported food allergy had significantly higher reports of asthma and environmental allergies compared to those who did not self-report food allergy (p <0.01). These parents also had higher rates of sensitization to any food or environmental allergen (p < 0.01). Figure 2 shows prevalence rates of sensitization by food allergen in parents who self-reported food allergy as compared to parents whom did not self-report food allergy.
Figure 2. Prevalence of sensitization among parents with or without self-reported allergy to a food.
We next compared our food sensitization data to the NHANES 2005-2006 sensitization data available for 1154 males and females aged 30-39. The mean age in our cohort was 37.9 years. For the 4 food allergens that were tested in both populations (peanut, shrimp, milk and egg), our cohort had a significantly higher prevalence of food sensitization (sIgE ≥0.35) to all four foods (Table 3).
Table III. Sensitization in the Chicago Food Allergy Study as compared to NHANES 2005-2006.
| Peanut | Shrimp | Milk | Egg | |
|---|---|---|---|---|
| NHANES percent sensitization | 7.2 | 5.4 | 2.6 | 2.1 |
| Chicago FA STUDY percent sensitization | 8.89 | 9.07 | 3.73 | 2.58 |
| p-value | <0.01 | <0.01 | <0.01 | <0.01 |
Abbreviations: NHANES, National Health and Nutrition Examination Survey; FA, food allergy
Logistic regression analysis of predictors of self-reported food allergy to any food revealed a statistically significant positive association in fathers with self-report of asthma (OR = 1.73 [CI 1.04-2.89], P=0.04), environmental allergy (OR 2.16 [CI 1.40-3.33] P=0.001) and eczema (OR 1.94 [1.20-3.14] P=0.01). For mothers, statistically significant positive associations between self-report of food allergy were found with self-report of environmental allergy (OR 3.23 [CI 2.17-4.79] P<0.0001) and having more than 1 child with food allergy (OR 1.54 [CI 1.09-2.18] P=0.01). Maternal self-report of asthma showed a trend towards significance (OR 1.51 (0.97-2.34) P=0.07) as did self-report of eczema (OR 1.46 [CI 0.97-2.20] P=0.07). The other variables evaluated in the logistic regression were not significant and included age, race, ethnicity and education level. Prior history of asthma, eczema and food allergy were also not associated with increased self-report of food allergy in either mothers or fathers.
Discussion
It is well known that atopy has a strong hereditary component. 13,14 A population based survey of 3800 Finnish children and their biologic parents found a strong association between parental allergies and positive food allergy testing in their children with the incidence of positive testing being two-fold higher if any allergy was reported in either parent and threefold higher if allergic conditions were reported in both parents.14 In this cohort, we conversely assessed prevalence of allergy self-report and sensitization to foods and aeroallergens by skin prick and sIgE testing in parents of food-allergic children.
This paper examines sensitization in parents of food-allergic children from a unique perspective. Previous studies have focused solely on the general adult population and have not looked at sensitization in a selectively atopic cohort. 9,10 As one might expect, levels of sensitization in parents of food-allergic children are higher than in the general US population.9 However, even though there are statistically significant differences in specific allergen sensitizations between our study population and NHANES data, these actual differences are more modest than one might expect if food allergy is highly determined by genetics. There is also a high rate of self-reported food allergies, asthma, eczema and rhinitis in this cohort compared to the general population. 15-17 However, when we look closely at the levels of sIgE in parents who report allergy they are very low and clinical reactivity seems unlikely based upon pediatric studies of sIgE concentration and oral food challenge outcome.18,19 This certainly brings into question the reliabilty of self-report of allergy.
Adult data regarding correlation of sIgE and clinical outcomes are lacking. Less than 20% of parents who reported allergy to wheat, fish, egg or milk had positive skin testing or positive sIgE to the food in question. The highest correlation between report of food allergy and sensitization was to peanut, yet even in this group sensitization was noted for only 55.6 % of those reporting peanut allergy. This high rate of reported food allergy without sensitization may be considered surprising given the knowledge of IgE-mediated food allergy one would expect these families to have. We speculate that increased awareness of food allergy may actually result in increased reporting. Alternatively, it is possible that some adults were labeled as allergic when young and did not seek re-evaluation. Of parents who reported no food allergy, 14% had evidence of sensitization to peanut, 14 % to sesame, 10% to soy and 10% to shellfish. As has been previously illustrated, self-report of food allergy and/or sensitization is not diagnostic of food allergy prevalence.20 Oral food challenges remain the gold standard to confirm or refute the diagnosis.
The highest concordance between reported allergy and sensitization was noted for peanut, sesame and soy. High rates of sensitization to soy and peanut are consistent with other studies demonstrating high prevalence of sensitization to plant-related allergens.9,21-23 Though cross reactivity with homologous pollen allergens likely plays a role in the high sensitization to peanut and soy allergens, we unfortunately do not have either specific pollen sensitization or protein component specific IgE data in our cohort to confirm or refute this. Though sesame has not been reported to have cross reactivity with pollens, two sesame allergens (Ses i 2 and Ses i 3) belong to the family of seed storage proteins and share homology with peanut and soybean allergens. 24 This may explain the high prevalence of sesame sensitization seen in this cohort. Sesame has also been noted in a European adult prevalence study to be the most common IgE sensitization in the class of “true” food allergens that do not cross react with pollen allergens, so our finding of higher sensitization to this allergen is not unique and may deserve further study. 10
Interestingly, differences were noted between mothers and fathers. While more mothers reported a physician diagnosis of food allergy (13.3% as compared to 8.9% of fathers), fathers had more sensitization to environmental allergens and more food sensitization to peanut, walnut, shellfish, wheat, soy and sesame (p<0.01). It is possible that the higher prevalence of atopic diseases among mothers reflects some selection bias rather than an actual higher prevalence as mothers with atopy may be more likely to enroll their children in such a study as this one. The relationship between biologic sex and food allergy throughout life has not been as well characterized as that in childhood. A PubMed database search looking at sex disparity in food allergy previously noted most reporting of food allergy in adults to be done by women (34.82% of men and 65.18% of women older than 18, a male to female ratio of 0.53).25 The authors noted an appearance of sex reversal in food allergies at puberty and an attenuation of sex differences near menopause suggesting a role for hormones in these differences.25 It is important to distinguish between biologic differences between males and females (sex) versus the social, cultural, and/or psychological traits typically associated with one sex (gender). Other authors have proposed that gender rather than biologic sex differences contribute to how individuals process information including in reporting of quality of life measures and in self-efficacy as related to food allergy. 26 Future studies of food allergy in the adult population, especially relying on self-report, should take the impact of gender on perception and reporting of symptoms into account.
The major limitations of this study include the use of self-report not only of food allergy but also of other atopic conditions. In addition the report of physician diagnosis carries its own issues unless appropriate testing including double blind food challenges have been performed. There is likely bias in our very high prevalence rates of atopy. It would have been advantageous to have objective evidence of food allergy (i.e. oral food challenge results) as it is well known that rates of self-report of food allergy (or perceived allergy) are higher than the rate of confirmed food allergy.27 When looking at parental pairs, we used pairwise analyses to minimize the possibility of any bias related to household environmental exposures. Also, given our specific cohort of parents of children with food allergy, it is important to note that our data is likely not generalizable to the general population.
In this cohort with a high prevalence of self-reported allergic disease, we described elevated rates of both food and aeroallergen sensitization beyond what has been seen in an unselected adult population.9 Notably, fathers in this cohort had higher levels of sensitization to individual foods and environmental aeroallergens as well as total serum IgE levels consistent with previous reports.28 However, the majority of sIgE sensitization was low level so clinical reactivity is unlikely. A high rate of food allergy report was also observed in those with no sensitization at all. This paper highlights flaws in using self-report alone to determine food allergy, even in this population with heightened awareness of allergic conditions. Often in clinical practice, if a parent has food allergy, it suggests that their child is at higher risk of developing food allergy. Our study suggests that using parental report of food allergy as a risk factor is unreliable. Other known risk factors such as infant eczema may be better for predicting the risk of future food allergy in a child. More epidemiologic studies of food allergy in the adult population are needed which include proper testing and food challenge outcomes to better understand sensitization and heritability.
Supplementary Material
eTable 1. Proportion of parents with a positive test (SPT > 3mm, sIgE >0.35) who self-report food allergy separated by food
eTable 2. Proportion of index children with a positive test (SPT > 3mm, sIgE >0.35) who meet stringent or probable criteria of allergy to that food
Acknowledgments
Financial Support: Supported in part by the Bunning Family Food Allergy Project/Food Allergy Initiative, Sacks Family Foundation Fund, Food Allergy Research and Education (FARE) and the National Institute of Allergy and Infectious Diseases (NIAID, PI: Xiaobin Wang, U01AI090727, R56AI080627, R21AI088609 and M01 RR-00048).
Abbreviations
- SPT
Skin prick test
- sIgE
Specific IgE
- FA
Food Allergy
Footnotes
Trial Registration: Not applicable
Conflicts of Interest: None
Author Contribution: Makhija and Robison contributed equally to (1) conception and design of the study; (2) data generation; (3) analysis and interpretation of the data and (4) preparation or critical revision of the manuscript; Caruso contributed to (1) conception and design of the study and (2) data generation. Cai to (2) data generation and (3) analysis and interpretation of the data. Wang and Pongracic contributed to (1) conception and design of the study (3) interpretation of the data and (4) critical revision of the manuscript.
Publisher's Disclaimer: This is a PDF file of an unedited manuscript that has been accepted for publication. As a service to our customers we are providing this early version of the manuscript. The manuscript will undergo copyediting, typesetting, and review of the resulting proof before it is published in its final citable form. Please note that during the production process errors may be discovered which could affect the content, and all legal disclaimers that apply to the journal pertain.
References
- 1.Sicherer SH, Munoz-Furlong A, Godbold JH, Sampson HA. US prevalence of self-reported peanut, tree nut, and sesame allergy: 11-year follow-up. The Journal of allergy and clinical immunology. 2010;125:1322–6. doi: 10.1016/j.jaci.2010.03.029. [DOI] [PubMed] [Google Scholar]
- 2.Prescott S, Allen KJ. Food allergy: riding the second wave of the allergy epidemic. Pediatric allergy and immunology : official publication of the European Society of Pediatric Allergy and Immunology. 2011;22:155–60. doi: 10.1111/j.1399-3038.2011.01145.x. [DOI] [PubMed] [Google Scholar]
- 3.Chin S, Vickery BP. Pathogenesis of food allergy in the pediatric patient. Current allergy and asthma reports. 2012;12:621–9. doi: 10.1007/s11882-012-0296-x. [DOI] [PMC free article] [PubMed] [Google Scholar]
- 4.Hourihane JO, Dean TP, Warner JO. Peanut allergy in relation to heredity, maternal diet, and other atopic diseases: results of a questionnaire survey, skin prick testing, and food challenges. BMJ (Clinical research ed) 1996;313:518–21. doi: 10.1136/bmj.313.7056.518. [DOI] [PMC free article] [PubMed] [Google Scholar]
- 5.Sicherer SH, Furlong TJ, Maes HH, Desnick RJ, Sampson HA, Gelb BD. Genetics of peanut allergy: a twin study. The Journal of allergy and clinical immunology. 2000;106:53–6. doi: 10.1067/mai.2000.108105. [DOI] [PubMed] [Google Scholar]
- 6.Fox AT, Sasieni P, du Toit G, Syed H, Lack G. Household peanut consumption as a risk factor for the development of peanut allergy. The Journal of allergy and clinical immunology. 2009;123:417–23. doi: 10.1016/j.jaci.2008.12.014. [DOI] [PubMed] [Google Scholar]
- 7.Du Toit G, Roberts G, Sayre PH, et al. Randomized trial of peanut consumption in infants at risk for peanut allergy. The New England journal of medicine. 2015;372:803–13. doi: 10.1056/NEJMoa1414850. [DOI] [PMC free article] [PubMed] [Google Scholar]
- 8.Schmitz R, Ellert U, Kalcklosch M, Dahm S, Thamm M. Patterns of sensitization to inhalant and food allergens - findings from the German Health Interview and Examination Survey for Children and Adolescents. International archives of allergy and immunology. 2013;162:263–70. doi: 10.1159/000353344. [DOI] [PubMed] [Google Scholar]
- 9.Salo PM, Arbes SJ, Jr, Jaramillo R, et al. Prevalence of allergic sensitization in the United States: results from the National Health and Nutrition Examination Survey (NHANES) 2005-2006. The Journal of allergy and clinical immunology. 2014;134:350–9. doi: 10.1016/j.jaci.2013.12.1071. [DOI] [PMC free article] [PubMed] [Google Scholar]
- 10.Burney PG, Potts J, Kummeling I, et al. The prevalence and distribution of food sensitization in European adults. Allergy. 2014;69:365–71. doi: 10.1111/all.12341. [DOI] [PubMed] [Google Scholar]
- 11.Tsai HJ, Kumar R, Pongracic J, et al. Familial aggregation of food allergy and sensitization to food allergens: a family-based study. Clinical and experimental allergy : journal of the British Society for Allergy and Clinical Immunology. 2009;39:101–9. doi: 10.1111/j.1365-2222.2008.03111.x. [DOI] [PMC free article] [PubMed] [Google Scholar]
- 12.Kumar R, Caruso DM, Arguelles L, et al. Early Life Eczema, Food Introduction, and Risk of Food Allergy in Children. Pediatric allergy, immunology, and pulmonology. 2010;23:175–82. doi: 10.1089/ped.2010.0014. [DOI] [PMC free article] [PubMed] [Google Scholar]
- 13.Koplin JJ, Allen KJ, Gurrin LC, et al. The impact of family history of allergy on risk of food allergy: a population-based study of infants. International journal of environmental research and public health. 2013;10:5364–77. doi: 10.3390/ijerph10115364. [DOI] [PMC free article] [PubMed] [Google Scholar]
- 14.Pyrhonen K, Hiltunen L, Kaila M, Nayha S, Laara E. Heredity of food allergies in an unselected child population: an epidemiological survey from Finland. Pediatric allergy and immunology : official publication of the European Society of Pediatric Allergy and Immunology. 2011;22:e124–32. doi: 10.1111/j.1399-3038.2010.01095.x. [DOI] [PubMed] [Google Scholar]
- 15.Vierk KA, Koehler KM, Fein SB, Street DA. Prevalence of self-reported food allergy in American adults and use of food labels. The Journal of allergy and clinical immunology. 2007;119:1504–10. doi: 10.1016/j.jaci.2007.03.011. [DOI] [PubMed] [Google Scholar]
- 16.Silverberg JI, Hanifin JM. Adult eczema prevalence and associations with asthma and other health and demographic factors: a US population-based study. The Journal of allergy and clinical immunology. 2013;132:1132–8. doi: 10.1016/j.jaci.2013.08.031. [DOI] [PubMed] [Google Scholar]
- 17.McHugh MK, Symanski E, Pompeii LA, Delclos GL. Prevalence of asthma among adult females and males in the United States: results from the National Health and Nutrition Examination Survey (NHANES), 2001-2004. The Journal of asthma : official journal of the Association for the Care of Asthma. 2009;46:759–66. doi: 10.1080/02770900903067895. [DOI] [PMC free article] [PubMed] [Google Scholar]
- 18.Perry TT, Matsui EC, Kay Conover-Walker M, Wood RA. The relationship of allergen-specific IgE levels and oral food challenge outcome. The Journal of allergy and clinical immunology. 2004;114:144–9. doi: 10.1016/j.jaci.2004.04.009. [DOI] [PubMed] [Google Scholar]
- 19.Celik-Bilgili S, Mehl A, Verstege A, et al. The predictive value of specific immunoglobulin E levels in serum for the outcome of oral food challenges. Clinical and experimental allergy : journal of the British Society for Allergy and Clinical Immunology. 2005;35:268–73. doi: 10.1111/j.1365-2222.2005.02150.x. [DOI] [PubMed] [Google Scholar]
- 20.Rona RJ, Keil T, Summers C, et al. The prevalence of food allergy: a meta-analysis. The Journal of allergy and clinical immunology. 2007;120:638–46. doi: 10.1016/j.jaci.2007.05.026. [DOI] [PubMed] [Google Scholar]
- 21.Niggemann B, Schmitz R, Schlaud M. The high prevalence of peanut sensitization in childhood is due to cross-reactivity to pollen. Allergy. 2011;66:980–1. doi: 10.1111/j.1398-9995.2011.02561.x. [DOI] [PubMed] [Google Scholar]
- 22.Asarnoj A, Ostblom E, Ahlstedt S, et al. Reported symptoms to peanut between 4 and 8 years among children sensitized to peanut and birch pollen -results from the BAMSE birth cohort. Allergy. 2010;65:213–9. doi: 10.1111/j.1398-9995.2009.02138.x. [DOI] [PubMed] [Google Scholar]
- 23.Mittag D, Vieths S, Vogel L, et al. Soybean allergy in patients allergic to birch pollen: clinical investigation and molecular characterization of allergens. The Journal of allergy and clinical immunology. 2004;113:148–54. doi: 10.1016/j.jaci.2003.09.030. [DOI] [PubMed] [Google Scholar]
- 24.Beyer K, Grishina G, Bardina L, Sampson HA. Identification of 2 new sesame seed allergens: Ses i 6 and Ses i 7. The Journal of allergy and clinical immunology. 2007;119:1554–6. doi: 10.1016/j.jaci.2007.03.041. [DOI] [PubMed] [Google Scholar]
- 25.Kelly C, Gangur V. Sex Disparity in Food Allergy: Evidence from the PubMed Database. Journal of allergy. 2009;2009:159845. doi: 10.1155/2009/159845. [DOI] [PMC free article] [PubMed] [Google Scholar]
- 26.DunnGalvin A, Hourihane JO, Frewer L, Knibb RC, Oude Elberink JN, Klinge I. Incorporating a gender dimension in food allergy research: a review. Allergy. 2006;61:1336–43. doi: 10.1111/j.1398-9995.2006.01181.x. [DOI] [PubMed] [Google Scholar]
- 27.Boyce JA, Assa'ad A, Burks AW, et al. Guidelines for the diagnosis and management of food allergy in the United States: report of the NIAID-sponsored expert panel. The Journal of allergy and clinical immunology. 2010;126:S1–58. doi: 10.1016/j.jaci.2010.10.007. [DOI] [PMC free article] [PubMed] [Google Scholar]
- 28.Barbee RA, Halonen M, Lebowitz M, Burrows B. Distribution of IgE in a community population sample: correlations with age, sex, and allergen skin test reactivity. The Journal of allergy and clinical immunology. 1981;68:106–11. doi: 10.1016/0091-6749(81)90167-6. [DOI] [PubMed] [Google Scholar]
Associated Data
This section collects any data citations, data availability statements, or supplementary materials included in this article.
Supplementary Materials
eTable 1. Proportion of parents with a positive test (SPT > 3mm, sIgE >0.35) who self-report food allergy separated by food
eTable 2. Proportion of index children with a positive test (SPT > 3mm, sIgE >0.35) who meet stringent or probable criteria of allergy to that food