Abstract
Dynamic myocardial perfusion computed tomography (MPCT) is a promising technique for quick diagnosis and risk stratification of coronary artery disease. However, one major drawback of dynamic MPCT imaging is the heavy radiation dose to patients due to its dynamic images acquisition protocol. In this work, to address this issue, we present a robust dynamic MPCT deconvolution algorithm via adaptive-weighted tensor total variation (AwTTV) regularization for accurate residue function estimation with low-mAs data acquisitions. For simplicity, the presented method is termed as “MPD-AwTTV”. More specifically, the gains of the AwTTV regularization are from the anisotropic edge property of the sequential MPCT images over the original tensor total variation regularization. To minimize the associative objective function we propose an efficient iterative optimization strategy with fast convergence rate under the framework of iterative shrinkage/thresholding algorithm. We validate and evaluate the presented algorithm using both digital XCAT phantom and preclinical porcine data. The preliminary experimental results have demonstrated that the presented MPD-AwTTV deconvolution algorithm can achieve remarkable gains in noise-induced artifacts suppression, edge details preservation and accurate flow-scaled residue function and MPHM estimation as compared with the other existing deconvolution algorithms in the digital phantom studies, and the similar gains can be obtained in the porcine data experiment.
1. Introduction
Coronary artery disease (CAD) as a most common type of heart disease has been the main cause of death worldwide (Becker and Becker et al 2013). Dynamic myocardial perfusion computed tomography (MPCT) is a promising technique for assessing CAD via myocardial perfusion hemodynamic maps (MPHM) including myocardial blood flow (MBF), myocardial blood volume (MBV), and mean transmit time (MTT) (McCommis et al 2009, Troalen et al 2014). However, dynamic MPCT as a quantitative technique need to acquire the complete time-attenuation curves (TAC) of the aorta and left ventricular myocardium for yielding an accurate MPHM estimation (So and Lee et al 2011a, Rossi et al 2014). As a result, dynamic MPCT unavoidably leads to high cumulative radiation dose as compared to the routine CT examination (Patel et al 2013, Ebersberger et al 2014). To address this issue, several highly publicized approaches have been proposed (Ma et al 2012b, Achenbach et al 2011, Dewey et al 2009, So et al 2011b). Among them, a straightforward and cost effective approach is to perform dynamic MPCT scan with lower milliampere-seconds (mAs) data acquisitions. But, one major drawback of this approach is that conventional filtered back-projection (FBP) algorithm without introducing any other operations would fail in high quality image reconstruction and accurate MPHM estimation due to the seriously noisy low mAs data acquisitions.
Up to now, various advanced image processing and reconstruction algorithms with different capability for noise suppression in the case of low-mAs data acquisition have been reported (Speidel et al 2013, Ramirez-Giraldo et al 2012, Sawall et al 2012, Lauzier et al 2012, Modgil et al 2014, Lin and Ehsan et al 2014, Tao et al 2014, Bian et al 2015). For instance, Speidel et al (2013) proposed a highly constrained backprojection (HYPR) image processing method to directly reduce the noise in the MPCT image domain. Modgil et al (2014) developed a dynamic MPCT sinogram data restoration method for successful MPCT image reconstruction using the FBP algorithm. Recently, Tao et al (2014) introduced a penalized weighted least-squares (PWLS) approach by modeling the statistics of the measurement for noise-induced artifacts reduction. Bian et al (2015) also proposed a statistical iterative reconstruction scheme by incorporating a motion adaptive sparsity prior model for acceptable dynamic MPCT image reconstruction. To sum up, the above-mentioned algorithms can yield reasonable MPHM estimation from the restored/reconstructed dynamic MPCT images using conventional singular value decomposition (SVD) based deconvolution method (Ostergaard et al 1996). However, they fail to fully consider the procedure of dynamic MPCT deconvolution modeling and partially loses efficacy in the case of ultra-low-mAs data acquisition. To overcome the drawback, in this work we propose a robust deconvolution model with superior performance on accurate flow-scaled residue function estimation over other similar methods with less image spatial resolution loss.
Recently, Fang et al (2015) introduced a tensor total variation (TTV) regularization for low-dose cerebral perfusion CT (CPCT) deconvolution. Although the TTV regularization based deconvolution algorithm can achieve noticeable gains in cerebral perfusion hemodynamic maps estimation, the TTV regularization as an extension of conventional total variation (TV) regularization may suffer from loss of fine structures and contrast and may produce staircasing artifacts due to the assumption of isotropic edge property of TTV regularization (Liu et al 2012). To address the issue of TV/TTV regularizations, Liu et al (2012) developed an adaptive-weighted TV (AwTV) model for low-dose CT image reconstruction wherein the weights in the AwTV regularization is adaptively adjusted with the local image-intensity gradient aiming to preserve the edge details information. Inspired by the deconvolution framework of CPCT imaging (Fang et al 2015) and the AwTV regularization in CT image reconstruction (Liu et al 2012), in this work we present a robust dynamic MPCT deconvolution algorithm via adaptive-weighted tensor total variation (AwTTV) regularization for accurate residue function estimation with low-mAs data acquisitions. For simplicity, the presented algorithm is termed as “MPD-AwTTV”. The contributions of this study can be summarized as follows: (1) we present an AwTTV regularization that involves the anisotropic edge property of the sequential MPCT images for dealing with the dynamic MPCT deconvolution problem with low-dose scan; (2) we propose a heuristic convergent algorithm with a robust solution under the relative root mean square error (rRMSE) metric (Niu et al 2014); (3) we study the performance of the algorithm on both digital XCAT phantom and preclinical porcine data; and (4) we compare the presented MPD-AwTTV algorithm with other existing deconvolution algorithm (Calamante et al 1996, Fang et al 2015) and demonstrate that the presented algorithm can achieve remarkable gains in noise-induced artifacts suppression, edge details preservation and accurate flow-scaled residue function and MPHM estimation.
The remainder of this paper is organized as follows. Section 2 gives a brief review of dynamic MPCT convolution model, the presented MPD-AwTTV deconvolution algorithm and the associative optimization algorithm. The experimental setup and evaluation metrics are also given in this section. Section 3 presents the experimental results. Finally, discussion and conclusion are included in Section 4.
2. Methods and materials
2.1. Brief review of dynamic MPCT convolution model
The indicator dilution theory for analyzing contrast clearance data from myocardium was studied (Jerosch-Herold et al 2002, Zierler et al 1962, Zierler et al 2000), and the amount of contrast agent concentration CV(t) measured in the myocardial volume V can be calculated as follows:
| (1) |
where ρV denotes the mean density of the myocardial volume V, Ca(t) denotes the arterial input function (AIF), and R(t) represents the residue function which quantifies the relative amount of contrast agent remaining in the given volume V over time. * denotes the convolution operator.
Let K(t) = MBF·R(t) represent the flow-scaled residue function, Ca(t) and CV(t) are sampled at discrete time points ti (ti = (i − 1)·Δt,t = 1, 2, …, N), and then Eq. (1) can be rewritten as follows:
| (2) |
where Δt is the sampling period, N denotes the number of samples. In the implementation for simplicity, a global AIF estimated in larger feeding artery is usually used to replace Ca(t) with a reasonable signal-to-noise (SNR). For a volume of interest with N voxels, Eq. (2) can be further formulated as a following matrix multiplication (Fang et al 2015):
| (3) |
where C = [c1, …, cN], K = [k1, …, kN] denote the contrast agent concentration and flow- scaled residue function for N voxels in the volume of interest, respectively. Δt and AIF are combined in the matrix A. A straightforward way to find the solution to Eq. (3) is by minimizing (in the least-square sense) the residual error between the model predicted contrast agent concentration and the actual measured data C. However, the main K shortcoming of this method is its ill-posed nature: small perturbations of the measured data C could cause a large variation in the reconstructed flow-scaled residue function K. Therefore, regularization is required to stabilize the solution. Mathematically, the cost function can be written as follows:
| (4) |
where T(K) is a regularization term. After the flow-scaled residue function K̂ is obtained, MPHM parameters can be determined as follows:
| (5) |
2.2. Description of the MPD-AwTTV deconvolution method
Usage of regularization term tending to smooth out noise while preserving image edges has demonstrated a profound impact on PCT imaging research. One typical family is TV/TTV regularization term (Tao et al 2014, Fang et al 2015). Although the TV/TTV regularization based algorithms can achieve noticeable gains in PCT imaging, they have the drawbacks of over-smoothing homogenous regions and producing staircase artifacts. To overcome these issues, Liu et al (2012) proposed an adaptive-weighted TV (AwTV) regularization to improve CT images quality by adjusting the local image-intensity gradient for edge-details preservation. Similar to the idea of AwTV regularization in low-dose CT image reconstruction, in this study we present an improved cost function for dynamic MPCT flow- scaled residue function estimation, which is written as follows:
| (6) |
where ‖K‖AwTTV represents the AwTTV regularization and is defined as follows:
| (7) |
where w is hyper-parameter controlling the strength of regularization, and δ is a scale factor controlling the strength of the diffusion during each iteration (Liu et al 2012). By the form of the AwTTV regularization, we can see that it takes into account the anisotropic edge property among neighboring volume voxels in the sequential MPCT images. The associated weights w are sensitive to the change of local voxel intensities. In particular, a stronger weight can be given for a smaller change of voxel intensity, and vice versa. It is also worth to note that TV/TTV regularization is a special case of the AwTV/AwTTV regularization when δ → ∞.
To minimize Eq. (6), the fast iterative shrinkage/thresholding algorithm (FISTA) (Beck and Teboulle et al 2009) was modified, which has been successfully used in perfusion CT deconvolution with reasonable convergent rate (Fang et al 2015). Mathematically, minimizing (6) can be split as two sub-problems:
| (8) |
| (9) |
The sub-problem (1) is first minimized to find an intermediate variable Ks after n-th iteration using the following steepest descent scheme:
| (10) |
where with G AT (AK̅n − C). Second, due to the nonlinear definition of ‖K‖AwTTV, to effectively optimize sub-problem (2) with Ks as an input, a widely-used one-step-late (OSL) implementation (Ma et al 2010) is employed wherein the weight coefficients at current iteration are estimated from the result of the previous iteration. Then, the steepest descent scheme is utilized to minimize the sub-problem (2) according to Ref. (Liu et al 2012).
In summary, the implementation of the presented MPD-AwTTV deconvolution algorithm for dynamic MPCT flow-scaled residue function estimation can be described as follows:
| 1:Initial: K̅(1) = K(0) = 0, m(1) = 1; | ||
| 2:Initial: η = 1.0×10⁻³, δ; | ||
| 3: For n = 1, 2, …, J; | ||
| 4: | Ks = K̅(n) − r(n+1) AT (AK̅(n) − C), | |
| 5: |
|
|
|
|
||
|
|
||
| 6: | For d = 1, 2, ⋯, D; | |
| 7: | If d == 1; | |
| 8: |
|
|
| 9: | Else | |
| 10: | End If ; | |
| 11: | End For; | |
| 12: | K(n) = K(n−1)+D; | |
| 13: |
|
|
| 14: | K̅(n+1) = K(n) + ((m(n) − 1) / m(n+1))(K(n) − K(n−1)); | |
| 15: | η = 0.995* η; | |
| 16: End For; | ||
| 17: K̂ = K(N); | ||
| 18: Return K̂. | ||
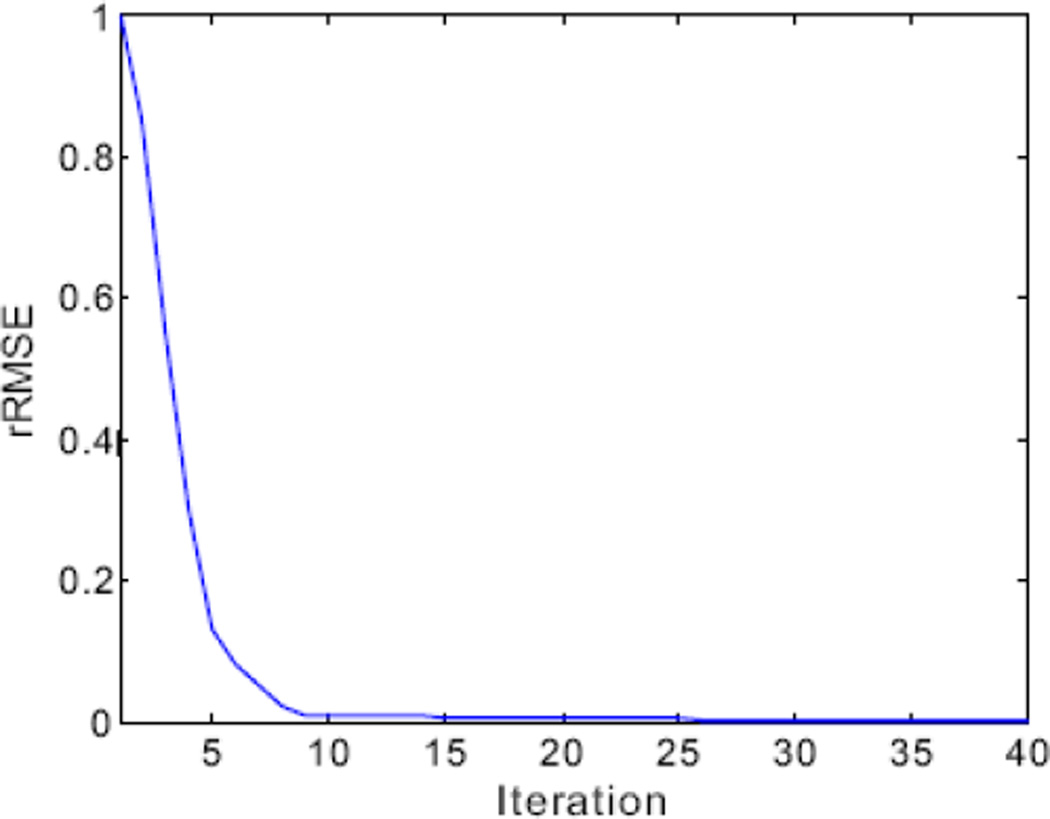
In line 1, both the parameters K̅ and m are acceleration operators. In line 2, the parameter δ is empirically determined through extensive experiments by visual inspection for eye-appealing result, together with the normal-dose images for comparison. The value of δ can be used to simulate the strength of the diffusion among neighbors (Liu et al 2012, Perona et al 1990, Wang et al 2008). In lines 3 and 6, n denotes the index of outer cycles and d denotes the index of inner cycles of AwTTV minimization. In line 8, η denotes the steepest-descent parameter and its value is adaptively adjusted but not critical. Three mainly separate steps are included in outer loop (lines 3–16), i.e. the steepest descent scheme for sub-problem (1) in Eq. (8) (line 4), the weights calculation (line 5) by using the latest estimation Ks, and the steepest descent scheme for sub-problem (2) in Eq. (9) (lines 6–11). Fig. 1 shows the final result estimated from the presented MPD-AwTTV deconvolution algorithm could heuristically converge to a solution of Eq. (6) with the rRMSE metric (Niu et al 2014). It can be further seen that 12 iterations for the presented algorithm reached a solution with sufficient stability in terms of the rRMSE measurements.
Figure 1.
The rRMSE measurements of the present MPD-AwTTV deconvolution algorithm versus the number of iteration in phantom study under a low noise level.
2.3. Experimental data acquisition
To validate and evaluate the performance of the presented MPD-AwTTV algorithm for low-dose dynamic MPCT image deconvolution a modified XCAT phantom (Segars et al 2010) and preclinical porcine data were used in the experiments.
2.3.1. Digital myocardial perfusion phantom
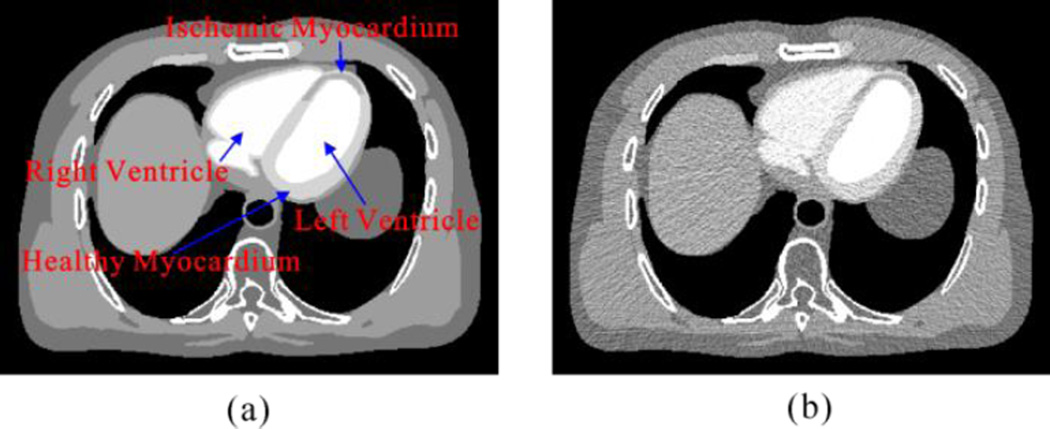
Fig. 2 shows the modified digital XCAT phantom used in this study (Segars et al 2010). In the work, contrast dynamic of the left ventricle, aorta healthy myocardium, ischemic myocardium and right ventricle were represented by the time attenuation curves (TAC) which is shown in Fig. 2 (b). The scanning time was 30 s, enabling reconstruction of 30 cardiac cycles/scan with a time interval of 1 s between images. Images were generated at end diastole without cardiac motion. The low-dose MPCT sinogram data were acquired using the simulation method in our previous study (Ma et al 2012b, Zeng et al 2015) and the noisy measurements were reconstructed by the FBP algorithm to obtain the low-dose MPCT images. The simulated CT imaging parameters were the same as these of a commercial 64-slice multi-detector CT scanner (Discovery CT750 HD GE MEDICAL SYSTEMS) and are illustrated in Table 1. In this study, two noise levels related to the projection data acquired with about 50 and 20 mAs at a fixed kVp were simulated respectively.
Figure 2.
(a) A modified XCAT phantom composed of the left and right ventricular cavities, aorta, healthy and ischemic myocardium. (b) Contrast dynamic of the left ventricle, aorta, healthy myocardium, ischemic myocardium, and right ventricle.
Table 1.
The imaging parameters of the GE Discovery CT750 HD CT scanner
| Parameter | |
|---|---|
| Source-to-detector distance | 946.746 mm |
| Source-to-object distance | 538.52 mm |
| Number of detector bins | 888 |
| Detector bin spacing | 0.625 mm |
| Projection views per rotation | 984 |
| Rotation time | 0.4 s |
2.3.2. Preclinical porcine data
A healthy Chinese minipig (weight, 22.5 kg, female) was used in this study, which was approved by the Animal Care Committee at the Tianjin Medical University General Hospital (Tianjin, China). An Intramuscular injection of ketamine (20 mg/kg), Xylazine Hydrochloride (1.5 mg/kg) and atropine (0.02 mg/kg) was performed in premedication. A cuffed endotracheal tube with inner diameter of 4.5 mm was placed in the trachea for anesthesia inspiration and respiration. With the support of the animal aspirator (Matrx VMS Plus VMC, Anesthesia Machines, Midmark Corporation, New York), the pig was mechanically ventilated and anaesthetize with Sevoflurane (2.5%–3.5% in oxygen) during the angioplasty and MPCT scanning. The angioplasty balloon was positioned in the left anterior descending (LAD) just distal to the first diagonal artery. Acute myocardial infarction was confirmed by electrocardiogram which showed distinct ST segment elevation. After 90 minutes occlusion, the angioplasty balloon was flattened and taken back. Physiological parameters, such as arterial blood pressure, oxygen saturation, heart rate, and electrocardiography (ECG), were consecutively monitored before and after experiment. All scans were performed on the same day, with at least 15 min between scans to allow for clearance of contrast media from the myocardium.
The acquisition was operated on the 64-slice multi-detector CT scanner (Discovery CT750 HD, GE MEDICAL SYSTEMS) in cine mode with the following protocol: 120 kVp,100 mA, slice thickness of 5 mm, using 0.4 s gantry rotation time, and the total scan duration is about 30 s. In all reconstructions, the ECG signal was used to select projections center on 75% R-R for each cardiac cycle. From the acquired high-dose enhanced scan, we simulated the low-dose MPCT images from the high-dose data using the simulation technique described in Section 2.3.1 according to the above described CT imaging parameters.
2.4. Performance evaluation
2.4.1. Evaluation by noise reduction
Three quantitative metrics (i.e. the peak signal-to-noise ratio (PSNR), the mean per cent squared error (MPSE) and the mean per cent absolute error (MPAE)) were utilized to evaluate the noise reduction performance of the presented MPD-AwTTV deconvolution algorithm. The MPHM estimated from ideal or high-mAs MPCT data are served as the reference standard. The three metrics are defined as follows:
| (11) |
| (12) |
| (13) |
where X denotes the voxel value of the estimated MPHM in the region of interest (ROI) at low dose, Xtrue represents the voxel value of the reference standard in the ROI, MAX(Xtrue) represents the associated maximum intensity value of Xtrue, and X̅true denotes the average pixel value of Xtrue wherein n indexes the pixels in the ROI, and Q is the number of pixels in the ROI.
2.4.2. Evaluation by image similarity
In order to assess the image quality of ROIs by different deconvolution algorithms, the UQI (Wang et al 2004) was utilized to evaluate the similarity between the MPHM at low-dose and the reference standard. Mathematically, the UQI can be defined as follows:
| (15) |
where and . The UQI quantifies the intensity similarity between two images and its value ranges from zero to one, and a QUI value closer to one suggests great similarity to the reference standard.
2.4.3. Evaluation by histogram map
It is necessary to analyze MBF values of left ventricular myocardium quantitatively in MPCT with a histogram map to better visualize MBF differences among the deconvolution algorithms (Likhite et al 2015). In the experiments, we manually selected two ROIs located at the healthy myocardium and ischemic myocardium regions in the MBF map, respectively, with the assistance of clinical expert. The histogram maps of the estimated MBF map and the reference standard over the specified ROIs were plotted together. A smaller histogram discrepancy means better accuracy of the MBF map estimation.
2.5. Comparison methods
To validate and evaluate the performance of the presented MPD-AwTTV deconvolution algorithm, two different deconvolution algorithms are adopted for comparison, i.e. standard truncated singular value decomposition (sSVD) algorithm (Calamante et al 2000), and the tensor total variation regularization algorithm (Fang et al 2015) which is hereafter referred to the MPD-TTV deconvolution algorithm. The cost function of the MPD-TTV deconvolution algorithm can be written as follows:
| (15) |
where , ∇d is the forward finite difference operator in dimension d. ϖd is hyper-parameter used to balance the fidelity term (the first term in Eq. (15) and the TTV regularization term. In this study, the parameter ϖd could be determined by a broader range of parameter values in terms eye-appealing visualization and quantitative measurements compared with the ground truth. All of the algorithms were implemented in Matlab R2011a (The MathWorks, Inc.) programming environment. The codes were run on a PC with Intel (R) Pentium (R) 2.6 GHz CPU.
3. Results
3.1. Phantom study
3.1.1. Visualization-based evaluation
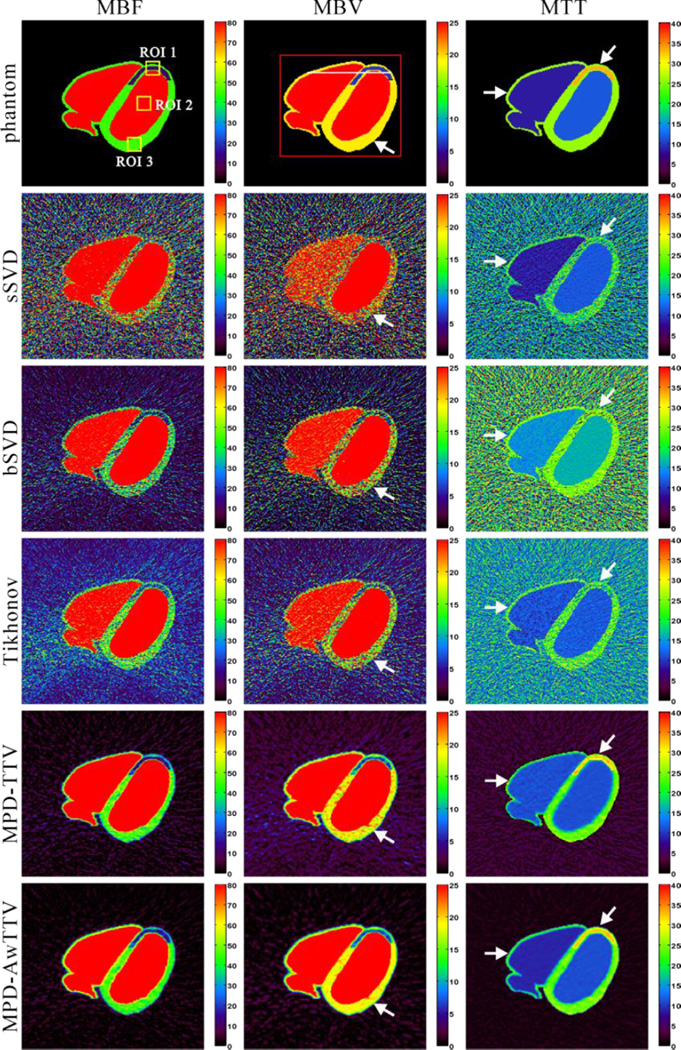
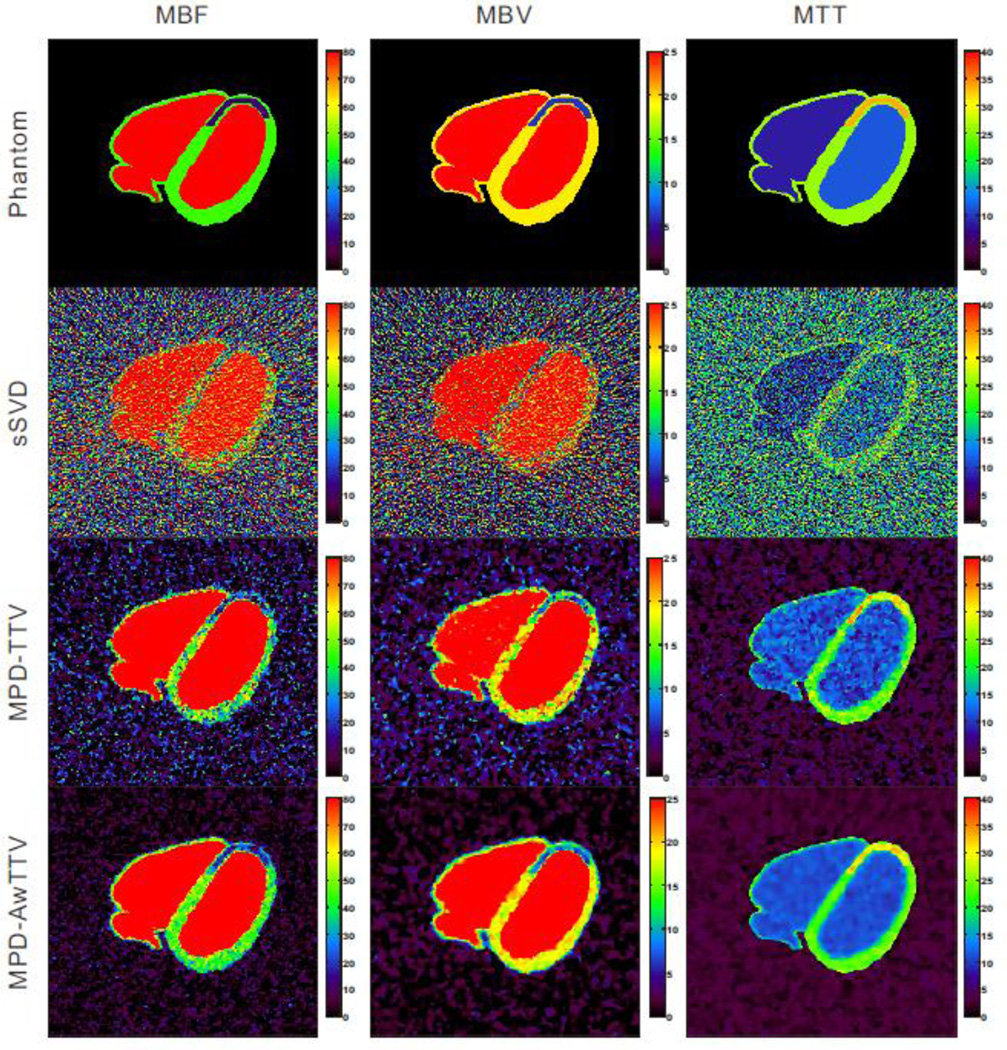
Fig. 3 shows the MPHM calculated by three different deconvolution algorithms under a low noise level. The first row shows the noise-free MPHM, which serves as the reference standard for comparison. The second row represents the MPHM calculated by the sSVD deconvolution algorithm. It can be observed that serious noise-induced artifacts present in all MPHM. The last two rows show the MPHM calculated by the MPD-TTV and the presented MPD-AwTTV deconvolution algorithms from noisy measurements, respectively. We can observe that the MPHM from the two deconvolution algorithms are better than the results of sSVD deconvolution algorithm by visual inspection. Furthermore, noticeable difference among the results can be seen at ischemic myocardium and healthy myocardium regions indicted by the white arrows in Fig. 3. As a result, the presented MPD-AwTTV deconvolution algorithm is superior to the MPD-TTV deconvolution algorithm in successful noise-induced artifacts reduction and structure detail preservation.
Figure 3.
The MBF (column one), MBV (column two) and MTT (column three) maps calculated by three different deconvolution algorithms under a low noise level. The first row was the noise-free MPHM used as ground-truth; the second row was estimated by the sSVD deconvolution algorithm from noisy measurements; the third row was calculated by the MPDTTV deconvolution algorithm from noisy measurements; and the fourth row was calculated by the presented MPD-AwTTV deconvolution algorithm from noisy measurements. MBF in unit of ml/100g/min, MBV in unit of ml/100g, and MTT in unit of sec.
3.1.2. Noise reduction performance
Fig. 4 shows the PSNR, MPSE and MPAE measurements of three selected ROIs as indicated by the yellow squares in Fig. 3. We can observe that the MPD-TTV and MPD-AwTTV results have much larger PSNR values and smaller MPSE and MPAE values than the results of sSVD deconvolution algorithm, and the presented MPD-AwTTV deconvolution algorithm yields an average of more than 15% gains over the MPD-TTV deconvolution algorithm in terms of PSNR, MPSE and MPAE measurements on three different ROIs. Thus the results could evidently demonstrate that the presented MPD-AwTTV deconvolution algorithm can achieve significant ability over other algorithms for noise and artifacts suppression.
Figure 4.
The PSNR, MPSE and MPAE measurements on the ROIs indicated by the yellow squares in Fig. 3 from different deconvolution algorithms: (a) MBF maps; (b) MBV maps; and (c) MTT maps.
3.1.3. Flow-scaled residue function recovery
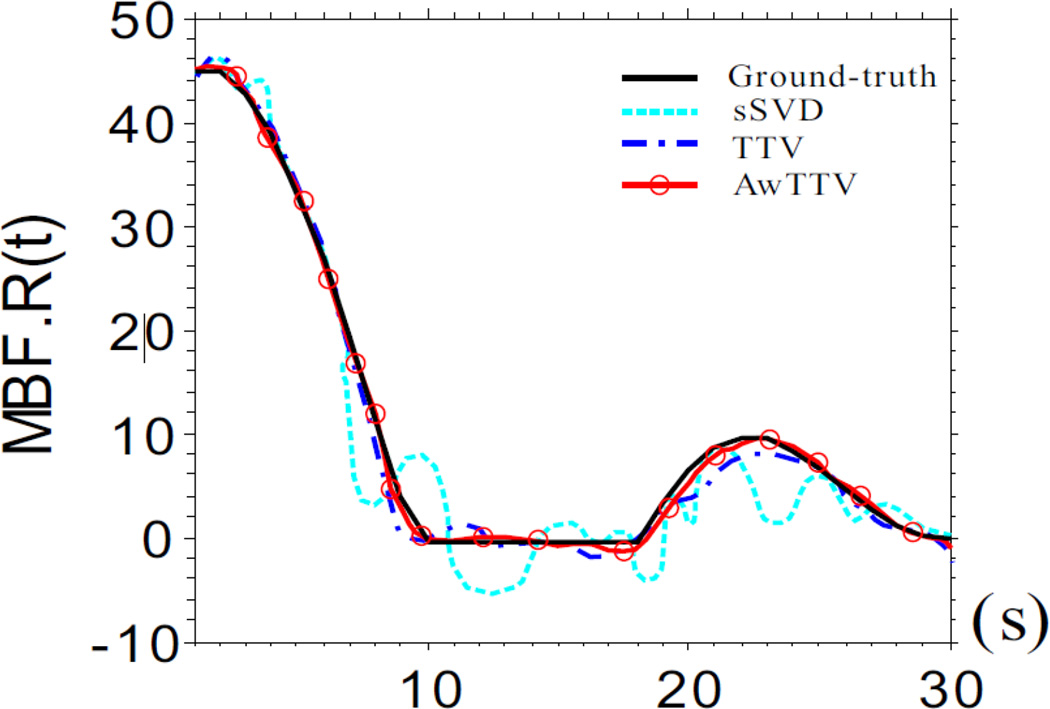
Fig. 5 shows the results of flow-scaled residue function calculated by three different deconvolution algorithms. The ‘black solid line’ is corresponding to the ground-truth for comparison. Some oscillations in the MPD-TTV recovered flow-scaled residue function occurred (‘blue dash dot line’). However, the MPD AwTTV deconvolution algorithm (‘red solid line with circle marker’) can obtain higher level of agreement with the ground truth by utilizing the anisotropic edge property of the sequential MPCT images, when compared with the MPD-TTV deconvolution algorithm. In other words, the presented MPD-AwTTV deconvolution algorithm is capable in accurate flow scaled residue function estimation.
Figure 5.
The flow-scaled residue function calculated by three different deconvolution algorithms.
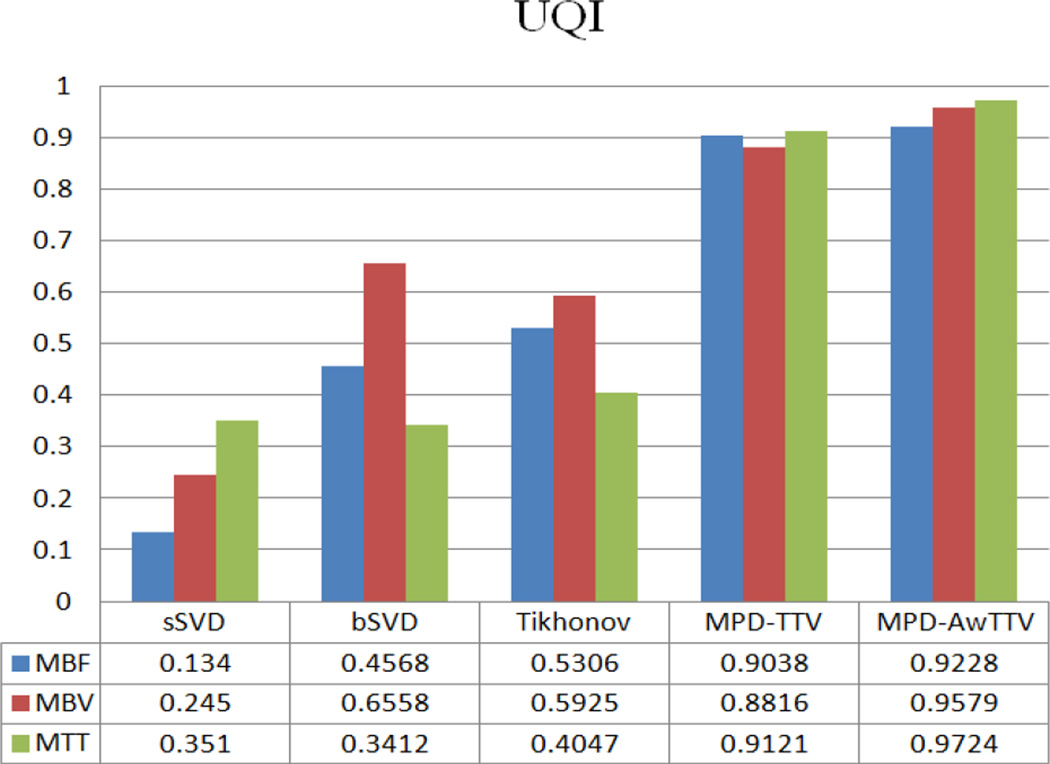
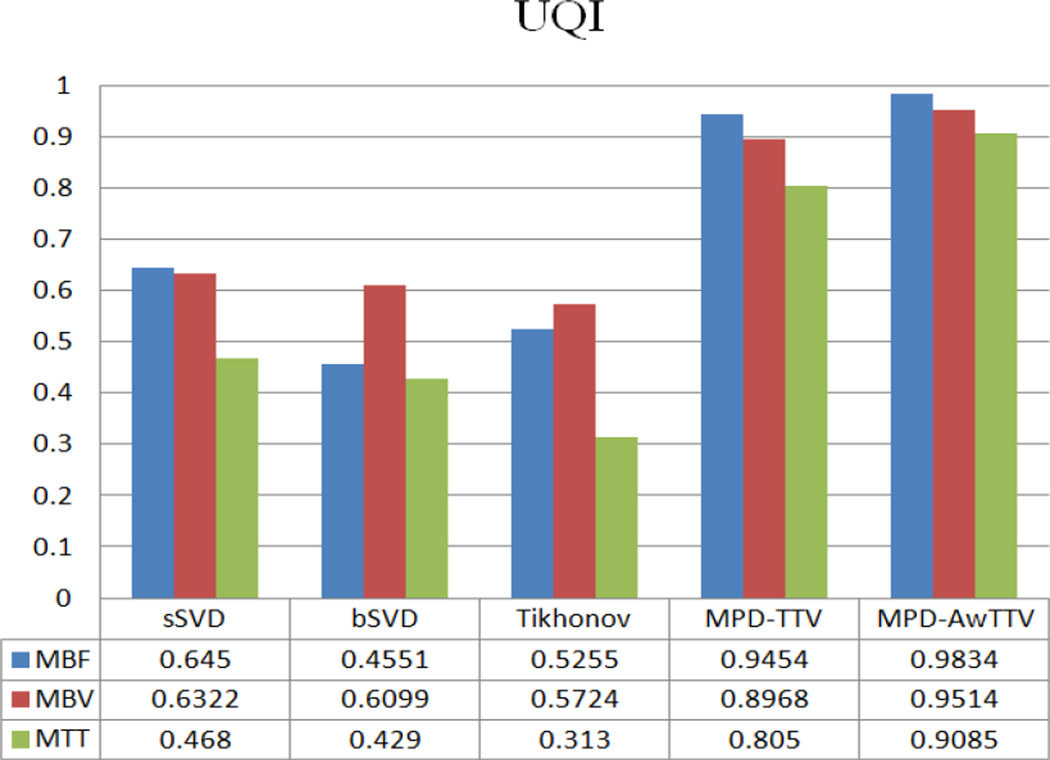
To further demonstrate the performance of the present MPD-AwTTV deconvolution algorithm, we conduct the MPCT deconvolution experiments under a higher noise level as shown in Fig. 6. As can be seen, the MPD-TTV deconvolution algorithm can reduce the noise level to a certain extent but serious noise-induced artifacts still exist in the MPHM. Meanwhile, the present MPD-AwTTV deconvolution algorithm shows superior image quality. The UQI measurements depicted in Fig. 7 also demonstrate the present MPD AwTTV deconvolution algorithm outperforms the other two deconvolution algorithms in both resolution preservation and noise reduction.
Figure 6.
The MBF (column one), MBV (column two) and MTT (column three) maps estimated by different algorithms under a higher noise level. The first row was noise-free MPHM used as ground-truth; the second row was estimated by the sSVD deconvolution algorithm; the third row was calculated by the MPD-TTV deconvolution algorithm and the fourth row was obtained by the present MPD-AwTTV deconvolution algorithm.
Figure 7.
The UQI measurements of the MPHM estimated by the three deconvolution algorithms.
3.2. Preclinical porcine study
3.2.1. Visualization-based evaluation
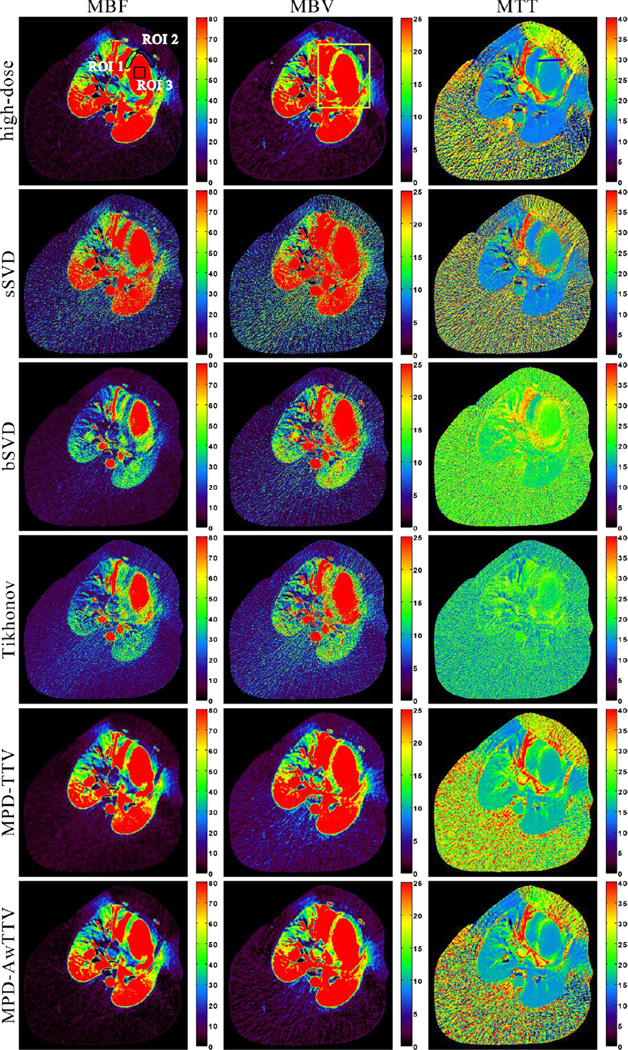
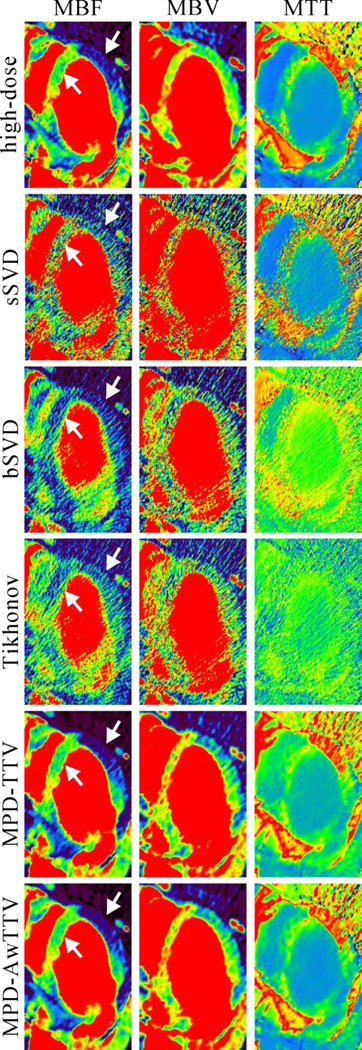
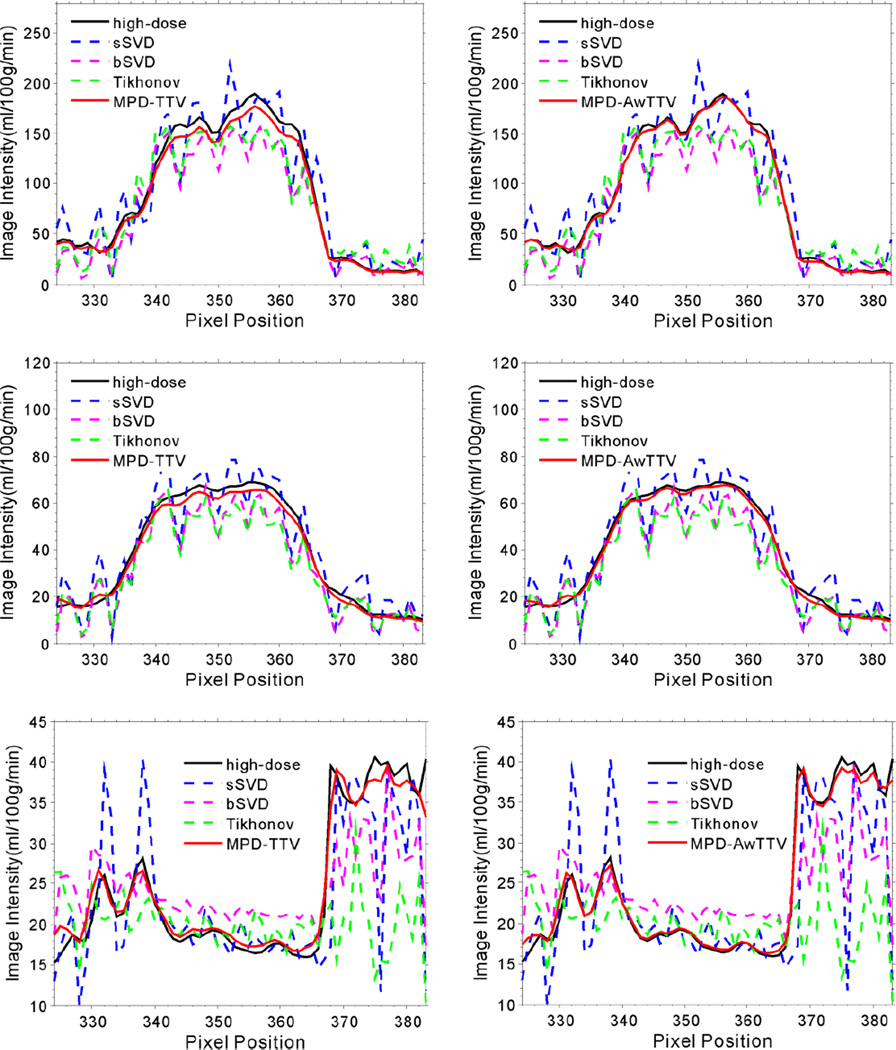
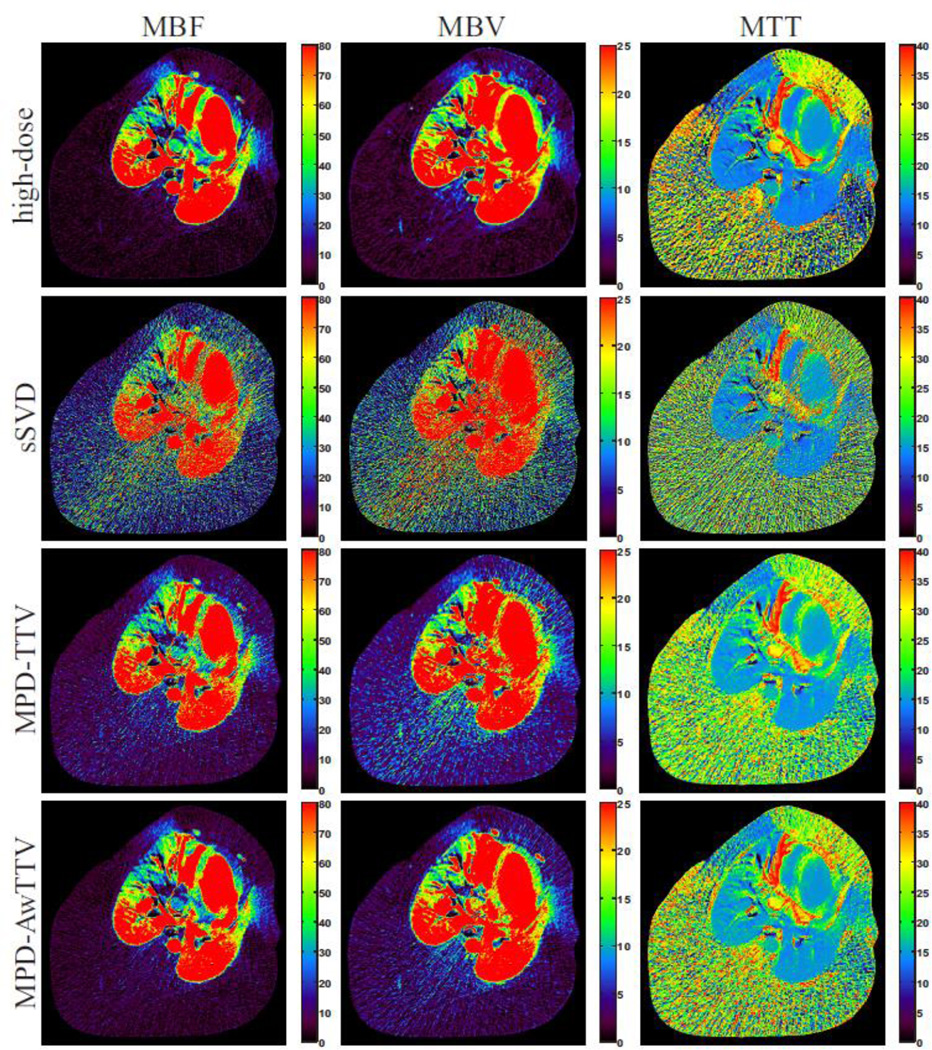
Fig. 8 shows the MPHM from the high- and low dose MPCT images calculated by three different deconvolution algorithms. It can be seen that the MPHM estimated by the presented MPD-AwTTV deconvolution algorithm are better than those estimated by the MPD-TTV and sSVD deconvolution algorithm in terms of visual inspection. Moreover, the local magnification views of ROIs as indicated by the yellow rectangle in Fig. 8 are illustrated in Fig. 9, which indicates that the presented MPD-AwTTV deconvolution algorithm could show a more pleasant image quality in all the MPHM. It can be further demonstrated that the presented MPD-AwTTV deconvolution algorithm outperforms other two deconvolution algorithms in preserving dynamic detail information overall. Fig. 10 shows the horizontal profiles through the center of left ventricle region as indicated by a black solid line in Fig. 8. These profiles show that the loss of homogeneous regions is observed in the MPD-TTV results while the intensity values of the MPD-AwTTV results are more structurally similar to the reference. The profile comparisons further reveal that higher resolution and noticeable edge preservation can be obtained by the presented MPD-AwTTV deconvolution algorithm compared with the other two deconvolution algorithms.
Figure 8.
The MBF (column one), MBV (column two) and MTT (column three) maps estimated by three different algorithms from the low-dose MPCT images, respectively. The first row was calculated from the high-dose MPCT images; the second row was estimated by the sSVD deconvolution algorithm; the third row was estimated by the MPD-TTV deconvolution algorithm; and the fourth row was estimated by the presented MPD-AwTTV deconvolution algorithm. MBF in unit of ml/100g/min, MBV in unit of ml/100g, and MTT in unit of sec.
Figure 9.
The zoomed details of ROIs of MPHM in Fig. 8.
Figure 10.
The horizontal profiles of the MPHM shown in Fig. 8. The first row denotes the results of the MBF maps; the second row denotes the results of the MBV maps; and the third row denotes the results of the MTT maps. The corresponding algorithms are illustrated in figure legend
3.2.2. Histogram map evaluation
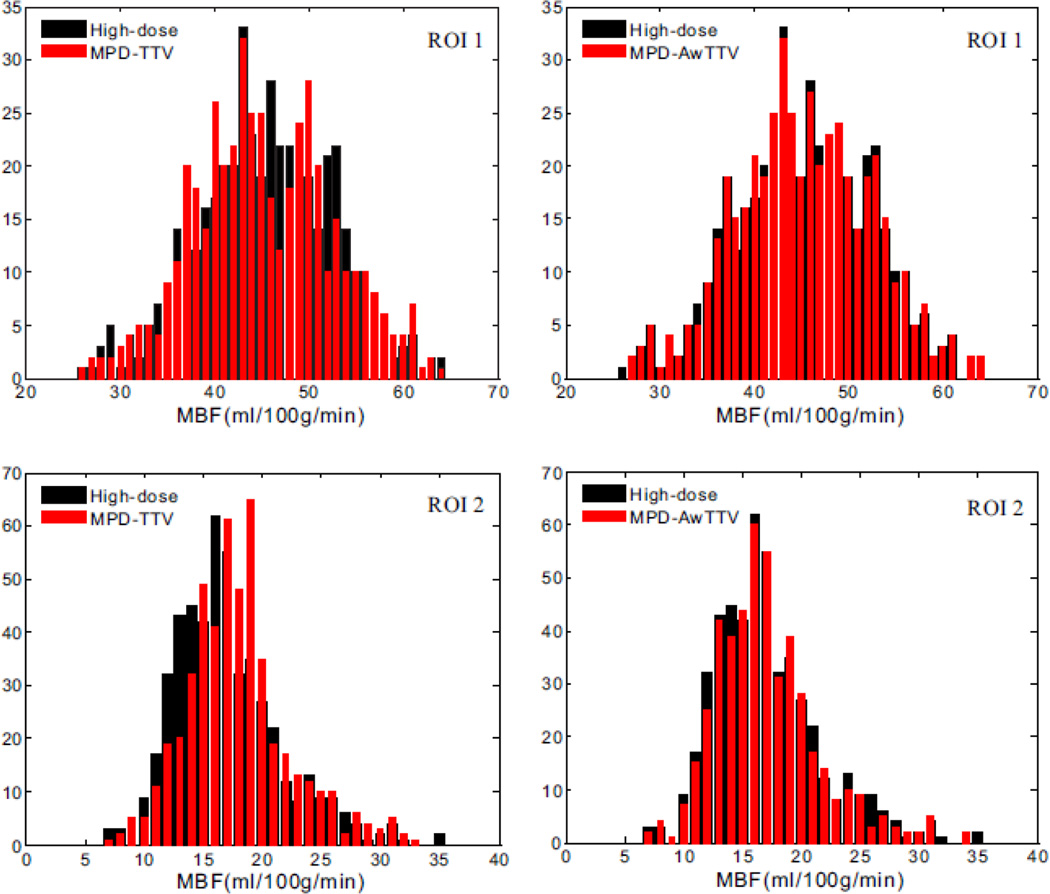
Fig. 11 shows the histogram maps of the MBF in two ROIs as indicated in Fig. 8. It can be observed that a larger histogram discrepancy exsits in the MPD-TTV results in the first column compared with the presented MPD-AwTTV results in second column, especially in the healthy myocardium region (ROI 1) and the ischemic myocardium region (ROI 2). In other words, the results further demonstrate that the presented MPD-AwTTV deconvolution algorithm can yield more accurate MPHM estimation than the MPD-TTV deconvolution algorithm.
Figure 11.
The histogram maps of the two ROIs for the high-dose MBF map and low-dose MBF map estimated by two different deconvolution algorithms. The ROI 1 represents the healthy myocardium region. The ROI 2 represents the ischemic myocardium region.
3.2.3. UQI study
Fig. 12 shows the local UQI measurements of the selected ROI as indicated by the yellow rectangle in Fig. 8. The results indicate that the MPD-TTV and the presented MPD-AwTTV deconvolution algorithms achieve more significant gains over the sSVD deconvolution algorithm. Furthermore, the presented MPD-AwTTV deconvolution algorithm performs better than the MPD-TTV deconvolution algorithm with 4% gains for the MBF map, 6% gains for the MBV map and 13% gains for the MTT map. The results are consistent with the previous observations in both the XCAT phantom and preclinical porcine study.
Figure 12.
The UQI measurements on the ROI indicated by the yellow rectangle in Fig. 8.
To further demonstrate the improvement over the MPD-TTV deconvolution algorithm, we conduct the porcine preclinical experiments under a higher noise level as shown in Fig. 13. As can be seen, the MPD-TTV deconvolution algorithm can reduce such noise-induced artifacts in the MPHM to some extent. Meanwhile, it can be observed that the present MPD-AwTTV deconvolution algorithm outperforms better than the MPD-TTV deconvolution algorithm in terms of noise-induced artifacts suppression and image quality improvement.
Figure 13.
The MBF (column one), MBV (column two) and MTT (column three) maps estimated by different algorithms under a higher noise level in the porcine study.
3.3. Parameter selection
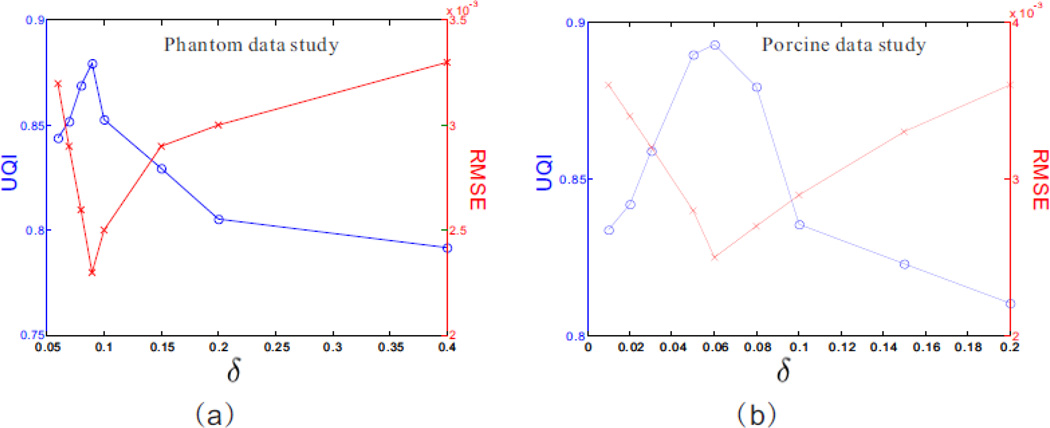
Fig. 14 shows the UQI and RMSE measurements for the presented MPD-AwTTV deconvolution algorithm with different δ values in the phantom and porcine data studies, respectively. As can be seen, the corresponding optimal δ values are 9×10⁻² and 6×10⁻² in terms of the highest UQI and lowest RMSE measurements.
Figure 14.
The RMSE and UQI measurements for the presented MPD-AwTTV deconvolution algorithm with different δ values in the phantom (a) and porcine (b) data studies, respectively. The ‘blue solid line with circle marker’ and ‘red solid line with x-mark marker’ represent the UQI and RMSE measurements, respectively.
4. Discussion and conclusion
Inspired by the success of AwTV minimization model in CT image processing scenario (Liu et al 2012), an AwTTV model is proposed and incorporated into the deconvolution framework for accurate MPHM estimation with low-mAs data acquisitions. One motivation of this work is that the AwTTV regularization introduces anisotropic adaptive penalty weights to voxels to preserve the edge details by taking into account characteristics of MPCT imaging procedure and anisotropic edge property of local voxels in MPCT images. The presented MPD-AwTTV deconvolution algorithm has been validated and evaluated on both the XCAT phantom and preclinical porcine data. The experimental results have clearly demonstrated the presented MPD-AwTTV deconvolution algorithm outperforms other existing deconvolution algorithms in noise-induced artifacts suppression, edge details maintenance and accurate flow-scaled residue function and MPHM estimation in the digital phantom studies, and the similar gains can be obtained in the porcine data experiment, as shown in Section 3. The results further indicate that the presented MPD-AwTTV deconvolution algorithm has a bright prospect in clinical applications for a significant reduction of radiation exposure to patients.
It is worth to note that the presented MPD-AwTTV deconvolution algorithm also has some potential limitations. The first one is the parameter tuning. It is well known that optimizing all the parameters is a difficult task and there is still no global tactic for choosing them in most CT reconstruction/deconvolution applications. In order to choose the best value, in our studies, we applied a range of parameters and identified the ones that result in the best results based on the visual inspection or other empirical determination. Therefore, the parameters varied case by case and were chosen manually for optimal results in this study. In addition, in this study, we have shown that the final results estimated from the MPD AwTTV deconvolution algorithm could heuristically converge to an acceptable solution with the rRMSE metric in the phantom study (Fig. 1). This study can provide a valuable instruction for parameters selection in clinical patient imaging. In practice, more extensive experiments must be performed to optimize them which is also our further work. Second, the calculation of anisotropic weights in the AwTTV regularization unavoidably increases the calculative burden. In practice, a dedicated hardware and software can be introduced with significant efficiency. In addition, the presented MPD-AwTTV does not consider the cardiac motion within or between simulated/preclinical scans on the basis that the gantry rotation speeds have increased and the ECG-triggered technique is introduced which may freeze the cardiac motion. However, in clinical application, the individual frames may suffer from acquisition artifacts (Bindschadler et al 2014). Therefore, adopting some robust registration (Isola et al 2011) or motion correction (Bian et al 2015) techniques to compensate for these artifacts could be another significant task in the future study. Last but not the least, it is noted that severe noise-induced artifacts are present in the MPHM calculated by the sSVD deconvolution algorithm in Figs. 3, 6 and 8 because the sSVD algorithm is well known to be sensitive to noise. However, there are denoising algorithms to first remove the noise before using the sSVD deconvolution algorithm, which have been shown to significantly improve its performance, such as time-intensity profile similarity (TIPS) bilateral filter (Mendrik et al2011), previous normal-dose scan induced nonlocal means (ndiNLM) filter (Ma et al 2011) and sequential-images iterative reconstruction approach (Ma et al 2012b). Further studies are warranted to validate the effectiveness of combining the sSVD deconvolution algorithm with other denoising algorithms.
In this work, we presented a robust dynamic MPCT deconvolution framework by incorporating the AwTTV model under the low dose context. In clinics, the presented algorithm could potentially applied in other application, such as dynamic CT cerebral perfusion imaging (Ma et al 2012b, Fang et al 2015), dynamic PET imaging (Lu et al 2012), and 4D CT imaging (Zhang et al 2014), which may be another topic in our future research.
Acknowledgments
This work was supported in part by the National Natural Science Foundation of China under Grants 81371544, 61571214, 81501466 and 81501541, the National Science and Technology Major Project of the Ministry of Science and Technology of China under Grants 2014BAI17B02, Guangdong Natural Science Foundation under Grants 2015A030313271, 2014A030310243 and 2015A030310018, and the Science and Technology Program of Guangzhou, China under Grant 201510010039. Z. Zhang also was supported in part by the National Natural Science Foundation of China under Grant 81301217 and Tianjin Research Program of Application Foundation and Advanced Technology under Grant 14JCZDJC57000. Z. Liang also was supported in part by the National Institutes of Health and the National Cancer Institute under Grants CA143111 and CA082402.
References
- Achenbach S, Goroll T, Seltmann M, Pflederer T, Anders K, Ropers D, Daniel WG, Uder M, Lell M, Marwan M. Detection of coronary artery stenoses by low-dose, prospectively ECG-triggered, high-pitch spiral coronary CT angiography. JACC: Cardiovasc. Imaging. 2011;4:328–337. doi: 10.1016/j.jcmg.2011.01.012. [DOI] [PubMed] [Google Scholar]
- Badea CT, Johnston SM, Subashi E, Qi Y, Hedlund LW, Johnson GA. Lung perfusion imaging in small animals using 4D micro-CT at heartbeat temporal resolution. Med. Phys. 2010;37:54–62. doi: 10.1118/1.3264619. [DOI] [PMC free article] [PubMed] [Google Scholar]
- Beck A, Teboulle M. A fast iterative shrinkage-thresholding algorithm for linear inverse problems. SIAM J. Imaging Sci. 2009;2:183–202. [Google Scholar]
- Becker A, Becker C. CT imaging of myocardial perfusion: possibilities and perspectives. J. Nucl. Cardiol. 2013;20:289–296. doi: 10.1007/s12350-013-9681-7. [DOI] [PubMed] [Google Scholar]
- Bian Z, Gong C, Zeng D, Niu S, Zhang H, Zhang Z, Ma J. Fully Three-Dimensional Image Reconstruction in Radiology and Nuclear Medicine, Fully 3D Image Reconstruction in Radiology and Nuclear Medicine. Newport, Rhode Island, USA: 2015. [31 May-5 June 2015]. Motion Adaptive Sparsity Prior for Low-dose Dynamic CT Myocardial Perfusion Imaging. [Google Scholar]
- Bindschadler M, Modgil D, Branch KR, La Riviere PJ, Alessio AM. Comparison of blood flow models and acquisitions for quantitative myocardial perfusion estimation from dynamic CT. Phys Med. Biol. 2014;59:1533–1556. doi: 10.1088/0031-9155/59/7/1533. [DOI] [PMC free article] [PubMed] [Google Scholar]
- Calamante F, Gadian DG, Connelly A. Delay and dispersion effects in dynamic susceptibility contrast MRI: simulations using singular value decomposition. Magn. Reson. Med. 2000;44:466–473. doi: 10.1002/1522-2594(200009)44:3<466::aid-mrm18>3.0.co;2-m. [DOI] [PubMed] [Google Scholar]
- Modgil D, Alession AM, Bindschadler MD, La Riviere PJ. Sinogram smoothing techniques for myocardial blood flow estimation from dose-reduced dynamic CT. J. Med. Imaging. 2014;1:34004. doi: 10.1117/1.JMI.1.3.034004. [DOI] [PMC free article] [PubMed] [Google Scholar]
- Dewey M, Zimmermann E, Deissenrieder F, Laule M, Dubel HP, Schlattmann P, Knebel F, Rutsch W, Hamm B. Noninvasive coronary angiography by 320-row computed tomography with lower radiation exposure and maintained diagnostic accuracy: comparison of results with cardiac catheterization in a head-to-head pilot investigation. Circulation. 2009;120:867–875. doi: 10.1161/CIRCULATIONAHA.109.859280. [DOI] [PubMed] [Google Scholar]
- Ebersberger U, Marcus RP, Schoepf UJ, Lo GG, Wang Y, Blanke P, Geyer LL, Gray JC, McQuiston AD, Cho YJ, Scheuering M, Canstein C, Nikolaou K, Hoffmann E, Bamberg F. Dynamic CT myocardial perfusion imaging: performance of 3D semi-automated evaluation software. Eur. Radiol. 2014;24:191–199. doi: 10.1007/s00330-013-2997-5. [DOI] [PubMed] [Google Scholar]
- Fang R, Zhang S, Chen T, Sanelli PC. Robust low-dose CT perfusion deconvolution via tensor total-variation regularization. IEEE Trans. Med. Imaging. 2015;34:1533–1548. doi: 10.1109/TMI.2015.2405015. [DOI] [PMC free article] [PubMed] [Google Scholar]
- Isola AA, Schmitt H, van Stevendaal U, Begemann PG, Coulon P, Boussel L, Grass M. Image registration and analysis for quantitative myocardial perfusion: application to dynamic circular cardiac CT. Phys. Med. Biol. 2011;56:5925–5947. doi: 10.1088/0031-9155/56/18/010. [DOI] [PubMed] [Google Scholar]
- Jerosch-Herold M, Swingen C, Seethamraju RT. Myocardial blood flow quantification with MRI by model-independent deconvolution. Med. Phys. 2002;29:886–897. doi: 10.1118/1.1473135. [DOI] [PubMed] [Google Scholar]
- Lauzier PT, Tang J, Speidel MA, Chen G. Noise spatial nonuniformity and the impact of statistical image reconstruction in CT myocardial perfusion imaging. Med. Phys. 2012;39:4079. doi: 10.1118/1.4722983. [DOI] [PMC free article] [PubMed] [Google Scholar]
- Likhite D, Adluru G, Hu N, McGann C, DiBella E. Quantification of myocardial perfusion with self-gated cardiovascular magnetic resonance. J. Cardiovasc. Magn. Reson. 2015;17:14. doi: 10.1186/s12968-015-0109-1. [DOI] [PMC free article] [PubMed] [Google Scholar]
- Lin LI. A concordance correlation coefficient to evaluate reproducibility. Biometrics. 1989;40:255–268. [PubMed] [Google Scholar]
- Lin Y, Semei E. An efficient polyenergetic SART (pSART) reconstruction algorithm for quantitative myocardial CT perfusion. Med. Phys. 2014;41:021911. doi: 10.1118/1.4863481. [DOI] [PubMed] [Google Scholar]
- Liu Y, Ma J, Fan Y, Liang Z. Adaptive-weighted total variation minimization for sparse data toward low-dose x-ray computed tomography image reconstruction. Phys. Med. Biol. 2012;57:7923–7956. doi: 10.1088/0031-9155/57/23/7923. [DOI] [PMC free article] [PubMed] [Google Scholar]
- Lu L, Karakatsanis NA, Tang J, Chen W, Rahmin A. 3.5D dynamic PET image reconstruction incorporating kinetics-based clusters. Phys. Med. Biol. 2012;57:5035–5055. doi: 10.1088/0031-9155/57/15/5035. [DOI] [PMC free article] [PubMed] [Google Scholar]
- Ma J, Feng Q, Feng Y, Huang J, Chen W. Generalized Gibbs priors based positron emission tomography reconstruction. Comput. Biol. Med. 2010;40:565–571. doi: 10.1016/j.compbiomed.2010.03.012. [DOI] [PubMed] [Google Scholar]
- Ma J, Huang J, Feng Q, Zhang H, Lu H, Liang Z, Chen W. Low-dose computed tomography image restoration using previous normal-dose scan. Med. Phys. 2011;38:5713–5731. doi: 10.1118/1.3638125. [DOI] [PMC free article] [PubMed] [Google Scholar]
- Ma J, Liang Z, Fan Y, Liu Y, Huang J, Chen W, Lu H. Variance analysis of x-ray CT sinograms in the presence of electronic noise background. Med. Phys. 2012a;39:4051–4065. doi: 10.1118/1.4722751. [DOI] [PMC free article] [PubMed] [Google Scholar]
- Ma J, Zhang H, Gao Y, Huang J, Liang Z, Feng Q, Chen W. Iterative image reconstruction for cerebral perfusion CT using a pre-contrast scan induced edge-preserving prior. Phys. Med. Biol. 2012b;57:7519–7542. doi: 10.1088/0031-9155/57/22/7519. [DOI] [PMC free article] [PubMed] [Google Scholar]
- McCommis KS, Zhang H, Goldstein TA, Misselwitz B, Abendschein DR, Gropler RJ, Zheng J. Myocardial blood volume is associated with myocardial oxygen consumption: an experimental study with cardiac magnetic resonance in a canine model. JACC: Cardiovasc. Imaging. 2009;2:1313–1320. doi: 10.1016/j.jcmg.2009.07.010. [DOI] [PMC free article] [PubMed] [Google Scholar]
- Mendrik AM, Vonken EJ, van Ginneken B, de Jong HW, Riordan A, van Seeters T, Smit EJ, Viergever MA, Prokop M. TIPS bilateral noise reduction in 4D CT perfusion scans produces high-quality cerebral blood flow maps. Phys. Med. Biol. 2011;56:3857–3872. doi: 10.1088/0031-9155/56/13/008. [DOI] [PubMed] [Google Scholar]
- Niu S, Gao Y, Bian Z, Huang J, Chen W, Yu G, Liang Z, Ma J. Sparse-view x-ray CT reconstruction via total generalized variation regularization. Phys. Med. Biol. 2014;59:2997–3017. doi: 10.1088/0031-9155/59/12/2997. [DOI] [PMC free article] [PubMed] [Google Scholar]
- Ostergaard L, Weisskoff RM, Chesler DA, Gyldensted C, Rosen BR, Andersson M. High resolution measurement of cerebral blood flow using intravascular tracer bolus passages. Part I Mathematical approach and statistical analysis. Magn. Reson. Med. 1996;36:715–725. doi: 10.1002/mrm.1910360510. [DOI] [PubMed] [Google Scholar]
- Patel AR, Bhave NM, Mor-Avi V. Myocardial perfusion imaging with cardiac computed tomography: state of the art. J. Cardiovasc. Transl. Res. 2013;6:695–707. doi: 10.1007/s12265-013-9499-3. [DOI] [PubMed] [Google Scholar]
- Perona P, Malik J. Scale-space and edge-detection using anisotropic diffusion. IEEE Trans. Pattern Anal. 1990;12:629–639. [Google Scholar]
- Ramirez-Giraldo JC, Yu L, Kantor B, Ritman EL, McCollough CH. A strategy to decrease partial scan reconstruction artifacts in myocardial perfusion CT: phantom and in vivo evaluation. Med. Phys. 2012;39:214–223. doi: 10.1118/1.3665767. [DOI] [PMC free article] [PubMed] [Google Scholar]
- Rossi A, Merkus D, Klotz E, Mollet N, de Feyter PJ, Krestin GP. Stress myocardial perfusion:imaging with multidetector CT. Radiology. 2014;270:25–46. doi: 10.1148/radiol.13112739. [DOI] [PubMed] [Google Scholar]
- Sawall S, Kuntz J, Socher M, Knaup M, Hess A, Bartling S, Kachelrieβ M. Imaging of cardiac perfusion of free-breathing small animals using dynamic phase-correlated micro-CT. Med. Phys. 2012;39:7499–7506. doi: 10.1118/1.4762685. [DOI] [PubMed] [Google Scholar]
- Segars WP, Sturgeon G, Mendonca S, Grimes J, Tsui BM. 4D XCAT phantom for multimodality imaging research. Med. Phys. 2010;37:4902–4915. doi: 10.1118/1.3480985. [DOI] [PMC free article] [PubMed] [Google Scholar]
- So A, Lee T. Quantitative myocardial CT perfusion: a pictorial review and the current state of technology development. J. Cardiovasc. Comput. Tomogr. 2011a;5:467–481. doi: 10.1016/j.jcct.2011.11.002. [DOI] [PubMed] [Google Scholar]
- So A, Lee T, Imai Y, Narayanan S, Hsieh J, Kramer J, Procknow K, Leipsic J, LaBounty T, Min J. Quantitative myocardial perfusion imaging using rapid kVp switch dual-energy CT: preliminary experience. J. Cardiovasc. Comput. Tomogr. 2011b;5:430–442. doi: 10.1016/j.jcct.2011.10.008. [DOI] [PubMed] [Google Scholar]
- Speidel MA, Bateman CL, Tao Y, Raval AN, Hacker TA, Reeder SB, Van Lysel MS. Reduction of image noise in low tube current dynamic CT myocardial perfusion imaging using HYPR processing: a time-attenuation curve analysis. Med. Phys. 2013;40:011904. doi: 10.1118/1.4770283. [DOI] [PMC free article] [PubMed] [Google Scholar]
- Tao Y, Chen GH, Hacker TA, Raval AN, Van Lysel MS, Speidel MA. Low dose dynamic CT myocardial perfusion imaging using a statistical iterative reconstruction method. Med. Phys. 2014;41:071914. doi: 10.1118/1.4884023. [DOI] [PMC free article] [PubMed] [Google Scholar]
- Troalen T, Capron T, Bernard M, Kober F. In vivo characterization of rodent cyclic myocardial perfusion variation at rest and during adenosine-induced stress using cine-ASL cardiovascular magnetic resonance. J. Cardiovasc. Magn. Reson. 2014;16:18. doi: 10.1186/1532-429X-16-18. [DOI] [PMC free article] [PubMed] [Google Scholar]
- Wang J, Li T, Liang Z, Xing L. Dose reduction for kilovotage cone-beam CT in radiation therapy. Phys. Med. Biol. 2008;53:2897–2909. doi: 10.1088/0031-9155/53/11/009. [DOI] [PubMed] [Google Scholar]
- Wang Z, Bovik AC, Sheikh HR, Simoncelli EP. Image quality assessment: from error visibility to structural similarity. IEEE Trans. Image Process. 2004;13:600–612. doi: 10.1109/tip.2003.819861. [DOI] [PubMed] [Google Scholar]
- Zeng D, Huang J, Bian Z, Niu S, Zhang H, Feng Q, Liang Z, Ma J. A simple low-dose X-ray scan CT simulation from high-dose scan. IEEE Trans. Nucl. Sci. 2015;62:2226–2233. doi: 10.1109/TNS.2015.2467219. [DOI] [PMC free article] [PubMed] [Google Scholar]
- Zhang H, Ouyang L, Huang J, Ma J, Chen W, Wang J. Few-view cone-beam CT reconstruction with deformedprior. image Med Phys. 2014;41:121905. doi: 10.1118/1.4901265. [DOI] [PubMed] [Google Scholar]
- Zierler K. Theoretical basis of indicator-dilutionmethods for measuring fiow and volurne. Circ. Res. 1962;10:393–407. [Google Scholar]
- Zierler K. Indicator dilution methods for measuring blood fiow volurne and other properties of biological systems: a briefhistory and memoir. Ann. Biomed Eng. 2000;28:836–848. doi: 10.1114/1.1308496. [DOI] [PubMed] [Google Scholar]


