

Abstract
Chromatin modifications shape cell heterogeneity by activating and repressing defined sets of genes involved in cell proliferation, differentiation and development. Polycomb‐repressive complexes (PRCs) act synergistically during development and differentiation by maintaining transcriptional repression of common genes. PRC2 exerts this activity by catalysing H3K27 trimethylation. Here, we show that in the intestinal epithelium PRC2 is required to sustain progenitor cell proliferation and the correct balance between secretory and absorptive lineage differentiation programs. Using genetic models, we show that PRC2 activity is largely dispensable for intestinal stem cell maintenance but is strictly required for radiation‐induced regeneration by preventing Cdkn2a transcription. Combining these models with genomewide molecular analysis, we further demonstrate that preferential accumulation of secretory cells does not result from impaired proliferation of progenitor cells induced by Cdkn2a activation but rather from direct regulation of transcription factors responsible for secretory lineage commitment. Overall, our data uncover a dual role of PRC2 in intestinal homeostasis highlighting the importance of this repressive layer in controlling cell plasticity and lineage choices in adult tissues.
Keywords: chromatin modifications, H3K27 methylation, intestinal homeostasis and differentiation, polycomb, PRC2
Subject Categories: Chromatin, Epigenetics, Genomics & Functional Genomics; Development & Differentiation; Stem Cells
Introduction
Morphology, size and cell composition of adult organs are shaped by the activation of defined transcriptional programs, which have to be tightly regulated in time and space, both during embryonic development and adult life. Highly dynamic adult tissues are actively and constantly regenerated throughout life to preserve their homeostasis. This balance is controlled by transcriptional changes imposed by the environment that can rapidly lead to modifications of cell composition and specification and, under specific circumstances, can affect organ functionality.
The intestinal epithelium is structurally organized in crypts and villi. It is one of the most dynamic tissues of the body, with an entire cell renewal every 4–5 days. Intestinal homeostasis is guaranteed by multipotent stem cells (ISCs) located at the base of intestinal crypts, characterized by the expression of the R‐spondin receptor LGR5. Upon an extensive damage that compromises LGR5+ cell viability, committed cycling or quiescent progenitors (mainly from the secretory lineage) located at the border of the stem cell niche (i.e. Dll1+ cells) are able to revert their differentiation status (eventually re‐entering the cell cycle) and repopulate the stem cell niche, regenerating LGR5+ cells (Barker, 2014; Tetteh et al, 2015). Stem cells rapidly divide to give rise to highly proliferative progenitor cells—the transit‐amplifying (TA) cells, which proliferate, gradually differentiate, and migrate towards the tip of the villus axis, where they undergo apoptosis and are shed into the intestinal lumen. The numerous differentiated cell types composing the adult intestinal epithelium can be roughly divided into two distinct categories: absorptive and secretory cells. Absorptive enterocytes are the most abundant cells in the small intestine. In the small intestine, secretory cells include mucous‐secreting goblet cells, hormone‐producing enteroendocrine cells, tuft cells, and Paneth cells. Paneth cells are the only differentiated cells that reside at the crypt bottom, where they produce anti‐microbial peptides and sustain the stem cell niche. In the large intestine, secretory cells—mainly goblet cells—are more abundant than absorptive cells, creating an absorptive to secretory cell gradient that follows the anterior to posterior axis of the entire intestinal tract (Barker, 2014).
Lineage fate is mainly regulated by the expression of two different transcription factors, HES1 and ATOH1, which are tightly controlled by NOTCH signalling (van Es et al, 2005; Fre et al, 2005; VanDussen & Samuelson, 2010; VanDussen et al, 2012). ATOH1 expression is required for secretory lineage determination, and its loss of function results in the complete loss of secretory cells in vivo (Yang et al, 2001). ATOH1 controls distinct transcription factors, which in turn define distinct secretory cell types (VanDussen & Samuelson, 2010; VanDussen et al, 2012). In contrast, absorptive lineage commitment is established through NOTCH‐dependent repression of Atoh1, which is directly mediated by the NOTCH‐activated transcription factor HES1 (Jensen et al, 2000; Zecchini et al, 2005; van Es et al, 2010; Kazanjian et al, 2010; Kim & Shivdasani, 2011; Ueo et al, 2012).
Maintaining transcriptional repression is a crucial mechanism for establishing and maintaining cell identity and homeostasis (Chiacchiera et al, 2013; Chen & Dent, 2014). Transcriptional repression is preserved through the activity of different chromatin modifying activities. In metazoans, Polycomb group proteins maintain transcriptional repression by two distinct, multiprotein Polycomb‐repressive complexes (PRCs), likely by promoting chromatin compaction and limiting DNA accessibility. While PRC1 monoubiquitinates histone H2A on lysine K119 (H2Aub1), PRC2 establishes transcriptional repression by trimethylating histone H3K27 (H3K27me3). PRC1 and PRC2 localize together at CpG‐rich transcription start sites (TSS), where they are consecutively recruited to repress their common target genes (Scelfo et al, 2015). While PRC2 exerts its functions in a unique complex with variations only in a few ancillary subunits that are not required for its intrinsic enzymatic activity, PRC1 exists in at least four to six forms, which have distinct biochemical features and proprieties. All of these forms can contribute to the deposition of H2Aub1, highlighting the complexity and redundancy of the PRC1 functions (Gao et al, 2012).
The methyltransferase activity of PRC2 is carried out by one of two paralogs, EZH2 and EZH1. However to be enzymatically active, both catalytic subunits require two structural subunits, EED and SUZ12. These two subunits are essential for intrinsic enzymatic activity, and their loss of function results in the complete loss of H3K27me3 deposition and disruption of the PRC2 complex. Consistently, while the loss of EZH2 alone produces only mild phenotypes in other tissues, the loss of Eed or the co‐inactivation of EZH1 and EZH2 severely affect homeostasis, for instance in the hair follicle or in the haematopoietic compartment, suggesting that EZH1 and EZH2 can have redundant roles (Su et al, 2003; Chen et al, 2009; Ezhkova et al, 2011; Juan et al, 2011; Xie et al, 2014).
We have recently demonstrated that global PRC1 activity is required to preserve intestinal stem cell identity by maintaining transcriptional repression of non‐lineage‐specific transcription factors, some of which directly interfere with the Wnt signalling pathway, leading to rapid stem cell exhaustion (Chiacchiera et al, 2016). Here, we have analysed the role of the PRC2 complex in maintaining homeostasis of the intestinal epithelium. In contrast to the essential role of PRC1 in preserving stem cell self‐renewal, loss of PRC2 was found to be dispensable for homeostatic intestinal regeneration. However, lack of PRC2 activity prevented radiation‐induced epithelial regeneration, suggesting a role for PRC2 in maintaining precursor cell plasticity at the crypt bottom. By conditionally deleting Eed expression in the adult intestine, we showed that PRC2 activity is required to preserve the proliferation of the TA compartment and, at the same time, to control the balance between secretory and absorptive lineage differentiation. Combining genetic models and genomewide location and expression analyses, we further demonstrated that these are distinct phenotypes. Specifically, cell proliferation defects in TA cells were dependent on derepression of Cdkn2a expression, while the accumulation of secretory cells resulted from a loss of direct transcriptional control of the master regulators of secretory lineage and goblet specification, ATOH1 and GFI1.
Results
EED is required to maintain cell proliferation and restrict goblet cell differentiation
It is well established that PRC2 activity is redundantly maintained by the activities of EZH2 and EZH1, which are both able to contribute H3K27 methylation (Margueron et al, 2008; Shen et al, 2008). To study the role of PRC2 activity in the intestinal epithelium, in which both Ezh1 and Ezh2 are expressed (Table EV1), we directly targeted the essential PRC2 component EED to disrupt PRC2 activity with a Cre‐dependent conditional mouse model that abrogates Eed expression by deleting exons 3–6 (Xie et al, 2014). To achieve intestinal tissue specificity, we crossed these mice with a transgenic line expressing a Cyp1a1 promoter‐driven Cre recombinase (AhCre), which is activated by β‐naphthoflavone (βNF), an aryl hydrocarbon receptor agonist (Ireland et al, 2004). These mice have been extensively used to induce genetic recombination specifically in the intestinal epithelium (van Es et al, 2005; Sansom et al, 2007).
Consistent with its essential role for PRC2 activity, Eed loss in AhCre Eed fl/fl mice at 15 days after the first βNF administration dramatically impaired the ability of PRC2 to methylate histone H3 in all intestinal epithelial cells. This effect was specific for H3K27 methylation and did not affect H2Aub1 deposition (Figs 1A and B, and EV1A and B). This suggests that the overall PRC1 activity remained unaltered in the absence of PRC2 in this tissue. Importantly, the loss of H3K27me3/2 was maintained for more than 30 days without any sign of counterselection. To further validate this observation using an independent reporter, we crossed the AhCre Eed fl/fl mice with Rosa26‐LsL‐LacZ transgene. After 30 days from the first βNF administration, the β‐galactosidase activity was fully maintained in the entire tissue (Fig EV1C), which—considering the fast renewal time of the intestinal epithelium—strongly suggests that loss of PRC2 does not affect the intestinal stem cell compartment. Consistent with this, the overall health and weight of these mice remained unaltered with respect to the control mice. However, the histological analysis performed 15 days after Cre induction still revealed a marked alteration in the crypt–villus architecture in the small intestine of Eed fl/fl mice (Figs 1C and EV2A). A clear defect in cell proliferation, which specifically occurred in the TA compartment, was highlighted by a reduced number of KI67‐positive cells (Fig 1D) and by a reduced expression of several proliferation markers within the intestinal crypts (Fig 1E) and with an increased expression of Ccnd1 consistent with a G1 arrest. However, this reduced proliferation capability of the progenitor compartment did not alter the overall homeostasis of the tissue. In addition, staining aimed to highlight mucus‐secreting cells within the tissue (PAS and Alcian blue) revealed a marked increase in the number of goblet cells upon specific loss of EED expression (Figs 2A and B, EV2B and EV3A). In the absence of PRC2 activity, the number of goblet cells within small intestinal crypts and villi doubled (Fig 2C), and lysozyme‐expressing cells were delocalized from the bottom of the stem cell niche (Fig 2D). Increased number of enteroendocrine (ChgA‐positive) cells was also observed, whereas tuft (Dclk1‐positive) cells were not affected (Fig EV3B). Alkaline phosphatase staining, a marker of enterocytes, was not significantly perturbed (Fig 2D), suggesting that loss of PRC2 activity affects secretory lineage commitment without altering global enterocytic differentiation. Costaining of proliferating (KI67+) and goblet cells (Alcian blue‐positive) showed a reduction, but not a complete loss, of the TA compartment, with several cells actively proliferating at the very bottom of the crypt (Fig 2D). Lgr5‐positive stem cells appear grossly normal in the absence of EED (Fig 2E), consistent with the overall normal maintenance of intestinal homeostasis in AhCre Eed −/− mice. All these data suggest that PRC2 activity is dispensable for ISC maintenance but required for maintaining progenitor cell proliferation and to coordinate cell differentiation programs throughout the intestinal epithelium.
Figure 1. Loss of Eed affects H3K27 methylation and reduces proliferating cells in the intestinal epithelium.
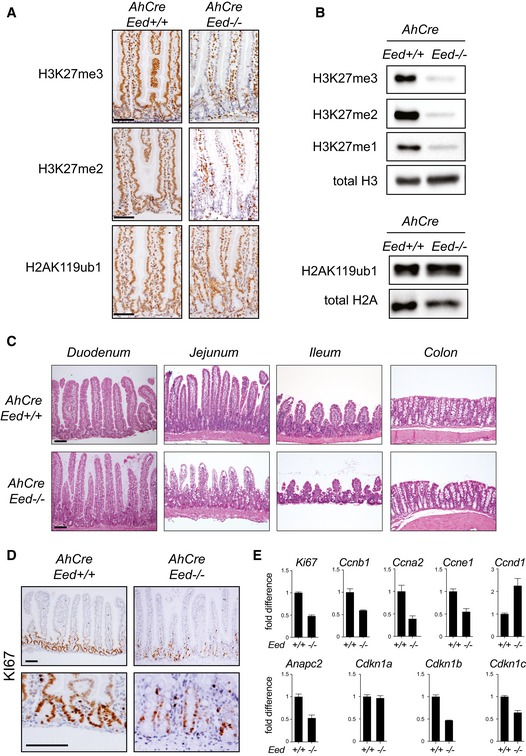
- Immunohistochemistry analysis of small intestinal sections, using the indicated antibodies.
- Western blot analysis with protein extracts obtained from ex vivo‐purified intestinal crypts and probed with the indicated antibodies.
- Haematoxylin and eosin staining of sections prepared from different intestinal tracts.
- Immunohistochemistry analysis of small intestinal sections, using specific antibodies for the proliferation marker KI67.
- Expression analysis by qRT–PCR of the proliferation‐related markers indicated in the figure using RNA extracted from intestinal crypts. Graphs show mean ± SD for three replicates.
Figure EV1. Loss of Eed affects H3K27 methylation.

- Wider fields of the same immunohistochemistry staining presented in Fig 1A, performed on small intestinal sections from AhCre Eed +/+ and AhCre Eed fl/fl mice injected with β‐naphthoflavone and sacrificed after 15 days, using the indicated antibodies.
- Immunohistochemistry of small intestinal sections from AhCre Eed +/+ and AhCre Eed fl/fl mice using an H3K27me3‐specific antibody, analysed 30 days after β‐naphthoflavone injection (n = 5).
- Whole intestine isolated from AhCre Eed +/+ and AhCre Eed fl/fl crossed with knock‐in mice expressing Rosa26‐driven Cre‐inducible LacZ transgene stained (left panels) for β‐galactosidase activity, 30 days after the first β‐naphthoflavone administration. Sections of the β‐galactosidase‐stained small intestines are presented in the right panels (n = 4).
Figure EV2. Eed loss perturbs intestinal architecture and increases goblet cell numbers.

- Haematoxylin and eosin staining of sections prepared from the different intestinal tracts.
- PAS staining performed on sections prepared from the different intestinal tracts.
Figure 2. Loss of Eed perturbs cell differentiation in the intestinal epithelium.

-
A, BPAS (A)and Alcian blue (B) staining of sections prepared from the different intestinal tracts isolated from AhCre Eed +/+ and AhCre Eed fl/fl mice (n = 5) injected with β‐naphthoflavone and sacrificed after 15 days.
-
CQuantification (mean ± SD) of goblet cells in crypts and villi from the same mice shown in (A and B). More than 100 crypts and villi were scored for each condition after 15 days from the first β‐naphthoflavone administration.
-
DImmunohistochemistry analyses in AhCre Eed +/+ and AhCre Eed fl/fl mice injected with β‐naphthoflavone and sacrificed after 15 days using a lysozyme‐specific antibody (upper panels: LYZ, a Paneth cell‐specific marker). Histochemical assay probing for alkaline phosphatase activity is presented in the middle panels (ALPI, an enterocyte‐specific marker). Combined KI67 immunohistochemistry and histochemical Alcian blue staining is presented in the lower panels (Alcian/KI67).
-
EGFP expression from an Lgr5‐eGFP transgene identifying LGR5+ ISCs in near‐native agarose‐embedded sections from Eed +/+ and Eed −/− mice at 30 days from the first β‐naphthoflavone administration. Cell nuclei were counterstained with DAPI.
Figure EV3. Eed loss increases the number of goblet and enteroendocrine cells.

- Alcian blue staining on sections prepared from the different intestinal tracts. AhCre Eed +/+ and AhCre Eed fl/fl mice were sacrificed 7 or 30 days after β‐naphthoflavone administration.
- Immunohistochemistry analyses of small intestinal sections from AhCre Eed +/+ and AhCre Eed fl/fl mice isolated 15 days after β‐naphthoflavone administration using ChgA (an enteroendocrine marker)‐ and Dclk1 (a tuft cell marker)‐specific antibodies. Quantifications of positive cells per crypt for each staining are presented on the right (mean ± SD). More than 100 crypts were scored for each condition.
Loss of EED affects cell plasticity at the crypt bottom
The intestinal epithelium displays a considerable high level of plasticity at the crypt level, which ensures regular and damage‐induced regeneration. Under physiological conditions, intestinal regeneration is maintained by LGR5+ multipotent stem cells that reside at the crypt bottom intercalated between Paneth cells. Depletion of LGR5+ cells by irradiation, chemicals or diphtheria toxin‐mediated apoptosis leads to the activation of a reserve stem cell population mainly composed by secretory precursors. These cells revert from a secretory commitment or a quiescent status, to LGR5+ stem cells, allowing crypt regeneration (Barker, 2014; Tetteh et al, 2015). We took advantage of the irradiation sensitivity of LGR5+ stem cells to investigate the role of PRC2 activity in maintaining cell plasticity at the crypt bottom. Fifteen days after βNF injection, both AhCre and AhCre Eed fl/fl mice were exposed to 10 Gy. Animals were sacrificed at 4 or 8 days post‐irradiation (Fig 3A). Around day 8, AhCre Eed fl/fl mice started to specifically suffer and had to be sacrificed for ethical reasons. Control mice clearly showed active intestinal regeneration. In contrast, histological analysis of Eed −/− epithelia demonstrated that loss of PRC2 activity severely affected irradiation‐induced intestinal regeneration in both small intestine and colon (Fig 3A). This was further confirmed by the nearly complete absence of proliferating cells in Eed −/− intestinal epithelium compared with wild type after 8 days from irradiation (Fig 3B). As expected, we observed that the number of proliferating cells in the regenerating wild‐type epithelium was increased compared with the non‐irradiated counterpart (Fig 3C). Importantly, the number of proliferating cells in the irradiated Eed −/− intestinal epithelium was up to ten‐fold reduced with respect to the non‐irradiated counterpart (Fig 3C), suggesting that the stem cell pool, which fuels the physiological turnover of intestinal epithelial cells, was not regenerated in the absence of PRC2 activity after irradiation. Since the formation of organoids (or mini‐guts) from isolated intestinal crypts could mimic conditions similar to tissue regeneration, we tested the ability of Eed −/− crypts to generate organoids in vitro. For this, we induced Eed loss in AhCre Eed fl/fl mice by administrating βNF 9 days before crypt isolation. Wild‐type and Eed knockout (KO) crypts were isolated ex vivo and embedded in Matrigel, to form organoids with crypt‐like protrusions. Under these conditions, Eed KO crypts consistently failed to form functional mini‐guts in vitro (Fig 3D), in line with our in vivo regeneration results. However, if Eed loss was induced in fully formed mini‐guts obtained for Rosa26‐Cre ERT2 ‐Eed fl/fl mice by OHT administration, organoid growth was only mildly affected, with no changes in overall homeostasis (Fig EV4A–C). Removal of RSPO1 from the culture media dramatically compromised organoid growth already after 24 h, demonstrating that a time window of 5 days is sufficient to observe an impaired organoid homeostasis (Fig EV4D). These results agree with the dispensable role of PRC2 activity during normal tissue homeostasis. Overall, these data demonstrate that PRC2 activity is required to maintain the plasticity of cells residing at the crypt bottom after severe crypt damage.
Figure 3. Loss of Eed affects cell plasticity at the bottom of the crypt.
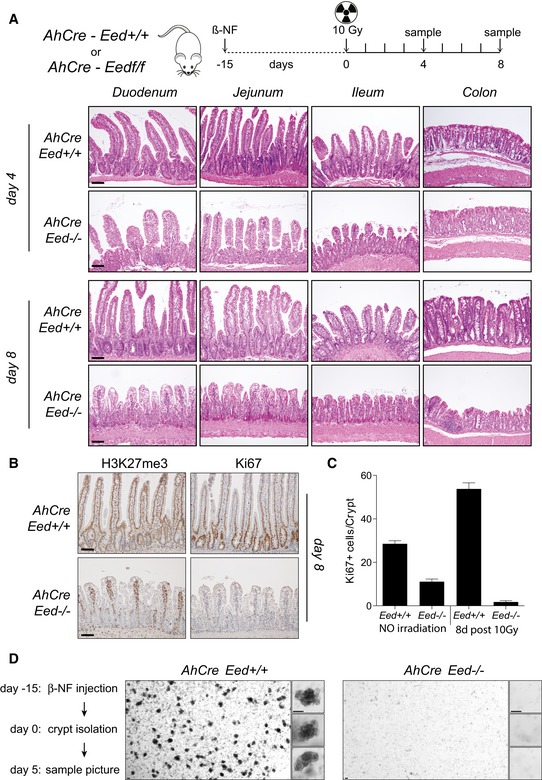
- Radiation‐induced intestinal regeneration: AhCre Eed +/+ and AhCre Eed fl/fl mice were injected with β‐naphthoflavone, irradiated with 10 Gy 15 days later, and sacrificed 4 and 8 days after irradiation. Sections prepared from the different intestinal tracts were stained with haematoxylin and eosin (n = 6).
- Immunohistochemistry analyses in AhCre Eed +/+ and AhCre Eed fl/fl mice treated as in (A) using H3K27me3‐ and KI67‐specific antibodies at 8 days post‐irradiation.
- Quantification (mean ± SD) of KI67‐positive cells per crypt (B). More than 100 crypts were scored for each condition.
- In vitro organoid formation using crypts isolated from AhCre Eed +/+ and AhCre Eed −/− mice 15 days after the first β‐naphthoflavone injection. Pictures of organoids were taken 5 days later at low and higher magnification (insets).
Figure EV4. Loss of Eed does not alter general organoids homeostasis.

- In vitro organoids formation using crypts isolated from Rosa26 CreER T2 Eed +/+ and Eed fl/fl mice treated after 4 days with 4‐OHT or EtOH (as control). Organoid homeostasis was monitored for additional 5 days (day 9).
- Quantifications of the analysis presented in (A) after 5 days of OHT or EtOH treatment (mean ± SD; n = 3).
- Western blot analysis of the organoids presented in (A) at day 9 using EED‐specific antibodies. Vinculin is presented as a loading control.
- In vitro organoids formation using crypts isolated from wild‐type mice. RSPO1 was removed after 4 days (t0) and the effects on organoids homeostasis were monitored 24 and 48 h after RSPO1 removal (t1 and t2, right panels).
PRC2 directly controls cell cycle progression and lineage commitment
To investigate the transcriptional program regulated by PRC2 in the intestinal epithelium, we performed deep RNA‐sequencing analysis (RNAseq) from intestinal crypts isolated at 15 days after Cre activation. A large number of genes were ectopically activated in Eed −/− crypts, confirming that PRC2 also has a major role in vivo in maintaining transcriptional repression (Fig 4A). Consistently, 70% of the upregulated genes were direct PRC2 targets, with accumulation of SUZ12 binding and H3K27me3 deposition at their promoters (Figs 4B and C, and EV5A) that become severely affected upon Eed inactivation (Fig EV5B). One of the most established and well characterized of the different targets through which Polycomb proteins maintain cell homeostasis is the Cdkn2a locus (also known as Ink4a/Arf). Both PRC complexes maintain this locus transcriptionally repressed, thereby preserving cell cycle progression by avoiding unnecessary cell cycle arrests (Sparmann & van Lohuizen, 2006; Bracken et al, 2007). Consistent with previous reports in other model systems (Bracken et al, 2007; Ezhkova et al, 2011; Piunti et al, 2014; Xie et al, 2014), we found that Cdkn2a is a direct target of PRC2 activity also in intestinal crypts (Fig 4D). Likewise, both Cdkn2a products (p16INK4A and p19ARF) underwent strong transcriptional reactivation upon loss of PRC2 activity, as shown both by RNAseq and quantitative real‐time PCR validations (qRT–PCR; Fig 4E and F). Together, these data suggest a direct role of PRC2 in repressing Cdkn2a in intestinal crypts. These defects seem to specifically affect the TA progenitor compartment (Figs 1D and 2D), suggesting that ISCs are not sensitive to the activation of this G1/S checkpoint. This hypothesis was further confirmed by the long‐time maintenance of intestinal homeostasis in AhCre Eed −/− mice.
Figure 4. Loss of Eed induces transcriptional activation of genes involved in cell cycle arrest and secretory lineage specification.

- Volcano plot showing the expression changes with a minimal fold change of 3 (FC = 3) at genomewide levels in AhCre Eed −/− crypts relative to AhCre Eed +/+ crypts 15 days after β‐naphthoflavone administration.
- Bar plot showing the percentage of H3K27me3‐positive promoters among the differentially regulated genes in Eed −/− crypts. All gene promoters and 5 independent random sampling of 167 gene promoters extracted from the mouse genome are presented as specificity controls.
- Intensity profiles for H3K27me3 and SUZ12 occupancy at the promoters of upregulated genes with respect to downregulated genes in Eed −/− crypts.
- Genomic snapshots of the Cdkn2a locus showing SUZ12 occupancy and H3K27me3 deposition at the promoter regions of both the p16 and the ARF isoforms.
- Genomic snapshots of the RNAseq profile of the Cdkn2a locus in AhCre Eed +/+ and AhCre Eed −/− crypts 15 days after β‐naphthoflavone administration.
- Expression analysis by qRT–PCR (mean ± SD) of both Cdkn2a isoforms (p16Ink4A and p19Arf) in AhCre Eed +/+ and AhCre Eed −/− crypts 15 days after β‐naphthoflavone administration.
- Gene set enrichment analysis (GSEA) using specific secretory and enterocytic transcriptional signatures with respect to the list of upregulated genes in Eed −/− crypts.
Figure EV5. PRC2 directly maintains transcriptional repression, and Eed loss increases goblet cell differentiation, independently from Cdkn2a activation.

- Venn diagrams showing the extent of overlap between SUZ12 occupancy and H3K27me3 deposition in wild‐type crypts with respect to the upregulated and downregulated genes in Eed −/− crypts.
- ChIP analyses for the indicated gene promoters using an H3K27me3‐specific antibody in crypts isolated from AhCre Eed +/+ and AhCre Eed fl/fl mice 15 days after β‐naphthoflavone administration. Primers amplifying the Nrk gene body are presented as negative PRC2 target.
- Alcian blue staining of sections prepared from different intestinal tracts isolated from AhCre Cdkn2a −/− Eed +/+ and AhCre Cdkn2a −/− Eed fl/fl mice 15 days after the first β‐naphthoflavone administration.
- Immunohistochemical analysis of small intestinal sections, using antibodies specific for H3K27me3 and lysozyme (LYZ, a Paneth cell marker) in AhCre Cdkn2a −/− Eed +/+ and AhCre Cdkn2a −/− Eed fl/fl mice 15 days after the first β‐naphthoflavone administration.
- In vitro organoid formation using crypts isolated from Rosa26 CreER T2 Cdkn2a +/+ Eed +/+ or Eed fl/fl and Rosa26 CreER T2 Cdkn2a −/− Eed +/+ or Eed fl/fl mice 9 days after the first tamoxifen injection (mean ± SD).
To gain further molecular insight about the accumulation of secretory cells in the Eed −/− intestinal epithelium, we compared published expression signatures specific for secretory and enterocytic progenitors with the list of upregulated genes in Eed −/− crypts. Gene set enrichment analysis (GSEA) demonstrated that the expression signature related to secretory lineage progenitors (Kim et al, 2014) was significantly enriched among the activated genes in Eed −/− crypts (enrichment score = 0.64, P < 0.001). In contrast, the expression signature for enterocyte progenitors (Kim et al, 2014) was not significantly enriched (Fig 4G; enrichment score = 0.16, P = 1). These data support a model in which loss of PRC2‐dependent transcriptional repression leads to a specific enrichment of the secretory progenitors.
Loss of EED independently induces cell cycle arrest and goblet cell accumulation
Skewing towards secretory cells could either result from the proliferative defects observed in TA cells or be a direct regulatory mechanism controlled by PRC2 activity. To investigate these possibilities, we crossed AhCre Eed fl/fl mice in a Cdkn2a −/− background. At 15 days after βNF administration, both histological and histochemical analyses for the secretory lineage (PAS and Alcian blue staining) demonstrated that loss of Cdkn2a expression was not sufficient to restore of the number of secretory cells to that observed in control animals (Figs 5A and B, and EV5C). Consistent with this, Paneth cell delocalization was also observed in Cdkn2a −/− mice upon loss of Eed and H3K27me3 (Fig EV5D), demonstrating that loss of PRC2 activity perturbs the correct differentiation program in the intestinal epithelium independently from Cdkn2a activation. In contrast, inactivation of Cdkn2a expression rescued the proliferation defects observed in the TA compartment following loss of PRC2 activity (Fig 5C). Fifteen days after βNF injection, both AhCre Cdkn2a +/+ and AhCre Cdkn2a −/− Eed fl/fl mice were exposed to 10 Gy and sacrificed after 8 days. Loss of Cdkn2a was sufficient to completely restore the regenerative ability of Eed‐deficient intestinal epithelium induced by irradiation (Fig 5D). Under these experimental conditions, a strong accumulation of goblet cells was also observed confirming the exclusive role of Cdkn2a in promoting cell cycle arrest without affecting lineage skewing. Likewise, Cdkn2a inactivation restored organoid formation in Eed −/− epithelium (Fig EV5E), suggesting that proliferative defects and G1/S checkpoint activation in progenitor cells after extensive damage is incompatible with plasticity of cells within the stem cell niche. Taken together, these data demonstrate that PRC2 activity is required to maintain cell cycle progression and differentiation through distinct mechanisms and that cell cycle checkpoint activation is not sufficient per se to trigger cell differentiation in the intestinal epithelium.
Figure 5. Loss of Cdkn2a restores cell proliferation in Eed −/− intestinal crypts.

- Haematoxylin and eosin (top panels) and PAS staining (bottom panels) of sections prepared from different intestinal tracts in AhCre Cdkn2a −/− Eed +/+ and AhCre Cdkn2a −/− Eed fl/fl mice 15 days after the first β‐naphthoflavone administration (n = 5).
- Quantification (mean ± SD) of goblet cells along the crypt‐to‐villus axis from the staining shown in (A). More than 100 crypts and villi were scored for each condition.
- Immunhistochemistry analysis using anti‐KI67 antibody of intestinal sections prepared from AhCre Cdkn2a −/− Eed +/+ and AhCre Cdkn2a −/− Eed fl/fl mice 15 days after the first β‐naphthoflavone administration.
- Radiation‐induced intestinal regeneration: AhCre Cdkn2a −/− Eed +/+ and AhCre Cdkn2a −/− Eed fl/fl mice (n = 6) were injected with β‐naphthoflavone, irradiated with 10 Gy 15 days later, and sacrificed 8 days after irradiation. Sections prepared from the different intestinal tracts were stained with haematoxylin and eosin (first panels) and Alcian blue (last panels). Sections were also stained for immunohistochemical analysis (second and third panels) using H3K27me3‐ and KI67‐specific antibodies.
Loss of EED activates a goblet cell‐specific transcriptional program downstream of NOTCH signalling
Goblet cell accumulation in the small intestine is tightly controlled by the stimulation of NOTCH signalling: NOTCH activation is required to maintain Hes1 expression, which in turn represses the expression of the master regulator of the secretory lineage, Atoh1 (Jensen et al, 2000; van Es et al, 2005; Fre et al, 2005; Zecchini et al, 2005; Ueo et al, 2012; VanDussen et al, 2012). To unveil the molecular events underlying the increased number of goblet cells observed upon loss of PRC2, we scanned the expression of markers for distinct signalling that regulate lineage fate within intestinal crypts (Fig 6A). Consistent with the maintenance of stem cell activity, we detected no significant alterations in the expression of Wnt targets involved in stem cell homeostasis (Lgr5 and Rnf43) or cell positioning (EphB2 and EphB3). Only Cd44 expression was constantly increased in Eed −/− crypts. Similarly, genes involved in NOTCH signalling (Hes1, Dll1 and Dll2) were not perturbed by EED loss. Importantly, we observed transcriptional activation of Atoh1, Spdef and Gfi1, the three master transcription factors that act sequentially and are essential and sufficient for specifying goblet cell differentiation. This is further consistent with the accumulation of Tff3 expression, an established marker of goblet cells and with transcriptional repression of Ngn3, which is physiologically repressed by GFI1 (Bjerknes & Cheng, 2010). We scanned all critical players within the NOTCH‐to‐goblet cell differentiation axis for direct PRC2 control in our ChIPseq analysis (Table EV2) and found that both Atoh1 and Gfi1 had strong PRC2 occupancy at their promoters with accumulated H3K27me3 (Figs 6B and EV6A). The same occupancy was observed in LGR5+ ISCs where PRC2 is expressed and active (Fig EV6B and C). Taken together, these data suggest that PRC2 activity maintains Atoh1 and Gfi1 repressed in enterocyte progenitor and stem cells downstream of NOTCH signalling. To further confirm the role of PRC2 in maintaining transcriptional repression of master transcription factor of the secretory lineage, we treated mice with the γ‐secretase inhibitor dibenzazepine (DBZ) for 38 h. At early time points, acute DBZ‐dependent NOTCH signalling inhibition induced secretory cell progenitors accumulation without altering cell cycle progression (Kim et al, 2014). Accordingly, we observed transcriptional upregulation of the NOTCH ligand Dll1, upregulation of the master regulator of secretory differentiation Atoh1, Gfi1 and Spdef, downregulation of the NOTCH targets Hes1 and Olfm4, and no changes in the expression of the stem cell markers Lgr5 and Rnf43 (Fig 6C). Consistent with our previous data, the deposition of H3K27me3 detected by ChIP analyses on Atoh1 and Gfi1 promoters was significantly reduced in secretory progenitor‐enriched intestinal crypts upon in DBZ treatment (Fig 6D). This showed that the PRC2‐repressive layer is displaced from Atoh1 and Gfi1 in secretory progenitors, confirming the role of PRC2 in preventing unscheduled activation of secretory lineage differentiation program.
Figure 6. PRC2 directly maintains Atoh1 and Gfi1 repression.

- Expression analysis by qRT–PCR (mean ± SD) of the indicated intestinal epithelial cell markers regulated by the Wnt and NOTCH signalling pathways that are involved in stem cell homeostasis, regionalization and goblet cell differentiation (n = 3).
- Genomic snapshots of the indicated genomic loci for SUZ12 occupancy and H3K27me3 deposition in intestinal crypts of wild‐type mice (n = 3).
- Expression analysis by qRT–PCR (mean ± SD) of goblet cell markers (Atoh1, Gfi1, Spdef), early secretory precursor cells (Dll1), NOTCH targets (Hes1, Olfm4) and intestinal stem cell markers (Lgr5, Rnf43) in wild‐type intestinal crypts purified 38 h after treatment with the NOTCH inhibitor DBZ. DMSO served as vehicle negative control (n = 4).
- ChIP analysis of Atoh1 and Gfi1 loci using H3K27me3‐specific antibody. The same crypts described in (C) were used. H3K27me3 levels were normalized on histone H3 density (percentage of H3 signal). Graphs show mean ± SD.
- Graphic model highlighting the role of PRC2 in restricting secretory lineage differentiation and cell cycle checkpoint activation in TA cells.
Figure EV6. PRC2 is active in intestinal stem cells.

-
A, BGenomic snapshots of the indicated genomic loci for SUZ12 occupancy and H3K27me3 deposition in intestinal crypts (A) or ISCs (B).
-
CSUZ12 and H3K27me3 immunofluorescence staining (red) and Lgr5‐eGFP expression (green) in near‐native agarose‐embedded small intestinal sections. Scale bar represents 25 μm.
Discussion
Polycomb proteins maintain transcriptional repression during embryonic development and in adult organs by temporally and spatially restricting the activation of key factors involved in cell cycle progression, tissue identity, axial patterning and differentiation (Sparmann & van Lohuizen, 2006; Chen & Dent, 2014; Scelfo et al, 2015). However, how PRC1 and PRC2 function in adult tissues remains elusive, as exhaustive data related to their role in specific tissues are largely missing. Relevant aspects of the activity of these two complexes are considered in large part redundant. Components of both complexes occupy the same CpG‐rich promoters and are recruited sequentially to fully maintain transcriptional repression via H3K27me3 and H2Aub1 deposition. We recently described the essential role of global PRC1 activity in maintaining adult intestinal epithelium homeostasis. Loss of PRC1 leads to intestinal stem cell exhaustion independently from the activation of the Cdkn2a locus (Chiacchiera et al, 2016). Here, we analysed the role of PRC2 activity in the same compartment by eliminating the structural EED subunit, to avoid redundancies between the two catalytic subunits EZH1 and EZH2, both of which are expressed in the intestinal epithelium.
We now have revealed that PRC2 activity is dispensable for preserving the intestinal stem cell niche under physiological conditions but plays a dual role in maintaining proliferation in the TA progenitor compartment, as previously hypothesized using in vitro cell culture (Benoit et al, 2012), and in restricting differentiation of the secretory lineage. These functions occur independently from H2Aub1 deposition, as this was globally unaffected in Eed −/− intestinal epithelial cells. This suggests that (i) the extent of overlap and redundancy between the two PRC complexes is context‐dependent and (ii) the complexity in PRC1 composition likely confers its activity with additional properties with respect to PRC2.
Our results show that loss of EED in the intestinal epithelium strongly reduced proliferating cells specifically in the TA compartment, as shown by the ability of H3K27me3‐negative ISCs to fuel physiological intestinal regeneration. These proliferation defects were fully rescued by genetic loss of the Cdkn2a locus. In vivo, PcG‐induced activation of Cdkn2a expression has been reported in haematopoietic stem cells and in hair follicles. PRC2 activity is required to maintain bone marrow long‐term haematopoietic stem cells (Xie et al, 2014). Loss of EED severely affects HSC viability by inducing transcription of apoptotic and cell cycle checkpoint‐related genes, affecting their ability to differentiate into mature blood cells. Concomitant loss of Cdkn2a fails to compensate for the differentiation block and only mildly increases cell viability. Loss of both EZH1 and EZH2 in hair follicle does not affect stem cell identity but impairs cell proliferation of both stem and transit‐amplifying cells affecting hair follicle morphogenesis. Further, Cdkn2a and Cdkn2b loci are transcriptionally activated and might play a role in cell cycle arrest (Ezhkova et al, 2011). Taking all these data into consideration, our results support the possibility that the outcome of loss of PRC2 transcriptional repression depends not only on the functional nature of the deregulated genes but also strongly on the cellular context in which this take place.
We further showed that while physiological renewal of the intestinal epithelium was not affected, irradiation‐induced regeneration was severely impaired in the absence of PRC2 activity. Damage‐induced regeneration considerably differs from the homeostatic turnover, revealing the high level of cell plasticity present at the bottom of intestinal crypts (van Es et al, 2012; Metcalfe et al, 2014; Tetteh et al, 2015, 2016). Our data demonstrate that EED is required to maintain this high level of plasticity, to allow irradiation‐induced intestinal regeneration, in a Cdkn2a‐dependent manner. This highlights that, although this checkpoint activation does not affect normal stem cell proliferation, it represents a barrier for the plasticity required to repopulate the stem cell niche upon extensive damage.
In addition to proliferation defects of TA cells, EED loss significantly increased the number of mucus‐secreting goblet cells and enteroendocrine cells. The same phenotype was previously described in vivo after inhibition of NOTCH signalling (van Es et al, 2005; Pellegrinet et al, 2011; Ueo et al, 2012; Tsai et al, 2014). In the intestine, this pathway is required to maintain stemness and at the same time to prevent secretory lineage differentiation. Direct activation of the NOTCH targets Hes1 and Hes5 represses the expression of the master transcription factor Atoh1 required for secretory lineage differentiation (Jensen et al, 2000; van Es et al, 2010; Kazanjian et al, 2010; Kim & Shivdasani, 2011; Ueo et al, 2012). Depending on the different secretory cell type, Atoh1 expression is followed by the activation of specific transcription factors that restrict cell plasticity, inducing terminal differentiation into either endocrine (Jenny et al, 2002; Lopez‐Diaz et al, 2007), Paneth (Shroyer et al, 2005) or goblet cells (Shroyer et al, 2005; Gregorieff et al, 2009; Noah et al, 2010). GFI1 and SPDEF are the transcription factors activated downstream of ATOH1 that specify goblet cells. Atoh1, Gfi1 or Spdef knockout results in a lack of goblet cell production (Yang et al, 2001; Gregorieff et al, 2009; Noah et al, 2010). Moreover, ectopic Atoh1 and Spdef expression was shown to be sufficient to promote goblet cell differentiation in vivo (Noah et al, 2010; VanDussen & Samuelson, 2010). Consistently, inhibition of NOTCH signalling leads to their transcriptional activation and massive accumulation of goblet cells within the tissue. Here, we show that EED loss did not directly interfere with NOTCH signalling but rather cooperated downstream with the receptor activation, to sustain direct repression of specific targets (namely, Atoh1 and Gfi1). In contrast to NOTCH1/2 inhibition, loss of PRC2 activity did not affect the expression of NOTCH transcriptional targets, such as Hes1, but did specifically alter the expression levels of master regulators of secretory goblet cells, such as Atoh1 and Gfi1. We found that Atoh1 and Gfi1 were indeed direct PRC2 targets, with strong deposition of H3K27me3 at their promoters that is lost as these genes are transcribed to instruct secretory progenitors. These results suggest that lack of PRC2‐repressive activity at these targets sensitizes progenitor cells towards a secretory program, as shown by the strong enrichment of the secretory progenitor transcriptional signature within in Eed‐null cells.
All these findings are fully consistent with a recent report showing impaired crypt proliferation and increased production of secretory cells upon Eed inactivation in the intestinal epithelium (Koppens et al, 2016). Similar to our findings, in vitro knock‐down of the Cdkn2a‐p53 axis in intestinal organoids restored cell proliferation defects without rescuing the increased production of secretory cells.
In summary, our data provide strong evidence that PRC2 activity is required to maintain cell plasticity at the bottom of the intestinal crypts. In this context, PRC2 plays a dual role: it coordinates cell differentiation, thus avoiding erroneous activation of secretory lineage differentiation, and preserves cell proliferation by preventing Cdkn2a expression. This work supports a role for the Polycomb complexes activities as gatekeepers of intestinal epithelium homeostasis, where they regulate stem cell maintenance, cell proliferation and differentiation.
Materials and Methods
Mice
Mice were housed accordingly to the guidelines set out in the European Commission Recommendation 2007/526/EC, 18 June 2007, for the accommodation and care of animals used in experimental and other scientific purposes. All experiments were performed in accordance with the Italian Law (D.L.vo 116/92 and following additions), which enforces the EU 86/609 Directive (Council Directive 86/609/EEC of 24 November 1986 on the approximation of laws, regulations and administrative provisions of the Member States regarding the protection of animals used for experimental and other scientific purposes). To generate intestinal‐specific Eed conditional knockout mice, Eed fl/fl mice [(Xie et al, 2014) purchased from Jackson Laboratories] were mated with AhCre [kindly provided by Douglas Winton (Ireland et al, 2004)], LGR5eGFP‐IRESCre ERT2 (Barker et al, 2007), Rosa26‐LsL‐LacZ (Soriano, 1999) or Rosa26‐CreER T2 (Ventura et al, 2007; purchased from Jackson Laboratories) transgenic strains. These mice were also further crossed with Cdkn2a −/− mice (Serrano et al, 1996). Genotyping was confirmed by PCR of tail skin DNA following previously published protocols. Cre‐dependent recombination was induced by injecting three times intraperitoneally with either tamoxifen (Sigma), at 75 mg/kg, or β‐naphthoflavone (Santa Cruz Biotechnology), at 80 mg/kg, dissolved in corn oil (Sigma). DBZ (Sigma) was dissolved in DMSO and intraperitoneally administered in corn oil at 100 μmol/kg.
Tissue morphology and immunohistochemistry
Intestines were dissected immediately after death. The proximal (duodenum), central (jejunum) and distal (ileum) parts of the small intestine were flushed with cold PBS, opened longitudinally and fixed overnight in 4% formaldehyde. The colon was opened longitudinally and processed following a “Swiss roll” protocol (Moolenbeek & Ruitenberg, 1981). Samples were embedded in paraffin and sectioned at 5 μm thickness. Morphological analyses were performed using haematoxylin and eosin, periodic acid–Schiff (PAS) or Alcian blue staining. Alkaline phosphatase staining used the Alkaline Phosphatase Kit (Sigma) following manufacturer's instructions. Immunohistochemistry analyses were mediated by proteinase K or with heat‐induced antigen unmasking using 10 mM sodium citrate. Anti‐H3K27me3 (Cell Signalling, 9733), anti‐H3K27me2 (Cell Signalling, 9728), anti‐lysozyme (Dako, A0099), anti‐ChgA (Abcam, ab15160), anti‐DCLK1 (Cell Signalling 62257) and anti‐KI67 (Abcam, ab16667) were used as primary antibodies. All images were acquired using an Olympus BX51 bright field microscopy and Leica TCS SP2 laser scanning confocal microscope.
ChIP and RNA preparation for NGS, and real‐time qPCR
ChIP assays were performed as previously described (Chiacchiera et al, 2016) using anti‐H3K27me3 or anti‐SUZ12 (Cell Signalling, 3737). Total RNA was extracted from purified crypts using miRNeasy Mini Kit (Qiagen) and libraries prepared using TruSeq RNA Sample Preparation Kit (Illumina), following manufacturer's instructions. Bioanalyzer 2100 (Agilent Technologies) was used to qualitatively and quantitatively check library quality. High‐throughput deep sequencing was performed using an Illumina Hi‐Seq 2000. For single gene expression analysis, total RNA was retrotranscribed using the Impromp‐II reverse transcriptase system (Promega). Real‐time qPCRs were carried out using CFX96 Touch Real‐Time PCR system (Bio‐Rad), and reaction mixes were prepared using a Fast SYBR Green Master Mix (Applied Bioscience) following manufacturer's instructions. Primer sequences are available in Table EV3.
Computational analysis
For ChIPseq analyses, the raw sequencing data (as FASTQ files) were aligned to the mouse reference genome (mm9) using Bowtie (Langmead et al, 2009) allowing only unique alignments, with duplicates removed from the downstream analysis. Peak calling for H3K27me3 and SUZ12 was performed with MACS2 (Zhang et al, 2008). Only the peaks with P < 1 × 10⁻⁸ were used for further analyses.
For generating profiles of H3K27me3 and SUZ12, the genomic regions of differentially regulated genes were extended by 10 kb both upstream and downstream from the annotated TSS. Each extended region was then fragmented down into smaller bins of 50 bp in size. For each individual region of interest, the normalized reads within each bin were computed and averaged over individual sets of regulated genes.
For RNAseq analyses, the raw sequencing data (as FASTQ files) were aligned to the mouse reference genome (mm9) using TopHat (Kim et al, 2013). Differentially expressed genes (DEGs) were identified using DESeq (Anders & Huber, 2010). Only genes with a minimal expression level (RPKM ≥ 1) in one experimental condition were considered as differentially expressed. Genes with a fold change ≥ 3 and with an adjusted P < 0.05 were included among the DEGs.
Gene set enrichment analysis (Subramanian et al, 2005) used transcripts ranked on the basis of their fold‐change differences in expression levels between Eed −/− and Eed +/+ mice. Enrichment scores were then computed with respect to published gene set signatures specific for secretory and enterocyte progenitors (Kim et al, 2014), found by any degree of over‐representation at the extremes of the ranked list.
Mini‐gut culture and Western blot analysis
Mini‐gut culture was performed as previously described (Sato et al, 2009). Briefly, the small intestine was flushed with ice‐cold PBS and sectioned longitudinally. Villi were scraped off using glass coverslips, and tissue was cut into small pieces. After incubating in 2 mM EDTA, crypts were released by mechanical disaggregation. Purified crypts were embedded in Matrigel (BD Biosciences) and cultured in Advanced DMEM/F12, supplemented with HEPES, GlutaMax, antibiotics, N2, retinoic acid‐free B27 supplements, EGF (all from GE Healthcare), noggin (Peprotech) and mRSPO1 (R&D System). Cre‐dependent recombination was achieved using 4‐OHT (Sigma). For Western blot analysis, isolated crypts were lysed in urea buffer (25 mM Tris–HCl pH 6.8, 200 mM NaCl, 10% glycerol, 8 M urea, 1 mM EDTA), sonicated and mixed with loading buffer. Anti‐H3K27me3 (Cell Signalling, 9733), anti‐H3K27me2 (Cell Signalling, 9728), anti‐H2AK119ub1 (Cell Signalling, 8240), anti‐histone H3 (Cell Signalling, 3638), anti‐H3k27me1 (Active Motif, 61015) and anti‐histone H2A (Millipore, 07‐146) were used.
Data availability
ChIPseq and RNAseq raw data have been deposited at the GEO database under the accession number GSE80539.
Author contributions
FC and AR performed experiments. SJ performed bioinformatics analysis. MZ provided technical assistance. FC, AR, SJ and DP analysed the data. FC and DP conceived the experiments and wrote the manuscript.
Conflict of interest
The authors declare that they have no conflict of interest.
Supporting information
Expanded View Figures PDF
Table EV1
Table EV2
Table EV3
Source Data for Expanded View
Review Process File
Source Data for Figure 1
Acknowledgements
We would like to thank Veronica Racker for help in editing the manuscript, Doug Winton for providing the AhCre mouse transgenic line and Stewart Orkin for making the Eed conditional mice available at Jackson Laboratories. We thank all members of the Pasini laboratory for helpful discussion. The work in the Pasini laboratory was supported by grants from the Italian Association for Cancer Research (AIRC), the Italian Ministry of Health and by the Foundation Umberto Veronesi (FUV). AR was supported by fellowships from the Italian Foundation for Cancer Research (FIRC). FC was supported by a FUV Fellowship.
The EMBO Journal (2016) 35: 2301–2314
See also: P Vizán et al (November 2016)
Contributor Information
Fulvio Chiacchiera, Email: fulvio.chiacchiera@ieo.eu.
Diego Pasini, Email: diego.pasini@ieo.eu.
References
- Anders S, Huber W (2010) Differential expression analysis for sequence count data. Genome Biol 11: R106 [DOI] [PMC free article] [PubMed] [Google Scholar]
- Barker N, van Es JH, Kuipers J, Kujala P, van den Born M, Cozijnsen M, Haegebarth A, Korving J, Begthel H, Peters PJ, Clevers H (2007) Identification of stem cells in small intestine and colon by marker gene Lgr5. Nature 449: 1003–1007 [DOI] [PubMed] [Google Scholar]
- Barker N (2014) Adult intestinal stem cells: critical drivers of epithelial homeostasis and regeneration. Nat Rev Mol Cell Biol 15: 19–33 [DOI] [PubMed] [Google Scholar]
- Benoit YD, Lepage MB, Khalfaoui T, Tremblay E, Basora N, Carrier JC, Gudas LJ, Beaulieu JF (2012) Polycomb repressive complex 2 impedes intestinal cell terminal differentiation. J Cell Sci 125: 3454–3463 [DOI] [PMC free article] [PubMed] [Google Scholar]
- Bjerknes M, Cheng H (2010) Cell Lineage metastability in Gfi1‐deficient mouse intestinal epithelium. Dev Biol 345: 49–63 [DOI] [PubMed] [Google Scholar]
- Bracken AP, Kleine‐Kohlbrecher D, Dietrich N, Pasini D, Gargiulo G, Beekman C, Theilgaard‐Monch K, Minucci S, Porse BT, Marine JC, Hansen KH, Helin K (2007) The Polycomb group proteins bind throughout the INK4A‐ARF locus and are disassociated in senescent cells. Genes Dev 21: 525–530 [DOI] [PMC free article] [PubMed] [Google Scholar]
- Chen H, Gu X, Su IH, Bottino R, Contreras JL, Tarakhovsky A, Kim SK (2009) Polycomb protein Ezh2 regulates pancreatic beta‐cell Ink4a/Arf expression and regeneration in diabetes mellitus. Genes Dev 23: 975–985 [DOI] [PMC free article] [PubMed] [Google Scholar]
- Chen T, Dent SY (2014) Chromatin modifiers and remodellers: regulators of cellular differentiation. Nat Rev Genet 15: 93–106 [DOI] [PMC free article] [PubMed] [Google Scholar]
- Chiacchiera F, Piunti A, Pasini D (2013) Epigenetic methylations and their connections with metabolism. Cell Mol Life Sci 70: 1495–1508 [DOI] [PMC free article] [PubMed] [Google Scholar]
- Chiacchiera F, Rossi A, Jammula S, Piunti A, Scelfo A, Ordonez‐Moran P, Huelsken J, Koseki H, Pasini D (2016) Polycomb complex PRC1 preserves intestinal stem cell identity by sustaining Wnt/beta‐catenin transcriptional activity. Cell Stem Cell 18: 91–103 [DOI] [PubMed] [Google Scholar]
- van Es JH, de Geest N, van de Born M, Clevers H, Hassan BA (2010) Intestinal stem cells lacking the Math1 tumour suppressor are refractory to Notch inhibitors. Nat Commun 1: 18 [DOI] [PMC free article] [PubMed] [Google Scholar]
- van Es JH, Sato T, van de Wetering M, Lyubimova A, Nee AN, Gregorieff A, Sasaki N, Zeinstra L, van den Born M, Korving J, Martens AC, Barker N, van Oudenaarden A, Clevers H (2012) Dll1+ secretory progenitor cells revert to stem cells upon crypt damage. Nat Cell Biol 14: 1099–1104 [DOI] [PMC free article] [PubMed] [Google Scholar]
- van Es JH, van Gijn ME, Riccio O, van den Born M, Vooijs M, Begthel H, Cozijnsen M, Robine S, Winton DJ, Radtke F, Clevers H (2005) Notch/gamma‐secretase inhibition turns proliferative cells in intestinal crypts and adenomas into goblet cells. Nature 435: 959–963 [DOI] [PubMed] [Google Scholar]
- Ezhkova E, Lien WH, Stokes N, Pasolli HA, Silva JM, Fuchs E (2011) EZH1 and EZH2 cogovern histone H3K27 trimethylation and are essential for hair follicle homeostasis and wound repair. Genes Dev 25: 485–498 [DOI] [PMC free article] [PubMed] [Google Scholar]
- Fre S, Huyghe M, Mourikis P, Robine S, Louvard D, Artavanis‐Tsakonas S (2005) Notch signals control the fate of immature progenitor cells in the intestine. Nature 435: 964–968 [DOI] [PubMed] [Google Scholar]
- Gao Z, Zhang J, Bonasio R, Strino F, Sawai A, Parisi F, Kluger Y, Reinberg D (2012) PCGF homologs, CBX proteins, and RYBP define functionally distinct PRC1 family complexes. Mol Cell 45: 344–356 [DOI] [PMC free article] [PubMed] [Google Scholar]
- Gregorieff A, Stange DE, Kujala P, Begthel H, van den Born M, Korving J, Peters PJ, Clevers H (2009) The ets‐domain transcription factor Spdef promotes maturation of goblet and paneth cells in the intestinal epithelium. Gastroenterology 137: 1333–1345 e1‐3 [DOI] [PubMed] [Google Scholar]
- Ireland H, Kemp R, Houghton C, Howard L, Clarke AR, Sansom OJ, Winton DJ (2004) Inducible Cre‐mediated control of gene expression in the murine gastrointestinal tract: effect of loss of beta‐catenin. Gastroenterology 126: 1236–1246 [DOI] [PubMed] [Google Scholar]
- Jenny M, Uhl C, Roche C, Duluc I, Guillermin V, Guillemot F, Jensen J, Kedinger M, Gradwohl G (2002) Neurogenin3 is differentially required for endocrine cell fate specification in the intestinal and gastric epithelium. EMBO J 21: 6338–6347 [DOI] [PMC free article] [PubMed] [Google Scholar]
- Jensen J, Pedersen EE, Galante P, Hald J, Heller RS, Ishibashi M, Kageyama R, Guillemot F, Serup P, Madsen OD (2000) Control of endodermal endocrine development by Hes‐1. Nat Genet 24: 36–44 [DOI] [PubMed] [Google Scholar]
- Juan AH, Derfoul A, Feng X, Ryall JG, Dell'Orso S, Pasut A, Zare H, Simone JM, Rudnicki MA, Sartorelli V (2011) Polycomb EZH2 controls self‐renewal and safeguards the transcriptional identity of skeletal muscle stem cells. Genes Dev 25: 789–794 [DOI] [PMC free article] [PubMed] [Google Scholar]
- Kazanjian A, Noah T, Brown D, Burkart J, Shroyer NF (2010) Atonal homolog 1 is required for growth and differentiation effects of notch/gamma‐secretase inhibitors on normal and cancerous intestinal epithelial cells. Gastroenterology 139: 918–928, 928 e1‐6 [DOI] [PMC free article] [PubMed] [Google Scholar]
- Kim D, Pertea G, Trapnell C, Pimentel H, Kelley R, Salzberg SL (2013) TopHat2: accurate alignment of transcriptomes in the presence of insertions, deletions and gene fusions. Genome Biol 14: R36 [DOI] [PMC free article] [PubMed] [Google Scholar]
- Kim TH, Shivdasani RA (2011) Genetic evidence that intestinal Notch functions vary regionally and operate through a common mechanism of Math1 repression. J Biol Chem 286: 11427–11433 [DOI] [PMC free article] [PubMed] [Google Scholar]
- Kim TH, Li F, Ferreiro‐Neira I, Ho LL, Luyten A, Nalapareddy K, Long H, Verzi M, Shivdasani RA (2014) Broadly permissive intestinal chromatin underlies lateral inhibition and cell plasticity. Nature 506: 511–515 [DOI] [PMC free article] [PubMed] [Google Scholar]
- Koppens MA, Bounova G, Gargiulo G, Tanger E, Janssen H, Cornelissen‐Steijger P, Blom M, Song JY, Wessels LF, van Lohuizen M (2016) Deletion of polycomb repressive complex 2 from mouse intestine causes loss of stem cells. Gastroenterology doi:10.1053/j.gastro.2016.06.020 [DOI] [PubMed] [Google Scholar]
- Langmead B, Trapnell C, Pop M, Salzberg SL (2009) Ultrafast and memory‐efficient alignment of short DNA sequences to the human genome. Genome Biol 10: R25 [DOI] [PMC free article] [PubMed] [Google Scholar]
- Lopez‐Diaz L, Jain RN, Keeley TM, VanDussen KL, Brunkan CS, Gumucio DL, Samuelson LC (2007) Intestinal Neurogenin 3 directs differentiation of a bipotential secretory progenitor to endocrine cell rather than goblet cell fate. Dev Biol 309: 298–305 [DOI] [PMC free article] [PubMed] [Google Scholar]
- Margueron R, Li G, Sarma K, Blais A, Zavadil J, Woodcock CL, Dynlacht BD, Reinberg D (2008) Ezh1 and Ezh2 maintain repressive chromatin through different mechanisms. Mol Cell 32: 503–518 [DOI] [PMC free article] [PubMed] [Google Scholar]
- Metcalfe C, Kljavin NM, Ybarra R, de Sauvage FJ (2014) Lgr5+ stem cells are indispensable for radiation‐induced intestinal regeneration. Cell Stem Cell 14: 149–159 [DOI] [PubMed] [Google Scholar]
- Moolenbeek C, Ruitenberg EJ (1981) The “Swiss roll”: a simple technique for histological studies of the rodent intestine. Lab Anim 15: 57–59 [DOI] [PubMed] [Google Scholar]
- Noah TK, Kazanjian A, Whitsett J, Shroyer NF (2010) SAM pointed domain ETS factor (SPDEF) regulates terminal differentiation and maturation of intestinal goblet cells. Exp Cell Res 316: 452–465 [DOI] [PMC free article] [PubMed] [Google Scholar]
- Pellegrinet L, Rodilla V, Liu Z, Chen S, Koch U, Espinosa L, Kaestner KH, Kopan R, Lewis J, Radtke F (2011) Dll1‐ and dll4‐mediated notch signaling are required for homeostasis of intestinal stem cells. Gastroenterology 140: 1230–1240 e1‐7 [DOI] [PMC free article] [PubMed] [Google Scholar]
- Piunti A, Rossi A, Cerutti A, Albert M, Jammula S, Scelfo A, Cedrone L, Fragola G, Olsson L, Koseki H, Testa G, Casola S, Helin K, d'Adda di Fagagna F, Pasini D (2014) Polycomb proteins control proliferation and transformation independently of cell cycle checkpoints by regulating DNA replication. Nat Commun 5: 3649 [DOI] [PMC free article] [PubMed] [Google Scholar]
- Sansom OJ, Meniel VS, Muncan V, Phesse TJ, Wilkins JA, Reed KR, Vass JK, Athineos D, Clevers H, Clarke AR (2007) Myc deletion rescues Apc deficiency in the small intestine. Nature 446: 676–679 [DOI] [PubMed] [Google Scholar]
- Sato T, Vries RG, Snippert HJ, van de Wetering M, Barker N, Stange DE, van Es JH, Abo A, Kujala P, Peters PJ, Clevers H (2009) Single Lgr5 stem cells build crypt‐villus structures in vitro without a mesenchymal niche. Nature 459: 262–265 [DOI] [PubMed] [Google Scholar]
- Scelfo A, Piunti A, Pasini D (2015) The controversial role of the Polycomb group proteins in transcription and cancer: how much do we not understand Polycomb proteins? FEBS J 282: 1703–1722 [DOI] [PubMed] [Google Scholar]
- Serrano M, Lee H, Chin L, Cordon‐Cardo C, Beach D, DePinho RA (1996) Role of the INK4a locus in tumor suppression and cell mortality. Cell 85: 27–37 [DOI] [PubMed] [Google Scholar]
- Shen X, Liu Y, Hsu YJ, Fujiwara Y, Kim J, Mao X, Yuan GC, Orkin SH (2008) EZH1 mediates methylation on histone H3 lysine 27 and complements EZH2 in maintaining stem cell identity and executing pluripotency. Mol Cell 32: 491–502 [DOI] [PMC free article] [PubMed] [Google Scholar]
- Shroyer NF, Wallis D, Venken KJ, Bellen HJ, Zoghbi HY (2005) Gfi1 functions downstream of Math1 to control intestinal secretory cell subtype allocation and differentiation. Genes Dev 19: 2412–2417 [DOI] [PMC free article] [PubMed] [Google Scholar]
- Soriano P (1999) Generalized lacZ expression with the ROSA26 Cre reporter strain. Nat Genet 21: 70–71 [DOI] [PubMed] [Google Scholar]
- Sparmann A, van Lohuizen M (2006) Polycomb silencers control cell fate, development and cancer. Nat Rev Cancer 6: 846–856 [DOI] [PubMed] [Google Scholar]
- Su IH, Basavaraj A, Krutchinsky AN, Hobert O, Ullrich A, Chait BT, Tarakhovsky A (2003) Ezh2 controls B cell development through histone H3 methylation and Igh rearrangement. Nat Immunol 4: 124–131 [DOI] [PubMed] [Google Scholar]
- Subramanian A, Tamayo P, Mootha VK, Mukherjee S, Ebert BL, Gillette MA, Paulovich A, Pomeroy SL, Golub TR, Lander ES, Mesirov JP (2005) Gene set enrichment analysis: a knowledge‐based approach for interpreting genome‐wide expression profiles. Proc Natl Acad Sci USA 102: 15545–15550 [DOI] [PMC free article] [PubMed] [Google Scholar]
- Tetteh PW, Farin HF, Clevers H (2015) Plasticity within stem cell hierarchies in mammalian epithelia. Trends Cell Biol 25: 100–108 [DOI] [PubMed] [Google Scholar]
- Tetteh PW, Basak O, Farin HF, Wiebrands K, Kretzschmar K, Begthel H, van den Born M, Korving J, de Sauvage F, van Es JH, van Oudenaarden A, Clevers H (2016) Replacement of lost Lgr5‐positive stem cells through plasticity of their enterocyte‐lineage daughters. Cell Stem Cell 18: 203–213 [DOI] [PubMed] [Google Scholar]
- Tsai YH, VanDussen KL, Sawey ET, Wade AW, Kasper C, Rakshit S, Bhatt RG, Stoeck A, Maillard I, Crawford HC, Samuelson LC, Dempsey PJ (2014) ADAM10 regulates Notch function in intestinal stem cells of mice. Gastroenterology 147: 822–834 e13 [DOI] [PMC free article] [PubMed] [Google Scholar]
- Ueo T, Imayoshi I, Kobayashi T, Ohtsuka T, Seno H, Nakase H, Chiba T, Kageyama R (2012) The role of Hes genes in intestinal development, homeostasis and tumor formation. Development 139: 1071–1082 [DOI] [PubMed] [Google Scholar]
- VanDussen KL, Samuelson LC (2010) Mouse atonal homolog 1 directs intestinal progenitors to secretory cell rather than absorptive cell fate. Dev Biol 346: 215–223 [DOI] [PMC free article] [PubMed] [Google Scholar]
- VanDussen KL, Carulli AJ, Keeley TM, Patel SR, Puthoff BJ, Magness ST, Tran IT, Maillard I, Siebel C, Kolterud A, Grosse AS, Gumucio DL, Ernst SA, Tsai YH, Dempsey PJ, Samuelson LC (2012) Notch signaling modulates proliferation and differentiation of intestinal crypt base columnar stem cells. Development 139: 488–497 [DOI] [PMC free article] [PubMed] [Google Scholar]
- Ventura A, Kirsch DG, McLaughlin ME, Tuveson DA, Grimm J, Lintault L, Newman J, Reczek EE, Weissleder R, Jacks T (2007) Restoration of p53 function leads to tumour regression in vivo . Nature 445: 661–665 [DOI] [PubMed] [Google Scholar]
- Xie H, Xu J, Hsu JH, Nguyen M, Fujiwara Y, Peng C, Orkin SH (2014) Polycomb repressive complex 2 regulates normal hematopoietic stem cell function in a developmental‐stage‐specific manner. Cell Stem Cell 14: 68–80 [DOI] [PMC free article] [PubMed] [Google Scholar]
- Yang Q, Bermingham NA, Finegold MJ, Zoghbi HY (2001) Requirement of Math1 for secretory cell lineage commitment in the mouse intestine. Science 294: 2155–2158 [DOI] [PubMed] [Google Scholar]
- Zecchini V, Domaschenz R, Winton D, Jones P (2005) Notch signaling regulates the differentiation of post‐mitotic intestinal epithelial cells. Genes Dev 19: 1686–1691 [DOI] [PMC free article] [PubMed] [Google Scholar]
- Zhang Y, Liu T, Meyer CA, Eeckhoute J, Johnson DS, Bernstein BE, Nusbaum C, Myers RM, Brown M, Li W, Liu XS (2008) Model‐based analysis of ChIP‐Seq (MACS). Genome Biol 9: R137 [DOI] [PMC free article] [PubMed] [Google Scholar]
Associated Data
This section collects any data citations, data availability statements, or supplementary materials included in this article.
Supplementary Materials
Expanded View Figures PDF
Table EV1
Table EV2
Table EV3
Source Data for Expanded View
Review Process File
Source Data for Figure 1
Data Availability Statement
ChIPseq and RNAseq raw data have been deposited at the GEO database under the accession number GSE80539.