Abstract
Autoantibodies, which are antibodies against self-antigens, are present in many disease states and can serve as markers for disease activity. The levels of autoantibodies to specific antigens are typically detected with the enzyme-linked immunosorbent assay (ELISA) technique. However, screening for multiple autoantibodies with ELISA can be time-consuming and requires a large quantity of patient sample. The antigen microarray technique is an alternative method that can be used to screen for autoantibodies in a multiplex fashion. In this technique, antigens are arrayed onto specially coated microscope slides with a robotic microarrayer. The slides are probed with patient serum samples and subsequently fluorescent-labeled secondary antibodies are added to detect binding of serum autoantibodies to the antigens. The autoantibody reactivities are revealed and quantified by scanning the slides with a scanner that can detect fluorescent signals. Here we describe methods to generate custom antigen microarrays. Our current arrays are printed with 9 solid pins and can include up to 162 antigens spotted in duplicate. The arrays can be easily customized by changing the antigens in the source plate that is used by the microarrayer. We have developed a two-color secondary antibody detection scheme that can distinguish IgG and IgM reactivities on the same slide surface. The detection system has been optimized to study binding of human and murine autoantibodies.
Keywords: Immunology, Issue 115, antigen microarray, autoantibodies, non-HLA antibodies, proteomics, fluorescence, IgG/IgM immunoglobulins, epitope mapping
Introduction
Autoantibodies are present in many disease states and can often have direct pathogenic activity1. Identification of autoantibodies is important for diagnosis of certain diseases, for prognosis of disease outcome, and for the classification of patients who may benefit from specific therapies2. Autoantibodies are typically identified in patient serum using the ELISA technique; however, screening for multiple antigens with this technique is laborious and consumes a large quantity of patient sample. New technologies are therefore needed to profile autoantibodies on a larger scale.
The antigen microarray technique is a proteomic technology that allows autoantibodies to be profiled in a multiplex fashion3. In the first step of this process, an antigen library is arrayed onto a slide surface using a robotic microarrayer. The slides are probed with diluted serum and then fluorescent-labeled secondary antibodies are added. Antibody reactivities are visualized by scanning the slides with a microarray scanner and quantified by fluorescent intensities. Antigen microarrays offer multiple advantages over the ELISA technique in screening for autoantibodies: 1) they require only microliters of serum to profile autoantibodies to multiple antigens simultaneously, 2) they use antigen sparingly, as only nanoliters of antigen are spotted onto the arrays, 3) they have enhanced sensitivity3 compared to ELISA and 4) they allow for the simultaneous yet, separate detection of more than one antibody isotype. Antigen microarrays have been used to profile autoantibodies in autoimmune diseases such as rheumatoid arthritis, multiple sclerosis, and systemic lupus erythematosus4-6. In all three of these diseases, new insight into disease pathogenesis was obtained from profiling autoantibodies on a large scale with the arrays.
Here we describe a protocol to generate antigen microarrays using nitrocellulose-coated slides. A variety of antigens including proteins, peptides, and cell lysates can be arrayed onto the slides using this technique. The arrays can be easily customized by including antigens of interest in the source plate that holds the antigen library. In addition, we show how a pair of secondary antibodies can be used to separate IgG and IgM reactivities on the same slide surface. We have now optimized this technique to measure autoantibodies in both humans and mice.
Protocol
1. Diluting Antigens and Generating Antigen Microarrays
Dilute antigens in PBS to a final concentration of 0.2 mg/ml. Print up to 162 unique antigens in duplicate with a microarrayer configuration with 9 pins. Include IgG and IgM antigens in the antigen library as positive controls. Include PBS only as a negative control.
Add 20 µl of each antigen to the 384 well source plate. Add antigens to the source plate in groups that mirror the setup of the printhead (e.g., arrange antigens in groups of 9 when 9 pins are used for printing).
Cover source plate with foil and freeze at -80 °C until ready to print arrays.
Clean solid microarrayer pins by incubating them in a sonicating bath with deionized water for 3 x 1 min. Place pins in rack to dry and then arrange pins in microarray printhead. For 9 pins, use a 3 x 3 configuration.
Program microarrayer for print run by setting number pins on printhead, number of slides to print, number of pads on each slide, and number of replicate spots for each antigen. Typically, use 9 pins, 70 slides, 2 pads/slide, and 2 replicate spots for each antigen. Program microarrayer to sonicate pins in water between different groups of antigens.
Thaw source plate and then centrifuge plate for 1 min at 100 x g. Place source plate in designated spot in microarrayer. Remove the section of foil that is covering the first group of antigens to be printed.
Arrange unprinted slides on arrayer surface and run print program. Print slides at RT with humidity set on the arrayer at 55 - 60% with the build in humidifier of the array machine.
After each group of antigens is printed on all the slides, pause the microarrayer. Cover the antigens that were just printed with foil (to prevent evaporation) and uncover the next group of antigens to be printed. Continue print program.
After all antigens have been printed, cover source plate with new piece of foil and freeze at -80 °C. Place printed slides in slide box and vacuum seal. Slides may be used the next day or up to one month later.
2. Probing Antigen Microarrays with Diluted Sera
Place slides into frames using incubation chambers. Add 700 µl of blocking buffer (2.5% [vol/vol] Fetal calf serum (FCS), 0.1% [vol/vol] Tween 20 in PBS) to each array surface.
Place adhesive film over frame and place in a sealed container with a piece of wet tissue. Incubate O/N at 4 °C on a rocker.
Dilute serum samples 1:100 in blocking buffer. Aspirate blocking solution from arrays and add 500 µl of diluted sample to each array surface.
Cover with adhesive film and incubate for 1 hr at 4° C with rocking.
Dilute secondary antibodies in blocking buffer. For human studies, dilute a Cy3 labeled goat anti-human IgG antibody to 0.33 µg/ml and a Cy5 labeled goat anti-human IgM antibody to 0.25 µg/ml. For mouse studies, dilute a Cy3 labeled goat anti-mouse IgG antibody to 0.38 µg/ml and a Cy5 labeled goat anti-mouse IgM antibody to 0.7 µg/ml.
Aspirate samples from arrays and rinse array surfaces 4 times with rinse buffer (0.1% Tween 20 in PBS). Pour buffer onto to slides and flick off quickly.
Add 700 µl of blocking buffer to wash each array surface and incubate 10 min at RT with rocking. Repeat wash step two more times.
Add 500 µl of diluted secondary antibody to each slide surface and cover with adhesive film. Incubate 45 min at 4° C with rocking.
Aspirate secondary antibody mixture from slides and rinse 4 times as above. Wash slides 3 times with 700 µl of blocking/dilution buffer as above.
Remove slides from frames and place in metal slide rack that is immersed in PBS. Incubate 20 min at RT with orbital shaking. Place in new container of PBS and incubate another 20 min with shaking.
Place slide rack in container of deionized water 15 sec. Place rack in a new container of water and incubate another 15 sec.
To dry slides, place slide rack on an ELISA plate adapter in centrifuge and spin at 220 x g for 5 min at RT.
Place slides in light-tight box until ready for scanning.
3. Scanning Antigen Microarrays and Exporting Data
Scan slides using a microarray scanner that can detect Cy3 and Cy5 fluorescent signals. In order to adjust the photomultiplier tube (PMT) levels of the scanner, pre-scan a slide that was only probed with secondary antibodies. Note: This slide should have the full antigen library printed on it including positive (IgG and IgM) as well as negative (PBS) controls. The pre-scan is a low resolution scan that allows the user quickly to find the optimal PMT settings.
Set the PMT values so that the human IgG features (on the Cy3 channel) and the human IgM features (on the Cy5 channel) have a similar median fluorescence intensity minus background (MFI-B) (typically 40,000). The PMT levels are set by pressing the "hardware" button. Once set, keep these PMT settings constant.
Scan the experimental slides on the two channels by pressing the "scan" button. Save the slide images (both channels) after each scan.
Load the slide to be analyzed into the microarray software by using the "file" button.
Load the gene array list (GAL) file by using the "file" button. The GAL file has the layout of the array with the identities of the array features.
Place the array template over the scanned image so that the arrays features match the template as closely as possible.
Align features in all blocks with the template by pressing the "align" button. The program will generally find the outline of the circular features but some manual adjustments may be necessary. These adjustments can be made by entering the feature mode. The software will then calculate a MFI-B for each of the antigens.
Use the "file" button to export these results as a text file.
4. Analyzing Array Data with Significance Analysis of Microarrays (SAM)
Load individual text files into excel and identify the columns that have MFI-B for the Cy3 and Cy5 channels.
Calculate the average for the duplicate features.
For any negative MFI-B, replace the negative number with 10. Transform data by dividing raw MFI-B by 100 and then by calculating log base 2.
Analyze log transformed data with Significance Analysis of Microarrays (SAM) as described previously7.
For a study using two groups (e.g., healthy controls vs. patients), label one group "1" and the group "2." Use a two-class, unpaired analysis in SAM to identify antigens reactivities that are significantly different between the two groups (q value < 0.05).
Use clustering and heat-map generating software to make images for presentation8.
Representative Results
Antigens are arranged in a 384 well plate and printed onto slides by a robotic microarrayer as shown in Figure 1. Figure 2 shows slides placed in a frame with incubation chambers and a scanned slide after processing. Figure 3 shows positive and negative control slides. The negative slide is only probed with secondary antibodies, and the positive control slide is probed with serum from a patient with systemic lupus erythematosus. By using two separately labeled secondary antibodies, IgG and IgM reactivities can be separated on the same slide surface. Figure 4 shows fluorescence intensity of IgM antibodies against single-stranded DNA (ssDNA) and IgG antibodies against ribosomal P (Ribo P) over a wide range of serum dilutions. In this experiment positive control serum from a patient with systemic lupus erythematosus with known reactivity against Ribo P was used. Linear responses are observed on the IgM channel over all the serum dilutions. Linear responses are observed on the IgG channel up to a MFI-B of approximately 30,000. After this point, the responses begin to saturate and increases in antibody to Ribo P do not lead to a corresponding increase in MFI-B. Figure 5 shows how the arrays can be used to detect rheumatoid factor in human serum. In this study, serum from a patient with cryoglobulinemic vasculitis with a documented rheumatoid factor (IgM antibodies against IgG) of 167 IU/ml (normal < 11 IU/ml) was used. Using secondary antibodies alone, no IgM reactivity is seen against the IgG that is spotted onto the array. In contrast, significant IgM reactivity (MFI-B of approximately 5,000) is detected against IgG when the slide is probed with serum from the patient with rheumatoid factor. Figure 6 shows the development of a two-color antigen microarray for use with mouse serum. In this figure, mouse IgM that is spotted onto the array is only detected by the anti-mouse IgM secondary antibody, and mouse IgG that is spotted onto the array is only detected by the anti-mouse IgG secondary antibody. Figure 7 shows alignment of a template grid on a scanned array image using microarray analysis software. Once the array features have been aligned with the grid, the array features can be analyzed to obtain median fluorescence intensity minus background for each feature.
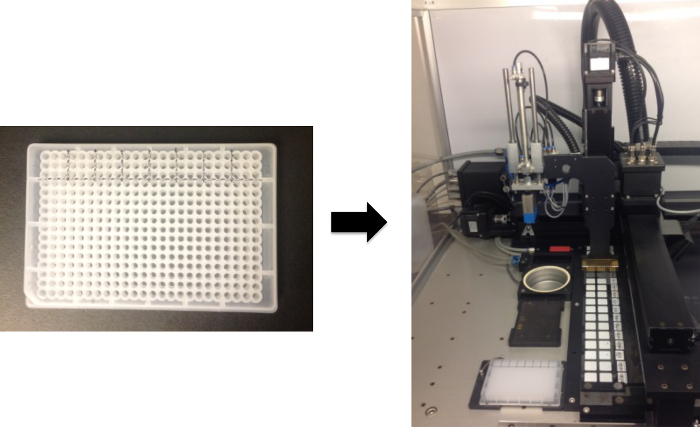 Figure 1. Generation of Antigen Microarrays. Antigens are first placed in the source plate. In the source plate shown in the figure, antigens are arranged in groups of 9, matching the 3 x 3 layout of the printhead pins. The source plate is then placed in the robotic microarrayer and the antigens are then spotted onto the slides. In this example, 2-pad FAST slides are used, allowing for identical arrays to be spotted onto the 2 nitrocellulose surfaces. Please click here to view a larger version of this figure.
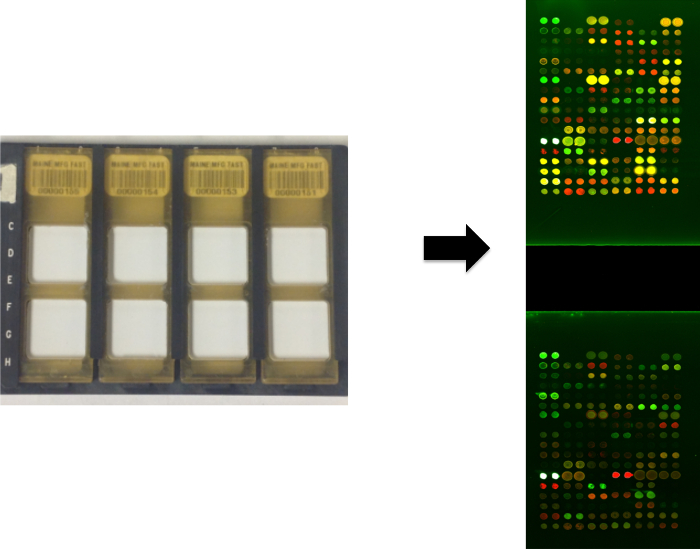 Figure 2.Processing of Antigen Microarrays. Slides are placed in FAST frames using incubation chambers and are processed by adding samples and then secondary antibodies. Antigen reactivities are revealed with a scanner capable of detecting fluorescent signals. The scanned image of a 2-pad FAST slide is shown. Please click here to view a larger version of this figure.
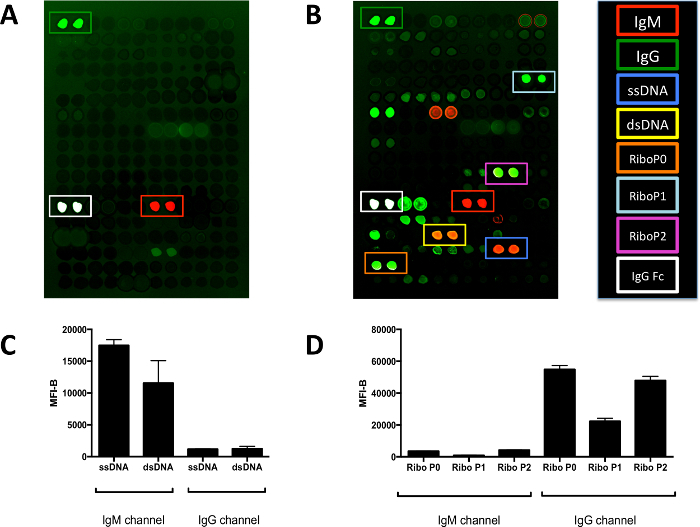 Figure 3.Two-color Antigen Microarrays Optimized for use with Human Sera. (A) IgG, IgM, and IgG Fc are detected on the array probed only with secondary antibodies. These three antigens are positive controls to show the specificity of the secondary antibodies. Red fluorescence (IgM channel) indicates binding of the anti-human IgM secondary antibody. Green fluorescence (IgG channel) indicates binding of the anti-human IgG secondary antibody. The IgG Fc antigen is white due to oversaturation. (B) Many more reactivities are detected on the array probed with positive control serum from a patient with systemic lupus erythematosus with known reactivity to Ribo P antigen. The boxes indicate the locations where DNA and Ribo P antigens have been arrayed. (C) Quantification of the fluorescence intensities in the positive control serum reveals that the majority of the antibody reactivities against DNA antigens are of the IgM isotype. (D) Quantification of the fluorescence intensities in the positive control serum reveals that the majority of the antibody reactivities against Ribo P antigens are of the IgG isotype. Array features are spotted in duplicate and are approximately 500 μm in diameter. Graphs show mean ± SD for array features. dsDNA, double stranded DNA; ssDNA, single stranded DNA; MFI-B, median fluorescence intensity minus background; Ribo P, ribosomal P. Please click here to view a larger version of this figure.
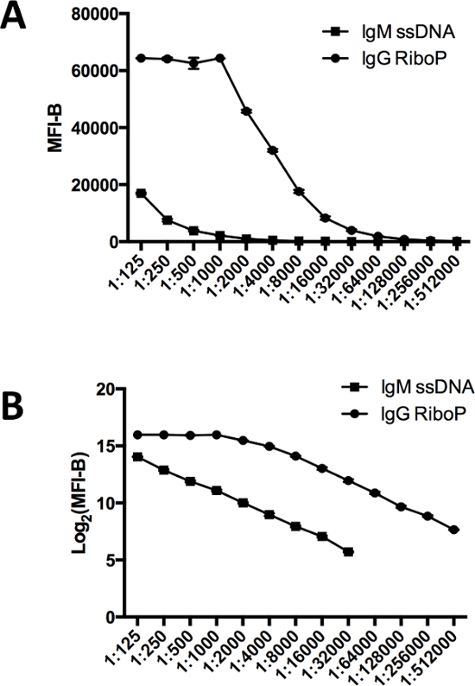 Figure 4.Fluorescence Intensity vs. Serum Dilution Factor. (A) MFI-B over a wide range of serum dilutions is shown for IgM against ssDNA and IgG against Ribo P. For these experiments, positive control serum with known IgG reactivity against Ribo P and ssDNA was used. MFI-B is saturated at a value of approximately 65,000. (B) Log2 transformation of the MFI-B data reveals linear responses on both the IgG and IgM channels over a wide range of antigen reactivities. Over a MFI-B of 30,000, the IgG signal begins to saturate and looses linearity. Array features were spotted in 6 replicates. Graphs show mean ± SD for array features. ssDNA, single stranded DNA; MFI-B, median fluorescence intensity minus background; Ribo P, ribosomal P. Please click here to view a larger version of this figure.
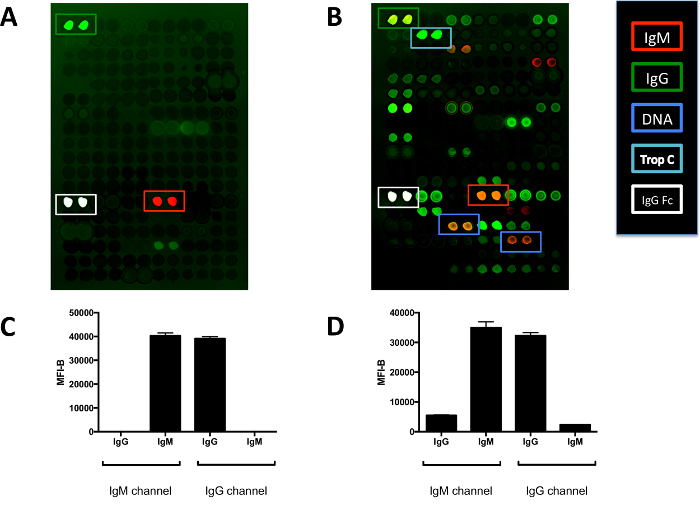 Figure 5.Detection of Rheumatoid Factor with Two-color Antigen Microarrays. (A) IgG, IgM, and IgG Fc are detected on the array probed only with secondary antibodies. Red fluorescence (IgM channel) indicates binding of the anti-IgM secondary antibody. Green fluorescence (IgG channel) indicates binding of the anti-IgG secondary antibody. The IgG Fc antigen is white due to oversaturation. (B) Array probed with serum from a patient with cryoglobulinemic vasculitis with a high rheumatoid factor. The IgG feature is green-yellow due to binding of IgM in the patient's serum to immobilized IgG. Interestingly, this patient also has IgG antibodies against IgM as the IgM feature appears orange. The patient also has a history of congenital heart disease and is noted to have high reactivity to the cardiac protein troponin C. (C) Quantification of the IgG and IgM features on the array probed only with secondary antibodies shows that the secondary antibodies do not have any crossreactivity. (D) Quantification of the IgG and IgM features on the array probed with the patient serum confirms the presence of rheumatoid factor. Features are spotted in duplicate and are approximately 500 μm in diameter. Graphs show mean ± SD for array features. MFI-B, median fluorescence intensity minus background. Please click here to view a larger version of this figure.
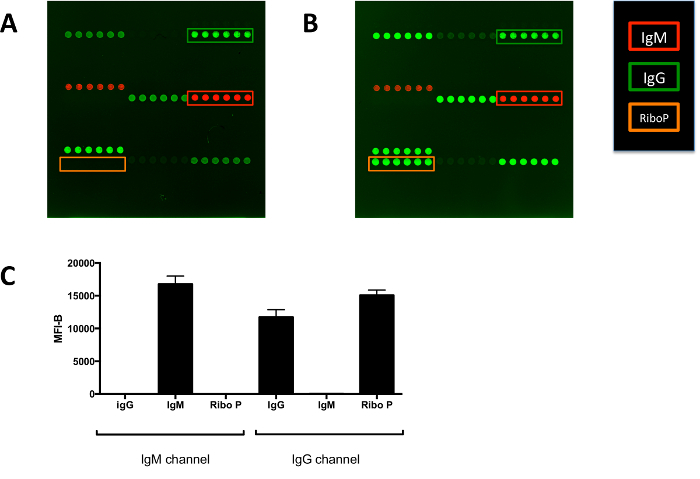 Figure 6.Development of Two-color Arrays to Profile Mouse Serum Antibodies. (A) Array probed only with secondary antibodies. Red fluorescence indicates binding of the anti-mouse IgM secondary antibody. Green fluorescence indicates binding of the anti-mouse IgG secondary antibody. The mouse IgG that is spotted onto the array is detected only by the anti-mouse IgG secondary antibody, and the mouse IgM that is spotted is detected only by the anti-mouse IgM secondary antibody. The other features on the arrays that are detected by the secondary antibodies are capture antibodies against mouse IgG or mouse IgM. (B) Array probed with a mouse IgG monoclonal antibody against histidine tags. On this array, the Ribo P antigen (recombinant his-tagged protein) is green, indicating that it is only detected by the anti-mouse IgG secondary antibody. This is expected given that the monoclonal antibody is of the IgG isotype. The Ribo P antigen is not detected when the arrays are probed with secondary antibodies alone (orange box). (C) Quantification of IgG, IgM, and Ribo P features on the array probed with a mouse IgG monoclonal antibody against histidine tags. Array features are spotted in six replicates and are approximately 500 μm in diameter. Graphs show mean ± SD for array features. MFI-B, median fluorescence intensity minus background; Ribo P, ribosomal P. Please click here to view a larger version of this figure.
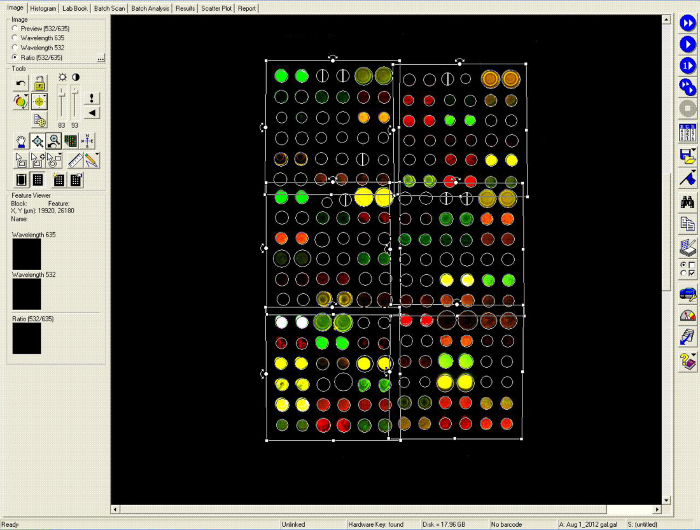 Figure 7.Alignment of a Template Grid onto an Array Image. In this screenshot, a template grid, which was generated from a gal file, was aligned with a previously scanned antigen microarray. The array was probed with serum from a patient with systemic lupus erythematosus and a blood clotting disorder who had many autoantibody reactivities. Green fluorescence represents binding of IgG antibodies and red fluorescence represents binding of IgM antibodies. The features printed by solid pins are nearly circular and are easily outlined by the microarray software (Genepix). Once the grid alignment is complete, the software can compute the median fluorescence intensity minus background (on both the Cy3 and Cy5 channels) for each of the array features. Please click here to view a larger version of this figure.
Discussion
The protocol described here allows for the quantification of autoantibodies using the antigen microarray technique. Antigen microarrays offer several advantages over conventional ELISA in screening for autoantibodies. First of all, a variety of antigens including nucleic acids, proteins, peptides, and cell lysates can be arrayed onto the nitrocellulose-coated slides, thus allowing for multiplexed screening of autoantibodies. In addition, only micrograms of antigen are necessary to generate the arrays since nanoliters of antigen are spotted onto each slide. The arrays also require very little patient sample, as only 5 μl of serum is needed to probe an array surface at a 1:100 sample dilution. Finally, arrays spotted onto nitrocellulose have been shown to be more sensitive than conventional ELISA at screening for autoantibodies9.
In addition to using antigen microarrays to screen for autoantibodies, the arrays can be used to detect reactivity against non-self proteins (e.g., viral proteins), to define the specificity of monoclonal antibodies, and to measure levels of non-HLA antibodies in transplantation as described previously9-12. Antigen microarrays can also be used to perform detailed epitope mapping experiments where overlapping peptides of a single protein are arrayed onto a slide. A recent study used this approach to define epitopes of the U1-70K protein that are targets of autoantibodies in systemic lupus erythematosus13.
Using the protocol described here, the detection of IgG and IgM reactivities is linear over a wide range of serum dilutions. These studies were performed using positive control serum from a patient with systemic lupus erythematosus with known reactivity to ribosomal P antigen and ssDNA. IgM reactivity to ssDNA is linear at serum dilutions of 1:125 to 1:32,000, corresponding to MFI-B of 17,000 to 50. IgG reactivity to Ribo P is linear at serum dilutions of 1:4000 to 1:512,000, corresponding to MFI-B of 32,000 to 200. At dilutions lower than 1:4,000 (and MFI-B greater than 32,000), the detection curve of IgG reactivity flattens and is no longer linear. In work with heart transplant recipients, serum is routinely diluted to 1:100 as MFI-B for antigens rarely exceeds 10,000 at this dilution. For studies with patients with autoimmune disease with high titer autoantibodies, patient samples may need to be diluted further to ensure that the majority of autoantibody reactivities fall within the linear range of the assay.
While MFI-B can be useful to compare autoantibody reactivities between groups of patients, it may also be useful to convert this value into a more quantitative measure of autoantibody levels. This can be accomplished by spotting multiple known dilutions of purified IgG and IgM onto the slides to generate a standard curve. Using this curve, MFI-B can then be transformed into an autoantibody level for each antigen.
In the protocol presented here, 2-pad nitrocellulose-coated slides were used. On these slides, two identical arrays, which can be probed with two separate serum samples, are printed onto each slide. This allows two samples from the same patient (such as pre and post treatment) to be compared on the same slide, which minimizes interslide variability. Thirty-two slides with 64 individual patient samples are routinely processed at the same time in one day. The most current array is printed with 9 pins, allowing for 162 antigens to be printed in duplicate (each pin prints a 36 feature subarray which equals 18 antigens printed in duplicate).
The antigen microarrays generated in this protocol were printed with solid microarrayer pins. Printing with solid pins is more time consuming than printing with quill style pins since the microarrayer must re-dip into the source plate after each time that the pins touch the slide surface. Solid pins were used as they produce highly reproducible, nearly circular array features (approximately 500 μm in diameter). These features can be easily detected and outlined by the scanner software, and minimal manual adjustments are needed to quantify the array features. Solid pins also allow for cell lysates to be printed, which may be difficult to print with quill pins due to their higher viscosity. Due to the long printing times involved with solid pins (sometimes 10 - 11 hr to print 70 slides), antigens that are not being printed in the source plate are covered with foil to prevent evaporation.
The protocol described here presents a method to separate IgG and IgM reactivities on the same slide surface. The arrays have been optimized to screen for both human and mouse antibodies using pairs of secondary antibodies labeled with different fluorophores. Critical to this two-color approach is identifying secondary antibodies that are highly specific for either IgG or IgM isotypes. The secondary antibodies that are used recognize the Fc portion of IgG or IgM and do not cross-react with each other. Separating the IgG and IgM signals is important given the different functions of these antibodies in immune responses. For example, IgM is produced at higher levels by B1 cells and is typically a marker of an early immune response. On the other hand, IgG is a marker of a later immune response, which develops as a result of class switching14. By detecting the IgG and IgM signals separately, it is also possible to identify IgM rheumatoid factors in patient samples (i.e., IgM immunoglobulins that bind to IgG that has been spotted onto the array). By spotting different portions of antibodies (e.g., Fc versus Fab), binding of rheumatoid factor to different IgG antibody epitopes can be quantified. With the availability of scanners with more than two lasers, additional secondary antibodies could be added to the current secondary antibody pair to identify binding of IgA, IgD or IgE antibodies. Secondary antibodies could also be identified that would allow for identification of separate IgG subclasses (IgG1, IgG2, IgG3, IgG4) bound to antigens on a single array.
In conclusion, the antigen microarray technique is a robust technology allowing for the high-throughput characterization of serum autoantibodies. This technique is highly customizable and sensitive. The fluorescent-based detection system has been optimized for both human and mouse studies and allows for the simultaneous detection of IgG and IgM antibodies.
Disclosures
The authors have nothing to disclose.
Acknowledgments
A.C. was supported by a postdoctoral fellowship from the Heart and Stroke Foundation of Canada and the Training Program in Regenerative Medicine (Canadian Institutes of Health Research). F.Y.Y.H. was supported by the Training Program in Regenerative Medicine. This work was funded by a grant from Astellas Pharma Canada. We also would like to thank Dr. Mark Menenghini (University of Toronto) for use of his Axon microarray scanner.
References
- Naparstek Y, Plotz PH. The role of autoantibodies in autoimmune disease. Annu Rev Immunol. 1993;11:79–104. doi: 10.1146/annurev.iy.11.040193.000455. [DOI] [PubMed] [Google Scholar]
- Damoiseaux J, Andrade LE, Fritzler MJ, Shoenfeld Y. Autoantibodies 2015: From diagnostic biomarkers toward prediction, prognosis and prevention. Autoimmun Rev. 2015;14:555–563. doi: 10.1016/j.autrev.2015.01.017. [DOI] [PubMed] [Google Scholar]
- Robinson WH, et al. Autoantigen microarrays for multiplex characterization of autoantibody responses. Nature. medicine. 2002;8:295–301. doi: 10.1038/nm0302-295. [DOI] [PubMed] [Google Scholar]
- Quintana FJ, et al. Antigen microarrays identify unique serum autoantibody signatures in clinical and pathologic subtypes of multiple sclerosis. Proc. Natl. Acad. Sci. USA. 2008;105:18889–18894. doi: 10.1073/pnas.0806310105. [DOI] [PMC free article] [PubMed] [Google Scholar]
- Hueber W, et al. Antigen microarray profiling of autoantibodies in rheumatoid arthritis. Arthritis Rheum. 2005;52:2645–2655. doi: 10.1002/art.21269. [DOI] [PubMed] [Google Scholar]
- Price JV, et al. Protein microarray analysis reveals BAFF-binding autoantibodies in systemic lupus erythematosus. J. Clin. Invest. 2013;123:5135–5145. doi: 10.1172/JCI70231. [DOI] [PMC free article] [PubMed] [Google Scholar]
- Tusher VG, Tibshirani R, Chu G. Significance analysis of microarrays applied to the ionizing radiation response. Proc. Natl. Acad. Sci. USA. 2001;98:5116–5121. doi: 10.1073/pnas.091062498. [DOI] [PMC free article] [PubMed] [Google Scholar]
- Eisen MB, Spellman PT, Brown PO, Botstein D. Cluster analysis and display of genome-wide expression patterns. Proc. Natl. Acad. Sci. USA. 1998;95:14863–14868. doi: 10.1073/pnas.95.25.14863. [DOI] [PMC free article] [PubMed] [Google Scholar]
- Chruscinski A, et al. Generation of Antigen Microarrays to Screen for Autoantibodies in Heart Failure and Heart Transplantation. PloS one. 2016;11:e0151224. doi: 10.1371/journal.pone.0151224. [DOI] [PMC free article] [PubMed] [Google Scholar]
- Price JV, et al. Characterization of influenza vaccine immunogenicity using influenza antigen microarrays. PloS one. 2013;8:e64555. doi: 10.1371/journal.pone.0064555. [DOI] [PMC free article] [PubMed] [Google Scholar]
- Singh H, et al. Reactivity profiles of broadly neutralizing anti-HIV-1 antibodies are distinct from those of pathogenic autoantibodies. Aids. 2011;25:1247–1257. doi: 10.1097/QAD.0b013e32834785cf. [DOI] [PMC free article] [PubMed] [Google Scholar]
- Porcheray F, et al. Chronic humoral rejection of human kidney allografts associates with broad autoantibody responses. Transplantation. 2010;89:1239–1246. doi: 10.1097/TP.0b013e3181d72091. [DOI] [PMC free article] [PubMed] [Google Scholar]
- Haddon DJ, et al. Mapping epitopes of U1-70K autoantibodies at single-amino acid resolution. Autoimmunity. 2015;48:513–523. doi: 10.3109/08916934.2015.1077233. [DOI] [PMC free article] [PubMed] [Google Scholar]
- Schroeder HW, Jr, Cavacini L. Structure and function of immunoglobulins. J Allergy Clin Immunol. 2010;125:S41–S52. doi: 10.1016/j.jaci.2009.09.046. [DOI] [PMC free article] [PubMed] [Google Scholar]


