Abstract
The reversibility of tissue remodeling is of general interest to medicine. Pulmonary arterial tissue remodeling during hypertension induced by hypoxic breathing is well known, but little has been said about the recovery of the arterial wall when the blood pressure is lowered again. We hypothesize that tissue recovery is a function of the oxygen concentration, blood pressure, location on the vascular tree, and time. We measured the changes of blood pressure, vessel lumen, vessel wall thicknesses, and opening angle of each segment of the blood vessel at its zero-stress state after step changes of the oxygen concentration in the breathing gas. The zero-stress state of each vessel is emphasized because it is important to the analysis of stress and strain and in morphometry. Experimental results are presented as histories of tissue parameters after step changes of the oxygen level. Tissue characteristics are examined under the hypothesis that they are linearly related to changes in the local blood pressure. Under this linearity hypothesis, each aspect of the tissue change can be expressed as a convolution integral of the blood pressure history with a kernel called the indicial response function. It is shown the indicial response function for rising blood pressure is different from that for falling blood pressure. This difference represents a major nonlinearity of the tissue remodeling process of the blood vessels.
Keywords: indicial response function, blood vessel opening angle at zero-stress state, nonlinearity of tissue remodeling
It is well known that blood flow in pulmonary arteries becomes hypertensive when an animal breathes a gas the oxygen concentration of which is lower than that of normal sea level air. It is also known that hypertension leads to hypertrophy in blood vessels, and returning to normal blood pressure mitigates the symptom. The question is whether the processes of hypertrophy and recovery are symmetric. Considerable data on the building up of the lung tissue due to pulmonary hypertension have been obtained (1-14). Some data on recovery from hypertension are also given in refs. 1, 4, and 5. These studies considered neither the zero-stress state, which is characterized by an opening angle of the blood vessels, nor the elastic moduli of the blood vessel walls. The significance of the zero-stress state and the change of Young's modulus were recognized later (8, 10, 11, 15-19).
So far as we are aware, there has been no study on the recovery of the zero-stress state of a vascular tissue that was subjected to hypertension for some time but was returned to the normal condition later. Recovery can be expected to be a complex function of space, time, stress, and strain. The objective of this article is to clarify these points.
Materials and Methods
Animals. Ninety-two male Sprague-Dawley rats (Harlan, San Diego), ≈3 months old, body weight 300-350 g, raised in normal air at sea level, were used. These rats were cared for 1 week or more after arrival at the vivarium before being used, to allow them to recover from any unknown stress or hypoxia suffered during transportation. The protocol of animal use was approved by the University of California at San Diego Committee on Animal Research.
Experimental Procedure. Rats were placed in a modified commercial chamber (Snyder, Denver), in which the oxygen concentration in the breathing gas can be controlled dynamically by infusion of pure N2 and a feedback-control system of O2 sensor. The oxygen concentration in the rats' breathing gas in the chamber was 20.9% at the beginning, then reduced to 10% and maintained constant for a specific length of time called the hypoxic period, and finally returned to 20.9% and maintained constant for a specific length of time called the recovery period. According to the lengths of the periods of hypoxia and recovery, each animal is designated by a symbol such as H2hR2h to denote hypoxic (H) for 2 h, recovery (R) for 2 h. Rats were divided into five groups: (i) hypoxic 2-h series, (ii) hypoxic 24-h series, (iii) hypoxic 4-day series, (iv) hypoxic 10-day series, and (v) hypoxic 30-day series.
At the end of an experiment, each rat was anesthetized by an i.p. injection of pentobarbital sodium (40 mg/kg body weight), and blood pressure in the anesthetized rat's pulmonary arterial trunk was measured as described in detail in ref. 8. The lungs were excised and placed in a bath of 4°C Krebs solution bubbled with a gas mixture of 95% O2 - 5% CO2, the left lungs for the measurement of the opening angle at the zero-stress state and the right lungs for histological measurements.
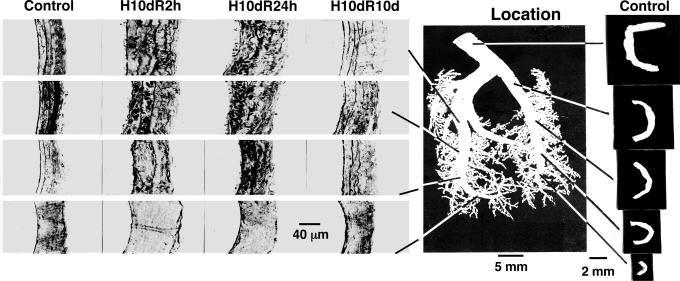
Opening Angle at the Zero-Stress State. The main left pulmonary arterial tree was isolated and excised with the aid of a stereomicroscope and transferred into a bath of aerated Krebs solution at room temperature. Specific pulmonary arteries were identified, and their zero-stress state was measured in terms of the opening angle by the method described in refs. 8 and 10. Photographs of some specimens at the zero-stress state are shown in Fig. 1 Right.
Fig. 1.
Tissue remodeling. (Left) Histological micrographs of the cross sections of the walls of rat pulmonary arteries of various orders. Arteries of decreasing order numbers from 11 to 8 (10) are arranged in columns in increasing row numbers. Each panel shows a full thickness with endothelium on the left and adventitia on the right. The first column shows the wall structure of the controls; the second column shows the wall structure after 10 days of hypertension at 10% O2, recovered for 2 h of rebreathing sea level atmosphere (H10dR2 h). The third column is for rats subjected to hypertension 10 days and recovery of 24 h (H10dR24h). The fourth column is for hypertension 10 days and recovery 10 days (H10dR10d). (Center) Photograph of a polymer cast of normal pulmonary arteries showing the locations of arteries of orders 8-12. (Right) The cross sections of normal pulmonary arteries at zero-stress state. Arteries of decreasing order numbers from 12 to 8 are arranged in the column in increasing row numbers, i.e., the first row for an order 12 vessel, the second row for an order 11 vessel, and the last row for an order 8 vessel. (Left, endothelial).
Histological Measurements. The method of refs. 8 and 10 was followed. The pulmonary arteries in the right lung were perfused with 2.5% glutaraldehyde in phosphate buffer (pH 7.4) at 20-cm H2O for 2 h. The arterial vessel segments are identified by their order numbers, 1 being the smallest, according to ref. 2. Vessels of orders 8-11, as shown in Fig. 1, were dissected, postfixed in a solution of 2% OsO4 for 2 h, washed with distilled water, dehydrated, embedded in Medcast resin (Ted Pella, Tustin, CA), cut into 1-μm-thick sections by planes perpendicular to the longitudinal axis of the blood vessel, stained with toluidine blue O, and examined by a light microscope (Vanox AH2; Olympus, Melville, NY). The vascular images were digitized and analyzed. Data on the cross-sectional areas and thicknesses of the medial and adventitial layers were collected.
Formulation of a Basic Hypothesis on Tissue Remodeling of Pulmonary Blood Vessels in Hypertension and Recovery. In engineering, if y(t) is a variable characterizing a dynamics system, and y(t) is a linear functional of another function x(t), then the differential change of y(t) in response to a unit step differential change of x(t) is called the indicial function of y(t) in response to a unit step change of x(t). Applying this terminology to our system, let y stand for the opening angle or the lumen diameter, etc., and let x stand for the blood pressure. If the differential relationship between the cause (x) and effect (y) were functionally linear, then the most general relationship between x and y can be expressed in the form
 |
1 |
in which F(t - τ) is a function of the time difference t - τ, the aforementioned indicial function.
A considerable amount of experimental results are available to suggest that the pulmonary arterial wall tissue remodeling obeys Eq. 1 if x represents increasing hypertension; i.e., x = P and dP/dt > 0; and y represents any one of the tissue characteristics. However, when the animal recovers from hypertension, i.e., the blood pressure decreases with time, dΔP/dt, the results presented below suggest that Eq. 1 holds also, but the indicial function for recovery, i.e., for decreasing hypertension, dΔP/dt < 0, is different from that for increasing hypertension, dΔP/dt > 0. This difference in the indicial functions is believed to represent a significant nonlinearity of tissue remodeling. We present this hypothesis in mathematical form below.
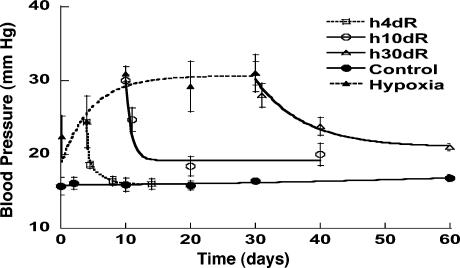
Typical time courses of pulmonary blood pressure are shown in Fig. 2. A healthy animal has a fairly stable pulmonary blood pressure. In experimental animals, an increase in pulmonary blood pressure occurred at t = 0, by a step lowering of the oxygen concentration in the gas the animal breathed, because hypoxia causes a shortening of the pulmonary vascular smooth muscles. A sudden contraction of the diameters of pulmonary blood vessels without a significant change in cardiac output causes a sudden increase in pulmonary blood pressure. Without further change of oxygen tension, the hypertension continued until an instant of time t1. At t = t1, the oxygen tension in the breathing gas was returned to the normal atmospheric value, the high blood pressure dropped, and the lung tissue remodeled in the recovery mode. Let L(t) be a parameter of the system responding to ΔP(t), e.g., the blood vessel wall thickness and ΔL(t) = L(t) - Lcontrol(t). According to the functionally linear hypotheses named above, but admitting a nonlinearity that says the indicial function for rising blood pressure is different from that for a decreasing blood pressure, then we have two indicial functions,  for increasing blood pressure and
  for decreasing blood pressure, so that
 |
2 |
Fig. 2.
Change in blood pressure in the pulmonary arterial trunk during the periods of control, hypoxia, and recovery. The data in hypoxia period are from refs. 8 and 9. H4dR, 4 days of hypoxia followed by recovery; H10dR, 10 days of hypoxia followed by recovery; and H30dR, 30 days of hypoxia followed by recovery. Plotted values are mean ± SD, with SD shown by flags.
This equation is our basic hypothesis.
In the following, we shall extract the two indicial functions  and
and  from experimental data. We use Laplace transformation to reduce Eq. 2 into algebraic equations. The Laplace transforms of ΔP(t), ΔL(t),
  and
and  are denoted by ΔP(s), ΔL(s),
  , and
, and  , which are obtained by multiplication with e-st and integrating the product with respect to t from 0 to ∞.
  and
and  can be derived as
 |
3 |
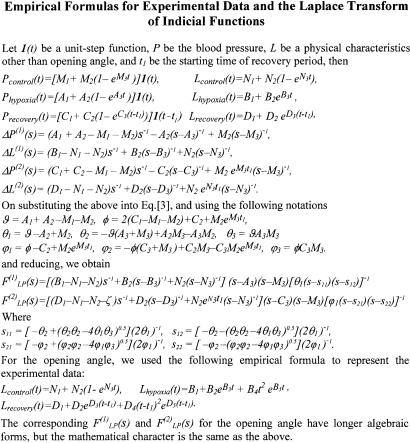
where  . The Laplace transforms and related fitting formulas are listed in Fig. 3. Use of formula 5, section 5.2, page 239 in Erdelyi (21) yields the inverse transforms of Eq. 3. See Fig. 4 for detailed expressions.
Fig. 3.
Empirical formulas for blood pressure, structural parameters, opening angles of pulmonary arteries, and Laplace transforms of indicial functions. The empirical constants M1, M2, M3, N1, N2, N3, A1, A2, A3, B1...B5, and D1...D5, are presented in Table 1.
Fig. 4.
Mathematical expressions of  and
and  for the rat pulmonary arteries of orders 11-8.
Data Handling and Statistics. In reducing our data to determine the indicial functions, we first fitted the raw data that were plotted in Figs. 2 and 5, 6, 7 by empirical formulas listed in Fig. 3, where 1(t) is a unit-step function of t, which equals 0 when t < 0 and 1 when t ≥ 0. Then we used the empirical formulas to determine the Laplace transformations of the desired quantities. The goodness of this procedure was examined by computing the correlation coefficients between the values measured, (xi), with the values computed from the fitted formulas, (yi). The correlation coefficient is obtained by dividing the sum of the products of xi and yi by the product of the root-mean-square of xi and yi. Our results show that the correlation coefficient of the blood pressure values P is ≥0.992 for the cases of H4dR, ≥0.994 for H10dR, and ≥0.983 for H30dR. For the tissue responses of wall thickness, lumen area, and circumference, the correlation coefficients were in the range 0.890-0.999. For the opening angle, the correlation coefficient was in the range 0.810-0.999. The results are shown in Table 1, which is published as supporting information on the PNAS web site. We consider these correlation coefficients to be sufficiently high for the qualitative conclusions we wish to draw, and they can be used to estimate the accuracy of the quantitative results shown in Figs. 5, 6, 7, 8, 9, 10, 11.
Fig. 5.
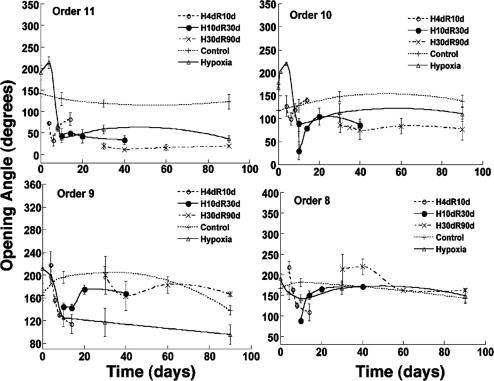
Remodeling of the opening angle of the pulmonary arteries. The time courses are for the control, hypoxia, and recovery periods.
Fig. 6.
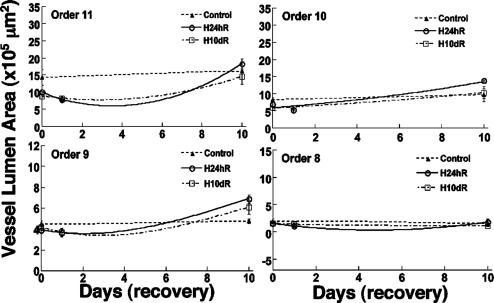
Remodeling of the lumen area of the pulmonary arteries. The time courses are for the periods of control and recovery from hypertension.
Fig. 7.
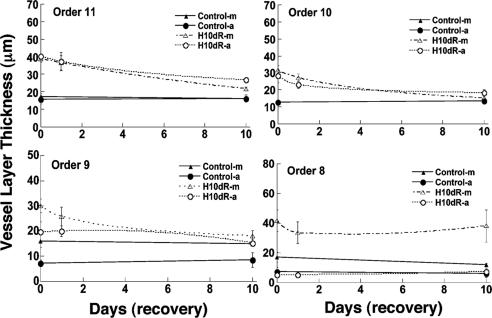
Remodeling of the layer thickness. The history of the thicknesses of the media (m) and adventitia layers (a) of the pulmonary arteries of orders 11-8 in 10-day control and recovery from hypertension periods are shown.
Fig. 8.
Indicial response functions of the opening angle. The hypertension indicial function  of the opening angles of rat pulmonary arteries of orders 11-8 (left) and the recovery indicial function
  after 10 days of hypoxia (Right) are shown. (1 mmHg = 133 Pa.)
Fig. 9.
Indicial response functions of the lumen area. The hypertension indicial function  of the lumen area of cross sections of rat pulmonary arteries of orders 11-8 (Left) and the recovery indicial function
  after 10 days of hypoxia (Right) are shown.
Fig. 10.
Indicial response functions of wall cross-section area. The hypertension indicial function  of the wall cross-section area of rat pulmonary arteries of orders 11-8 (Left) and the recovery indicial function
  after 10 days of hypoxia (Right) are shown.
Fig. 11.
Indicial response functions of wall thickness. The hypertension indicial function  of the wall cross-thickness of rat pulmonary arteries of orders 11-8 (Left) and the recovery indicial function
  after 10 days of hypoxia (Right) are shown.
Results
Fig. 1 shows photographs of the polymer cast of a pulmonary arterial tree of the rat at the center, micrographs of the walls of arteries of orders 8-11 (Fig. 1 Left), and the opening angle of arteries of orders 8-12 (Fig. 1 Right). The order numbers are assigned according to refs. 10 and 20. The opening angle of the order 12 artery shown here is 286°, and those of orders 11, 10, 9, and 8 are 110°, 111°, 62°, and 97°, respectively. Note that the vessel wall structure of order 8 (with vessel lumen diameter in the range 338-497 μm) is different from those of orders 9, 10, and 11, confirming an observation made by Meyrick and Reid (4) that the small pulmonary arteries in this diameter range are thick-walled and have oblique muscles (22).
Fig. 2 shows the histories of the blood pressure of the normal controls, the hypertensive rats due to hypoxic breathing, and the rats that were first subjected to hypertension then taken out of the hypoxic chamber to recover at specified times. The blood pressure history is complex, and it is necessary to use an analytic method to extract the indicial functions. If the hypoxic period were <4 days, the blood pressure could return to the normal value (P > 0.05). For a hypoxic period of 10 days or more, the recovery was seen to be slower and incomplete (P < 0.05).
Fig. 5 shows the history of the opening angle of the rat's pulmonary arteries of orders 11-8 in control rats and in rats that were subjected to step hypoxia as well as those subjected to step-hypoxia-step-recovery conditions (numerical results are listed in Table 2, which is published as supporting information on the PNAS web site). Usually the opening angles of hypoxic vessels were bigger than those of normal vessels for all orders at the end of the first week; then were decreased to below normal values afterward. The opening angles of arteries of orders 11-8 had sharp changes at first when the rats recovered from 10% hypoxia. In rats subjected to hypoxia for 10 or 30 days, the opening angles of the arteries of orders 11 and 10 never recovered to normal values, but arteries of the orders 9 and 8 did return to normal values. It is seen that the rate of recovery of the opening angle was slower when the hypoxic period was longer.
Fig. 6 shows the history of the lumen area of the pulmonary arteries of orders 11-8 in similar cases of normal control and hypertension-recovery conditions. The lumen areas of the hypoxic pulmonary arteries of orders 11-9 usually are smaller than those of the control rats at first, then become bigger during the remodeling of recovery.
Fig. 7 shows the corresponding histories of the thicknesses of the media and the adventitia layers of the pulmonary arteries of orders 11-8 in the control and the hypoxic 10-day recovery conditions. The hypoxic thicknesses tended to decrease toward their normal values in the remodeling of recovery. However, for the small vessels of order 8, the thickness of media was increasingly different from the normal value, whereas the thicknesses of adventitia showed no difference between normal and hypoxia recovery. The data presented in Figs. 6 and 7 are listed in Table 3, which is published as supporting information on the PNAS web site.
Our results on the indicial functions are shown in Figs. 8, 9, 10, 11. Fig. 8 shows the curves of the hypertensive indicial function  of the opening angles (Fig. 8 Left) and the recovery indicial function
  of the opening angles (Fig. 8 Right).
Fig. 9 shows the indicial functions of the area of the vessel lumen in cross sections perpendicular to the longitudinal axis of the pulmonary arteries of orders 8-11, in response to changes of blood pressure either in the hypertensive state [ , Fig. 9 Left] or in the recovery state [
 , Fig. 9 Right] after 10 days of hypoxia. The difference between
  and
and  is striking: they are certainly not mirror images of each other.
Fig. 10 shows the contrast between the hypertensive indicial functions  and the recovery indicial functions
  for the cross-sectional area of the pulmonary arteries of orders 8-11. It is evident that the wall cross areas of larger vessels show bigger changes.
Fig. 11 shows the indicial functions  and
and  of the wall thicknesses of the pulmonary arteries of orders 8-11. Again it is clear that
  and
and  are not mirror images of each other. The hypertensive indicial functions
  for the arteries of orders 9-11 reach their peaks approximately on the 5th day of hypoxia. The recovery indicial functions
  for these arteries have no peaks or valleys. The
  and
and  of the thick-walled arteriole of order 8 is unique; its
  has a peak at about the third day of hypoxia.
Discussion
Data on the remodeling of the zero-stress state of pulmonary arteries in response to a lowering of hypoxic hypertensive blood pressure are reported here. Some data on the remodeling of the morphometric features of pulmonary arteries are given in refs. 1-7, with which we found qualitative agreement. The mathematical expressions of indicial functions in hypertension and recovery are believed to be previously undescribed.
We emphasize that the hypothesis of differential linearity on which Eqs. 1 and 2 are based has not been fully validated yet. Hence the range of validity of these indicial functions is still unknown. To carefully validate the linearity hypothesis is one of most important projects to be done in the future.
In practical animal experiments, no method is known that can vary the amplitude of blood pressure alone. We believe that a practical way to test the linearity hypothesis is to compute the indicial functions and then test the null hypothesis that the indicial functions are independent of the blood pressure level. Indeed, blood pressure oscillates at a high frequency and has unique stochastic features. We have contributed a method to make a detailed study of this variation of blood pressure in 1 day (23, 24). However, in the present article, we handled the mean blood pressure in a primitive way, in keeping with the belief that tissue remodeling is a slow process. This concept probably needs revision. There must be high-frequency features in gene action and protein configuration changes. The study of the high-frequency features of cell and tissue remodeling and merging into the low-frequency features presented in the present paper are important themes for future research.
Conclusion
Use of indicial functions is a convenient method to look at the dynamics of a living system involving tissue remodeling. The results shown in Figs. 2, 3, 4, 5, 6, 7 may be called indicial functions of pulmonary arterial wall tissue remodeling with respect to step changes of oxygen tension in the breathing gas. The data shown in Figs. 2, 3, 4, 5, 6, 7 were relatively easy to obtain, but their interpretation is complex, requiring information on cardiac action and peripheral circulation. We hypothesize that tissue remodeling is a local phenomenon, and we need to examine the indicial functions of tissue remodeling with respect to local stimulations such as local blood pressure, local tissue stress, tissue strain, cellular stress, or cellular strain. The method for deducing hypertensive indicial functions and recovery indicial functions with respect to blood pressure is illustrated here. The curves in Figs. 8, 9, 10, 11 are previously unshown, with which scientists need to become familiar. The most important feature revealed in Figs. 8, 9, 10, 11 is that  is not a mirror image of
  . The process of recovery and the ultimate fate are not simply the reverse of injury; this is common sense. To use this process in medicine requires scientific information. Therefore, the biology of recovery is an independent subject to be studied in its own right.
Supplementary Material
Acknowledgments
This research was supported by the U.S. Public Health Service, the National Institutes of Health, and the National Heart, Lung, and Blood Institute through Grants HL 26647 and HL 43026; and by the National Science Foundation through Grant BCS 89-17576.
References
- 1.Abraham, A. S., Kay, J. M., Cole, R. B. & Pincock, A. C. (1971) Cardiovasc. Res. 5, 95-102. [DOI] [PubMed] [Google Scholar]
- 2.Heath, D., Edwards, C., Winson, M. & Smith, P. (1973) Thorax 28, 24-28. [DOI] [PMC free article] [PubMed] [Google Scholar]
- 3.Hislop, A. & Reid, L. (1977) Br. J. Exp. Pathol. 58, 653-662. [PMC free article] [PubMed] [Google Scholar]
- 4.Meyrick, B. & Reid, L. (1980) Lab. Invest. 42, 603-615. [PubMed] [Google Scholar]
- 5.Sobin, S. S., Tremer, H. M., Hardy, J. D. & Chiodi, H. P. (1983) J. Appl. Physiol. 55, 1445-1455. [DOI] [PubMed] [Google Scholar]
- 6.McKenzie, J. C., Clancy, J., Jr., & Klein, R. M. (1984) Blood Vessels 21, 80-89. [PubMed] [Google Scholar]
- 7.Hung, K. S., McKenzie, J. C., Mattioli, L., Klein, R. M., Meno, C. D. & Poulose, A. K. (1986) Acta Anat. 126, 13-20. [DOI] [PubMed] [Google Scholar]
- 8.Fung, Y.-C. & Liu, S. Q. (1991) J. Appl. Physiol. 70, 2455-2470. [DOI] [PubMed] [Google Scholar]
- 9.Huang, W., Shen, Z., Huang, N. E. & Fung, Y.-C. (1999) Proc. Natl. Acad. Sci. USA 96, 1834-1839. [DOI] [PMC free article] [PubMed] [Google Scholar]
- 10.Huang, W., Sher, Y. P., Delgado-West, D., Wu, J. T., Peck, K. & Fung, Y.-C. (2001) Ann. Biomed. Eng. 29, 535-551. [DOI] [PubMed] [Google Scholar]
- 11.Huang, W., Delgado-West, D., Wu, J. T. & Fung, Y.-C. (2001) Ann. Biomed. Eng. 29, 552-562. [DOI] [PubMed] [Google Scholar]
- 12.Huang, W., Sher, Y. P., Peck, K. & Fung, Y.-C. (2002) Proc. Natl. Acad. Sci. USA 99, 2603-2608. [DOI] [PMC free article] [PubMed] [Google Scholar]
- 13.Mandegar, M., Remillard, C. V. & Yuan, J. X. (2002) Prog. Cardiovasc. Dis. 45, 81-114. [DOI] [PubMed] [Google Scholar]
- 14.Budhiraja, R., Tuder, R. M. & Hassoun, P. M. (2004) Circulation 109, 159-165. [DOI] [PubMed] [Google Scholar]
- 15.Fung, Y.-C. (1984) Biodynamics: Circulation (Springer, New York), 2nd Ed.
- 16.Vaishnav, R. N. & Vossoughi, J. (1983) in Biomedical Engineering II, Recent Developments, ed. Hall, C. W. (Pergamon, New York), pp. 330-333.
- 17.Fung, Y.-C. & Liu, S. Q. (1989) Circ. Res. 65, 1340-1349. [DOI] [PubMed] [Google Scholar]
- 18.Li, Z. J., Huang, W. & Fung, Y.-C. (2002) Ann. Biomed. Eng. 30, 379-391. [DOI] [PubMed] [Google Scholar]
- 19.Liu, S. Q. & Fung, Y.-C. (1996) Am. J. Physiol. 270, H1323-H1333. [DOI] [PubMed] [Google Scholar]
- 20.Jiang, Z. L., Kassab, G. S. & Fung, Y.-C. (1994) J. Appl. Physiol. 76, 882-892. [DOI] [PubMed] [Google Scholar]
- 21.Erdelyi, A. (1954) Tables of Integral Transforms (McGraw-Hill, New York), Vol. 1.
- 22.Meyrick, B., Hislop, A. & Reid, L. (1978) J. Anat. 125, 209-221. [PMC free article] [PubMed] [Google Scholar]
- 23.Huang, W., Shen, Z., Huang, N. E. & Fung, Y.-C. (1998) Proc. Natl. Acad. Sci. USA 95, 4816-4821 [DOI] [PMC free article] [PubMed] [Google Scholar]
- 24.Huang, W., Shen, Z., Huang, N. E. & Fung, Y.-C. (1998) Proc. Natl. Acad. Sci. USA 95, 12766-12771. [DOI] [PMC free article] [PubMed] [Google Scholar]
Associated Data
This section collects any data citations, data availability statements, or supplementary materials included in this article.


