

Abstract
Recent advances in gene therapy and genome-engineering technologies offer the opportunity to correct sickle cell disease (SCD), a heritable disorder caused by a point mutation in the β-globin gene. The developmental switch from fetal γ-globin to adult β-globin is governed in part by the transcription factor (TF) BCL11A. This TF has been proposed as a therapeutic target for reactivation of γ-globin and concomitant reduction of β-sickle globin. In this and other approaches, genetic alteration of a portion of the hematopoietic stem cell (HSC) compartment leads to a mixture of sickling and corrected red blood cells (RBCs) in periphery. To reverse the sickling phenotype, a certain proportion of corrected RBCs is necessary; the degree of HSC alteration required to achieve a desired fraction of corrected RBCs remains unknown. To address this issue, we developed a mathematical model describing aging and survival of sickle-susceptible and normal RBCs; the former can have a selective survival advantage leading to their overrepresentation. We identified the level of bone marrow chimerism required for successful stem cell-based gene therapies in SCD. Our findings were further informed using an experimental mouse model, where we transplanted mixtures of Berkeley SCD and normal murine bone marrow cells to establish chimeric grafts in murine hosts. Our integrative theoretical and experimental approach identifies the target frequency of HSC alterations required for effective treatment of sickling syndromes in humans. Our work replaces episodic observations of such target frequencies with a mathematical modeling framework that covers a large and continuous spectrum of chimerism conditions.
Keywords: Sickle cell disease, fetal hemoglobin, BCL11A
INTRODUCTION
Sickle cell disease (SCD) is a hereditary blood disorder [1] that results from a point mutation in the β-globin gene, leading to a Glu→Val substitution in the protein, yielding sickle β-globin (βS) [2]. A human fetus is initially not affected by this mutation, because fetal blood is dominated by expression of γ-globin in red blood cells (RBCs), leading to predominance of fetal hemoglobin (HbF) [3]. Phenotypic manifestations of SCD ensue as HbS and α2βS2 becomes the major constituent of the RBCs [4, 5].
The developmental switch from fetal to adult hemoglobin is controlled by expression of the transcription factor BCL11A, a repressor of γ-globin expression [5, 6]. Silencing of BCL11A reactivates γ-globin gene expression and the resulting elevated levels of HbF strongly mitigate the effects of SCD and β-thalassemia. Genetic knockout of BCL11A in erythroid cells provides correction of SCD in engineered mouse models [7], suggesting that down-regulation or knockout of BCL11A in autologous hematopoietic stem cells (HSCs) may constitute an attractive form of gene therapy. As compared with allogeneic bone marrow transplantation, autologous therapy with gene modified cells would eliminate the risk of graft-vs-host disease [8] and the search for suitable matched donors [9].
Current clinical gene therapy protocols and those anticipated in the near future lead to gene modification and engraftment of only a fraction of HSCs. This results in an average stable mixture of genetically altered and untransduced cells. In peripheral blood, the proportion of gene-altered RBCs will not be identical to marrow chimerism. RBC destruction correlates with cell age due to normal physiological parameters [10–13], but RBC life-span is shortened in SCD [14, 15] and an increased relative abundance of immature erythrocytes including reticulocytes is a sign of hematopoietic stress [16]. Hence SCD is characterized by baseline increases in reticulocyte counts to compensate for ongoing increased hemolysis of sickled RBCs. RBCs that contain more HbF than average demonstrate prolonged RBC survival. In SCD patients, naturally occurring genetic variants leading to higher HbF levels appear to have attenuated disease phenotypes, which is the basis for the current use of hydroxyurea in the treatment of SCD [15].
Gene therapy approaches with potential permanent benefit for SCD patients include lentiviral-vector mediated transfer of non-sickling globin genes [17, 18], gene editing to correct the SCD-causing point mutation [19], and genetic alteration of the BCL11A transcription factor to induce γ-globin and concurrently reduce expression of βS-globin [5]. The benefits of these approaches depend on the steady-state level of HbF (or on HbA levels if a normal β-globin gene is supplied) in the developing erythroid precursors and in peripheral RBCs. There is currently no quantitative predictive tool available that would allow the assessment of gene therapy leading to long-term coexistence of sickling and normal RBCs. We describe RBC formation driven by HSC proliferation and differentiation independent of hemoglobin type and age-structured RBC survival (Fig. 1A) using an age-compartment approach (Fig. 1B). Quantification of the steady state of the system predicts the extent of cellular modification of the HSC population required for phenotypic correction of the RBC compartment, which we tested using both previously published RBC survival data and a new mouse model experiment (Fig. 1C). Our approach fills a gap concerned with prediction of optimal strategies for gene therapy of hemoglobinopathies [20, 21].
Fig. 1. A mathematical model of sickle cell disease.
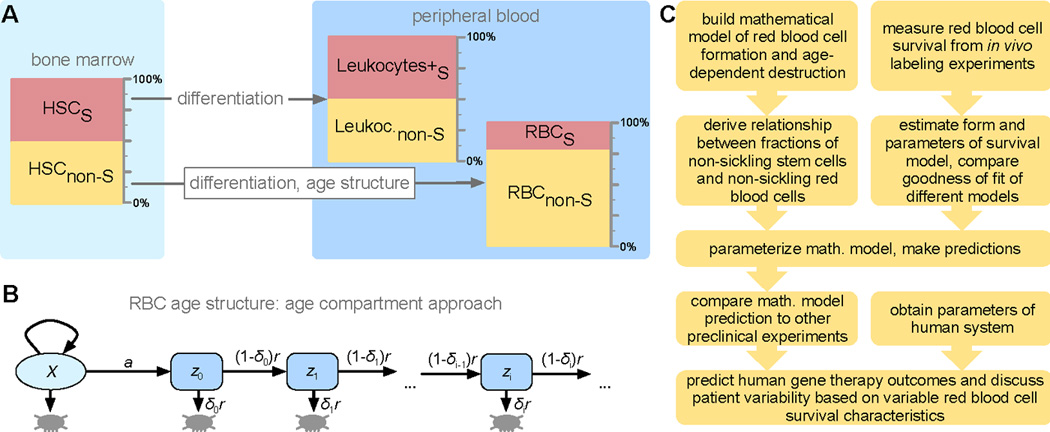
A. We considered two functional compartments; hematopoietic stem cells (HSCs) and red blood cells (RBCs). For interpretation of our experimental results, we also consider CD45.1/2 positive leukocytes. RBCs are structured into age compartments. A 1:1 mixture of sickling and normal cells in the HSCs does not translate into a 1:1 mixture in the RBCs due to differential survival statistics related to the dominant hemoglobin type. For leukocytes, the HSC ratio was maintained because hemoglobin had no effect. B. Schematic of the mathematical model of RBC aging: discrete age compartments (cell age in days, i) are defined by their destruction rate δi. C: Basic schematic of our integrative approach that combines mathematical modeling, literature derived data and new experimental results.
METHODS
Experimental mouse model
Mononuclear cells (MNC) were isolated via Ficoll PaqueTM Plus (GE Healthcare, Uppsala, SE) from the bone marrow of healthy B6.SJL-Ptprca Pepcb/BoyJ mice (CD45.1) or Berkeley-sickle cell (SCD) mice ((Hbatm1Paz Hbbtm1Tow Tg(HBA-HBBs)41Paz/J) CD45.2) [22], which exclusively express human HbS. Healthy MNC were mixed with SCD MNC to constitute 1, 2, 4, 8, 12, 16, 20, 25, 30, 35, 50 or 54% of the total population. In total, 3.5×10⁶ cells of each mixture were injected into lethally irradiated (4.5Gy) NSG recipient mice. 10 weeks after transplantation, mice were sacrificed and the contribution of the two competitor population in the peripheral blood CD45+CD11b+ myeloid fraction was assessed via FACS. The chimerism in the peripheral blood red cell compartment was assessed via alkaline cellulose acetate electrophoresis followed by Ponceau S stain according to the manufacturer’s instructions (Helena Laboratories, Beaumont, TX). Quantification was performed on an Amersham Imager 600. To account for the technical error both the myeloid engraftment and hemoglobin analyses were performed in independent triplicates. All animal work was conducted according to national guidelines and has been approved by the Boston Children’s Hospital IACUC (approval number 74-03-2621R). For euthanasia of mice CO2 was used.
Mathematical modeling of healthy and sickling hematopoietic cells
We derived a quantitative description of the RBC composition in peripheral blood based on the extent of HSC chimerism in the bone marrow. We incorporated basic principles of mammalian blood formation in the bone marrow and an age-compartment approach to RBC survival. We considered two populations: hematopoietic stem cells (HSCs) and RBCs. HSCs have the capacity to self-renew, give rise to RBCs at a fixed rate per day (in equilibrium, ie. after a sufficiently long time), and are considered to be at constant population size. We considered discrete time dynamics and a discrete age compartment structure [23]. The RBC population is subdivided into a number of age compartments (i = 0, 1, … k). The number of cells in each age compartment is given by zi and varies over time, but eventually reaches equilibrium. We considered genetic differences amongst cells with regard to their hemoglobin phenotype: type S RBCs contain mostly HbS and have a reduced lifespan due to sickling-induced hemolysis. Non-S RBCs contain HbF, HbA, or HbAS and exhibit a normal lifespan. In other hematopoietic cell populations the fraction non-S cells is taken to be equal to the fraction of non-S HSCs (Fig. 1A). Because of differential removal due to hemolysis, this equality is not maintained in mixed RBC populations.
The destruction rate of RBCs at age t is denoted by δt. The RBC production rate from HSCs is the same for S and non-S cells, leading to
| (1) |
| (2) |
Eq. {1} describes reticulocyte formation at rate a proportional to the number of HSCs, X, and loss of cells proportional to rate r, which sets the timescale. Eq. {2} describes the dynamics of all older age classes of RBCs, where loss of a cell in a specific age compartment occurs either due to aging or due to destruction. Gain from compartment i-1 is equal to (1 − δi−1)zi−1, conditional on non-destruction. The rate of loss of cells in compartment i is r × zi. We calculated δi as the fraction of cells that do not progress to age i+1 but are removed between times t and t+Δt (Supp. Online Material; see also a recent study addressing the benefits of discrete time models for age compartment approaches to blood dynamics [23]). To investigate stable chimerism in the blood, we were interested in the stationary state solutions, where and we set r = 1/Δt. Note that equations {1–2} and their solution holds individually for any RBC population in the system; differences in cell survival are implemented in the function δl. We denote the fraction of non-S RBCs by %(RBCs)non-S=y. This quantity can be calculated as a function of the fraction of HSCs (Supp. Online Material), denoted by %(HSCs)non-S=xand is given by
| (3) |
In this formula, the dimensionless parameter ρ contains all information about the different destruction/survival mechanisms that characterize the S and non-S red blood cell populations.
RESULTS
Differential survival in S and non-S RBCs
The relationship between HSCs and RBCs, Eq. {3}, can be used to quantify how many HSCs are required to reach a desired target level of RBCs. Fractions of non-S and S cells differ between RBCs and HSCs, since aging in the two RBC populations is driven by different age-dependent survivals (summarized by ρ). Our model leads to a differential survival factor ρ that solely depends on the destruction rates of S and non-S RBCs, δSl and δ(non−S)l. These rates uniquely describe hemolysis-related destruction. We thus predicted the fraction of non-S RBCs in periphery using the steady state Equation {3} together with estimates for the δl. The longer lifespan of non-S RBCs in comparison to S RBCs is represented by a smaller differential survival factor, e.g. human S RBCs have an expected life span of 20–30 days, whereas non-S RBCs have an expected life span of about 120 days [24].
Simple relations between the fraction of non-S HSCs and the differential survival factor emerge if we consider a desired fraction of non-S RBCs. For instance, a target fraction of non-S RBCs of y=0.3 requires a non-S HSC fraction of x=3ρ/(7+3ρ), y=0.5 requires x=ρ/(1+ρ), and y=0.7 requires x=7ρ/(3+7ρ). If the survival properties of S and non-S RBCs are such that the resulting differential survival factor is ρ=0.1 (corresponding to a high non-S RBC survival benefit), a value of y=0.5 in periphery would require a stable fraction of x=0.091 in periphery. In individuals with intermediate non-S cell benefit ρ=0.5, a target of y=0.5 would require x=0.333. Differential survival of ρ=0.9 (low non-S RBC survival benefit) would require x=0.474.
Determination of RBC survival functions
A common way to infer aging characteristics of RBCs is by measurement of the decay of a labeled sample of RBCs [25]. The resulting label decay curves are typically not identical to the cohort survival curves [26]. However, label decay data can be interpreted using an age-dependent model of RBC survival. The resulting estimates of age-dependent properties of RBCs then inform the mathematical modeling predictions.
We used published data of in vivo RBC labeling in a murine system, performed by Xu et al. [7], who assessed RBC survival via biotin labeling of RBCs in SCD mice (S) and in control mice (non-S). We analyzed the label decay curves using two different modeling approaches to RBC age-dependent survival using (i) a constant failure model, and (ii) an accelerated failure model. For each, we compared the predicted label decay curves with experimentally determined curves and assessed statistical goodness of fit (Fig. S1). The connections between the shape of the cell destruction function, the survival curve of a homogeneous cohort and the decay curve of a labeled sample from the stationary age distribution are displayed in Fig. S2.
First, we used a constant failure model of RBC destruction, which results in exponential label decay curves and identifies a constant destruction rate. The mean life span of a red blood cell in periphery is then proportional to the inverse of this constant destruction rate. The constant failure function implies that there is no actual age structure, but rather that cells are removed at a constant rate per time (exponential decay, see Supp. Online Material). We found a mean RBC life span of 14.94 days in non-S mice (adjusted R-Squared=0.985), and a mean life span of 4.76 days in S mice (adjusted R-Squared=0.832). The RBC destruction function corresponds to the daily fraction of cells removed between age a and age a+1, conditioned on survival up to this age. Based on the survival function of peripheral RBCs of age a (in days), S(a), we have δa = 1 − S(a + 1)/S(a). In case of a constant destruction rate, this expression becomes independent of age. Since the survival function is of the form S(a) = e−α a), with α being the inverse of the mean life span (MLS), we find δa = 1 − e−δ. The resulting differential aging factor is then given by
| (4) |
Using this model and independent label decay data (Supp. Online Material) leads to ρ=0.342.
Second, we used an accelerated failure model, which is a parametric model based on the log-logistic distribution [27], modeling an initial increase in the destruction rate followed by a moderate decrease [28]. The log-logistic destruction rate can be written in closed analytical form with two parameters: the median and a parameter that modulates the shape of the survival function between monotonically decreasing and sigmoidal (Fig. S2). We fixed the shape parameter to 2 and fitted the median as a free parameter. The MLS follows directly from this fit. We found MLS=16.26 days (median 10.33 days) in non-S mice (adjusted R-Squared=0.997), and MLS=3.5 days (median 2.25 days) in S mice (adjusted R-Squared=0.950), with resulting differential aging factor ρ=0.193. Thus a bone marrow mixture with 16.2% non-S HSCs would result in a mixture of 50% non-S RBCs in periphery. In this second approach, MLS differs from the one obtained in the first approach as a result of the different underlying destruction function.
Insights from a preclinical mouse model
We used an experimental mouse model (Fig. 2) to differentiate between the alternative ways to model RBC destruction in sickling individuals outlined above. We designed a preclinical experiment to investigate the relative proportion of HbA and HbS-containing RBCs in the peripheral blood of mice transplanted with different mixtures of HSCs from wild-type and Berkley SCD mice [22]. SCD and control origins of HSCs were tracked with CD45.2 and CD45.1 surface isotypes by flow cytometry, respectively. To closely mimic autologous bone marrow alteration via gene therapy, the mouse model experiments consisted of three steps. First, bone marrow was harvested from SCD and wild-type mice. Second, artificial mixtures of cells were transplanted into irradiated recipient mice, resulting in mixed hematopoietic chimerism. Third, we determined the proportion of HbA and HbS in the peripheral blood. The fraction of CD45.1 positive (non-S genotype) myeloid cells served as a surrogate for the fraction of HSCs (Fig. 2A).
Fig. 2. A transgenic mouse model of sickle cell disease.

A: Schematic of the experimental mouse model. Mononuclear bone marrow cells were isolated from BERK-SCD (S) mice or BoyJ healthy donor mice (non-S), mixed in various ratios ranging from 1% to 54% non-S cell contribution, and subsequently engrafted into a cohort of 12 radiated recipient mice. Blood samples were taken after 10 weeks post transplantation and BoyJ/BERK-SCD donor origin could be distinguished using CD45.1 and CD45.2 cell surface markers, respectively. B: The peripheral blood chimerism in the myeloid compartment measured 10 weeks post transplantation (y-axis) is similar to the initial mixing ratios of CD45.1 vs. CD45.2 cells injected into the animals. The differences could result from an unlikely competitive disadvantage of non-S HSCs, or one could speculate that SCD mice have higher HSC density in their BM. C: Murine recipient hosts reacted to sickling with increased erythropoiesis, indicated by increased fractions of immature CD71-positive cells in periphery after 10 weeks. Hematopoietic stress negatively correlated with HbA content (non-S cell density). D: HbA and HbS content in the twelve mice after 10 weeks.
Mixtures of mononuclear cells of 1% to 54% Berkley sickle cell mice (CD45.2; HbS) and wild-type competitor mice (CD45.1; HbA) were transplanted into lethally irradiated NSG mice. Animals were sacrificed 10 weeks later, and the ratio of CD45.1 vs. CD45.2 of myeloid cells was assessed. We observed peripheral white blood cell chimerism that closely correlated with the initially injected fractions of CD45.1 and CD45.2 cells (Fig. 2B). This correlation was systematically lower, potentially as a result of higher HSC density in SCD mice due to elevated stress levels. Note that such discrepancy does not impact our results, since we only focus on the equilibrium fraction of non-S RBCs relative to a given fraction of non-S HSCs. We further analyzed the fraction of red cell precursors defined by expression of CD71 cells (CD71+, a surrogate for reticulocytes and other immature RBC precursors) in peripheral blood, which served as an indicator of erythropoietic stress due to SCD-associated hemolysis and resulting anemia. We observed a correlation with reduced numbers of CD71+ immature erythroid cells in the presence of increased levels of non-sickling HbA (Fig. 2C, Fig. S3). We then determined the contribution of HbA and HbS in erythrocytes (Fig. 2D), and interpreted the results in the context of our mathematical model.
Each pair of data points of our preclinical experiment consisted of a fraction of non-S RBCs in a mixture of S and non-S cells, and of a fraction of CD45.1+ myeloid cells in mixture of CD45.1+ and CD45.2+ cells, taken from peripheral blood samples of mice 10 weeks post transplantation. We set the fraction of CD45.1+ equal to the fraction of non-S HSCs and observed a clear selective advantage of non-S over S RBCs in periphery, which could be explained using both a constant or an accelerated failure approach to RBC survival (Fig. 3A). Although S and non-S cell survival measured by MLS differed by a factor of 3 to 4, the resulting fitted curve (solid line in Fig. 3A) was relatively flat. This fact arose because the differential survival factor that determines this curvature measures RBC survival over all cell ages, and this integral function is less sensitive to changes in MLS.
Fig. 3. Use of the mathematical model to explain transgenic mouse model data.

A. We compare the predictions of our mathematical modeling framework to our preclinical mouse data (12 mice with different initial conditions, 3 replicate measurements per mouse giving rise to the error bars). Symbols are mean and standard error. In the statistical analysis for model selection, these averages were used. The solid line corresponds to the prediction of the constant failure model with a differential survival factor of 0.342 (mean life spans of S and non-S cells: 4.8 days and 14.9 days, respectively, see Figure S1). The dashed line corresponds to the prediction of the accelerated failure model with a differential survival factor of 0.193 (mean life spans of S and non-S cells: 3.5 days and 16.2 days, respectively, see Figure S1). B. Comparison of constant versus accelerated destruction models and experimental observations. Mathematical model performance was evaluated using the Akaike Information Criterion and the adjusted R2 (see Supp. Online Material). Based on both criteria, the constant failure approach to model RBC survival is favored.
We then compared model-predicted and actually measured non-S RBC fractions (Fig. 3B) using the Akaike information criterion (AIC) for the two different RBC survival mechanisms (constant and accelerated destruction). This statistical comparison served as a method to evaluate which survival model better explains the experimental data. The simpler mathematical model of constant destruction provided a fit with lower AIC. The AIC of the constant failure model was −27.33, while the AIC of the two-parameter accelerated failure model was −13.96. Thus we chose the simpler model and were able to use the parameterized mathematical framework to predict stable fractions of non-S RBCs in periphery. Note that in our mouse experiments we aimed for a diverse range of chimerism, and thus our experiments cannot serve to estimate variability across mice in the hypothetical scenario of identical non-S HSC fractions. The error bars in Fig. 3A inform the accuracy of our cellularity measurements. Additionally, while a selective disadvantage of healthy HSCs is unlikely [29], our data suggests that the frequencies of repopulating cells within BM mononuclear fraction slightly differ between SCD and healthy mice.
Predictions for a human clinical trial
The success rate of interventions that attenuate the disease phenotype is driven by variability on two levels. First, there is variability in the efficiency of lentiviral gene transfer, resulting in transduction rates of HSCs that may range from 10% to 50% of cells [30–33], and the rate of engraftment of modified HSCs may not reach 100% gene-modified cell engraftment. In allogenic bone marrow transplants of SCD patients [9], long-term donor cell engraftment has ranged between 11% and 95%, with the majority of patients achieving around 90% donor chimerism [9]. Using autologous HSCs, host vs graft issues leading to reduced donor engraftment should be minimal, but the effect of reduced intensity conditioning may contribute to endogenous recovery. Second, the characteristic life span of S RBCs varies across patients and with HbF content [15]. Our predictions of human gene therapeutic interventions (Fig. 4A) leading to alterations in recipient chimerism of gene-modified HSCs can account for these variabilities.
Fig. 4. Application of the mathematical model for gene therapy in patients with sickle cell disease.

A: Strategy for autologous bone marrow transplantation, e.g. modification via knockdown of BCL11A. HSCs cells are harvested and altered (1). Meanwhile the patient is prepared and conditioned (2). B: Variability in the fraction of successfully altered hematopoietic stem cells (HSCs) due to pre-transplantation transduction rates and post-transplantation engraftment success for which we considered a mean cell fraction of 0.2 (standard deviation 0.25), a conservative estimate [30–33]. C. Patient variability in the mean life span (MLS) of sickling red blood cells (RBCs), with an expectation value of 20 days (standard deviation=4 days, minimal MLS=5 days). D: Using the distributions in B and C we generated a virtual patient cohort (N=10,000) that informs about the statistics of the expected stable fraction of normal RBCs in periphery after gene therapy (mean non-S RBC fraction=0.58, standard deviation=0.11). E: Variability of the patient distribution for fixed fraction of non-S HSCs in the bone marrow, but variable non-S RBC life span (according to panel C).
To investigate the impact of such variability on outcomes, we generated a virtual patient cohort (N=10,000). First, we considered a distribution of the fraction of HSCs that can be successfully altered to normal phenotype, e.g. by BCL11A knockdown, mainly driven by the projected transduction efficiency in HSCs with a mean cell fraction of 0.2 (Fig. 4B). Second, we considered a constant mean life span of normal RBCs of 120 days [24, 34, 35], and a distribution of the remaining sickling RBCs with an expected mean life span of 20 days (Fig. 4C). Using Eq. {4}, we then calculated a distribution of differential survival factors, which led to a patient distribution of stable normal RBC fractions in periphery calculated by Eq. {3} (Fig. 4D), with a mean cell fraction of 0.79 (standard deviation=0.09). Using a similar approach, we calculated distributions of normal RBC fractions as a function of the fraction of normal HSCs using an underlying variability in the life span of sickling erythrocytes in patients (Table 1, Fig. 4E).
Table 1.
Considering a distribution of sickle cell life span in a patient population (Fig. 4B), we calculated the expected fraction of normal RBCs given a fraction normal HSCs after gene therapy.
| normal HSC fraction | 0.10 | 0.20 | 0.30 | 0.40 |
| normal RBC fraction (median) | 0.40 | 0.60 | 0.72 | 0.80 |
Our quantitative predictions based on the expected distributions of S cell survival depend on the survival function at all stages of the RBC life cycle. In the murine system we observed that normal cells survive 3 to 4 times longer than sickle cells (Fig. S1). In humans, this factor may be between 6 and 10; the resulting differential survival factors thus yield significantly different consequences of bone marrow alteration. In a sickling mouse, 25% altered HSCs would lead to about 50% non-sickling RBCs. In humans, 25% altered HSCs could lead to about 65% non-sickling RBCs. Current large scale HSC transduction protocols using high-titer lentivirus vectors have been shown to yield gene transfer efficiencies in this range, predicting clinical benefit using this approach.
DISCUSSION
Here we used a combined mathematical and mouse modeling approach to investigate the potential effects of gene therapy in SCD. We incorporated empirical evidence of sickling and normal cell survival and predicted the amount of stable RBC chimerism in peripheral blood based on bone marrow alteration when targeting differences in γ-globin expression. Our approach is based on the premise that the severity of SCD can be attenuated with persistent expression or re-activation of γ-globin leading to high fetal hemoglobin (HbF) containing RBCs, and considers that transduced and non-transduced HSCs produce equal numbers of progenitors. Knockdown of BCL11A as a potential molecular therapeutic intervention could lead to stable expression of high HbF in RBCs. Indeed, we have recently demonstrated in RBCs derived from HSCs of SCD patients transduced with a clinically applicable lentivirus vector targeting BCL11A that up to ~70% of the β-like globin is HbF (Brendel et al., manuscript submitted). So far, precise quantification of the required number of HSCs that will give rise to non-sickling RBCs has been elusive, but is very important for clinical implementation of BCL11A–RNA interference based gene therapy [7, 19, 33].
Future preclinical data will be used to adjust our model based on observed survival rates of gene therapy treated RBCs. In a clinical gene therapy setting, the fraction of gene-modified RBCs contains variable amounts of both healthy HbF and sickling HbS. Hence the RBC half-life will likely be lower than in the wild type RBCs used in this study. Although highly relevant for translation, using data from preclinical gene therapy models is inappropriate for establishing the basic framework for a mathematical model, which was the scope of this work. This fact arises due to several factors. First, different gene therapy approaches and vectors used for BCL11A interference or recombinant expression of γ- or β-globin lead to different RBC survival rates, depending on the levels and concentrations of normal β-like globin [20, 36] [37, 38]. Second, vector copy number variations within the transduced population and between experiments lead to substantial variability in preclinical gene therapy models. The current framework can be easily adjusted to account for altered survival kinetics in various gene therapy approaches, and to perform appropriate power calculations for future studies. Several clinical scenarios can be studied, such as different distributions of underlying characteristics of SCD patients and their effects on gene therapy outcomes. Genetic treatment of SCD may lead to clinical improvement when 10–30% chimerism is reached [39]. It is believed that 70% non-S RBCs would alleviate the impact of SCD cells [33]. Here we derived a quantitative connection between HSC alteration and RBC chimerism from first principles. For instance, Fig. 4 demonstrates how in a patient population with variable S RBC destruction rates, 40% non-S HSCs lead to a median of non-S RBCs fraction around 80%.
Mathematical models of hematopoiesis often incorporate the complete differentiation hierarchy of the tissue [40]. However, in equilibrium we expect that a constant HSC population governs the production of committed cells, e.g. the production of RBCs or leukocytes [41]. We thus modeled hematopoiesis as a simple one-step deterministic process and considered that all committed cell compartments obey the same form of dependence on the HSC population. This approach allowed us to focus on the survival statistics in RBCs. An extension of this model to describe more components of mammalian hematopoiesis, as well as temporal fluctuations in stem and progenitor compartments, could be developed to describe effects of engraftment alterations due to conditioning [42], or effects of slow, long-term changes in a patient’s bone marrow composition [9, 43]. Such extensions point to future mathematical modeling for which more detailed experimental evidence of short- and long-term bone-marrow cellular dynamics under perturbations are necessary.
Similarly, application of more complicated survival models [13] would require engaged computational effort and the addition of more parameters and their estimation in an appropriate system. Additionally, other complex dynamic processes may contribute to RBC selection, e.g. early removal in form of neocytolysis [44], non-linear mid-life destruction of dysfunctionality and longevity [45]. These factors likely influence short-term properties of the system. Our approach can be parameterized in direct relation to the mean life span of red blood cells and is suited to study the long-term effects and benefits of gene therapy. Our model may also guide future combined experimental and modeling efforts studying other hematopoietic diseases. The mathematical model allows for a better understanding of uncertainties associated with diverse gene therapy approaches, and could be extended to study incomplete anti-sickling activity as a function of vector copy load [20, 36], which is expected in a heterogeneously transduced patient population with various levels of anti-sickling hemoglobin. Our approach can be readily expanded to include more diverse populations.
Supplementary Material
Acknowledgments
PMA acknowledges generous financial support from Deutsche Akademie der Naturforscher Leopoldina, grant no LPDS 2012-12. DAW, SHO and CB acknowledge support from HL117720-03 from NIH. FM acknowledges support from the Dana-Farber Cancer Institute Physical Sciences-Oncology Center (NCI U54CA193461).
Footnotes
AUTHORSHIP CONTRIBUTIONS
PMA performed mathematical modeling and statistical data analysis. CB performed mouse model experiments and statistical data analysis. All authors designed the study and wrote the paper.
DISCLOSURE OF CONFLICT OF INTEREST
The authors declare no conflict of interest.
REFERENCES
- 1.Pauling L, Itano HA, et al. Sickle cell anemia, a molecular disease. Science. 1949;109:443. [PubMed] [Google Scholar]
- 2.Ingram VM. Abnormal human haemoglobins. III. The chemical difference between normal and sickle cell haemoglobins. Biochimica et biophysica acta. 1959;36:402–411. doi: 10.1016/0006-3002(59)90183-0. [DOI] [PubMed] [Google Scholar]
- 3.Wood WG, Weatherall DJ. Haemoglobin synthesis during human foetal development. Nature. 1973;244:162–165. doi: 10.1038/244162a0. [DOI] [PubMed] [Google Scholar]
- 4.Stamatoyannopoulos G. Control of globin gene expression during development and erythroid differentiation. Experimental hematology. 2005;33:259–271. doi: 10.1016/j.exphem.2004.11.007. [DOI] [PMC free article] [PubMed] [Google Scholar]
- 5.Sankaran VG, Menne TF, Xu J, et al. Human fetal hemoglobin expression is regulated by the developmental stage-specific repressor BCL11A. Science. 2008;322:1839–1842. doi: 10.1126/science.1165409. [DOI] [PubMed] [Google Scholar]
- 6.Bauer DE, Kamran SC, Lessard S, et al. An erythroid enhancer of BCL11A subject to genetic variation determines fetal hemoglobin level. Science. 2013;342:253–257. doi: 10.1126/science.1242088. [DOI] [PMC free article] [PubMed] [Google Scholar]
- 7.Xu J, Peng C, Sankaran VG, et al. Correction of sickle cell disease in adult mice by interference with fetal hemoglobin silencing. Science. 2011;334:993–996. doi: 10.1126/science.1211053. [DOI] [PMC free article] [PubMed] [Google Scholar]
- 8.Gratwohl A. Theoretical and practical issues of autologous versus allogeneic stem cell transplantation in multiple sclerosis. Cellular Therapy and Transplantation. 2011;2:e.000058.000001. [Google Scholar]
- 9.Walters MC, Patience M, Leisenring W, et al. Stable mixed hematopoietic chimerism after bone marrow transplantation for sickle cell anemia. Biology of blood and marrow transplantation : journal of the American Society for Blood and Marrow Transplantation. 2001;7:665–673. doi: 10.1053/bbmt.2001.v7.pm11787529. [DOI] [PubMed] [Google Scholar]
- 10.Rice L, Alfrey CP, Driscoll T, et al. Neocytolysis contributes to the anemia of renal disease. American journal of kidney diseases : the official journal of the National Kidney Foundation. 1999;33:59–62. doi: 10.1016/s0272-6386(99)70258-1. [DOI] [PubMed] [Google Scholar]
- 11.Eadie GS, Brown IW., Jr Red blood cell survival studies. Blood. 1953;8:1110–1136. [PubMed] [Google Scholar]
- 12.Landaw SA. Factors that accelerate or retard red blood cell senescence. Blood cells. 1988;14:47–67. [PubMed] [Google Scholar]
- 13.Korell J, Duffull SB. A semi-mechanistic red blood cell survival model provides some insight into red blood cell destruction mechanisms. Journal of pharmacokinetics and pharmacodynamics. 2013;40:469–478. doi: 10.1007/s10928-013-9322-4. [DOI] [PubMed] [Google Scholar]
- 14.Croizat H, Nagel RL. Circulating cytokines response and the level of erythropoiesis in sickle cell anemia. American journal of hematology. 1999;60:105–115. doi: 10.1002/(sici)1096-8652(199902)60:2<105::aid-ajh4>3.0.co;2-z. [DOI] [PubMed] [Google Scholar]
- 15.Franco RS, Yasin Z, Palascak MB, et al. The effect of fetal hemoglobin on the survival characteristics of sickle cells. Blood. 2006;108:1073–1076. doi: 10.1182/blood-2005-09-008318. [DOI] [PMC free article] [PubMed] [Google Scholar]
- 16.Steinberg MH, Forget BG, Higgs DR. Disorders of Hemoglobin: Genetics, Pathophysiology, and Clinical Management. Cambridge University Press; 2009. [Google Scholar]
- 17.Sadelain M, Wang CH, Antoniou M, et al. Generation of a high-titer retroviral vector capable of expressing high levels of the human beta-globin gene. Proceedings of the National Academy of Sciences of the United States of America. 1995;92:6728–6732. doi: 10.1073/pnas.92.15.6728. [DOI] [PMC free article] [PubMed] [Google Scholar]
- 18.Emery DW, Yannaki E, Tubb J, et al. A chromatin insulator protects retrovirus vectors from chromosomal position effects. Proceedings of the National Academy of Sciences of the United States of America. 2000;97:9150–9155. doi: 10.1073/pnas.160159597. [DOI] [PMC free article] [PubMed] [Google Scholar]
- 19.Canver MC, Smith EC, Sher F, et al. BCL11A enhancer dissection by Cas9-mediated in situ saturating mutagenesis. Nature. 2015 doi: 10.1038/nature15521. [DOI] [PMC free article] [PubMed] [Google Scholar]
- 20.Perumbeti A, Higashimoto T, Urbinati F, et al. A novel human gamma-globin gene vector for genetic correction of sickle cell anemia in a humanized sickle mouse model: critical determinants for successful correction. Blood. 2009;114:1174–1185. doi: 10.1182/blood-2009-01-201863. [DOI] [PMC free article] [PubMed] [Google Scholar]
- 21.Kean LS, Manci EA, Perry J, et al. Chimerism and cure: hematologic and pathologic correction of murine sickle cell disease. Blood. 2003;102:4582–4593. doi: 10.1182/blood-2003-03-0712. [DOI] [PubMed] [Google Scholar]
- 22.Paszty C, Brion CM, Manci E, et al. Transgenic knockout mice with exclusively human sickle hemoglobin and sickle cell disease. Science. 1997;278:876–878. doi: 10.1126/science.278.5339.876. [DOI] [PubMed] [Google Scholar]
- 23.Fonseca LL, Voit EO. Comparison of mathematical frameworks for modeling erythropoiesis in the context of malaria infection. Mathematical biosciences. 2015;270:224–236. doi: 10.1016/j.mbs.2015.08.020. [DOI] [PMC free article] [PubMed] [Google Scholar]
- 24.Lindsell CJ, Franco RS, Smith EP, et al. A method for the continuous calculation of the age of labeled red blood cells. American journal of hematology. 2008;83:454–457. doi: 10.1002/ajh.21148. [DOI] [PubMed] [Google Scholar]
- 25.Franco RS. Measurement of red cell lifespan and aging. Transfusion medicine and hemotherapy : offizielles Organ der Deutschen Gesellschaft fur Transfusionsmedizin und Immunhamatologie. 2012;39:302–307. doi: 10.1159/000342232. [DOI] [PMC free article] [PubMed] [Google Scholar]
- 26.Dornhorst AC. The interpretation of red cell survival curves. Blood. 1951;6:1284–1292. [PubMed] [Google Scholar]
- 27.Bennett S. Log-Logistic Regression Models for Survival Data. Journal of the Royal Statistical Society, Series C. 1983;32:165–171. [Google Scholar]
- 28.Wei LJ. The accelerated failure time model: a useful alternative to the Cox regression model in survival analysis. Statistics in medicine. 1992;11:1871–1879. doi: 10.1002/sim.4780111409. [DOI] [PubMed] [Google Scholar]
- 29.Javazon EH, Radhi M, Gangadharan B, et al. Hematopoietic stem cell function in a murine model of sickle cell disease. Anemia. 2012;2012:387385. doi: 10.1155/2012/387385. [DOI] [PMC free article] [PubMed] [Google Scholar]
- 30.Kurre P, Anandakumar P, Harkey MA, et al. Efficient marking of murine long-term repopulating stem cells targeting unseparated marrow cells at low lentiviral vector particle concentration. Molecular therapy : the journal of the American Society of Gene Therapy. 2004;9:914–922. doi: 10.1016/j.ymthe.2004.03.008. [DOI] [PubMed] [Google Scholar]
- 31.Kurre P, Anandakumar P, Kiem HP. Rapid 1-hour transduction of whole bone marrow leads to long-term repopulation of murine recipients with lentivirus-modified hematopoietic stem cells. Gene therapy. 2006;13:369–373. doi: 10.1038/sj.gt.3302659. [DOI] [PubMed] [Google Scholar]
- 32.Uchida N, Hsieh MM, Hayakawa J, et al. Optimal conditions for lentiviral transduction of engrafting human CD34+ cells. Gene therapy. 2011;18:1078–1086. doi: 10.1038/gt.2011.63. [DOI] [PMC free article] [PubMed] [Google Scholar]
- 33.Hoban MD, Cost GJ, Mendel MC, et al. Correction of the sickle cell disease mutation in human hematopoietic stem/progenitor cells. Blood. 2015;125:2597–2604. doi: 10.1182/blood-2014-12-615948. [DOI] [PMC free article] [PubMed] [Google Scholar]
- 34.Franco RS, Puchulu-Campanella ME, Barber LA, et al. Changes in the properties of normal human red blood cells during in vivo aging. American journal of hematology. 2013;88:44–51. doi: 10.1002/ajh.23344. [DOI] [PMC free article] [PubMed] [Google Scholar]
- 35.Cohen RM, Franco RS, Khera PK, et al. Red cell life span heterogeneity in hematologically normal people is sufficient to alter HbA1c. Blood. 2008;112:4284–4291. doi: 10.1182/blood-2008-04-154112. [DOI] [PMC free article] [PubMed] [Google Scholar]
- 36.Romero Z, Urbinati F, Geiger S, et al. beta-globin gene transfer to human bone marrow for sickle cell disease. The Journal of clinical investigation. 2013 doi: 10.1172/JCI67930. [DOI] [PMC free article] [PubMed] [Google Scholar]
- 37.Adachi K, Pang J, Reddy LR, et al. Polymerization of three hemoglobin A2 variants containing Val6 and inhibition of hemoglobin S polymerization by hemoglobin A2. The Journal of biological chemistry. 1996;271:24557–24563. doi: 10.1074/jbc.271.40.24557. [DOI] [PubMed] [Google Scholar]
- 38.Ferrone FA, Rotter MA. Crowding and the polymerization of sickle hemoglobin. Journal of molecular recognition : JMR. 2004;17:497–504. doi: 10.1002/jmr.698. [DOI] [PubMed] [Google Scholar]
- 39.Andreani M, Testi M, Gaziev J, et al. Quantitatively different red cell/nucleated cell chimerism in patients with long-term, persistent hematopoietic mixed chimerism after bone marrow transplantation for thalassemia major or sickle cell disease. Haematologica. 2011;96:128–133. doi: 10.3324/haematol.2010.031013. [DOI] [PMC free article] [PubMed] [Google Scholar]
- 40.Dingli D, Traulsen A, Pacheco JM. Compartmental architecture and dynamics of hematopoiesis. PloS one. 2007;2:e345. doi: 10.1371/journal.pone.0000345. [DOI] [PMC free article] [PubMed] [Google Scholar]
- 41.Werner B, Dingli D, Lenaerts T, et al. Dynamics of mutant cells in hierarchical organized tissues. PLoS computational biology. 2011;7:e1002290. doi: 10.1371/journal.pcbi.1002290. [DOI] [PMC free article] [PubMed] [Google Scholar]
- 42.Hill GR, Crawford JM, Cooke KR, et al. Total body irradiation and acute graft-versus-host disease: the role of gastrointestinal damage and inflammatory cytokines. Blood. 1997;90:3204–3213. [PubMed] [Google Scholar]
- 43.Andreani M, Manna M, Lucarelli G, et al. Persistence of mixed chimerism in patients transplanted for the treatment of thalassemia. Blood. 1996;87:3494–3499. [PubMed] [Google Scholar]
- 44.Rice L, Alfrey CP. The negative regulation of red cell mass by neocytolysis: physiologic and pathophysiologic manifestations. Cellular physiology and biochemistry : international journal of experimental cellular physiology, biochemistry, and pharmacology. 2005;15:245–250. doi: 10.1159/000087234. [DOI] [PubMed] [Google Scholar]
- 45.Korell J, Coulter CV, Duffull SB. Evaluation of red blood cell labelling methods based on a statistical model for red blood cell survival. Journal of theoretical biology. 2011;291:88–98. doi: 10.1016/j.jtbi.2011.09.016. [DOI] [PubMed] [Google Scholar]
Associated Data
This section collects any data citations, data availability statements, or supplementary materials included in this article.