

Abstract
Background and aims
The concept of national drinking culture is well established in research and policy debate, but rarely features in contemporary alcohol policy analysis. We aim to demonstrate the value of the alternative concept of social practices for quantitatively operationalizing drinking culture. We discuss how a practice perspective addresses limitations in existing analytical approaches to health‐related behaviour before demonstrating its empirical application by constructing a statistical typology of British drinking occasions.
Design
Cross‐sectional latent class analysis of drinking occasions derived from retrospective 1‐week drinking diaries obtained from quota samples of a market research panel. Occasions are periods of drinking with no more than 2 hours between drinks.
Setting
Great Britain, 2009–11.
Cases
A total of 187 878 occasions nested within 60 215 nationally representative adults (aged 18 + years).
Measurements
Beverage type and quantity per occasion; location, company and gender composition of company; motivation and reason for occasion; day, start‐time and duration of occasion; and age, sex and social grade.
Findings
Eight occasion types are derived based primarily on parsimony considerations rather than model fit statistics. These are mixed location heavy drinking (10.4% of occasions), heavy drinking at home with a partner (9.4%), going out with friends (11.1%), get‐together at someone's house (14.4%), going out for a meal (8.6%), drinking at home alone (13.6%), light drinking at home with family (12.8%) and light drinking at home with a partner (19.6%).
Conclusions
An empirical model of drinking culture, comprising a typology of drinking practices, reveals the dominance of moderate drinking practices in Great Britain. The model demonstrates the potential for a practice perspective to be used in evaluation of how and why drinking cultures change in response to public health interventions.
Keywords: Drinking culture, drinking occasion, latent class analysis, practice, policy analysis, typology
Introduction
The study of national drinking cultures has a long research tradition, with the dominant approach being to characterize cultures through their position on one or more dimensions (e.g. regularity of drinking or the use‐values of drinking) 1, 2. Invoking national drinking cultures is also common in policy debate 3, 4, with regulatory interventions often derided for failing to tackle the underlying culture 5. Further, Room has described a recurrent ‘impossible dream’ of changing a nation's drinking culture which, in its most common form, manifests as advocates for change within northern European temperance cultures yearning for a Mediterranean drinking style, complete with low levels of intoxication and more socialized drinking 6. Despite being well established, the concept of national drinking culture is rarely operationalized in contemporary alcohol policy analysis and evaluation, which instead favours measures of alcohol‐related harm and frequencies or quantities of drinking and heavy drinking 7. Whereas policy actors apply cultural change as a motivating construct, alcohol policy researchers view it typically as a sociological issue to which they devote little attention.
We propose a new approach to studying drinking cultures, based around analysis of drinking occasions and informed by theories of practice 8, 9, 10, 11. In the context of alcohol, consumption practices are the recognizable types of occasions within which alcohol is consumed in a society at a given time. The sociology of practice draws upon a broad range of cultural theorists, particularly Bourdieu 12, 13, but shares similarities with the alcohol literature's concepts of social worlds and collectivity of drinking 4, 14. The nature of practices is debated, but an accessible and influential formulation of the theory argues that they result from interconnections between materials (e.g. alcoholic drinks, glassware, buildings), competencies (e.g. brand awareness, etiquette, alcohol tolerance) and meanings (e.g. sophistication, relaxation, transgression) 8, 9. Others have emphasized interconnections with time, and this appears relevant here (e.g. weekend versus weekday drinking) 11. The importance of practices for public health lies primarily in their tendency to persist, with a typically gradual emergence, decay and evolution of practices over time. This bias toward stability constrains individual‐level behaviour change through a reflexive relationship between forces at the micro‐level (e.g. habit, identity construction and performance) and macro‐level (e.g. commercial interest, public policy, built environments) 8, 15, 16. Thus, adopting a practice perspective within alcohol research does not involve rejecting the importance of individual decision‐making or broad social forces, but argues that particular attention should be paid to the ways of drinking and getting drunk which can be observed within a society at any given time and the processes which produce them. To paraphrase Room, if public health stakeholders do not discuss changing the social location and meanings of drinking embedded within these practices, they cannot realistically hope to change drinking culture (6, p. 11).
The merits of discussing drinking practices rather than drinking cultures may not be immediately apparent, given their similarities. Drinking cultures are also viewed as typically stable and subject to only gradual change, while their components (e.g. drinking patterns, contemporary and historical attitudes, norms and policies) echo those of practices 1. This overlap is unsurprising, as we posit that drinking practices in combination comprise a society's drinking culture or the multiple cultures that may exist within it. Therefore, the added empirical value of a practice perspective is not its distinction but its granularity which, when applied within empirical analyses, helps to resolve three key limitations of the drinking culture literature. First, the dimensional approach to characterizing drinking cultures 1, 2 tends to assign each culture a single emblematic drinking practice derived from average scores on the selected dimensions. This directs focus away from within‐culture heterogeneity in drinking practices and disregards consideration of drinking subcultures. It also risks overstating differences between countries; for example, recent evidence suggests that characterizations of European countries as wine‐ or beer‐drinking were based largely on the male drinking behaviours which dominated consumption statistics, while commonalities in female drinking practices were overlooked 17. Secondly, focusing on emblematic drinking practices means cultures at the mid‐point of dimensions lack definitional clarity. As globalization drives cultural convergence, fine‐grained residual or emergent cultural variation, which has been regarded as important in the sociological literature, may be unobserved in alcohol research 18, 19. Finally, Room's discussion of the impossible dream notes that examples of wholesale cultural change are rare, but points to instances of lesser cultural shifts which were found to be unsatisfactory by advocates for change 6. One source of dissatisfaction may be a scientific failure to characterize sufficiently the cultural change that had occurred in the absence of a granular empirical cultural model capable of evidencing small‐scale policy effects.
To demonstrate the value of a practice perspective for alcohol policy analysis, this paper presents a prototype of a practice‐orientated statistical model using Great Britain 2009–11 as a case study. The model is a typological latent class analysis of the drinking practices which occur in Britain and provides data on the prevalence, characteristics and social distribution of different practices. It follows a similar analytical approach to recent Finnish research 20 and, although lacking data in some areas, it represents the most detailed quantitative characterization to date of British drinking culture. The paper concludes by proposing a framework for operationalizing the model within policy analysis and discusses the value of doing so.
Methods
Data
This research uses data from the Alcovision survey, a commercial product collected by the market research company, Kantar Worldpanel. Alcovision is a continuous monthly retrospective online diary survey with an annual representative sample of 30 000 individuals aged 18+ in Great Britain. Participants provide detailed data on their drinking occasions during the previous 7 days.
Quota samples based on age, sex, social class and geographic region are drawn from Kantar's managed access panel. Invitations to participate are sent out on set dates and timed such that completion of the survey occurs throughout each month, and each day of the year is included in fieldwork. Oversampling of 18–34‐year‐olds and Scotland residents permits robust analyses of these groups. Weights based on age–sex groups, social class and geographical region are constructed using UK census data to ensure representativeness of British adults. A data extract of selected variables for the total 2009–11 sample was purchased for the present analysis, and contained information on 187 878 drinking occasions nested within 60 215 respondents who reported any drinking in the survey week.
Measures
The purchased data extract was not practice‐orientated. Measures capturing materials, meanings and temporality of drinking are available, but competencies are poorly covered.
Materials
Alcoholic drinks are the primary material, and the purchased data are categorized into 10 beverage types: on‐trade and off‐trade beer, cider, wine, spirits and Ready‐to‐Drinks (RTDs). Consumption quantities are recorded as serves and assumptions regarding standard serve size and alcoholic strength were made to estimate the number of units of alcohol per serve (1 unit = 10 ml/8 g of pure alcohol). Two consumption measures are used here: whether each of the 10 beverage types was consumed and the total quantity of alcohol consumed. Three quantity categories were created: low risk (< 6 units females/< 8 units males), increasing risk (6–12 units/8–16 units) and high risk (> 12 units/> 16 units). These categories align broadly with previous analyses of risky and highly risky single‐occasion drinking 20, 21, 22. Additional materials measures used are: location (16 categories; e.g. my own home), company (six categories; e.g. friends) and composition of company (nine categories; e.g. mixed‐sex group).
Meanings
Variables included are: reason for occasion (25 categories; e.g. catch‐up, big night in) and motivation (11 categories; e.g. to have time for myself).
Temporal
Measures included are day of the week (seven categories), occasion start time (seven categories) and duration of occasion (nine categories).
Partial and full response categories for all measures are shown in Tables 2 and 4, respectively. Starred measures in Table 2 permit multiple responses, as categories are not mutually exclusive or may change across the course of an occasion. For these measures, response categories are entered into the analysis as separate dichotomous variables.
Table 2.
Descriptive statistics for occasion characteristics.a
| Occasions | Units consumed | % Low risk | % Increasing risk | % High risk | |||
|---|---|---|---|---|---|---|---|
| % | n | Mean | Median | ||||
| Occasion location | |||||||
| Off‐trade only | 67.0 | 125 802 | 6.6 | 4.5 | 68.9 | 21.8 | 9.3 |
| On‐trade only | 22.1 | 41 546 | 8.0 | 5.7 | 60.2 | 26.6 | 13.1 |
| Mixed location | 10.9 | 20 530 | 14.2 | 11.3 | 25.2 | 38.5 | 36.3 |
| Companyc | |||||||
| Family | 23.1 | 43 354 | 7.5 | 4.5 | 61.4 | 24.1 | 14.6 |
| Friends | 32.7 | 61 523 | 10.5 | 7.9 | 43.9 | 31.8 | 24.3 |
| Spouse/partner | 44.4 | 83 448 | 6.7 | 4.5 | 63.4 | 24.8 | 11.8 |
| Work colleagues | 3.9 | 7 238 | 10.0 | 6.8 | 52.6 | 26.0 | 21.5 |
| Alone | 16.6 | 31 247 | 6.3 | 4.5 | 69.5 | 21.0 | 9.5 |
| Gender composition of groupc | |||||||
| Male alone | 9.1 | 17 160 | 7.1 | 4.6 | 68.1 | 22.0 | 9.9 |
| Female alone | 4.5 | 8 517 | 4.6 | 2.6 | 72.8 | 19.0 | 8.2 |
| Mixed‐sex pair | 32.4 | 60 844 | 5.8 | 4.5 | 69.0 | 22.8 | 8.2 |
| Male pair/group | 13.3 | 24 914 | 9.7 | 7.1 | 52.4 | 29.5 | 18.1 |
| Female pair/group | 6.4 | 11 972 | 6.8 | 4.5 | 54.3 | 26.8 | 18.9 |
| Mixed‐sex group | 40.1 | 75 429 | 9.1 | 6.6 | 51.2 | 28.5 | 20.3 |
| Day | |||||||
| Monday–Thursday | 39.6 | 74 419 | 6.1 | 4.5 | 69.1 | 21.5 | 9.4 |
| Friday–Saturday | 43.9 | 82 466 | 8.1 | 5.3 | 55.5 | 27.7 | 16.8 |
| Sunday | 16.5 | 30 993 | 6.9 | 4.5 | 63.7 | 24.2 | 12.1 |
| Duration | |||||||
| Less than 1 hour | 29.1 | 54 597 | 3.4 | 2.3 | 91.4 | 6.9 | 1.8 |
| 1–3 hours | 50.8 | 95 405 | 7.7 | 5.7 | 58.0 | 29.1 | 12.9 |
| 4–6 hours | 18.0 | 33 740 | 11.8 | 9.1 | 31.8 | 40.7 | 27.5 |
| 6+ hours | 2.2 | 4 136 | 17.0 | 15.0 | 21.9 | 27.4 | 50.7 |
| Start time | |||||||
| Before 2 pm | 9.9 | 18 632 | 6.8 | 4.3 | 68.5 | 18.1 | 13.4 |
| 2–5 pm | 8.6 | 16 158 | 8.8 | 5.4 | 55.6 | 24.2 | 20.2 |
| 5–8 pm | 41.6 | 78 126 | 7.4 | 4.6 | 57.6 | 27.8 | 14.6 |
| 8–10 pm | 32.0 | 60 157 | 6.6 | 4.5 | 65.1 | 24.3 | 10.5 |
| 10 pm onwards | 7.9 | 14 805 | 5.5 | 3.6 | 73.8 | 18.5 | 7.8 |
| Reason for occasionb , c | |||||||
| Quiet night in | 18.0 | 33 834 | 6.4 | 4.5 | 67.2 | 23.5 | 9.3 |
| Sociable get‐together | 14.4 | 26 978 | 10.0 | 7.5 | 43.8 | 33.0 | 23.3 |
| Regular/everyday drink | 13.1 | 24 604 | 6.6 | 4.5 | 63.9 | 24.8 | 11.4 |
| Staying in as a couple | 10.2 | 19 077 | 6.8 | 4.5 | 61.7 | 26.9 | 11.4 |
| Rounding off the evening or | 7.1 | 13 399 | 5.9 | 3.7 | 70.4 | 19.6 | 10.0 |
| Motivation for occasionc | |||||||
| To wind down or chill out | 33.5 | 63 027 | 6.7 | 4.5 | 65.1 | 24.3 | 10.6 |
| To have a laugh | 14.2 | 26 764 | 12.2 | 9.1 | 35.7 | 33.5 | 30.8 |
| To spend quality time with someone special | 13.9 | 26 062 | 7.7 | 5.0 | 56.3 | 28.7 | 15.0 |
| To recharge or invigorate | 8.3 | 15 611 | 6.9 | 4.5 | 65.8 | 21.0 | 13.2 |
| To bond with others | 8.0 | 15 046 | 9.7 | 6.8 | 47.5 | 31.3 | 21.2 |
| Total | 100.0 | 187 878 | 7.06 | 4.50 | 62.2 | 24.6 | 13.1 |
Due to the volume of data, response categories for location, composition of group, day, start time and duration are collapsed and only the five most common responses for motivation and reason are shown. This is for presentational purposes; disaggregated data and all response categories were used in the latent class analysis as shown in Table 4.
Kantar Worldpanel refer to reason for occasion as type of occasion. We have renamed this variable to avoid confusion, as we refer to the outputs of the latent class analysis as occasion types.
Responses are not mutually exclusive, in part due to changes across the course of an occasion.
Table 4.
Full latent class model results characterizing eight types of drinking occasion.
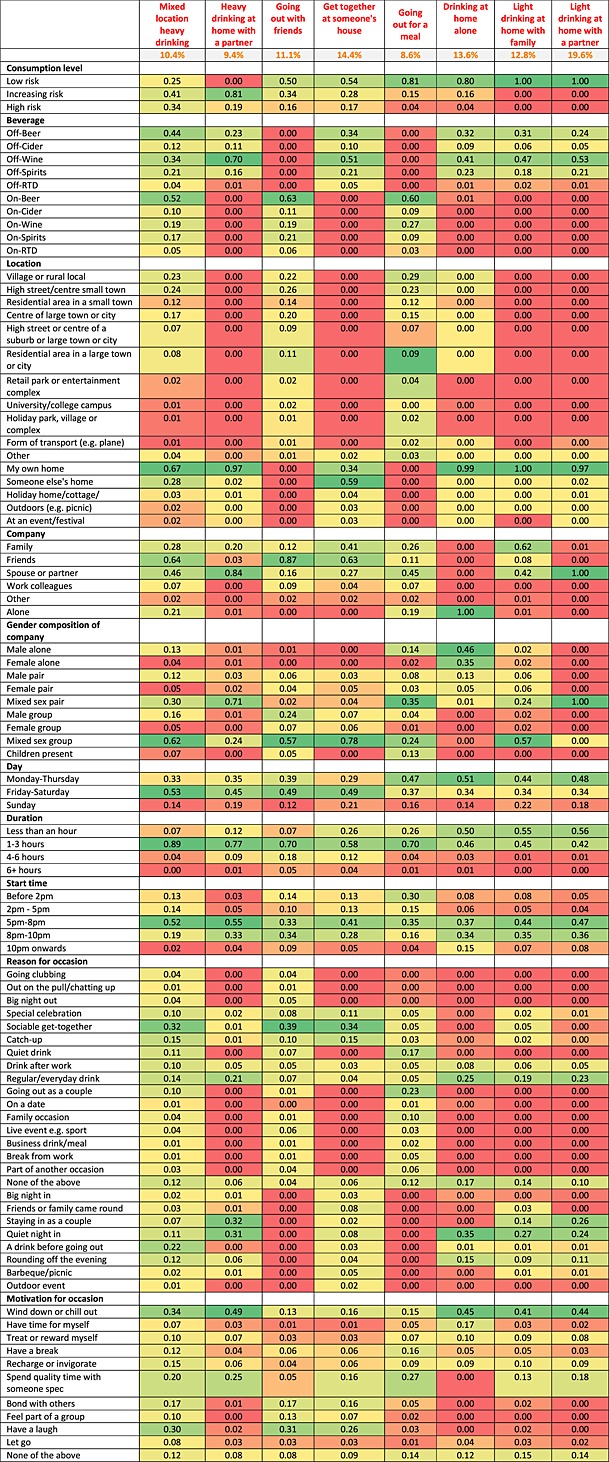
RTD = Ready‐To‐Drink.
Socio‐demographic variables used are gender, age (two categories, < 35 versus 35+) and National Readership Survey (NRS) social grade (two categories, ABC versus DE). NRS social grade is an occupation‐based measure of socio‐economic status where ABC occupations are higher managerial through to skilled manual work and DE occupations are semi‐ or unskilled workers and the unemployed 23.
Analysis
In line with the practice perspective, the drinking occasion rather than the individual is the unit of analysis and each occasion is considered the performance of a practice. Kantar Worldpanel define an occasion as a period of drinking in one or more locations in either the on‐trade only or the off‐trade only. The present analysis uses a different definition in order to allow occasions to encompass both on‐trade and off‐trade drinking. This alternative definition classes an occasion as a period of drinking with no 2‐hour gap between consecutive drinks.
Latent class analysis (LCA) is used to segment occasions into types (i.e. practices) based on the measures above. Socio‐demographic characteristics are not included in the LCA and are used only in secondary analyses described below. The LCA groups occasions probabilistically into mutually exclusive types, which are distinguished from other types by their propensity to share certain combinations of characteristics 24, 25, 26. The key outputs of the LCA are the probability of any given occasion being of each type and the probability of an occasion having a particular characteristic conditional on it being of a particular type.
All analyses are performed using SAS version 9.3 with LCA models fitted using the PROC LCA procedure version 1.3.0, with sampling weights applied in the estimation procedure. To account for nesting of occasions within individuals, a clustered LCA model is fitted with respondents treated as clusters. The current version of PROC LCA does not support using parameter restrictions within clustered models, thus precluding pre‐specification of model parameters based on external evidence. Within SAS version 9.3, the inclusion of clusters and weights in the estimation process also necessitates usage of pseudo, rather than true maximum likelihood. This affects the accuracy of estimated parameters and goodness‐of‐fit measures; however, given the sample size, no large deviance between the pseudo and true likelihood is expected and results will be largely unaffected. To avoid convergence to local minima or maxima and check results for robustness, 20 random data subsamples were used to fit each model, with the best fitting retained as the final model 27, 28, 29.
Analysts pre‐specify the number of occasions to be fitted by the LCA and model selection is guided by the Akaike information criterion (AIC), Bayesian information criterion (BIC), ‘consistent’ AIC (CAIC) and adjusted (BIC) ABIC, with lower values indicating better model fits. Typically, analysts fit additional occasion types until the model fit statistics no longer improve significantly. However, parsimony, interpretability and meaningfulness are also valid considerations and where sample sizes are large, as in the present case, model fit may continue to improve beyond the point where the model is too complex to interpret.
LCA is a probabilistic approach and does not assign occasions deterministically to types. However, it is common practice to undertake such assignment, and we do so here to permit examination of average consumption levels and socio‐demographic patterns by occasion type. Occasions are assigned to the types to which they have the highest probability of membership based on their characteristics 26, 30. Relationships between socio‐demographics and occasion types are explored descriptively as opposed to using regression models, as we aim to assign relationships straightforwardly by age–sex–social grade subgroups rather than by each socio‐demographic characteristic independently.
Results
Descriptive analysis
Tables 1 and 2 summarize the sample characteristics and descriptive data on occasions, respectively. Individuals had an average of 3.2 occasions in the diary week, with an average of 2.1, 0.8 and 0.3 being low‐risk, increasing risk and high‐risk, respectively. Of 187 878 occasions, 67.0% were solely off‐trade, 22.1% were solely on‐trade and 10.9% involved both off‐ and on‐trade drinking. Almost half (44.4%) of occasions involved drinking with a spouse or partner, while 16.6% involved drinking alone. Occasions occurred throughout the week, but 43.9% were on Friday or Saturday. Most started between 5 pm and 10 pm (73.6%) and common reasons for occasions were a quiet night in (18.0%), a sociable get‐together (14.4%) and regular/everyday drinking (13.1%). Approximately two‐thirds of occasions were low‐risk (62.2%), while the remainder were increasing risk (24.6%) and high‐risk (13.1%). High‐risk occasions were particularly common when drinking with friends (24.3%) or colleagues (21.5%), when drinking switched between on‐ and off‐trade (36.3%), when drinking began between 2 pm and 5 pm (20.2%), in sociable get‐togethers (23.3%) and where the motivation was to have a laugh (30.8%).
Table 1.
Descriptive statistics by age, gender and social subgroup based on a diary data sample of 187 878 drinking occasions within 60 215 individuals between 2009 and 2011.
| Sex–age–social grade groupa | % of population (n = 60 215) | Units consumed in diary week | Number of occasions per week: mean (SD) | ||||
|---|---|---|---|---|---|---|---|
| Mean | Median | Total | Low riskb | Increasing risk | High risk | ||
| Female < 35 DE | 6.3 | 21.1 | 13.9 | 2.5 (2.0) | 1.4 (1.6) | 0.6 (0.9) | 0.5 (0.8) |
| Female < 35 ABC | 17.0 | 19.8 | 13.6 | 2.7 (1.8) | 1.6 (1.5) | 0.7 (0.9) | 0.4 (0.8) |
| Female 35+ DE | 6.1 | 16.0 | 9.1 | 2.7 (2.1) | 1.8 (1.9) | 0.6 (1.0) | 0.3 (0.7) |
| Female 35+ ABC | 17.9 | 16.6 | 11.3 | 3.1 (2.2) | 2.2 (2.1) | 0.7 (1.1) | 0.2 (0.6) |
| Male < 35 DE | 5.1 | 30.5 | 20.9 | 2.9 (2.1) | 1.6 (1.8) | 0.7 (1.0) | 0.6 (0.9) |
| Male < 35 ABC | 15.5 | 28.9 | 20.6 | 3.2 (2.2) | 1.9 (1.8) | 0.8 (1.0) | 0.5 (0.8) |
| Male 35+ DE | 9.0 | 28.5 | 18.3 | 3.5 (2.6) | 2.2 (2.4) | 0.9 (1.3) | 0.4 (0.9) |
| Male 35+ ABC | 23.1 | 26.6 | 18.5 | 3.7 (2.6) | 2.6 (2.4) | 0.9 (1.3) | 0.3 (0.8) |
| Total | 100.0 | 22.8 | 15.1 | 3.2 (2.3) | 2.1 (2.1) | 0.8 (1.2) | 0.3 (0.8) |
Social grade definitions: ABC represents managerial, professional, clerical and skilled manual occupations. DE represents semi‐skilled and unskilled manual occupations and the unemployed.
Low risk: <6/8 units for females/males, Increasing risk: 6‐12/8‐16 units, High risk >12/16 units. SD = standard deviation.
Model fitting
As anticipated, model fit continued to improve significantly, with very large numbers of occasions specified (e.g. 20+). In line with the parsimony principle, models with six to nine occasion types were examined and a final model with eight types was selected on largely pragmatic grounds, as these types were identified clearly and interpretable, and requesting identification of additional occasion types produced only subcategories of the existing types. Supporting information, Table S1 shows model fit statistics for two to 10 class models and Supporting information, Fig. S1 shows that the percentage change in model fit statistics declines consistently as additional classes are added, except when an eighth class is added, suggesting that this delivered above anticipated levels of improvement in model fit. Focus group research with British drinkers, reported elsewhere 31, was used to validate the derived typology and supported this decision. Two sets of focus groups were conducted: the first asked participants to describe their occasions and highlight the most salient characteristics and the second used preliminary LCA results to construct stylized drinkers and their occasions which participants were asked to assess for face validity and similarity to their own occasions. In each case, focus group data supported our interpretation of the LCA results and identified no major omitted occasion types.
Typology of occasions
Table 3 presents summaries of the eight types of drinking practice identified, with the full statistical results provided in Table 4. The most common practice is ‘Light drinking at home with a partner’, which accounts for 19.6% of occasions. Taken alongside ‘Light drinking at home with family’ and ‘Drinking at home alone’ this generally low‐risk, brief, regular, relaxing home drinking accounts for almost half (46.0%) of all occasions. However, home drinking is not always low risk. ‘Heavy drinking at home with a partner’ accounts for 9.4% of occasions. This practice always involves increasing or high‐risk consumption levels and is characterized typically by chilling out with wine on weekend evenings. Similarly, ‘Get‐together at someone's house’ accounts for 14.4% of occasions, and although these typically lengthy weekend gatherings of friends and/or family are often diverse in character, 46.0% involved drinking at increasing or high‐risk levels.
Table 3.
Summary of the eight types of drinking occasion or practices identified by the latent class analysis of British drinking occasions 2009–11.a
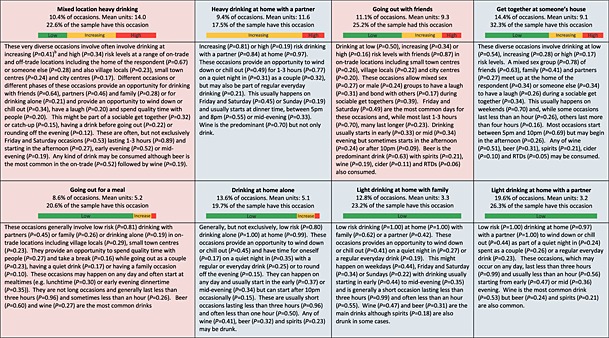
Shading indicates off‐trade only (blue) or occasions including on‐trade (red). Bars show proportion of low‐, increasing or high‐risk occasions.
Probability of occasions having this characteristic, given it is of this type.
High‐risk drinking was most likely to be found in a diverse practice described here as ‘Mixed location heavy drinking’. This practice was more difficult to characterize but tended towards heavier drinking split between on‐ and off‐trade locations for a range of purposes, motivations and participants. It appears to incorporate nights out in urban centres with pre‐loading, relaxing drinking throughout the day with changes in location and company and also having a night out followed by a nightcap at home. The familiar urban centre ‘big night out’ with associated binge drinking may be split between this occasion type and ‘Going out with friends’, which does not include any off‐trade drinking (i.e. no pre‐loading) and accounts for 11.1% of all occasions, although many were low risk (50.0%) and simply provided an opportunity for friends to get together at the local pub over a pint or two.
Alternative latent class models
Although this paper focuses on the preferred eight‐class model, examining results for models with fewer and greater numbers of latent classes can provide additional insights into which types of drinking occasion share the same latent space and what additional information can be gained by adding latent classes. Thus, Supporting information, Tables S2–6 present models with six, seven, eight and nine latent classes. In broad terms, transitioning from six to seven classes distinguishes ‘Going out with friends’ from ‘Going out for a meal’; transitioning from seven to eight classes distinguishes ‘Light drinking at home with a partner’ from ‘Heavy drinking at home with a partner’; and transitioning from eight to nine classes allows identification of an additional male‐dominated on‐trade beer‐drinking occasion type which includes going to the pub alone.
Further analyses of practices
Individual occasions were assigned to practices for further analysis. A limitation of this approach is that many occasions may be assigned incorrectly if modal probabilities are low. In this case, more than 75% of occasions were assigned to practices based on probabilities above 0.95 and 90% of occasions were assigned to practices based on modal probabilities above 0.75.
The practice with the highest mean consumption was ‘Mixed location heavy drinking’ (14.0 units) followed by ‘Heavy drinking at home with a partner’ (11.6 units) (Supporting information, Fig. S2). In contrast, the practices with lowest mean consumption were ‘Light drinking at home with a partner’ (3.2 units) and ‘Light drinking at home with family’ (3.3 units). The distribution of consumption across beverages should be interpreted cautiously, as these represent averages across different occasions and individuals rather than consumption by a typical individual on a typical occasion. However, beer generally dominates on‐trade drinking practices, perhaps reflecting or explaining this practice being performed disproportionately by males (see Supporting information, Fig. S3). To a lesser extent, wine dominates off‐trade drinking practice, although beer, cider and spirits are still consumed commonly. There is little evidence that on‐trade spirits play a substantial role in high‐risk drinking practices on average, although examination of the distribution of on‐trade spirits consumed by occasion type (data not shown) suggests that a small number (< 10%) of primarily younger female drinkers consumed higher volumes of spirits within on‐trade or mixed location practices.
Supporting information, Fig. S3 shows how the low‐, increasing and high‐risk occasions of each socio‐demographic group are distributed across practices. The sociable, having a laugh‐orientated practices involving on‐trade drinking and drinking with friends account for greater proportions of male and younger drinkers’ occasions compared to other groups, and these proportions increase as consumption levels rise. In contrast, the practices of both male and female older drinkers tend towards relaxation and routinized drinking with a partner at home, irrespective of whether these are low‐, increasing or high‐risk occasions. There are also more fine‐grained differences in practice, such as older males having proportionately fewer ‘Get‐together at someone's house’ occasions, while ‘Drinking at home alone’ appears to be a disproportionately common high‐risk occasion for older males of lower social grade.
Focusing on high‐risk occasions, approximately 60% of older females’ high risk occasions are centred on home drinking compared to approximately 45% among older males. This is due primarily to ‘Heavy drinking at home with a partner’ being a more dominant practice among older age groups. While young drinkers’ pre‐loading before big nights out has attracted substantial attention, high‐risk drinking practices among older age groups also include substantial quantities of ‘Mixed location heavy drinking’. Further, depending on gender and social grade, between 30 and 50% of younger drinkers’ high risk occasions involve no on‐trade drinking at all. This points towards considerable heterogeneity in high‐risk drinking practices across age groups and, at this level of detail, little evidence that particular practices are confined to specific age groups.
Finally, breakdowns of mean beverage‐specific consumption by practice and socio‐demographic group are presented in Supporting information, Fig. S4. This shows that although drinkers of lower social grade have fewer occasions overall, their mean consumption is higher per occasion within almost all practices.
Discussion
The above results present a typology of British drinking practices based on detailed diary data. Three key points emerge: first, characterizations of the British drinking culture as one of excess (e.g. 32) are simplistic. Although not a culture of exclusive moderation, practices akin to the socially integrated, frequent but moderate drinking associated traditionally with Mediterranean Europe are more common than is often acknowledged in policy debate. Secondly, increasing and high‐risk drinking are found across society and are contained within diverse practices. They include youth big nights out in urban centres, relaxed and routinized home drinking among older couples, sociable domestic gatherings of family and friends and a range of occasions where the accumulation of drinks across on‐ and off‐trade locations over long periods of time lead to high consumption levels. The latter two examples in particular have attracted little research or policy debate. Thirdly, drinkers of lower socio‐economic status have fewer occasions but consume more per occasion, suggesting that greater alcohol‐related mortality risk among lower socio‐economic groups may, in part, be explained by higher levels of intoxication per occasion 33, 34, 35.
Limitations
Although offering analytical possibilities unavailable within any publicly accessible UK data set, the Alcovision data set has important limitations beyond standard concerns regarding self‐reported alcohol consumption data. The data set is collected for commercial market research rather than scientific study, and variables often align imperfectly with the drinking practice literature and have greater numbers of response options than is typical for scientific studies. The subset of data used for this analysis lacked a variable denoting food consumption, meaning a ‘Drinking with a meal’ occasion could not be identified with confidence, although the start time of occasions provided a useful proxy measure. Finally, applying multi‐level modelling to nest occasions explicitly within individuals would have permitted clearer understanding of the links between practices and individual drinking patterns and presents an important direction for future research. For example, this may reveal the extent to which different types of heavy drinking occasions are nested within drinkers classed as moderate, hazardous or harmful based on their average weekly consumption.
Implications for policy and research
The adoption of a practice perspective within alcohol policy analysis re‐weights analytical focus away from individualized measures of frequency, quantity and pattern of alcohol consumption and towards understanding of how interventions affect whether, when, where, why and how people drink and get drunk. This recognizes that all drinking is not equal in epidemiological, policy or political terms even if the same amount of alcohol is consumed. For example, ‘Mixed location heavy drinking’, as a drinking practice, may be associated with more or less alcohol‐related harm or less responsiveness to policy interventions and particular condemnation in public discourse when compared to ‘Heavy drinking at home with a partner’. The analysis above provides researchers and policy stakeholders with an analytical framework grounded in social theory which can be used when exploring these distinctions in alcohol policy analysis and discourse.
A practice‐perspective also affords greater understanding of the meso‐level social phenomena which link micro‐level behavioural decisions to macro‐level structures such as commercial activity and social inequalities 8. This can be seen in alcohol advertising research, which often posits a dose–response relationship whereby increased exposure to the advertising produced by multi‐national corporations generates increased harmful behaviour by directly influencing individual decision‐making, particularly among vulnerable populations 36. A practice perspective would argue instead that advertising situates products within practices and aims to develop, reinforce or evolve links between the materials, competences and meanings comprising those practices. As those elements of practice have differential availability and relevance to individuals across society, the resultant effects of advertising will not be well understood by models which do not account for the heterogeneity of drinking practices or the individuals who perform them. Such insights should motivate researchers to detect heterogeneous effects of advertising by designing more targeted analyses and may prompt reconsideration of recommended policy responses.
Benefits for evidence‐based policy‐making may also be realized through inviting policy actors to specify the drinking practices and components of practice (e.g. motivations, locations, consumption levels) which they aim to change when announcing new interventions. Crudely, this would involve stating the parameters of our typological model which are of particular concern and specifying what a more acceptable model would look like. By examining changes in the typological model in response to implemented policies, an evidence base can be developed describing the interaction between different policy options, drinking cultures and drinking practice. A challenging question which may emerge from this process is: can the parameters of an alternative model be specified which would represent a culture requiring no further intervention?
There are important barriers to integrating a practice perspective within current approaches to alcohol policy analysis. Crucially, the existing evidence base (both empirical literature and data sets) is not constructed for this purpose. For example, few epidemiological risk estimates are available pertaining to specific drinking practices and, beyond Finland 20, there appear to be no data sets available internationally which would allow for similar typologies to be created for cross‐national comparison. Therefore, a key recommendation is to collect comparable international data sets which are purpose‐designed for analysis of drinking practices and include robust contextual, epidemiological and psychological measures.
This process will take time, and the following are tractable shorter‐term research goals. First, there is a need to apply trend analysis techniques to understand change in practices over time and map declining and emerging risk behaviours. This may be undertaken at the population level or as a study of changing subcultures which have been poorly mapped, and may potentially be located within particular socio‐demographic groups 4. Quantitative analysis of temporal change in practice has presented a major hurdle for sociologists, and alcohol researchers may contribute usefully to social theory in this area 15, 37. Secondly, evaluation and natural experiment opportunities should be sought to evaluate how drinking practices respond to economic, social and policy changes. In Britain, recent opportunities include the ban on smoking in public places and sharp changes in the affordability and availability of alcohol 21, 38. Thirdly, understanding of how risk relates to different drinking practices is required. Where data linking drinking practices to health outcomes are unavailable, synthetic risk estimates may be created using techniques similar to those applied when generating highly localized synthetic estimates of alcohol‐related harm in England 39. Fourthly, improved analysis of whether globalization is leading to convergence in drinking culture and comparative studies between countries with available data will permit understanding of whether, as has been seen for other consumption behaviours, convergence is occurring alongside resilience and emergence of certain local practices 18, 19, 40. Finally, findings generated from the above activities require synthesis to facilitate systematic consideration of evidence in policy decision‐making. Adaptations of decision‐models, such as the Sheffield Alcohol Policy Model 41, 42, 43, to meet this need may extend their utility to policy actors.
Conclusions
Applying a practice perspective to British drinking culture reveals the dominance of moderate drinking practices, with high‐risk drinking practices being less common and more diverse than it may appear from current popular and policy discourse. The practice perspective also offers the potential for a step‐change in alcohol policy analysis by providing greatly enhanced insight into the characteristics of national drinking cultures and practices and how and why they change in response to public health interventions.
Declaration of interests
None.
Supporting information
Table S1 Latent class model fit statistics.
Table S2 Full results for a six latent class model of drinking occasions.
Table S3 Full results for a seven latent class model of drinking occasions.
Table S4 Full results for a seven latent class model of drinking occasions.
Table S5 Full results for a nine latent class model of drinking occasions.
Table S6 Full results for latent class models with 6,7,8 and 9 latent classes organised by drinking occasion type.
Figure S1 Percentage change in model fit statistics as additional class is added.
Figure S2 Mean units consumed by beverage type and occasion (values less than 0.5 not labelled).
Figure S3 Composition of low (top), increasing and high (bottom) risk drinking occasions by sociodemographic group (percentages less than 5% not labelled).
Figure S4 Mean beverage‐specific consumption by occasion type and sociodemographic group (values less than 0.5 not labelled).
Supporting info item
Acknowledgements
This research was funded by a Research and Development Grant from Alcohol Research UK (R 2013/08).
Ally, A. K. , Lovatt, M. , Meier, P. S. , Brennan, A. , and Holmes, J. (2016) Developing a social practice‐based typology of British drinking culture in 2009–2011: implications for alcohol policy analysis. Addiction, 111: 1568–1579. doi: 10.1111/add.13397.
References
- 1. Room R., Mäkelä K. Typologies of the cultural position of drinking. J Stud Alcohol 2000; 61: 475–83. [DOI] [PubMed] [Google Scholar]
- 2. Gordon R., Heim D., MacAskill S. Rethinking drinking cultures: a review of drinking cultures and a reconstructed dimensional approach. Public Health 2012; 126: 3–11. [DOI] [PubMed] [Google Scholar]
- 3. Nicholls J. Time for reform? Alcohol policy and cultural change in England since 2000. Br Politics 2012; 7: 250–71. [Google Scholar]
- 4. Room R., Callinan S., Dietze P. Influences on the drinking of heavier drinkers: interactional realities in seeking to ‘change drinking cultures’. Drug Alcohol Rev 2016; 35: 13–21. [DOI] [PubMed] [Google Scholar]
- 5. Patterson C., Katikireddi S., Wood K., Hilton S. Representations of minimum unit pricing for alcohol in UK newspapers: a case study of a public health policy debate. J Public Health 2015; 37: 40–9. [DOI] [PMC free article] [PubMed] [Google Scholar]
- 6. Room R. The impossible dream? Routes to reducing alcohol problems in a temperances culture. J Subst Abuse 1992; 4: 91–106. [DOI] [PubMed] [Google Scholar]
- 7. Babor T. F., Caetano R., Casswell S., Edwards G., Giesbrecht N., Graham K. et al. Alcohol: No Ordinary Commodity. Research and Public Policy. Oxford: Oxford University Press; 2010. [Google Scholar]
- 8. Blue S., Shove E., Carmona C., Kelly M. P. Theories of practice and public health: understanding (un)healthy practices. Crit Public Health 2016; 26: 36–50. [Google Scholar]
- 9. Shove E., Pantzar M., Watson M. The Dynamics of Social Practice: Everyday Life and How it Changes. London: Sage; 2012. [Google Scholar]
- 10. Warde A. Consumption and theories of practice. J Consum Cult 2005; 5: 131–53. [Google Scholar]
- 11. Schatzki T. R., Cetina K. K., Savigny E. V. The Practice Turn in Contemporary Theory. New York: Routledge; 2001. [Google Scholar]
- 12. Bourdieu P. Distinction: A Social Critique of the Judgement of Taste. Abingdon, UK: Routledge; 1984. [Google Scholar]
- 13. Bourdieu P. Outline of a Theory of Practice. Cambridge: Cambridge University Press; 1977. [Google Scholar]
- 14. Skog O. J. The collectivity of drinking cultures: a theory of the distribution of alcohol consumption. Br J Addict 1985; 80: 83–99. [DOI] [PubMed] [Google Scholar]
- 15. Warde A. After taste: culture, consumption and theories of practice. J Consum Cult 2014; 14: 279–303. [Google Scholar]
- 16. Reckwitz A. Toward a theory of social practices: a development in culturalist theorizing. Eur J Social Theory 2002; 5: 243–63. [Google Scholar]
- 17. Mäkelä P., Gmel G., Grittner U., Kuendig H., Kuntsche S., Bloomfield K. et al. Drinking patterns and their gender differences in Europe. Alcohol Alcohol 2006; 41: i8–18. [DOI] [PubMed] [Google Scholar]
- 18. Southerton D., Olsen W., Warde A., Cheng S. Practices and trajectories: a comparative analysis of reading in France, Norway, the Netherlands, the UK and the USA. J Consum Cult 2012; 12: 237–62. [Google Scholar]
- 19. Warde A., Cheng S., Olsen W., Southerton D. Changes in the practice of eating. Acta Sociol 2007; 50: 363–85. [DOI] [PubMed] [Google Scholar]
- 20. Mustonen H., Mäkelä P., Lintonen T. Toward a typology of drinking occasions: latent classes of an autumn week's drinking occasions. Addict Res Theory 2014; 22: 524–34. [Google Scholar]
- 21. Health and Social Care Information Centre Statistics on Alcohol: England. Leeds, UK: Health and Social Care Information Centre; 2015. [Google Scholar]
- 22. Dietze P. M., Livingston M., Callinan S., Room R. The big night out: what happens on the most recent heavy drinking occasion among young Victorian risky drinkers? Drug Alcohol Rev 2014; 33: 346–53. [DOI] [PubMed] [Google Scholar]
- 23. Ipsos MediaCT Social grade: A classification tool. Ipsos MediaCT: London, UK; 2009. [Google Scholar]
- 24. Collins L. M., Lanza S. T. Latent Class and Latent Transition Analysis with Application in the Social, Behavioral and Health Science. Hoboken, NJ: John Wiley and Sons; 2010. [Google Scholar]
- 25. Lanza S. T., Collins L. M., Lemmon D. R., Schafer J. L. PROC LCA: A SAS procedure for latent class analysis. Struct Equ Model 2007; 14: 671–94. [DOI] [PMC free article] [PubMed] [Google Scholar]
- 26. Hagenaars J. A., McCutcheon A. L. Applied Latent Class Analysis. Cambridge, UK: Cambridge University Press; 2002. [Google Scholar]
- 27. Patterson B. H., Dayton C. M., Graubard B. I. Latent class analysis of complex sample survey data: Application to dietary data. J Am Stat Assoc 2002; 97: 721–9. [Google Scholar]
- 28. Wedel M., ter Hofstede F., Steenkamp J.‐B. E. M. Mixture model analysis of complex samples. J Classif 1998; 15: 225–44. [Google Scholar]
- 29. Vermunt J. K., Magidson J. Latent class analysis In: Bryman A., Liao T. F., editors. The Sage Encylopedia of Social Sciences Research Methods. Thousand Oaks, CA: Sage Publications; 2004, pp. 549–553. [Google Scholar]
- 30. McCutcheon A. Latent Class Analysis. London, UK: Sage; 1987. [Google Scholar]
- 31. Holmes J., Lovatt M., Ally A., Brennan A., Meier P. A New Approach To Measuring Drinking Cultures in Britain. London: Alcohol Research UK; Forthcoming; 2016. Available at: http://alcoholresearchuk.org/alcohol-insights/a-new-approach-to-measuring-drinking-cultures-in-britain-2/ [Google Scholar]
- 32. HM Government The Government.s Alcohol Strategy. London, UK: HM Government; 2012. [Google Scholar]
- 33. Mäkelä P., Paljärvi T. Do consequences of a given pattern of drinking vary by socioeconomic status? A mortality and hospitalisation follow‐up for alcohol‐related causes of the Finnish Drinking Habits Survey. J Epidemiol Commun Health 2008; 62: 728–33. [DOI] [PubMed] [Google Scholar]
- 34. Marmot M. Fair Society, Healthy Lives: Strategic Review of Health Inequalities in England Post‐2010. In: Review T. M., editor. London, UK: The Marmot Review; 2010. Available at: http://www.instituteofhealthequityorg/projects/fair‐society‐healthy‐lives‐the‐marmot‐review (accessed 10 May 2016). [Google Scholar]
- 35. Centre for Public Health Understanding the Alcohol Harm Paradox in Order to Focus the Development of Interventions. London, UK: Alcohol Research UK; 2015. [Google Scholar]
- 36. Anderson P., de Bruijn A., Angus K., Gordon R., Hastings G. Impact of alcohol advertising and media exposure on adolescent alcohol use: a systematic review of longitudinal studies. Alcohol Alcohol 2009; 44: 229–43. [DOI] [PubMed] [Google Scholar]
- 37. Cheng S., Olsen W., Southerton D., Warde A. The changing practice of eating: evidence from UK time diaries, 1975 and 2000. Br J Sociol 2007: 58: 39–61. [DOI] [PubMed] [Google Scholar]
- 38. British Beer and Pub Association Statistical Handbook. London: Brewing Publications Limited; 2014. [Google Scholar]
- 39. North West Public Health Observatory Topography of Drinking Behaviours in England: Synthetic Estimates of Numbers and Proportions of Abstainers, Lower Risk, Increasing Risk and Higher Risk Drinkers in Local Authorities in England. Liverpool: Centre for Public Health; 2011. [Google Scholar]
- 40. Warde A. The sociology of consumption: its recent development. Ann Rev Sociol 2015; 41: 1–12. [Google Scholar]
- 41. Holmes J., Meng Y., Meier P. S., Brennan A., Angus C., Campbell‐Burton C. A. et al. Effects of minimum unit pricing for alcohol on different income and socioeconomic groups: a modelling study. Lancet 2014; 383: 1655–64. [DOI] [PMC free article] [PubMed] [Google Scholar]
- 42. Brennan A., Meier P., Purshouse R., Rafia R., Meng Y., Hill‐McManus D. et al. The Sheffield Alcohol Policy Model: A Mathematical Description. Health Econ 2015; 24: 1368–88. [DOI] [PubMed] [Google Scholar]
- 43. Brennan A., Meier P., Purshouse R., Rafia R., Meng Y., Hill‐McManus D. Developing policy analytics for public health strategy and decisions—the Sheffield alcohol policy model framework. Ann Operat Res 2016; 236: 149–76. [DOI] [PMC free article] [PubMed] [Google Scholar]
Associated Data
This section collects any data citations, data availability statements, or supplementary materials included in this article.
Supplementary Materials
Table S1 Latent class model fit statistics.
Table S2 Full results for a six latent class model of drinking occasions.
Table S3 Full results for a seven latent class model of drinking occasions.
Table S4 Full results for a seven latent class model of drinking occasions.
Table S5 Full results for a nine latent class model of drinking occasions.
Table S6 Full results for latent class models with 6,7,8 and 9 latent classes organised by drinking occasion type.
Figure S1 Percentage change in model fit statistics as additional class is added.
Figure S2 Mean units consumed by beverage type and occasion (values less than 0.5 not labelled).
Figure S3 Composition of low (top), increasing and high (bottom) risk drinking occasions by sociodemographic group (percentages less than 5% not labelled).
Figure S4 Mean beverage‐specific consumption by occasion type and sociodemographic group (values less than 0.5 not labelled).
Supporting info item