Abstract
Early estimates of the transmission potential of emerging and re-emerging infections are increasingly used to inform public health authorities on the level of risk posed by outbreaks. Existing methods to estimate the reproduction number generally assume exponential growth in case incidence in the first few disease generations, before susceptible depletion sets in. In reality, outbreaks can display subexponential (i.e. polynomial) growth in the first few disease generations, owing to clustering in contact patterns, spatial effects, inhomogeneous mixing, reactive behaviour changes or other mechanisms. Here, we introduce the generalized growth model to characterize the early growth profile of outbreaks and estimate the effective reproduction number, with no need for explicit assumptions about the shape of epidemic growth. We demonstrate this phenomenological approach using analytical results and simulations from mechanistic models, and provide validation against a range of empirical disease datasets. Our results suggest that subexponential growth in the early phase of an epidemic is the rule rather the exception. Mechanistic simulations show that slight modifications to the classical susceptible–infectious–removed model result in subexponential growth, and in turn a rapid decline in the reproduction number within three to five disease generations. For empirical outbreaks, the generalized-growth model consistently outperforms the exponential model for a variety of directly and indirectly transmitted diseases datasets (pandemic influenza, measles, smallpox, bubonic plague, cholera, foot-and-mouth disease, HIV/AIDS and Ebola) with model estimates supporting subexponential growth dynamics. The rapid decline in effective reproduction number predicted by analytical results and observed in real and synthetic datasets within three to five disease generations contrasts with the expectation of invariant reproduction number in epidemics obeying exponential growth. The generalized-growth concept also provides us a compelling argument for the unexpected extinction of certain emerging disease outbreaks during the early ascending phase. Overall, our approach promotes a more reliable and data-driven characterization of the early epidemic phase, which is important for accurate estimation of the reproduction number and prediction of disease impact.
Keywords: effective reproduction number, phenomenological model, generalized-growth model, epidemics, exponential growth, subexponential growth
1. Introduction
There is a long and successful history of using compartmental transmission models to study epidemic dynamics, often calibrated using time-series data describing the progression of the epidemic [1–6]. A fundamental tenet of the classic epidemic theory is that the initial growth phase should be exponential in the absence of susceptible depletion or interventions measures. However, early subexponential (e.g. polynomial) growth patterns have been observed in outbreaks of HIV/AIDS [7–9], Ebola [10] and foot-and-mouth disease (FMD) [11]. Potential mechanisms remain debated but include spatial heterogeneity, perhaps mediated by the route of transmission (i.e. airborne versus close contact) [10–12], clustering of contacts [8] and reactive population behavioural changes that can gradually mitigate the transmission rate [10,11]. Accordingly, a range of mechanistic models can reproduce subexponential growth dynamics before susceptible depletion sets in, including models with gradually declining contact rate over time [13] and spatially structured models such as household–community networks [12], regular lattice static contact networks or small-world networks with weak global coupling [13,14]. For real epidemics, however, the underlying mechanisms governing subexponential growth can be difficult to disentangle and hence to model [13].
Given the relatively common occurrence of subexponential growth dynamics in empirical data and the variety of mechanisms at play, a flexible phenomenological model has been proposed to reproduce a variety of growth profiles. In the generalized-growth model, a tuning parameter (called the deceleration of growth, p) can reproduce a range of dynamics from constant incidence (p = 0) to exponential growth (p = 1) [11]. Application of this generalized-growth model to empirical data supports a notably slow spread (p < 1) of the 2014 Ebola outbreaks at district level in parts of West Africa, intermediate spread profiles for historical plague and smallpox outbreaks (p = 0.8), and near exponential dynamics for pandemic influenza (p ≈ 1) [15]. Departure from standard epidemic theory may be more common than previously thought because transmission heterogeneities are the rule rather than the exception [11]. In this paper, we build on the generalized-growth model concept [11,13] to show that faithful characterization of such departures is important for accurate estimation of the reproduction number.
The basic reproduction number, commonly denoted by R0, is a key parameter that characterizes the early epidemic spread in a fully susceptible population, and can be used to inform public health authorities on the level of risk posed by an infectious disease and the potential effects of intervention strategies [16]. According to the classical theory of epidemics, largely based on compartmental modelling [1,2,17,18], R0 is expected to remain invariant during the early phase of an epidemic that grows exponentially and as long as susceptible depletion remains negligible [2]. More generally, temporal variation in the transmission potential of infectious diseases is monitored via the effective reproduction number, Rt, defined as the average number of secondary cases per primary case at calendar time t [19]. If Rt < 1, then the epidemic declines, whereas Rt > 1 indicates widespread transmission.
Here, we expand the generalized-growth method [11] to characterize and estimate the effective reproduction number Rt during the early growth phase and before susceptible depletion sets in. We illustrate our phenomenological approach, using a combination of analytical results and synthetic datasets derived from mechanistic models with spatial or temporal effects yielding subexponential growth, and apply the approach to empirical data reflecting a variety historic and contemporary outbreaks. We show that subexponential growth dynamics is both common and important for accurate assessment of the early transmission potential.
2. Material and methods
Our study is organized in four sections. First, we describe the phenomenological ‘generalized-growth’ model and the method to estimate the effective reproduction number in this model. Second, we simulate from this phenomenologic model to gauge the expected magnitude of temporal variation in reproduction number and test our analytical predictions. Third, we simulate epidemic datasets based on mechanistic transmission models that reproduce subexponential growth dynamics, and apply the generalized-growth estimation approach to these synthetic data. Fourth, we test a range of empirical outbreak datasets for presence of subexponential growth and estimation of the effective reproduction number.
2.1. The effective reproduction number during the early epidemic growth phase
We extend a previously established generalized-growth model [11] to estimate the effective reproduction number Rg according to disease generations g. Briefly, the generalized-growth model is a useful phenomenological model that relaxes the assumption of exponential growth in the early ascending phase of an outbreak, taking the form
| 2.1 |
where C′(t) describes the incidence at time t, the solution C(t) describes the cumulative number of cases at time t, r is a positive parameter denoting the growth rate (with units of (people)l − p per time), and  is a ‘deceleration of growth’ parameter (dimensionless). If p = 0, then this equation describes constant incidence over time and the cumulative number of cases grows linearly, whereas p = 1 describes exponential growth in the Malthus equation, and the solution is given by
  , where C0 is the initial number of cases. An equivalent approach to model subexponential growth would be to modulate the growth rate rather than the cumulative number of cases (see electronic supplementary material).
For the exponential growth model, the average number of secondary cases generated by initial cases during the first generation interval Tg (assumed to be fixed) is estimated by [20,21]
| 2.2 |
The expression for  depends only on r and Tg. Moreover, during the exponential growth phase,
  remains invariant at
  . This can be shown by analysing
  , the ratio of case incidences over consecutive generation intervals, which is given by
| 2.3 |
In the case of subexponential growth, i.e. when p < 1, we can characterize the effective reproduction number  over disease generations, g. For such polynomial epidemics, equation (2.1) exhibits an explicit solution that describes the cumulative number of cases over time, Csub exp(t), in the form of [22]
| 2.4 |
where  . Hence, the corresponding incidence equation is given by
| 2.5 |
The analytical expression for the effective reproduction number by disease generation,  , captures the ratio of case incidences over consecutive disease generations
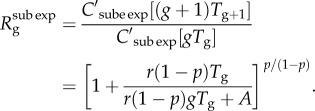 |
2.6 |
In contrast to the exponential growth model (p = 1), where  was independent of disease generation throughout the early growth phase, we observe that
  in generation g varies as a function of g. Given that A is fixed in equation (2.6), the ratio
  declines to zero as g increases, and, thus,
  approaches 1.0 asymptotically. Moreover,
  as p → 1− (see the electronic supplementary material).
2.2. Numerical estimation of the effective reproduction number
The effective reproduction number can be estimated from case incidence data simulated from the generalized-growth model and using information about the distribution of the disease generation interval (table 1). Specifically, based on the incidence at calendar time ti denoted by Ii, and the discretized probability distribution of the generation interval denoted by ρi, the effective reproduction number can be estimated using the renewal equation [19,36]
 |
2.7 |
where the denominator represents the total number of cases that contribute (as primary cases) to generating the number of new cases Ii (as secondary cases) at calendar time ti [19].
Table 1.
Summary of empirical disease datasets and our corresponding estimates of the reproduction number using four disease generations derived using the methodology described in the main text. FMD, foot-and-mouth disease.
| disease | outbreak | disease generation interval mean (s.d.)a | time-series temporal resolution | epidemic peak timing (no. data points) | early epidemic phase (no. data points) | reproduction number (95% CI) | data source |
|---|---|---|---|---|---|---|---|
| pandemic influenza | San Francisco (1918) | 3 (1) | days | 33 | 14 | 1.67 (1.43,2.08) | [15] |
| smallpox | Khulna, Bangladesh (1972) | 14 (2) | weeks | 10 | 7 | 1.97 (1.61,2.62) | [23] |
| plague | Bombay (1905–06) | 7 (2) | weeks | 19 | 7 | 1.37 (1.19,1.61) | [24] |
| measles | London (1948) | 14 (2) | weeks | 16 | 8 | 1.31 (1.26,1.36) | [25] |
| cholera | Aalborg (1853) | 5 (1) | days | 39 | 20 | 1.87 (1.64,2.23) | [26] |
| FMD | Uruguay (2001) | 5(1) | days | 33 | 10 | 1.77 (1.33,2.44) | [27,28] |
| HIV/AIDS | Japan (1985–2012) | 4 (1.4) | years | 24 | 16 | 1.40 (1.37,1.43) | [29] |
| NYC (1982–2002) | 4 (1.4) | years | 12 | 8 | 2.39 (2.37,2.44) | [30] | |
| Ebola | Uganda (2000) | 13.1 (6.6) | weeks | 8 | 7 | 1.65 (1.42,2.08) | [31,32] |
| Congo (1976) | 13.1 (6.6) | days | 22 | 16 | 3.79 (2.31,6.39) | [33,34] | |
| Gueckedou, Guinea (2014) | 19 (11) | weeks | 22 | 12 | 1.46 (1.24,1.90) | [35] | |
| Montserrado, Liberia (2014) | 13.1 (6.6) | weeks | 16 | 8 | 1.46 (1.24,1.93) | [35] | |
| Margibi, Liberia (2014) | 13.1 (6.6) | weeks | 14 | 8 | 1.99 (1.52,2.86) | [35] | |
| Bomi, Liberia (2014) | 13.1 (6.6) | weeks | 10 | 8 | 1.05 (1.00,1.20) | [35] | |
| Grand Bassa, Liberia (2014) | 13.1 (6.6) | weeks | 7 | 8 | 1.25 (1.03,1.64) | [35] | |
| Western Area Urban, Sierra Leone (2014) | 11.6 (5.6) | weeks | 18 | 8 | 1.26 (1.16,1.41) | [35] | |
| Western Area Rural, Sierra Leone (2014) | 11.6 (5.6) | weeks | 19 | 8 | 1.79 (1.50,2.26) | [35] | |
| Bo, Sierra Leone (2014) | 11.6 (5.6) | weeks | 15 | 8 | 1.50 (1.21,1.99) | [35] | |
| Bombali, Sierra Leone (2014) | 11.6 (5.6) | weeks | 12 | 7 | 1.94 (1.53,2.14) | [35] | |
| Kenema, Sierra Leone (2014) | 11.6 (5.6) | weeks | 12 | 7 | 1.24 (1.11,1.41) | [35] | |
| Port Loko, Sierra Leone (2014) | 11.6 (5.6) | weeks | 16 | 7 | 1.32 (1.18,1.50) | [35] |
aMean and s.d. for generation interval are given in days except for HIV/AIDS datasets given in years.
2.3. Trends in effective reproduction number based on simulations from the phenomenological ‘generalized growth’ model
To gauge the expected temporal variation in the effective reproduction number for a range of growth profiles and test analytic predictions, we simulate incidence data, using the generalized-growth model (equation (2.1)). We fix the growth rate parameter r, but assume different distributions of the disease generation interval (e.g. exponential, gamma, uniform, delta), and vary the ‘deceleration of growth’ parameter p between 0 and 1 [11]. We analyse the outbreak trajectory in the first five disease generations to estimate the effective reproduction number using equation (2.7) (assuming a fixed generation interval) and compare with estimates obtained from the analytical expressions in equations (2.3) and (2.6).
2.4. Trends in early growth dynamics based on mechanistic models simulations
Next, we develop three specific examples of mechanistic transmission models that support early subexponential growth dynamics. These include (i) SIR (susceptible–infectious–removed) dynamics on a spatially structured model, as substantial levels of clustering have been hypothesized to yield early polynomial epidemic growth [8,11,12], (ii) SIR compartmental model with reactive behavioural changes via a time-dependent transmission rate [10,11,31,37,38], and (iii) an SIR compartmental model with inhomogeneous mixing [39,40]. We briefly describe these models below.
2.4.1. Susceptible–infectious–removed epidemics on a spatially structured model
One of the putative mechanisms leading to early polynomial epidemic growth dynamics is clustering [8,11], a network property that quantifies the extent to which the contacts of one individual are also contacts of each other [14]. Contact networks are particularly useful to explore the impact of clustering; here, we use a network-based transmission model with household–community structure, which has been previously applied to study the transmission dynamics of Ebola [12,41]. In this model, individuals are organized within households of size H (each household contains H individuals) and households are organized within communities of size  households (each community contains
  individuals). Network connectivity is identical for every individual. The household reproduction number R0H was set at 2.0 and the community reproduction number R0c was set at 0.7 based on previous study [12]. For a fixed household size (H = 5) and different values of the community size parameter, we analyse the temporal profile in case incidence and the effective reproduction number during the first few disease generations from 200 independent stochastic realizations.
2.4.2. Susceptible–infectious–removed compartmental model with reactive behavioural changes
In addition to contact clustering, rapid onset of behaviour changes is another mechanism that has been hypothesized to lead to subexponential growth dynamics, as it would result in an early decline in effective reproduction number. For instance, during the 2014–2015 Ebola epidemic, some areas of West Africa exhibited early subexponential growth even before control interventions were put in place [10,42].
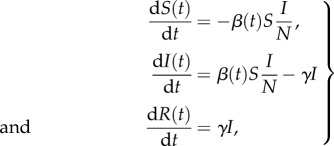
To model behaviour change, we consider a classical SIR epidemic model [1,3] with time-dependent contact rate following
 |
2.8 |
where S(t), I(t) and R(t) denote the number of susceptible, infectious and removed (recovered) hosts in a randomly mixed population of size N, β(t) is the time-dependent transmission rate, the probability that a susceptible individual encounters an infectious individual is given by I(t)/N and 1/γ is the mean infectious period.
In the classical SIR model with constant transmission rate β, in a completely susceptible population, S(0) ≈ N and I(t) grows exponentially during the early epidemic phase, e.g.  , where
  is the average number of secondary cases generated by a primary case during the infectious period. When susceptible depletion kicks in (S(t) <
S(0)), the effective reproduction number, Rt, declines following
  . During the first few disease generations, where
  , the classical SIR model supports a reproduction number that is nearly invariant, i.e. Rt ≈ R0. Here, to capture behaviour change, we model an exponential decline in the transmission rate β(t) from an initial value β0 towards ϕβ0 at rate q > 0 following
Here, β(t) leads to early subexponential growth dynamics whenever R0 > 1 and q > 0. Assuming that R0 > 1 in a sufficiently large susceptible population, so that the effect of susceptible depletion is negligible in the early epidemic phase, the quantity 1 − ϕ models the proportionate reduction in β0 that is needed for the effective reproduction number to asymptotically reach 1.0. Hence, ϕ can be estimated as 1/R0. If q = 0,  and we recover the classic SIR transmission model with early exponential growth dynamics. In general, a faster decline of the effective reproduction number towards 1.0 occurs for higher values of q, even without susceptible depletion. It is worth noting that prior HIV/AIDS models [43] have incorporated exponential decay in the transmission rate in a similar manner as described here, albeit the rate of decay was assumed to be a time-dependent function of HIV/AIDS prevalence.
To examine the behaviour of the effective reproduction number Rg over disease generations in the above model, we analyse the temporal progression in the number of cases at generation g based on the following discrete equations [44]
 |
2.9 |
where ϕ = 1/R0, Ig is the number of new cases at generation g and Sg is the number of remaining susceptibles at generation g. We initialize simulations with I0 = 1 and S0 = N where N is set to 108 individuals.
2.4.3. Susceptible–infectious–removed compartmental model with nonlinear incidences
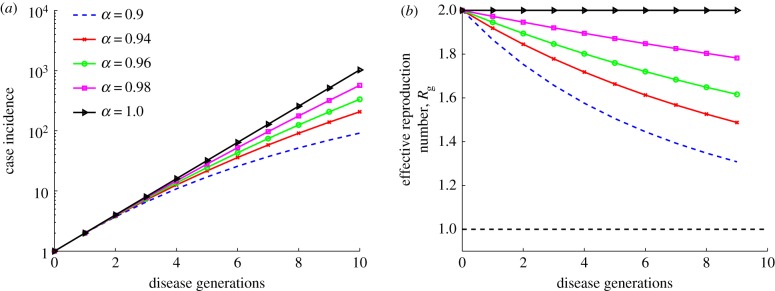
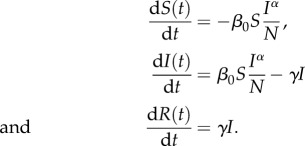
Beyond contact clustering and decay in transmission rate, a third mechanism potentially accounting for subexponential growth is departure from mass action which may owing to spatial structures or other forms of non-homogeneous mixing. These effects can be incorporated in the SIR models using nonlinear incidence rates [45,46]. For instance, the incidence rate can take the form:  where α is a phenomenological scaling mixing parameter; α = 1 models homogeneous mixing, whereas α < 1 reflects contact patterns that deviate from random mixing and lead to slower epidemic growth [47]. A related version of this model is the TSIR model [40], which has found applications in various infectious disease systems, including measles [40,48], rubella [49] and dengue [50].
Here, we consider an SIR model with non-homogeneous mixing, with constant transmission rate β0 and mixing parameter α, following
 |
2.10 |
To analyse the progression of the reproduction number Rg over disease generations in the above model, we use the following discrete equations describing the number of cases at generation g [13,44]
 |
2.11 |
where Ig is the number of new cases at generation g and Sg is the number of remaining susceptible individuals at generation g. We initialize simulations with I0 = 1 and S0 = N where N is set to 108 individuals.
2.5. Application to real outbreak data
Lastly, we analyse a variety of empirical outbreak datasets to test the importance of subexponential growth in observed disease dynamics and the resulting impact on the effective reproduction number estimates. We rely on a convenience sample representing a variety of pathogens, geographical contexts and time periods, and include outbreaks of pandemic influenza, measles, smallpox, bubonic plague, cholera, FMD, HIV/AIDS and Ebola (table 1 and electronic supplementary material for time series). The temporal resolution of the datasets varies from daily to annual. For each outbreak, the onset week corresponds to the first observation associated with a monotonic increase in the case incidence, up to the peak incidence.
We focus on the first three to five disease generations, depending on the length of the available empirical time series. We estimate the effective reproduction number, using the two-step approach. In the first step, we use nonlinear least-squares to fit the generalized growth model to the synthetic mechanistic data, and estimate parameters r and p (equation (2.1), [11]). The initial number of cases C0 is fixed according to the first observation. Nominal 95% CIs for parameter estimates r and p are constructed by simulations of 200 best-fit curves, C′(t), using parametric bootstrap with a Poisson error structure, as in prior studies [51]. In the second step, we simulate epidemic curves using the generalized-growth model with estimated r and p, and apply equation (2.7) to the simulated incidence data. We assume a gamma distribution for the generation interval, with means and standard deviations as in table 1 [52–58]. In addition, for each outbreak, we compare the goodness of fit of the phenomenological generalized-growth model versus the exponential growth models.
3. Results
3.1. Trends in effective reproduction number based on simulations from the phenomenological ‘generalized growth’ model
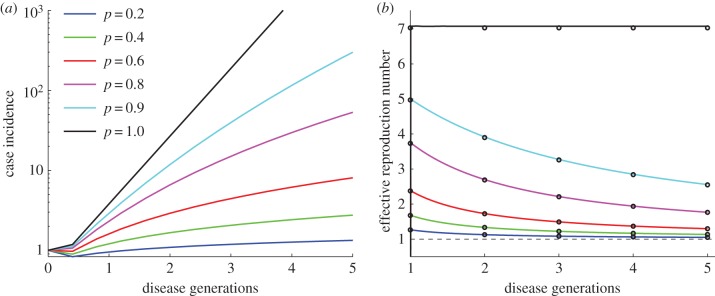
We first analyse simulations of epidemic growth under the generalized growth model in the first five disease generations of the outbreak, for different values of r and p and a fixed generation interval (figure 1 and electronic supplementary material, figure S2). Our simulations confirm the analytical results described in equations (2.3) and (2.6) in relation to changes in the effective reproduction number under early exponential (p = 1) and subexponential growth dynamics (p < 1). As expected, the greater the departure from exponential growth (p close to 0), the lower the effective reproduction number  . However, more importantly, in the case of subexponential growth, and for a given growth rate r, the effective reproduction number
  is a dynamic quantity that approaches 1.0 asymptotically with increasing disease generations. In contrast, for exponential growth (p = 1), the effective reproduction number remains invariant during the early epidemic growth phase.
Figure 1.
Simulated profiles of epidemic growth (a) and corresponding effective reproduction number (b) based on the generalized-growth model during the first five disease generation intervals. The parameter p is varied from 0.2 to 1.0, whereas the growth rate parameter r is fixed at 0.65 per day and C0 = 1. The length of the generation interval is assumed to be fixed at Tg = 3 days. When p = 1 (exponential growth), the reproduction number is constant at  . When p < 1 (subexponential growth) the reproduction number gradually declines over time and approaches 1.0 asymptotically. The black circles correspond to
  calculated using the analytical formula in equation (2.6), whereas the solid lines correspond to the estimates from numerical solutions based on renewal equation (2.7). (Online version in colour.)
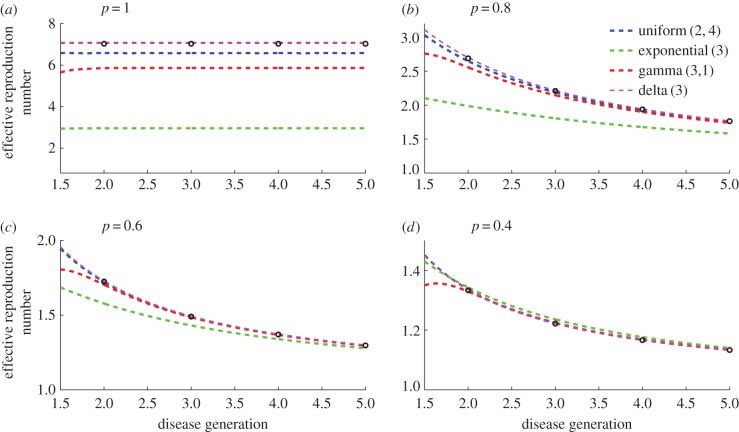
We also run simulations under different assumptions regarding the distribution of the generation interval and vary p in the range 0 < p ≤ 1 (figure 2). The declining trend in the effective reproduction number associated with the subexponential growth regime (p < 1) persists independently of the generation interval distribution. Moreover, as p decreases, estimates of the effective reproduction number become less dependent on the generation interval distribution (figure 2). This indicates that for a sufficiently small p < 1, the mean of the generation interval distribution provides sufficient information to estimate the reproduction number, without the need to specify a full distribution.
Figure 2.
Simulated profiles of the reproduction number during the first five disease generation intervals under the generalized-growth model, for different values of p. The parameter r is fixed at 0.65 per day and C0 = 1. Estimates of the reproduction number are numerically obtained using equation (2.7) assuming four different distributions for the generation interval: (a) uniform distribution in the range 2–4 days, (b) exponential distribution with the mean of 3 days, (c) gamma distribution with the mean of 3 days and variance of 1 day and (d) fixed generation interval at 3 days. When p = 1 (exponential growth), the reproduction number is invariant irrespective of the shape of the generation interval distribution and is given by  when the generation interval is exponentially distributed [20],
  when the generation interval is fixed [20], and
  when the generation interval follows a gamma distribution with the shape and scale parameters given by a = 9 and b = 1/3 [20], respectively. For p < 1 (subexponential growth), the effective reproduction number approaches 1.0 asymptotically over disease generations. The reproduction number
  at fixed generation intervals can be explicitly computed using equation (2.6) (black circles). (Online version in colour.)
3.2. Trends in case incidence and the effective reproduction number based on mechanistic models simulations
3.2.1. Susceptible–infectious–removed epidemics on a spatially structured epidemic model
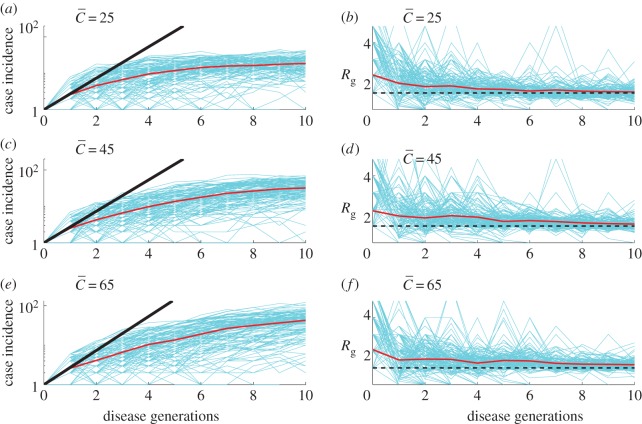
Figure 3 shows simulations of case incidence and the effective reproduction number Rg derived from the household–community transmission model for different levels of community mixing, tuned by  . As expected, the lower the community mixing, the greater the departure from homogeneous mixing, and hence the greater the departure from early exponential growth dynamics. Early subexponential growth dynamics are observed in all community mixing scenarios tested (
 , 45 and 65 households), which is consistent with a declining trend in the effective reproduction number Rg (figure 3).
Figure 3.
Simulations of case incidence (a,c,e) and the effective reproduction number Rg (b,d,f) for the first few consecutive disease generations, using a network-based transmission model with household–community structure [12,41] for different values of the community mixing parameter ( , 45 and 65 households) while keeping the household size H fixed at 5. The household reproduction number R0H was set at 2.0 and the community reproduction number R0c was set at 0.7 based on a previous Ebola mathematical modelling study [12]. Each simulation started with one infectious individual. Early subexponential growth dynamics are observed across all scenarios, which is consistent with a declining trend in the effective reproduction number Rg. For comparison with exponential growth dynamics, the dark solid line illustrates exponential growth in case incidence over disease generations with a fixed reproduction number of 2.7. The horizontal dashed line at Rg = 1.0 is shown for reference. (Online version in colour.)
3.2.2. Susceptible–infectious–removed compartmental model with reactive behavioural changes
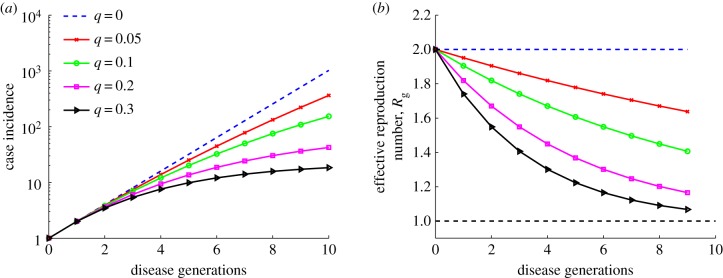
Representative profiles of Rg for the SIR model with time-dependent transmission rate β(t) are shown in figure 4 for different values of the speed of transmission decline, tuned by parameter q. The decline in effective reproduction number  (g = 0 … n) is more pronounced as the decline in transmission rate is faster (i.e.
  ). Early subexponential growth dynamics is seen in all simulations where q > 0 (figure 4).
Figure 4.
Simulations of case incidence (a) and the effective reproduction number Rg (b) for the first few consecutive disease generations, using model (2.9) for different values of the decline rate parameter q with R0 = 2 and a large population size (N = 108). Each simulation started with one infectious individual. When q = 1, exponential growth during the early epidemic phase is evident as a straight line fits well for several consecutive disease generations of the incidence curve in semi-logarithmic scale, and the effective reproduction number, Rg, remains invariant at 2. A concave down curve is indicative of subexponential growth with q > 0. The horizontal dashed line at Rg = 1.0 is shown for reference. (Online version in colour.)
3.2.3. Susceptible–infectious–removed compartmental model with nonlinear incidence rates
Simulations for this model display concave down incidence curves in semi-logarithmic scale, supporting the presence of early subexponential growth, even for values of α slightly below the homogeneous mixing regime (i.e. α just below 1; electronic supplementary material, figure S3). Accordingly, the effective reproduction number Rg exhibits a declining trend during the first few disease generations (figure 5). By contrast, the reproduction number remains invariant at Rg = R0 = 2 when α = 1 (figure 5b, black curve).
Figure 5.
Simulations of case incidence (a) and the effective reproduction number Rg (b) for the first few consecutive disease generations, using model (2.11) for different values of scaling parameter α, with R0 = 2, γ = 1/5, and a large population size (N = 108). Each simulation started with one infectious individual. When α = 1, exponential growth during the early epidemic phase is evident as a straight line fits well for several consecutive disease generations of the incidence curve, and the effective reproduction number, Rg, remains invariant at 2. The horizontal dashed line at Rg = 1.0 is shown for reference. (Online version in colour.)
3.3. Application to real outbreak data
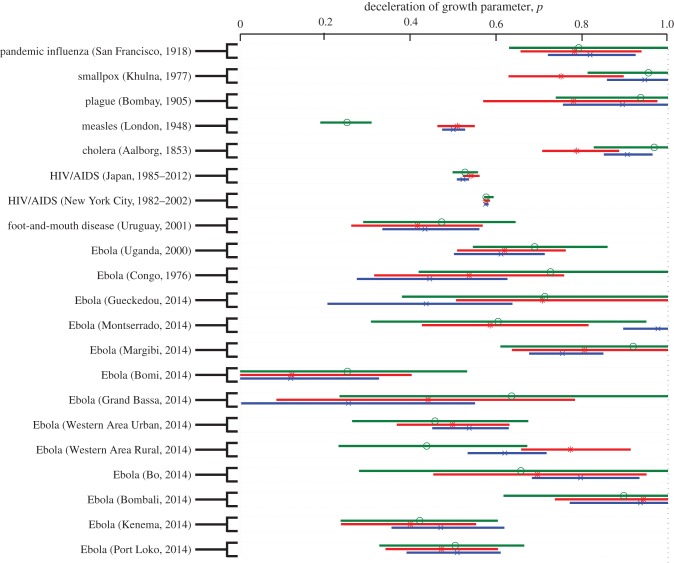
Lastly, we apply the concepts of subexponential growth dynamics to a variety of empirical outbreak datasets. The electronic supplementary material, figures S4–S5, provides a comparative analysis of the goodness of fit provided by the generalized growth and the exponential growth models across outbreaks. Our results indicate that the generalized-growth model consistently outperforms the exponential growth model in the early ascending phase of the outbreak, even when p is only slightly below 1.0 (i.e. departure from the exponential model is slight). Across outbreaks, we find variability in the deceleration of growth parameter, even for a given pathogen (median p = 0.57, interquartile range (IQR): 0.46–0.84; figure 6). Not surprisingly, parameter uncertainty declines with increasing length of the early epidemic phase used for estimation (figures 6 and 7). On the other hand, mean estimates of p (table 1) are stable during the first three to five disease generations (ANOVA, p = 0.9).
Figure 6.
Estimates of the deceleration of growth parameter and the corresponding 95% CIs derived from various infectious disease outbreak datasets of case incidence series by fitting the generalized-growth model to the initial epidemic phase comprising of approximately the first three (green), four (blue) and five (red) disease generation intervals. (Online version in colour.)
Figure 7.
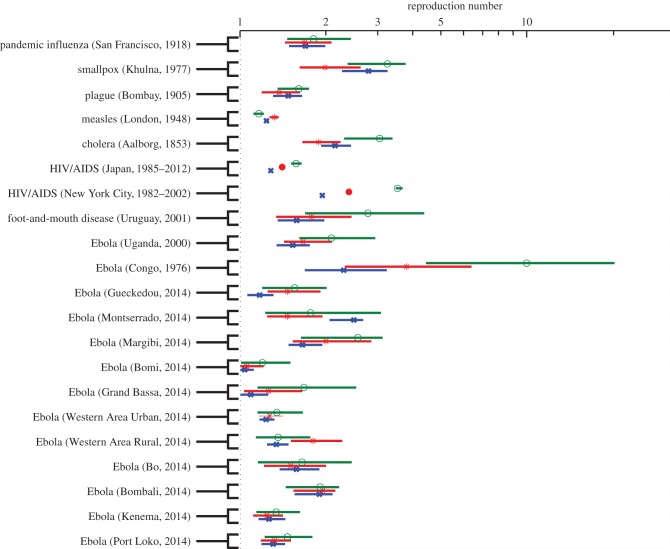
Estimates of the effective reproduction number and the corresponding 95% CIs derived from various infectious disease outbreak datasets of case incidence series by fitting the generalized-growth model to the initial epidemic phase comprising of approximately the first three (green), four (blue) and five (red) disease generation intervals. The generation interval is assumed to follow a gamma distribution with the corresponding mean and variance provided in table 1. (Online version in colour.)
When we use the generalized-growth model to estimate the effective reproduction number, we find a declining trend in the effective reproduction number with increasing disease generation intervals and variability in estimates of the reproduction number across 21 outbreaks representing eight different pathogens (figure 7). Further, estimates of the effective reproduction number are sensitive to small changes in the deceleration of growth parameter across outbreaks (Spearman's ρ > 0.62, p < 0.002; electronic supplementary material, figure S6).
Model fits to empirical data illustrates a variety of exponential and subexponential growth profiles across pathogens (electronic supplementary material, figures S7–S11). For instance, the autumn 1918 influenza pandemic in San Francisco is characterized by near exponential growth, with p ∼ 0.8–0.9 and a relatively stable reproduction number in the range 1.7–1.8 (electronic supplementary material, figure S7). In contrast, the FMD outbreak in Uruguay at the farm level displays slower initial growth with mean p ∼ 0.4–0.5 and a more variable reproduction number in the range 1.6–2.8 (electronic supplementary material, figure S8). For the HIV/AIDS epidemic in Japan (1985–2012), we estimated the mean effective reproduction number in the range 1.3–1.6 with p ∼ 0.5 assuming a mean generation interval of 4 years, consistent with pronounced departure from exponential growth (electronic supplementary material, figure S9).
The wealth of district-level Ebola data available for the 2014 epidemic in West Africa provides a good opportunity to gauge geographical variations in the growth profiles, and in the resulting effective reproduction numbers. Indeed, we find variability across geographical locations in the effective reproduction number (median = 1.46, IQR: 1.26–1.83) and deceleration parameter p (median = 0.58, IQR: 0.46–0.72), and correlation between these parameter estimates (Spearman's ρ = 0.81, p < 0.001). For comparison, at the fifth disease generation interval, the highest estimate of the effective reproduction number was at 2.5 (95% CI: 2.0–2.7) for the 2014 Ebola outbreak in Montserrado, Liberia, whereas the lowest estimate was at 1.03 (95% CI: 1–1.1) for the outbreak in Bomi, Liberia (figure 7).
4. Discussion
In this study, we introduce a quantitative ‘generalized growth’ framework to characterize the transmission potential of pathogens in the early phase of an outbreak, when susceptible depletion remains negligible, without making explicit assumptions about the epidemic growth profile. The phenomenological ‘generalized growth’ model reproduces a range of growth dynamics from polynomial to exponential [11] and is agnostic of the mechanisms affecting growth, which may include contact patterns, spatial effects, non-homogeneous mixing and/or behaviour changes. A phenomenological model can be particularly useful when biological mechanisms are difficult to identify. Using a combination of analytical results, simulations from mechanistic models and analyses of empirical outbreak data, we demonstrate that the effective reproduction number typically displays a downward trend within the first three to five disease generations. Evidence of subexponential growth, and associated reproduction number decline, is found in disease systems as varied as Ebola, pandemic influenza, smallpox, plague, cholera, measles, FMD and HIV/AIDS. Our results indicate that the concept of subexponential growth is both widespread and important to consider for accurate assessment of the reproduction number.
For epidemics that truly depart from exponential growth theory, traditional estimation methods relying on the assumption of exponential growth are expected to inflate reproduction number estimates. The bias between theoretical values and estimates increases as departure from exponential growth becomes more pronounced, i.e. when p decreases towards 0, representing slower epidemic spread compared with the exponential case where p = 1. For instance, our estimate of the reproduction number for the 1972 smallpox epidemic in Khulna, Bangladesh (approx. 2 (95% CI: 1.6–2.6)) is significantly lower than earlier historic estimates of smallpox based on an exponential growth assumption (range 3.5–6.0) [59]. In contrast, when p is near 1.0, indicating near exponential growth, our estimates of the reproduction number remain consistent with those of compartmental models. This is the case for the 1905 bubonic plague epidemic in Bombay, India [60], or the 1918 influenza pandemic in San Francisco [15]. Overall, our estimates for Ebola outbreaks tend to be slightly lower than those reported in prior studies, possibly because of subexponential growth at the district levels [12,31,55,61–66]. It is also worth noting that the incorporation of generalized growth in a phenomenological logistic-type model can substantially increase the performance of the model for short-term forecasting and prediction of the final epidemic size as recently illustrated in the context of the Zika epidemic in Colombia [67].
Here, we have studied simulations from three common types of mechanistic models supporting early subexponential growth dynamics and incorporating characteristics of the host contact network, behaviour changes and inhomogeneous mixing. In all models, relatively small departures from crude SIR dynamics led to subexponential growth profiles, and in turn a quick decline in effective reproduction number, speaking to the generalizability of our findings. With real outbreak case series data, however, it can be difficult to disentangle the mechanism or combination of mechanisms shaping the early epidemic growth profile, especially when case series data are limited to the early epidemic growth phase. In order to assess the contribution of different mechanisms, independent sources of data would be required to quantify the structural characteristics of the contact network [68–70], or the timing and intensity of possible behaviour changes. Further, for comparison purposes, it can be particularly useful to enumerate secondary cases from transmission tree data whenever available, and obtain independent estimates of R0 [68–70] agnostic of any model form. There is clearly scope for more research work in this area. In the absence of detailed information on the chains of transmission or the biological mechanisms at play however, a phenomenological approach such as that proposed here with the generalized-growth model may be preferable.
In addition to providing a quantitative framework for estimation of the reproduction number based on a phenomenological approach, this study has implications for disease control, particularly our understanding of herd immunity and extinction thresholds [1,2]. In the simple SIR models, the critical fraction of the population needed to be effectively vaccinated to prevent an epidemic is given by 1−1/R0, which is in the range 50–90% of the population for most epidemic diseases [1,66]. However, this fraction may be potentially considerably lower for epidemics rendering subexponential growth, where the effective reproduction number naturally declines towards unity, irrespective of other intervention measures and before susceptible depletion sets in. For example, the 2014 West African Ebola outbreak ended with less than 1% of the population registered as cases, which defies expectations from SIR models, and the contribution of large-scale interventions on these low attack rates remains debated [71]. These data-driven observations suggest that more attention should be paid to the shape of the early ascending phase of emerging infectious diseases outbreaks, and the associated uncertainty in the reproduction number estimates should be considered.
A related consequence of subexponential growth dynamics, and associated decline in effective reproduction number, is the effect on the extinction threshold. Indeed, it is natural to expect a higher probability of extinction owing to stochastic effects for epidemics governed by subexponential growth. This may in part explain the small magnitude and a short duration of most Ebola outbreaks since 1976 [72–74], as Ebola showed substantial departure from exponential growth (0.6 < p < 0.72). In fact, simulations using an individual-level stochastic model for Ebola with household and community contact network structure are consistent with early subexponential growth dynamics, and has a probability of approximately 40% of spontaneous die-out of an outbreak within the first month of transmission [12]. This model [12] is also consistent with an effective reproduction number that asymptotically declines towards unity as the virus spreads through the population. From a public health perspective, outbreaks characterized by subexponential growth dynamics may provide a greater window of opportunity for implementation of control interventions compared with those following exponential or near exponential growth dynamics [12].
Overall, our results underscore the need to carefully characterize the shape of the epidemic growth phase in order to accurately assess early trends in reproduction number. Consideration of the subexponential growth phenomenon will improve our ability to appropriately model transmission scenarios, assess the potential effects of control interventions, and provide accurate forecasts of epidemic impact. Looking to the future, the development of new mechanistic transmission models is needed to provide a better understanding of the factors shaping early epidemic growth. Such models would allow for systematic evaluation of epidemic outcomes and disease control policies. A recent review of forecasting models for the West African Ebola epidemic highlighted a range of approaches to investigating disease spread from simple phenomenological models, to compartmental epidemic models, to intricate contact networks [75]. The vast majority of these approaches considered early exponential growth dynamics, an assumption that led to substantial overestimation of Ebola epidemic size and peak timing and intensity. In the light of these findings, Chretien et al. [75] stress the need for new mechanistic models that incorporate ‘dampening approaches’ to improve characterization of the force of infection and provide uniform forecasting approaches and evaluation metrics. We believe this study represents a significant step in this direction.
Supplementary Material
Supplementary Material
Data accessibility
All of the epidemic incidence data employed in this paper are being made publicly available in the electronic supplementary material.
Authors' contributions
G.C. designed the study. G.C. and S.M. contributed to methods. G.C. carried out simulations, analysed the data and wrote the first draft of the manuscript. G.C., C.V., L.S. and S.M. contributed to the writing and revisions of the manuscript, and approved its final version.
Competing interests
We have no competing interests.
Funding
G.C. acknowledges financial support from the NSF grant no. 1414374 as part of the joint NSF-NIH-USDA Ecology and Evolution of Infectious Diseases programme; UK Biotechnology and Biological Sciences Research Council grant no. BB/M008894/1, NSF-IIS RAPID award no. 1518939 and NSF grant no. 1318788 III: Small: Data Management for Real-Time Data-Driven Epidemic simulation, and the Division of International Epidemiology and Population Studies, The Fogarty International Center, US National Institutes of Health. C.V. and L.S. acknowledges financial support from the RAPIDD Programme of the Science and Technology Directorate and the Division of International Epidemiology and Population Studies, The Fogarty International Center, US National Institutes of Health. L.S. also acknowledges generous support from an EC Marie Curie Horizon 2020 fellowship. S.M. acknowledges the support from the Natural Sciences and Engineering Research Council of Canada (NSERC), and the Mathematics of Information Technology and Complex Systems (Mitacs).
References
- 1.Anderson RM, May RM. 1991. Infectious diseases of humans. Oxford, UK: Oxford University Press. [Google Scholar]
- 2.Diekmann O, Heesterbeek J. 2000. Mathematical epidemiology of infectious diseases: model building, analysis and interpretation. London, UK: Wiley. [Google Scholar]
- 3.Kermack WO, McKendrick AG. 1937. Contributions to the mathematical theory of epidemics. IV. Analysis of experimental epidemics of the virus disease mouse ectromelia. J. Hyg. 37, 172–187. ( 10.1017/S0022172400034902) [DOI] [PMC free article] [PubMed] [Google Scholar]
- 4.Ross R. 1911. The prevention of malaria. London, UK: John Murray. [Google Scholar]
- 5.Mollison D. 1995. Epidemic models: their structure and relation to data. Cambridge, UK: Cambridge University Press. [Google Scholar]
- 6.Bailey NTJ. 1975. The mathematical theory of infectious disease and its applications. New York, NY: Hafner. [Google Scholar]
- 7.Colgate SA, Stanley EA, Hyman JM, Layne SP, Qualls C. 1989. Risk behavior-based model of the cubic growth of acquired immunodeficiency syndrome in the United States. Proc. Natl Acad. Sci. USA 86, 4793–4797. ( 10.1073/pnas.86.12.4793) [DOI] [PMC free article] [PubMed] [Google Scholar]
- 8.Szendroi B, Csányi G. 2004. Polynomial epidemics and clustering in contact networks. Proc. R. Soc. Lond. B 271, S364–S366. ( 10.1098/rsbl.2004.0188) [DOI] [PMC free article] [PubMed] [Google Scholar]
- 9.May RM, Anderson RM. 1987. Transmission dynamics of HIV infection: Nature 326, 137–142. ( 10.1038/326137a0) [DOI] [PubMed] [Google Scholar]
- 10.Chowell G, Viboud C, Hyman JM, Simonsen L. 2015. The Western Africa Ebola virus disease epidemic exhibits both global exponential and local polynomial growth rates. PLoS Curr. 7 ( 10.1371/currents.outbreaks.8b55f4bad99ac5c5db3663e916803261) [DOI] [PMC free article] [PubMed] [Google Scholar]
- 11.Viboud C, Simonsen L, Chowell G. 2016. A generalized-growth model to characterize the early ascending phase of infectious disease outbreaks. Epidemics 15, 27–37. ( 10.1016/j.epidem.2016.01.002) [DOI] [PMC free article] [PubMed] [Google Scholar]
- 12.Kiskowski M, Chowell G. 2015. Modeling household and community transmission of Ebola virus disease: epidemic growth, spatial dynamics and insights for epidemic control. Virulence 7, 63–73. ( 10.1080/21505594.2015.1076613) [DOI] [PMC free article] [PubMed] [Google Scholar]
- 13.Chowell G, Sattenspiel L, Bansal S, Viboud C. In press. Mathematical models to characterize early epidemic growth: a review. Phys. Life Rev. ( 10.1016/j.plrev.2016.07.005) [DOI] [PMC free article] [PubMed] [Google Scholar]
- 14.Watts DJ, Strogatz SH. 1998. Collective dynamics of ‘small-world’ networks. Nature 393, 440–442. ( 10.1038/30918) [DOI] [PubMed] [Google Scholar]
- 15.Chowell G, Nishiura H, Bettencourt LM. 2007. Comparative estimation of the reproduction number for pandemic influenza from daily case notification data. J. R. Soc. Interface 4, 155–166. ( 10.1098/rsif.2006.0161) [DOI] [PMC free article] [PubMed] [Google Scholar]
- 16.Anderson RM, May RM. 1982. Directly transmitted infections diseases: control by vaccination. Science 215, 1053–1060. ( 10.1126/science.7063839) [DOI] [PubMed] [Google Scholar]
- 17.van den Driessche P, Watmough J. 2002. Reproduction numbers and sub-threshold endemic equilibria for compartmental models of disease transmission. Math. Biosci. 180, 29–48. ( 10.1016/S0025-5564(02)00108-6) [DOI] [PubMed] [Google Scholar]
- 18.Diekmann O, Heesterbeek JA, Roberts MG. 2010. The construction of next-generation matrices for compartmental epidemic models. J. R. Soc. Interface 7, 873–885. ( 10.1098/rsif.2009.0386) [DOI] [PMC free article] [PubMed] [Google Scholar]
- 19.Nishiura H, Chowell G. 2009. The effective reproduction number as a prelude to statistical estimation of time-dependent epidemic trends. In Mathematical and statistical estimation approaches in epidemiology (eds Chowell G, Hyman JM, Bettencourt LMA, Castillo-Chavez C), pp. 103–121. Amsterdam, The Netherlands: Springer. [Google Scholar]
- 20.Wallinga J, Lipsitch M. 2007. How generation intervals shape the relationship between growth rates and reproductive numbers. Proc. R. Soc. B 274, 599–604. ( 10.1098/rspb.2006.3754) [DOI] [PMC free article] [PubMed] [Google Scholar]
- 21.Roberts MG, Heesterbeek JA. 2007. Model-consistent estimation of the basic reproduction number from the incidence of an emerging infection. J. Math. Biol. 55, 803–816. ( 10.1007/s00285-007-0112-8) [DOI] [PMC free article] [PubMed] [Google Scholar]
- 22.Tolle J. 2003. Can growth be faster than exponential, and just how slow is the logarithm? Math. Gazette 87, 522–525. ( 10.1017/S0025557200173802) [DOI] [Google Scholar]
- 23.Sommer A. 1974. The 1972 smallpox outbreak in Khulna Municipality, Bangladesh. II. Effectiveness of surveillance and containment in urban epidemic control. Am. J. Epidemiol. 99, 303–313. [DOI] [PubMed] [Google Scholar]
- 24.1907. XXII. Epidemiological observations in Bombay city. J. Hyg. 7, 724–798. ( 10.1017/S0022172400033684) [DOI] [PMC free article] [PubMed] [Google Scholar]
- 25. Measles time-series data. Professor Ben Bolker's Personal data repository at McMaster University. See https://ms.mcmaster.ca/~bolker/measdata.html. (accessed 27 September 2016).
- 26.Det Kongelige Sundhedskollegiums Aarsberetning for 1853. Uddrag fra Aalborg Physikat. See http://docplayer.dk/11876516-Uddrag-af-det-kongelige-sundhedskollegiums-aarsberetning-for-1853.html (accessed 27 September 2016). [Google Scholar]
- 27.Chowell G, Rivas AL, Smith SD, Hyman JM. 2006. Identification of case clusters and counties with high infective connectivity in the 2001 epidemic of foot-and-mouth disease in Uruguay. Am. J. Vet. Res. 67, 102–113. ( 10.2460/ajvr.67.1.102) [DOI] [PubMed] [Google Scholar]
- 28.Chowell G, Rivas AL, Hengartner NW, Hyman JM, Castillo-Chavez C. 2006. The role of spatial mixing in the spread of foot-and-mouth disease. Prev. Vet. Med. 73, 297–314. ( 10.1016/j.prevetmed.2005.10.002) [DOI] [PubMed] [Google Scholar]
- 29.HIV/AIDS in Japan. 2013. Infectious agents surveillance report (IASR). Month vol. 35, No. 9 (No. 415).
- 30. CDC Wonder – AIDS Public Information Dataset U.S. Surveillance. See http://wonder.cdc.gov/aidsPublic.html. (accessed 27 September 2016).
- 31.Chowell G, Hengartner NW, Castillo-Chavez C, Fenimore PW, Hyman JM. 2004. The basic reproductive number of Ebola and the effects of public health measures: the cases of Congo and Uganda. J. Theor. Biol. 229, 119–126. ( 10.1016/j.jtbi.2004.03.006). [DOI] [PubMed] [Google Scholar]
- 32.WHO. 2001. World Health Organization (WHO), 2001. Outbreak of Ebola hemorrhagic fever, Uganda, August 2000–January 2001. Epidemiol. Rec. 76, 41–48. [PubMed] [Google Scholar]
- 33.Breman JG, et al. 1978. The epidemiology of Ebola hemorrhagic fever in Zaire, 1976. Ebola Virus Haemorrhagic Fever 103–124 [Google Scholar]
- 34.Camacho A, Kucharski AJ, Funk S, Breman J, Piot P, Edmunds WJ. 2014. Potential for large outbreaks of Ebola virus disease. Epidemics 9, 70–78. ( 10.1016/j.epidem.2014.09.003) [DOI] [PMC free article] [PubMed] [Google Scholar]
- 35.2015. Ebola response roadmap – Situation report – 14 October 2015. See http://apps.who.int/ebola/current-situation/ebola-situation-report-14-october-2015. (accessed 17 October 2015).
- 36.Fraser C. 2007. Estimating individual and household reproduction numbers in an emerging epidemic. PloS ONE 2, e758 ( 10.1371/journal.pone.0000758) [DOI] [PMC free article] [PubMed] [Google Scholar]
- 37.Barbarossa MV, Denes A, Kiss G, Nakata Y, Rost G, Vizi Z. 2015. Transmission dynamics and final epidemic size of Ebola virus disease outbreaks with varying interventions. PloS ONE 10, e0131398 ( 10.1371/journal.pone.0131398) [DOI] [PMC free article] [PubMed] [Google Scholar]
- 38.Drake JM, Kaul RB, Alexander LW, O'Regan SM, Kramer AM, Pulliam JT, Ferrari MJ, Park AW. 2015. Ebola cases and health system demand in Liberia. PloS Biol. 13, e1002056 ( 10.1371/journal.pbio.1002056) [DOI] [PMC free article] [PubMed] [Google Scholar]
- 39.Finkenstädt BF, Grenfell BT. 2000. Time series modelling of childhood diseases: a dynamical systems approach. Appl. Stat. 49, 187–205. ( 10.1111/1467-9876.00187) [DOI] [Google Scholar]
- 40.Grenfell BT, Bjornstad ON, Finkenstadt BF. 2002. Dynamics of measles epidemics: scaling noise, determinism, and predictability with the TSIR model. Ecol. Monogr. 72, 185–202. ( 10.1890/0012-9615(2002)072%5B0185:DOMESN%5D2.0.CO;2) [DOI] [Google Scholar]
- 41.Kiskowski M. 2014. Three-scale network model for the early growth dynamics of 2014 West Africa Ebola epidemic. PLoS Curr. Outbreaks. ( 10.1371/currents.outbreaks.c6efe8274dc55274f05cbcb62bbe6070) [DOI] [PMC free article] [PubMed] [Google Scholar]
- 42.Fenichel EP, et al. 2011. Adaptive human behavior in epidemiological models. Proc. Natl Acad. Sci. USA 108, 6306–6311. ( 10.1073/pnas.1011250108) [DOI] [PMC free article] [PubMed] [Google Scholar]
- 43.Granich RM, Gilks CF, Dye C, De Cock KM, Williams BG. 2009. Universal voluntary HIV testing with immediate antiretroviral therapy as a strategy for elimination of HIV transmission: a mathematical model. Lancet 373, 48–57. ( 10.1016/S0140-6736(08)61697-9) [DOI] [PubMed] [Google Scholar]
- 44.Becker NG. 2015. Modeling to inform infectious disease control. Boca Raton, FL: Chapman and Hall/CRC. [Google Scholar]
- 45.Liu WM, Hethcote HW, Levin SA. 1987. Dynamical behavior of epidemiological models with nonlinear incidence rates. J. Math. Biol. 25, 359–380. ( 10.1007/BF00277162) [DOI] [PubMed] [Google Scholar]
- 46.Liu WM, Levin SA, Iwasa Y. 1986. Influence of nonlinear incidence rates upon the behavior of SIRS epidemiological models. J. Math. Biol. 23, 187–204. ( 10.1007/BF00276956) [DOI] [PubMed] [Google Scholar]
- 47.Severo N. 1969. Generalizations of some stochastic epidemic models. Math. Biosci. 4, 395–402. ( 10.1016/0025-5564(69)90019-4) [DOI] [Google Scholar]
- 48.Ferrari MJ, Grais RF, Bharti N, Conlan AJ, Bjornstad ON, Wolfson LJ, Guerin PJ, Djibo A, Grenfell BT. 2008. The dynamics of measles in sub-Saharan Africa. Nature 451, 679–684. ( 10.1038/nature06509) [DOI] [PubMed] [Google Scholar]
- 49.Metcalf CJ, Munayco CV, Chowell G, Grenfell BT, Bjornstad ON. 2010. Rubella metapopulation dynamics and importance of spatial coupling to the risk of congenital rubella syndrome in Peru. J. R. Soc. Interface 8, 369–376. ( 10.1098/rsif.2010.0320) [DOI] [PMC free article] [PubMed] [Google Scholar]
- 50.Kraemer MU, Perkins TA, Cummings DA, Zakar R, Hay SI, Smith DL, Reiner RC Jr. 2015. Big city, small world: density, contact rates, and transmission of dengue across Pakistan. J. R. Soc. Interface 12, 20150468 ( 10.1098/rsif.2015.0468) [DOI] [PMC free article] [PubMed] [Google Scholar]
- 51.Chowell G, Ammon CE, Hengartner NW, Hyman JM. 2006. Transmission dynamics of the great influenza pandemic of 1918 in Geneva, Switzerland: assessing the effects of hypothetical interventions. J. Theor. Biol. 241, 193–204. ( 10.1016/j.jtbi.2005.11.026) [DOI] [PubMed] [Google Scholar]
- 52.Carrat F, Vergu E, Ferguson NM, Lemaitre M, Cauchemez S, Leach S, Valleron AJ. 2008. Time lines of infection and disease in human influenza: a review of volunteer challenge studies. Am. J. Epidemiol. 167, 775–785. ( 10.1093/aje/kwm375) [DOI] [PubMed] [Google Scholar]
- 53.Fine PE. 2003. The interval between successive cases of an infectious disease. Am. J. Epidemiol. 158, 1039–1047. ( 10.1093/aje/kwg251) [DOI] [PubMed] [Google Scholar]
- 54.Halloran ME, Longini IM Jr, Nizam A, Yang Y. 2002. Containing bioterrorist smallpox. Science 298, 1428–1432. ( 10.1126/science.1074674) [DOI] [PubMed] [Google Scholar]
- 55.Team W.H.O.E.R. 2014. Ebola virus disease in west africa—the first 9 months of the epidemic and forward projections. N. Engl. J. Med. 371, 1481–1495. ( 10.1056/NEJMoa1411100) [DOI] [PMC free article] [PubMed] [Google Scholar]
- 56.Gani R, Leach S. 2004. Epidemiologic determinants for modeling pneumonic plague outbreaks. Emerg. Infect. Dis. 10, 608–614. ( 10.3201/eid1004.030509) [DOI] [PMC free article] [PubMed] [Google Scholar]
- 57.Burrows R. 1968. Excretion of foot-and-mouth disease virus prior to development of lesions. Vet. Rec. 82, 387. [Google Scholar]
- 58.Nishiura H. 2010. Correcting the actual reproduction number: a simple method to estimate R0 from early epidemic growth data. Int. J. Environ. Res. Public Health 7, 291–302. ( 10.3390/ijerph7010291) [DOI] [PMC free article] [PubMed] [Google Scholar]
- 59.Gani R, Leach S. 2001. Transmission potential of smallpox in contemporary populations. Nature 414, 748–751. ( 10.1038/414748a) [DOI] [PubMed] [Google Scholar]
- 60.Bacaer N. 2012. The model of Kermack and McKendrick for the plague epidemic in Bombay and the type reproduction number with seasonality. J. Math. Biol. 64, 403–422. ( 10.1007/s00285-011-0417-5) [DOI] [PubMed] [Google Scholar]
- 61.Althaus CL. 2014. Estimating the reproduction number of Zaire Ebolavirus (EBOV) during the 2014 outbreak in West Africa. PLoS Curr. Outbreaks. ( 10.1371/currents.outbreaks.91afb5e0f279e7f29e7056095255b288) [DOI] [PMC free article] [PubMed] [Google Scholar]
- 62.Nishiura H, Chowell G. 2014. Early transmission dynamics of Ebola virus disease (EVD), West Africa, March to August 2014. Euro Surveill. 19. [DOI] [PubMed] [Google Scholar]
- 63.Towers S, Patterson-Lomba O, Castillo-Chavez C. 2014. Temporal variations in the effective reproduction number of the 2014 West Africa Ebola outbreak. PLoS Curr. Outbreaks. ( 10.1371/currents.outbreaks9e4c4294ec8ce1adad283172b16bc908) [DOI] [PMC free article] [PubMed] [Google Scholar]
- 64.Lewnard JA, Ndeffo Mbah ML, Alfaro-Murillo JA, Altice FL, Bawo L, Nyenswah TG, Galvani AP. 2014. Dynamics and control of Ebola virus transmission in Montserrado, Liberia: a mathematical modelling analysis. Lancet. Infect. Dis. 14, 1189–1195. ( 10.1016/S1473-3099(14)70995-8) [DOI] [PMC free article] [PubMed] [Google Scholar]
- 65.Yamin D, Gertler S, Ndeffo-Mbah ML, Skrip LA, Fallah M, Nyenswah TG, Altice FL, Galvani AP. 2014. Effect of Ebola progression on transmission and control in Liberia. Ann. Intern. Med. 162, 11 ( 10.7326/M14-2255) [DOI] [PMC free article] [PubMed] [Google Scholar]
- 66.Pandey A, Atkins KE, Medlock J, Wenzel N, Townsend JP, Childs JE, Nyenswah TG, Ndeffo-Mbah ML, Galvani AP. 2014. Strategies for containing Ebola in West Africa. Science 346, 991–995. ( 10.1126/science.1260612) [DOI] [PMC free article] [PubMed] [Google Scholar]
- 67.Chowell G, et al. 2016. Using phenomenological models to characterize transmissibility and forecast patterns and final burden of Zika epidemics. PLoS Curr. Outbreaks. ( 10.1371/currents.outbreaks.f14b2217c902f453d9320a43a35b9583.) [DOI] [PMC free article] [PubMed] [Google Scholar]
- 68.Cleaton JM, Viboud C, Simonsen L, Hurtado AM, Chowell G. 2015. Characterizing Ebola transmission patterns based on internet news reports. Clin. Infect. Dis. 62, 24–31. ( 10.1093/cid/civ748) [DOI] [PMC free article] [PubMed] [Google Scholar]
- 69.Chowell G, Abdirizak F, Lee S, Lee J, Jung E, Nishiura H, Viboud C. 2015. Transmission characteristics of MERS and SARS in the healthcare setting: a comparative study. BMC Med. 13, 210 ( 10.1186/s12916-015-0450-0) [DOI] [PMC free article] [PubMed] [Google Scholar]
- 70.Maganga GD, et al. 2014. Ebola virus disease in the Democratic Republic of Congo. N. Engl. J. Med. 371, 2083–2091. ( 10.1056/NEJMoa1411099) [DOI] [PubMed] [Google Scholar]
- 71.Meltzer MI, Atkins CY, Santibanez S, Knust B, Petersen BW, Ervin ED, Nichol ST, Damon IK, Washington ML. 2014. Estimating the future number of cases in the Ebola epidemic: Liberia and Sierra Leone, 2014–2015. Morbid. Mortal. Wkly Rep. Surveill. Summaries 63, 1–14. [PubMed] [Google Scholar]
- 72.House T. 2014. Epidemiological dynamics of Ebola outbreaks. eLife 3, e03908 ( 10.7554/eLife.03908) [DOI] [PMC free article] [PubMed] [Google Scholar]
- 73.Althaus CL. 2015. Rapid drop in the reproduction number during the Ebola outbreak in the Democratic Republic of Congo. PeerJ 3, e1418 ( 10.7717/peerj.1418) [DOI] [PMC free article] [PubMed] [Google Scholar]
- 74.Ajelli M, Parlamento S, Bome D, Kebbi A, Atzori A, Frasson C, Putoto G, Carraro D, Merler S. 2015. The 2014 Ebola virus disease outbreak in Pujehun, Sierra Leone: epidemiology and impact of interventions. BMC Med. 13, 281 ( 10.1186/s12916-015-0524-z) [DOI] [PMC free article] [PubMed] [Google Scholar]
- 75.Chretien JP, Riley S, George DB. 2015. Mathematical modeling of the West Africa Ebola epidemic. eLife 4, 96 ( 10.7554/eLife.09186) [DOI] [PMC free article] [PubMed] [Google Scholar]
Associated Data
This section collects any data citations, data availability statements, or supplementary materials included in this article.
Supplementary Materials
Data Availability Statement
All of the epidemic incidence data employed in this paper are being made publicly available in the electronic supplementary material.


