

Abstract
Glucocorticoids are commonly used to treat inflammatory disorders. The glucocorticoid receptor (GR) can tether to inflammatory transcription factor complexes, such as NFκB and AP-1, and trans-repress the transcription of cytokines, chemokines, and adhesion molecules. In contrast, aldosterone and the mineralocorticoid receptor (MR) primarily promote cardiovascular inflammation by incompletely understood mechanisms. Although MR has been shown to weakly repress NFκB, its role in modulating AP-1 has not been established. Here, the effects of GR and MR on NFκB and AP-1 signaling were directly compared using a variety of ligands, two different AP-1 consensus sequences, GR and MR DNA-binding domain mutants, and siRNA knockdown or overexpression of core AP-1 family members. Both GR and MR repressed an NFκB reporter without influencing p65 or p50 binding to DNA. Likewise, neither GR nor MR affected AP-1 binding, but repression or activation of AP-1 reporters occurred in a ligand-, AP-1 consensus sequence-, and AP-1 family member-specific manner. Notably, aldosterone interactions with both GR and MR demonstrated a potential to activate AP-1. DNA-binding domain mutations that eliminated the ability of GR and MR to cis-activate a hormone response element-driven reporter variably affected the strength and polarity of these responses. Importantly, MR modulation of NFκB and AP-1 signaling was consistent with a trans-mechanism, and AP-1 effects were confirmed for specific gene targets in primary human cells. Steroid nuclear receptor trans-effects on inflammatory signaling are context-dependent and influenced by nuclear receptor conformation, DNA sequence, and the expression of heterologous binding partners. Aldosterone activation of AP-1 may contribute to its proinflammatory effects in the vasculature.
Keywords: AP1 transcription factor (AP-1), glucocorticoid receptor, inflammation, mineralocorticoid receptor, NF-κB transcription factor, nuclear receptor, trans-repression
Introduction
Nuclear receptors were first implicated in the modulation of inflammatory responses in 1948 when Hench et al. (1) discovered the clinical benefits of hydrocortisone in rheumatoid arthritis. Since then, glucocorticoids have been used to treat a wide array of inflammatory conditions, including asthma, allergic dermatitis, inflammatory bowel disease, and autoimmune disorders. Both the therapeutic efficacy and unwanted side effects of glucocorticoids are mediated by the glucocorticoid receptor (GR4; NR3C1). Despite high functional domain homology with GR, the mineralocorticoid receptor (MR; NR3C2) has very different, but clinically important, effects on inflammation. Aldosterone (ALD) activation of MR has been associated with endothelial dysfunction, vascular inflammation, and cardiac fibrosis (2). Importantly, MR antagonists improve survival in patients with congestive heart failure (3) and systolic dysfunction after myocardial infarction (4). Furthermore, these survival benefits have been attributed to the anti-inflammatory and antifibrotic effects of these agents (5).
Ligand activation of GR or MR results in conformational changes and binding to hormone response elements (HREs) in the regulatory regions of target genes with subsequent dimerization, recruitment of co-regulators, and activation of RNA polymerase II (6–8). Through this mechanism, referred to here as transcriptional cis-activation to denote direct DNA binding to canonical HREs, GR induces anti-inflammatory genes, such as glucocorticoid-induced leucine zipper (GILZ; TSC22D3) (9) and dual specificity protein phosphatase 1 (DUSP1) (10). However, this is only one of several modes of gene regulation by which GR and other nuclear receptors modulate inflammatory responses. Ligand-activated GR can also suppress gene transcription by binding to negative HREs, which have poor homology to typical HREs (e.g. bone γ-carboxyglutamate protein (BGLAP; also known as osteocalcin) and IL6) (11, 12), or by competing with other transcription factors, such as AP-1 (e.g. proliferin) (13). In addition, GR trans-represses NFκB, AP-1, and other inflammatory transcription factor complexes without direct binding to DNA via protein-protein tethering. These “trans” mechanisms are considered to primarily account for glucocorticoid effects on a large repertoire of inflammatory gene targets, including cytokines, chemokines, and adhesion molecules (13–17). Despite substantial progress in understanding these complex mechanisms, efforts to create safer and more effective GR agonists have not yet been successful.
In contrast to the anti-inflammatory effects of GR, ALD and MR promote cardiovascular inflammation in vivo (2, 18–21) and are less well understood. NFκB and AP-1 are activated in hypertensive rats given ALD and high salt diets (22, 23), but blood pressure, shear forces, and secondary mediators, such as endothelin-1 and angiotensin, may play prominent roles in these models. In addition, the frequent use of spironolactone in numerous studies to confirm MR pathway specificity is confounded by its protean and incompletely understood off target effects (24). MR cis-induction of serum- and glucocorticoid-inducible protein kinase-1 (SGK1) (25, 26), a prototypic MR target gene, and subsequent activation of stress kinase pathways (27, 28) have been implicated in inflammatory NFκB signaling. Importantly, however, ALD can also activate p38 MAPK and ERK independently of MR through G-protein-coupled receptor 30 (29). In contrast to investigations showing NFκB and/or stress kinase activation, the direct effect of MR on NFκB signaling has been characterized as weak trans-repression (30, 31). Unlike GR, MR has not yet been reported to have trans-effects on AP-1 inflammatory signaling (32, 33), but most of this work predated the current interest in ALD and MR as promoters of cardiovascular inflammation.
The differential effects of GR and MR on inflammatory signaling and their contextual dependences are relevant to the design of next generation drugs with improved safety and efficacy. Here, GR and MR actions on NFκB- and AP-1-dependent signaling were compared in a standardized cellular context where GR or MR could be specifically expressed in the absence of other nuclear receptors. Like GR, MR was found to repress NFκB-driven transcription in these cells. For AP-1-dependent signaling, GR and MR displayed either repressing or activating effects depending on the choice of ligand, AP-1 consensus sequence, and abundance of particular AP-1 family members. For MR, these various context-dependent patterns, reflecting different interactions with AP-1 signaling, were then confirmed for specific gene targets in primary human cells. Importantly, AP-1 activation might explain some of the proinflammatory effects of ALD in the human vasculature.
Results
HEK293 Cells Express Low Levels of Endogenous GR and No Detectable MR
To reduce confounding due to ligand nonspecificity for GR and MR, human embryonic kidney (HEK293) cells, which express a low level of endogenous GR protein (34) and no functional MR (35), were used. The selective expression of GR, MR, and receptor mutants allowed us to examine the role of MR in regulating NFκB or AP-1 signaling independently of other influences. Immunostaining against a common DDK (FLAG) carboxyl-terminal tag following transfection revealed higher levels of GR overexpression compared with MR (Fig. 1, A and B). To demonstrate the cis-activation potential of these receptors, cells were transfected with GR, MR, or empty expression vector along with an HRE-driven mouse mammary tumor virus (MMTV) luciferase reporter and then treated with dexamethasone (DEX), budesonide (BUD), deoxycorticosterone acetate (DOC), or ALD. As expected (36, 37), DEX and BUD demonstrated a preference for GR over MR, whereas DOC and ALD showed higher activity for MR than GR (Fig. 1, C–F). Endogenous GR responded only weakly to each ligand (see Fig. 1, C–F, insets) compared with that seen with GR overexpression, consistent with known effects of receptor level on the dose response (38).
FIGURE 1.

Expression of GR and MR in HEK293 cells. HEK293 cells were transfected with MR-DDK-myc or GR-DDK-myc expression vectors or empty vector. A, GR was expressed at low but detectable baseline levels, whereas MR was undetectable. Whole cell lysate Western blots demonstrate human GR and MR overexpression. Equal loading and transfer of protein were confirmed by α-tubulin expression. B, GR was overexpressed at higher levels compared with MR as shown by staining against a common DDK (FLAG) carboxyl-terminal tag. MR or GR cis-activation of an HRE-driven MMTV-luciferase reporter with dexamethasone (n = 3) (C), budesonide (n = 4) (D), deoxycorticosterone acetate (n = 3) (E), or aldosterone (n = 8; 0.01–1000 nm) (F). Luciferase activity was normalized to the activity of the Renilla control and presented as mean steroid ligand induction ±S.E. Luciferase activity of control plasmid-transfected cells is expanded as an inset. Error bars represent S.E.
MR Represses NFκB
GR has been shown to reproducibly antagonize NFκB signaling (15, 16, 39, 40). To investigate whether MR can likewise influence NFκB signaling, an NFκB reporter in the same backbone as the MMTV reporter was examined with or without expression of MR or GR. Tumor necrosis factor α (TNFα) dose-response curves performed in MR-transfected cells identified maximal activation of the NFκB reporter at ∼10 ng/ml TNFα (Fig. 2A). Pretreatment with DOC (100 nm) decreased the maximal effect (Amax) of TNFα by 24.8 ± 6.7% (p < 0.01; Fig. 2A). Increasing concentrations of DOC and ALD both modestly suppressed TNFα-induced NFκB reporter activity when MR was expressed (−31.7 ± 5.8 and −26.3 ± 4.9%, respectively, each at 100 nm ligand; p < 0.0001 for both; Fig. 2, B and C). As expected for GR, both DEX and BUD suppressed NFκB activity with the magnitude increasing when GR was overexpressed (−58.1 ± 2.6% for GR overexpression versus −26.9 ± 2.7% for control cells and −62.9 ± 5.2% for GR overexpression versus −17.5 ± 8.9% for control cells, respectively, each at 100 nm ligand; p < 0.0001 for both; Fig. 2, D and E). MR expression slightly potentiated the effect of DEX (p < 0.001), but this was not seen with BUD.
FIGURE 2.

MR and GR repression of NFκB. A, DOC (100 nm) repression of a TNFα-induced (0.1–10 ng/ml) NFκB reporter in MR-transfected HEK293 cells. Maximal activation of the NFκB reporter was seen at ∼10 ng/ml TNFα in the presence and absence (vehicle) of DOC. Luciferase activity was normalized to the activity of the Renilla control and presented as mean TNFα induction (±S.E.; n = 4). Ligand dose-response curves (1–100 nm) for DOC (n = 5) (B), aldosterone (n = 6) (C), dexamethasone (n = 6) (D), or budesonide (n = 3) (E) of TNFα-induced (10 ng/ml) NFκB activity are shown. HEK293 cells were transfected with either MR, GR, or empty vector along with NFκB and Renilla reporters. Luciferase activity was normalized to the activity of the Renilla control and presented as mean TNFα induction (set at 100% activity ±S.E.). F, DOC (100 nm) repression of TNFα-induced (10 ng/ml) target genes as measured by qRT-PCR. Cells were transfected with MR or empty vector and treated with TNFα or TNFα and DOC. Expression of mRNA is presented as the geometric mean relative to TNFα stimulated cells (set at 100% ±S.E.; n = 6) and was unaffected by DOC in the absence of TNFα (data not shown). G, binding of p65 and p50 was unaltered by DOC (100 nm). HEK293 cells were co-transfected with MR expression vector and treated with DOC, TNFα, or with TNFα and DOC as above. Nuclear protein was isolated, and p65/p50 binding activity to an NFκB consensus sequence was assessed by enzyme-linked immunosorbent assay (TransAM). Data are presented as mean absorbance ±S.E. (n = 3). H, expression of p65 and p50 remained unchanged following the addition of DOC. Nuclear extracts from MR-transfected HEK293 cells treated with DOC, TNFα, or TNFα and DOC as above were subjected to Western blotting. Densitometric quantification of p65 and p50 protein expression is presented relative to TNFα-stimulated cells (set at 100% ±S.E.; n = 3), and a representative Western blot is shown below each bar graph. Error bars represent S.E. CON, control.
Next, the ability of MR to repress NFκB target genes was tested using quantitative real time PCR (qRT-PCR) and candidate genes from studies of GR trans-repression (41). Similar to effects on the NFκB reporter, TNFα induced all of the target genes by >18-fold (data not depicted), whereas DOC/MR repressed the induction of these genes, including IL8 (−21.1%; p < 0.01), inhibin β A (INHBA; −13.0%; p < 0.05) and chemokine (CC motif) ligand 2 (CCL2; −21.5%; p < 0.02 comparing TNFα + DOC to TNFα alone for MR; Fig. 2F). TNFα increased the binding of p65 (RELA) and p50 (NFκB1) to an NFκB consensus sequence, a finding not affected by the addition of DOC (Fig. 2G). Protein expression of p65 or p50 was similarly unaffected (Fig. 2H). Binding for p52 (NFκB2), REL (c-REL), and RELB was also examined, but little to no binding was detected in HEK293 cells with or without TNFα and/or DOC (data not shown). These results demonstrate that similar to GR, albeit less potently, MR can repress NFκB activity without influencing NFκB DNA binding, consistent with a trans-mechanism.
Sequence Specificity of MR Repression or Activation of AP-1
Next, AP-1-luciferase reporters in the same reporter backbone were used to investigate whether MR affects AP-1 signaling. In MR-transfected cells, an AP-1 reporter carrying a 5′-TGAGTCAG consensus sequence (AP-1_v1) was maximally activated at 10–100 nm phorbol 12-myristate-13-acetate (PMA; Fig. 3A). In contrast to the NFκB reporter, pretreatment with DOC (100 nm) increased the PMA Amax of the AP-1_v1 reporter by 237.2 ± 24.7% (p < 0.001; Fig. 3A). Unlike induction of the HRE-driven MMTV reporter, no effect of DOC was seen at PMA doses <5 nm, indicating the lack of a direct MR cis-activating influence. Both DOC and ALD dose-dependently increased PMA-induced AP-1_v1 activity in the presence of MR expression (p < 0.0001 for both; Fig. 3, B and C). DOC or ALD (≥100 nm) also modestly increased AP-1_v1 activity in the presence of GR overexpression (p < 0.05 for both; Fig. 3, B and C).
FIGURE 3.
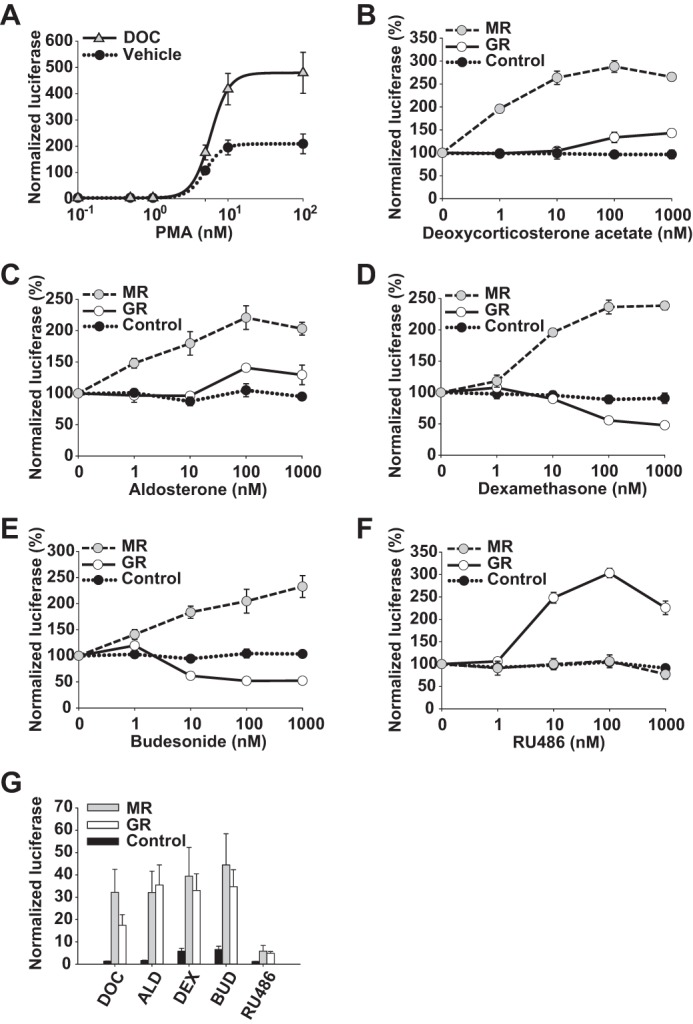
MR and GR regulation of AP-1 differs across various ligands. A, DOC (100 nm) activation of a PMA-induced (0.1–100 nm) AP-1 (AP-1_v1; (5′-TGAGTCAG)6) reporter in MR-transfected HEK293 cells. Maximal activation of the AP-1 reporter was seen at 10–100 nm PMA in the presence and absence (vehicle) of DOC. Luciferase activity was normalized to the activity of the Renilla control and presented as mean PMA induction (±S.E.; n = 4). Ligand dose-response curves (1–1000 nm) for DOC (n = 5) (B), aldosterone (n = 5) (C), dexamethasone (n = 5) (D), budesonide (n = 4) (E), or RU486 (n = 3) (F) of PMA-induced (100 nm) AP-1 reporter activity are shown. HEK293 cells were transfected with either MR, GR, or empty vector along with AP-1_v1 and Renilla reporters. Luciferase activity was normalized to the activity of the Renilla control and presented as mean PMA induction (set at 100% activity ±S.E.). G, MR or GR cis-activation of an HRE-driven MMTV-luciferase reporter is shown for various ligands (1 μm). Luciferase activity was normalized to the activity of the Renilla control and presented as mean steroid ligand induction (±S.E.; n = 3). Error bars represent S.E.
In contrast to the activation seen with MR agonists for either MR or GR, the prototypical glucocorticoids DEX and BUD significantly repressed AP-1_v1 activity in PMA-stimulated cells overexpressing GR (p ≤ 0.001 for both; Fig. 3, D and E). However, DEX and BUD, similar to DOC and ALD, strongly activated PMA-induced AP-1_v1 reporter activity when MR was expressed (p < 0.0001; Fig. 3, D and E). Additionally, RU486 (mifepristone), a GR antagonist, activated PMA induction of the AP-1_v1 reporter in a GR-dependent manner (p < 0.0001; Fig. 3F). Importantly, RU486 (1 μm) activation of the MMTV reporter in the presence of GR or MR was ≤18% of the activity seen with BUD, DEX, or ALD (Fig. 3G). This indicates that RU486/GR activation of AP-1_v1 is not due to cis-activation of a cryptic HRE site. Collectively, these results suggest that this activation of AP-1 in a ligand- and steroid nuclear receptor-specific manner is a trans-effect and not cis-agonism.
As AP-1 consensus sequences can be highly variable (42), a second AP-1 luciferase reporter was tested to determine whether these results are generalizable to alternative AP-1 motifs. The six copies of the AP-1_v1 consensus sequence 5′-TGAGTCAG used in the above reporter were replaced with six copies of the AP-1 consensus sequence 5′-TGACTAA (AP-1_v2). Similar to AP-1_v1, maximal activation of AP-1_v2 in MR-expressing cells also occurred at 10–100 nm PMA (Fig. 4A). However, in contrast to the AP-1_v1 reporter, DOC (100 nm) decreased the Amax of the PMA response by 42.1 ± 5% (p < 0.001). Additionally, increasing doses of both DOC and ALD strongly repressed PMA-stimulated AP-1_v2 in the presence of MR (−53.6 ± 3.3 and −60.4 ± 3%, respectively, with 1 μm ligand; p < 0.01 for both dose responses; Fig. 4, B and C). In contrast and similar to that seen for AP-1_v1, DOC and ALD enhanced the PMA-stimulated activity of the AP-1_v2 reporter when GR instead of MR was overexpressed (p < 0.05 for both; Fig. 4, B and C). Like the AP-1_v1 reporter, both DEX and BUD repressed AP-1_v2 in a GR-dependent manner (p < 0.01 for both; Fig. 4, D and E), whereas RU486 again activated AP-1_v2 (p < 0.0001; Fig. 4F). Importantly, DOC/MR-mediated activation at AP-1_v1 and repression at AP-1_v2 were confirmed in a dissimilar reporter backbone (pAP-1/luc) (p < 0.01 for both; Fig. 4, G and H), further affirming their dependence on AP-1 sequence rather than cryptic binding sites. These results demonstrate the existence of functional differences between AP-1 consensus binding sites that control the polarity of nuclear receptor effects and together further support the trans-effect nature of these responses.
FIGURE 4.
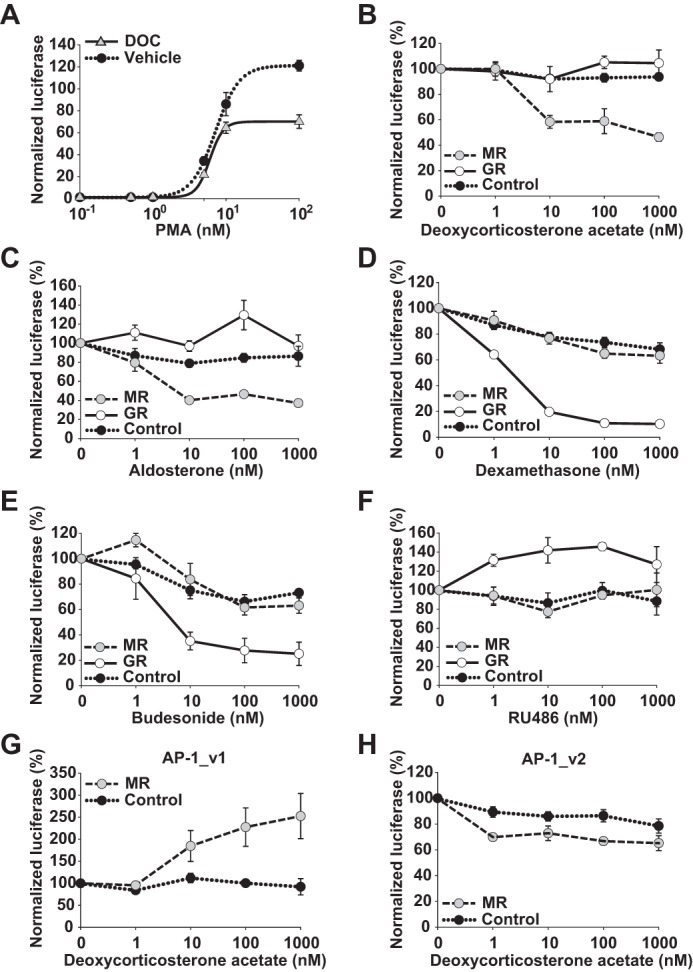
MR and GR regulation of AP-1 differs by AP-1 consensus sequence. A, DOC (100 nm) repression of an alternative PMA-induced (0.1–100 nm; 5 h) AP-1 (AP-1_v2; (5′-TGACTAA)6) reporter in MR-transfected HEK293 cells. Maximal activation of the AP-1_v2 reporter was seen at 10–100 nm PMA in the presence and absence (vehicle) of DOC. Luciferase activity was normalized to the activity of the Renilla control and presented as mean PMA induction (±S.E.; n = 3). Ligand dose-response curves (1–1000 nm) for DOC (n = 5) (B), aldosterone (n = 5) (C), dexamethasone (n = 5) (D), budesonide (n = 4) (E), or RU486 (n = 3) (F) of PMA-induced (100 nm) AP-1_v2 reporter activity are shown. HEK293 cells were transfected with either MR, GR, or empty vector along with AP-1_v2 and Renilla reporters. Luciferase activity was normalized to the activity of the Renilla control and presented as mean PMA induction (set at 100% activity ±S.E.). DOC/MR differential effects on AP-1_v1 (G) and AP-1_v2 (H) consensus sequences were confirmed in a dissimilar reporter-plasmid backbone (AP1_v1_synthRE/pLightSwitch_LR and AP-1_v2_synthRE/pLightSwitch_LR, respectively). HEK293 cells were co-transfected with MR or empty vector as above along with alternate AP-1 reporter constructs and treated with DOC (1–1000 nm) and PMA (100 nm). Luciferase activity is presented as mean PMA induction (set at 100% activity ±S.E.; n = 5). Error bars represent S.E.
Mutation of GR and MR DNA-binding Domains
GR dimerization mutants remain capable of trans-repressing AP-1 (6). In addition, a DNA-binding domain mutant (rat GR-K461A) was shown to switch trans-effect polarity (43, 44), presumably by affecting receptor conformation and its interpretation of DNA sequences and/or the recruitment of cofactors. This GR mutant remained capable of binding to DNA but showed markedly reduced activity compared with wild-type GR in human osteosarcoma cells (HOS D4) and COS7 cells transfected with an HRE-driven luciferase reporter. Here, the human equivalents of this mutant were generated for both GR (GR-K442A) and MR (MR-K624A; alignments are shown in Fig. 5A). In HEK293 cells, both mutants failed to activate the MMTV reporter in response to DEX or DOC, respectively (Fig. 5B). However, these homologous mutations increased the repression potency of GR for AP-1_v1 (p < 0.05 for GR repression, p < 0.0001 for GR-K442A repression, and p < 0.0001 for GR-K442A versus GR) and transformed MR activation of AP-1_v1 to repression (p < 0.01 for MR activation, p < 0.0001 for MR-K624A repression, and p < 0.001 for MR-K624A versus MR; Fig. 5C). In contrast, expression of wild-type and mutant receptors demonstrated virtually identical results when tested against AP-1_v2 (p = 0.8 for both; Fig. 5D). In fact, for GR-K442A and MR-K624A, AP-1_v1 and AP-1_v2 no longer displayed divergent results for the magnitude of DEX/GR repression or the polarity of DOC/MR effects. Together, these results suggest that these homologous mutations forced DEX/GR and DOC/MR into conformations on AP-1_v1 that were optimized for trans-repression and functionally resembled their conformation on AP-1_v2.
FIGURE 5.

MR and GR DNA-binding domain mutations reverse MR activation of AP-1 and increase GR repression. A, alignment of human and rat MR and GR sequences. Amino acid differences are highlighted, and the lysine residue mutated in B–D is boxed. B, GR and GR-K442A or MR and MR-K624A with DEX or DOC (0.1–1000 nm), respectively, cis-activation of an HRE-driven MMTV-luciferase reporter. HEK293 cells were transfected with GR, the GR-K442A mutant, MR, the MR-K624A mutant, or empty vector as indicated along with MMTV and Renilla reporters. Luciferase activity was normalized to the activity of the Renilla control and presented as mean steroid ligand induction (±S.E.; n = 3). Luciferase activity of control plasmid- and mutant plasmid-transfected cells are expanded as insets. DEX and DOC dose-response curves (1–1000 nm) of PMA-induced (100 nm) reporter activity are shown for AP-1_v1 ((5′-TGAGTCAG)6) (C) or AP-1_v2 ((5′-TGAGTCAG)6) (D). Luciferase activity was normalized to the activity of the Renilla control and presented as mean PMA induction (set at 100% activity ±S.E.; n = 3). Error bars represent S.E.
Expression of Core AP-1 Family Members and DNA Binding
AP-1 family member expression may impact GR- and MR-mediated trans-effects and thereby drive cell context-dependent variation. Therefore, AP-1 family member expression was examined in response to PMA and DOC/MR (Fig. 6A). PMA caused FOS, FOSL1, FOSL2, JUN, JUNB, and JUND to accumulate in the nucleus, whereas nuclear FOSB was reduced (p < 0.05 for all). The combination of PMA and DOC/MR did not lead to significant changes in nuclear levels of any family member. However, DOC/MR had a non-significant tendency to decrease nuclear FOSB (p = 0.14 for a main effect of DOC) and to increase nuclear FOS (p = 0.45) and JUND (p = 0.20) levels in the presence of PMA. As noted below, these changes in the nuclear abundance of FOS, JUND, and FOSB could potentially act together to support AP-1 activation. However, these mostly small and non-significant differences were only seen with Western blotting, a semiquantitative technique, and were not corroborated at the mRNA level (supplemental Table S1 and data not shown). Notably, many AP-1 family members are strongly induced by PMA and known to be regulated themselves through AP-1 sites, therefore having the potential to be trans-regulated by MR.
FIGURE 6.

Expression and DNA binding of AP-1 family members in HEK293 cells. A, FOS, FOSB, FOSL1, FOSL2, JUN, JUNB, and JUND expression. Nuclear extracts (10 μg) from MR-transfected HEK293 cells treated with DOC (100 nm), PMA (100 nm), or PMA and DOC were subjected to Western blotting. Densitometric quantification is presented relative to PMA-stimulated cells (set at 100% ±S.E.; n = 4), and a representative Western blot is shown below each bar graph. Expression of α-tubulin (not shown) confirmed equal loading and transfer of protein. B, AP-1 complex binding as determined by EMSA. Nuclear extracts (5 μg) were subjected to EMSA using biotin-labeled AP-1 oligos corresponding to AP-1_v1 (5′-TGAGTCAG). DNA-protein complex composition was evaluated using antibodies against FOS, FOSB, FOSL1, FOSL2, JUN, JUNB, or JUND or an IgG control. Arrows indicate the location of the AP-1 DNA-protein complex. C, densitometric quantification of AP1 binding after PMA or PMA and DOC compared with vehicle (n = 8; FC, -fold change). D, binding of FOS, FOSB, FOSL1, JUN, JUNB, and JUND was unaltered by DOC. HEK293 cells were co-transfected with an MR expression vector and treated with DOC, PMA, or PMA and DOC as above. Nuclear protein was isolated, and AP-1 binding activity to an AP-1 consensus sequence (5′-TGAGTCA) was assessed by enzyme-linked immunosorbent assay (TransAM). Data re presented as mean absorbance ±S.E. (n = 3). Error bars represent S.E.
Next, differential binding was examined as a possible explanation for the divergent effects of DOC/MR at different AP-1 consensus sequences. EMSAs using AP-1 consensus sequences corresponding to AP-1_v1 showed that DOC/MR failed to alter AP-1 binding in response to PMA activation compared with PMA alone (Fig. 6, B and C); the consensus sequence for AP-1_v2 demonstrated the same lack of effect (data not shown). AP-1 complex supershift using family member-specific antibodies demonstrated FOS and FOSB binding with some evidence for JUN and JUNB, whereas a supershift was not evident for FOSL1, FOSL2, or JUND antibodies. Because FOS family members do not homodimerize, these results suggest that the AP-1 complexes forming at AP-1_v1 contain FOS or FOSB and a mixture of JUN proteins or other FOS binding partners. The possibility of MR binding to AP-1_v1 or AP-1_v2 sequences was also assessed using high affinity anti-myc antibodies to detect overexpressed MR-DDK-myc. However, MR was not found to directly bind to either AP-1_v1 or AP-1_v2 in the absence or presence of DOC and/or PMA (data not shown). Likewise, a sensitive TransAM® assay measuring DNA binding of FOS, FOSB, FOSL1, JUN, JUNB, and JUND to an immobilized consensus sequence (5′-TGAGTCA; similar to the AP-1_v1 sequence 5′-TGAGTCAG) also showed no effect of DOC/MR on the PMA-induced DNA binding of AP-1 family members (Fig. 6D). The TransAM assay, like the EMSA, showed PMA-induced binding for FOS, FOSB, JUN, and JUNB but not for FOSL1. However, the TransAM assay also revealed a large increase in PMA-stimulated JUND binding not detected by EMSA.
Knockdown of Core AP-1 Family Members Differentially Affected AP-1 Reporters with Different Consensus Sequences
PMA activation of the AP-1_v1 and AP-1_v2 luciferase reporters was evaluated following knockdown of AP-1. Representative Western blots and densitometric quantitation demonstrate the efficiency of each knockdown at the protein level using whole cell lysates (p < 0.05 for all; Fig. 7A). Interestingly, although PMA appeared to reduce nuclear FOSB (see Fig. 6A), whole cell FOSB expression as well as the expression of other family members increased in response to PMA (Fig. 7A). For both AP-1_v1 and AP-1_v2, knockdown of FOSL1, FOSL2, or JUNB increased overall activity of the PMA-stimulated reporters (p < 0.01 for all), suggesting that these family members were inhibitory to AP-1 activation (Fig. 7B). In contrast, knockdown of FOS reduced the activation of both reporters (p < 0.001 for both), whereas knockdown of JUN and JUND decreased the PMA-stimulated activity of only the AP-1_v2 reporter (p < 0.01 for both) with no apparent effect on AP-1_v1 (Fig. 7B). Although binding did not appear to differ by EMSA across the two consensus sequences (see above), the functional consequences of JUN and JUND binding were sequence-specific.
FIGURE 7.

Knockdown of AP-1 family members differentially affected AP-1 reporters with different consensus sequences. A, FOS, FOSB, FOSL1, FOSL2, JUN, JUNB, and JUND expression following transfection with specific siRNA or a non-targeting control treated with PMA (100 nm) or vehicle. Whole cell extracts (9 μg) were subjected to Western blotting with antibodies against FOS (n = 8), FOSB (n = 5), FOSL1 (n = 5), FOSL2 (n = 5), JUN (n = 8), JUNB (n = 7), or JUND (n = 5). Densitometric quantification is presented relative to PMA-stimulated cells (set at 100% ±S.E.), and a representative Western blot is shown below each bar graph. Expression of α-tubulin (not shown) confirmed equal loading and transfer of protein. B, AP-1 family member siRNA knockdown differential effects on AP-1_v1 ((5-TGAGTCAG)6) and AP-1_v2 ((5-TGACTAA)6) reporter activity. Cells were co-transfected with MR expression vector, AP-1 reporters as shown, and Renilla reporter and treated with PMA (100 nm). Luciferase activity was normalized to the activity of the Renilla control and presented as mean activity (±S.E.; n = 5). Error bars represent S.E.
Knockdown or Overexpression of Core AP-1 Family Members Altered the Effects of DOC/MR
To examine the impact of silencing various AP-1 family members under MR activating or repressing conditions, AP-1 knockdown cells expressing MR were co-transfected with one of the two reporters and treated with PMA and DOC. For cells transfected with control siRNA, DOC/MR in the presence of PMA further activated AP-1_v1 as expected (Fig. 8, A and B). Importantly, knockdown of either FOS (Fig. 8A) or JUND (Fig. 8B) greatly reduced the DOC/MR activation of the PMA-stimulated AP-1_v1 reporter (p < 0.001 for both), suggesting that these AP-1 family members are integral to the activating response. Knockdown of FOSL1, FOSL2, JUN, and JUNB had generally smaller effects on DOC/MR activation (p < 0.05 for all). In contrast, knockdown of FOSB slightly increased activation (p < 0.05; Fig. 8A), suggesting that FOSB may somewhat inhibit this response. As such, DOC suppression of nuclear FOSB as well as trends toward increasing FOS and JUND (Fig. 6A) might serve to support the activation of compatible AP-1 sites. It is notable that JUND knockdown had no effect on PMA activation of AP-1_v1 (see Fig. 7B) but appeared essential for its DOC/MR-mediated activation (Fig. 8B). The AP-1 family member specificity of DOC/MR activation again implicates the dependence of this response on protein-protein interactions and therefore supports a mechanism where MR is not directly binding to DNA. For AP-1_v2, DOC/MR repressed PMA-stimulated reporter activity as expected under control siRNA conditions. Surprisingly, knockdown of any single core member of the AP-1 family had little or no effect on AP-1_v2 repression with the exception of a slight decrease in repression seen following knockdown of FOSB (p = 0.05; Fig. 8C) or JUNB (p < 0.05; Fig. 8D).
FIGURE 8.

MR regulation of AP-1 varies depending on AP-1 family member expression. MR/DOC (1–1000 nm) trans-effects on the PMA-induced (100 nm) AP-1_v1 ((5′-TGAGTCAG)6) (A and B) or AP-1_v2 ((5′-TGACTAA)6) (C and D) reporters were altered by siRNA knockdown of AP-1 family members. HEK293 cells were transfected with siRNA, MR, Renilla, and AP-1 reporters as shown. Luciferase activity was normalized to the activity of the Renilla control and presented as mean PMA induction over background activity (±S.E.; n = 5). E, FOS or FOSB overexpression with JUN, JUNB, or JUND impact on PMA- and DOC-induced (each 100 nm) AP-1_v1 reporter activity. HEK293 cells were transfected with MR and AP-1 family members or empty vector as indicated along with AP-1_v1 and Renilla reporters. Luciferase activity was normalized to the activity of the Renilla control and presented as mean PMA alone induction (set at 100% activity ±S.E.; n = 3). F, DOC did not alter FOS/JUND binding to either the AP-1_v1 or AP-1_v2 consensus sequence as determined by EMSA. Nuclear extracts (5 μg) were prepared from HEK293 cells following transfection with FOS, JUND, and MR expression vectors and treatment with vehicle, PMA, or PMA + DOC. EMSA was performed using biotin-labeled AP-1 oligos corresponding to AP-1_v1 or AP-1_v2. DNA-protein complex composition was evaluated using antibodies against FOS or JUND or an IgG control. Arrows indicate the location of the AP-1 DNA-protein complex. Error bars represent S.E. Con, control.
The influence of DOC/MR on PMA-induced AP-1_v1 reporter activity was also examined in the context of AP-1 family member overexpression. Overexpression of FOSL1, FOSL2, or JUNB alone repressed AP-1 reporter activity and PMA induction (data not shown), consistent with the activating effect of knocking down these AP-1 family members (see Fig. 7B). Overexpression of JUN or JUNB in combination with either FOS or FOSB reduced overall activity of the AP-1_v1 reporter (not depicted) as well as the activating influence of DOC (p < 0.05 for all; Fig. 8E). In contrast, only FOS and JUND overexpressed together preserved, but did not further enhance, the full potency of the DOC/MR response (Fig. 8E). The inability of FOS and JUND overexpression to further boost the effect of DOC/MR argues for a threshold effect and against the importance of minor, DOC/MR-mediated changes in nuclear FOS and JUND levels (Fig. 6A). Overall, these results are most consistent with MR trans-activation of AP-1 via protein-protein interactions.
EMSAs using nuclear extracts from cells overexpressing MR, FOS, and JUND showed no differences in binding by either FOS or JUND following treatment with DOC + PMA versus PMA alone or between AP-1_v1 and AP-1_v2 (Fig. 8F). Although the composition of AP-1 family member binding was not found to differ, knockdown and overexpression of core AP-1 family members demonstrated that activation of AP-1_v1 by MR required FOS and JUND. Sequence-specific conformations assumed by FOS and JUND within AP-1 complexes likely dictate interactions with DOC/MR that are permissive for either transcriptional trans-activation or trans-repression. Therefore, the abundance of AP-1 family members and other cofactors in different cellular contexts will likely functionally influence the pattern and strength of MR trans-effects.
MR Repression or Activation of AP-1-regulated Target Genes
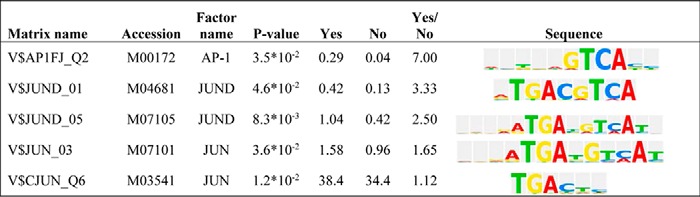
To evaluate whether MR influences PMA-induced target genes in a manner recapitulating the divergent patterns seen with the AP-1_v1 and AP-1_v2 reporters, candidate genes were first identified from the published literature examining GR-mediated trans-repression (41) and by microarray analysis (see “Experimental Procedures” and supplemental Table S1). Similar to effects on the AP-1_v1 reporter, DOC/MR in HEK293 cells was found to further activate a subset of PMA-induced genes (>4-fold increase with PMA; data not depicted) without influencing their expression in the absence of PMA (p < 0.005 for all; Fig. 9A). These putative trans-activated genes included xin actin-binding repeat-containing 1 (XIRP1; also referred to as cardiomyopathy-associated protein 1), serpin peptidase inhibitor, clade E, member 1 (SERPINE1; also referred to as nexin or plasminogen activator inhibitor type 1), and tissue plasminogen activator (PLAT). Similar to effects on the AP-1_v2 reporter, DOC/MR was also found to repress the activation of another subset of PMA-induced genes (>17-fold increase with PMA; data not depicted) typified by inhibinβ A (INHBA; −31.9%), matrix metallopeptidase 1 (MMP1; −33.4%), and matrix metallopeptidase 10 (MMP10; −29.9%; p < 0.005 for all; Fig. 9B). Furthermore, a transcription factor binding site analysis (BIOBASE TRANSFAC® + Proteome) (45) of the −10000/+100 region of the top 25 putative MR trans-activated genes identified by microarray revealed differences in AP-1 consensus sequence sites when compared with the 25 top genes that were repressed by MR. MR activation of PMA-induced genes, not affected by DOC/MR alone, was associated with overrepresentation of five AP-1/JUND sequence motifs, including 5′-TGAGTCA, similar to the AP-1_v1 sequence 5′-TGAGTCAG (Table 1).
FIGURE 9.

MR modulation of AP-1 regulated genes. A, DOC (100 nm) activation of PMA-induced (10 nm) target genes as measured by qRT-PCR. HEK293 cells were transfected with MR expression vector or empty vector and treated with PMA or PMA and DOC (n = 5). B, DOC (100 nm) repression of PMA-induced target genes (n = 5). Expression is presented as the geometric mean relative to PMA stimulated cells (set at 100% ±S.E.) and was unaffected by DOC alone in the absence of PMA (data not shown). C, DOC (100 nm) activation of PMA-induced (100 nm) luciferase reporter activity driven by the −1200/+35 promoter region of XIRP1 (n = 3). HEK293 cells were transfected with MR expression vector or empty vector and treated with PMA or PMA and DOC. Luciferase activity was normalized to the activity of the Renilla control (±S.E.). D, effect of DOC (100 nm) on PMA-induced (100 nm) luciferase reporter activity driven by the human XIRP1 gene promoter (−1200/+35) or truncated promoter constructs from −900/+35, −600/+35, or −292/+35. AP-1 sites in each of four truncated promoter constructs are shown to the right along with the -fold change in activity seen with DOC and PMA versus PMA alone. Luciferase activity was normalized to the activity of the Renilla control and presented as mean -fold induction with PMA (±S.E.; n = 3). E, CHX (200 μg/ml) effect on DOC (100 nm) activation of PMA-induced (10 nm) target genes or DOC activation of the MR target gene SGK1 as measured by qRT-PCR. HEK293 cells were transfected with MR expression vector or empty vector and treated with vehicle (SGK1) or with vehicle or PMA (XIRP1, SERPINE1, and PLAT) and then treated with vehicle or CHX followed immediately with vehicle or DOC (n = 4). F, DOC (1 μm) activation of PMA-induced (10 nm) target genes in primary human mesangial cells following treatment with vehicle, DOC, PMA, or PMA and DOC. Expression as determined by qRT-PCR is presented as the geometric mean relative to PMA stimulated cells (set at 100% ±S.E.; n = 4). Error bars represent S.E.
TABLE 1.
DNA sequences of overrepresented AP-1 binding sites among top MR trans-activated genes
Matrix name, transcription factor binding site matrix from TRANSFAC + Proteome database. The Yes and No columns represent the relative number of sites for the selected matrix among the top 25 trans-activated genes (Yes set) and trans-repressed genes (No set) identified by microarray analysis. Yes/No, ratio of transcription factor binding sites of a particular matrix in the top 25 trans-activated genes (Yes set) versus the set of trans-repressed genes (No set). The promoter regions 10,000 base pairs upstream and 100 base pairs downstream of the predicted transcription start site were analyzed based on a custom AP-1 profile. A threshold p value of 0.05 was applied as well as a filter to minimize the sum of both the false negative and false positive error rates (minSUM).
To further test the DOC/MR trans-activation of AP-1 hypothesis and further rule out the influence of cryptic HRE sites, the XIRP1 −1200/+35 promoter region, a PMA-induced and putative DOC/MR trans-activated gene (see Fig. 9A), was cloned into the luciferase reporter backbone used above. Sequence analysis (TRANSFAC) of this promoter sequence revealed 18 AP-1-like consensus sequences, including an exactly matching AP-1_v1 site (5′-TGAGTCATG) at −1033, two sites that differ from AP-1_v1 by 1 nucleotide (5′-TGAGTGAG at −648 and 5′-TGAGTCAC at −415), and an exactly matching AP-1_v2 site (5′-TGACTAA) at −467 (supplemental Table S2). Importantly, this promoter region contained no canonical HREs, although two 5′-AGAACA half-sites were identified (−560 and −64). Similar to effects seen with the AP-1_v1 reporter (Fig. 3B) and endogenous XIRP1 expression (Fig. 9A), the 1236-bp promoter reporter responded to PMA treatment (20.7 ± 4.4-fold) and pretreatment with DOC produced an apparent trans-activating effect but only in the presence of both PMA stimulation and MR expression (p < 0.0001; Fig. 9C). Promoter truncations were generated to more directly address the sequence(s) contributing to this DOC/MR-dependent activating effect. Multiple AP-1 sites likely contributed to PMA responsiveness as luciferase activity in response to PMA decreased following each truncation of the promoter and was absent in the −292/+35 construct, which lacked any identifiable AP-1 sites (Fig. 9D). Notably, putative DOC/MR trans-activation also decreased following truncation to the −900/+35 region (from 5.3- to 4.2-fold; p < 0.0001; Fig. 9D), but still persisted despite loss of the perfect match AP-1_v1 sequence at −1033. For the −600/+35 construct with eight remaining AP-1 sites, DOC/MR trans-activation was minimal (1.4-fold; p = 0.07) despite persistence of PMA-inducible activity and the presence of both putative HRE half-sites. Taken with previous results, these data suggest that multiple AP-1 consensus sequences may play complementary and/or competing roles in setting the trans-regulatory effects of MR.
Although the preponderance of evidence presented so far is consistent with a trans-effect mechanism, contributory cis-effects, such as the DOC/MR induction of gene products, remains possible. To further explore this possibility, the DOC/MR trans-activation of several target genes was tested in the presence and absence of cycloheximide (CHX), a protein synthesis inhibitor (see “Experimental Procedures”). Although the magnitude of PMA induction was reduced in the presence of CHX, MR/DOC retained the ability to further increase the expression (Fig. 9E) of XIRP1 (121.5%; p < 0.05), SERPINE1 (47.2%; p < 0.001), and PLAT (37.4%; p = 0.07). MR/DOC-mediated induction of the classical MR target gene SGK1 is shown for comparison (Fig. 9E). These results confirm that DOC/MR activation of AP-1 is not wholly dependent on canonical cis-induction of MR target genes and support a role for a trans-activation mechanism. However, as the effect of DOC/MR on PMA-induced gene expression was reduced by CHX, MR target genes or the modest effects of DOC/MR on AP-1 family members (Fig. 6A) may be supporting the overall activation of AP-1. In particular, PMA via AP-1 induces the expression of many AP-1 family members, and DOC/MR trans-activation of AP-1 signaling could further amplify this positive feed-forward pathway.
Lastly, the occurrence of DOC/MR AP-1 activation was tested in human primary cells. Normal human mesangial cells (NHMCs) isolated from the renal glomerulus and modified smooth muscle cells between capillaries have been reported to express MR and to proliferate in response to ALD, leading to glomerular mesangial injury (46, 47). In the presence of PMA, DOC further activated XIRP1 expression by 34.5% (p < 0.001), JUNB by 23.4% (p < 0.01), PTGS2 (also known as COX-2) by 26.8% (p < 0.01), and IL8 by 79.8% (p = 0.06; Fig. 9F). In contrast, DOC alone (1 μm) slightly decreased the expression of these genes, but this effect was only significant for IL8 (p < 0.05). These data further support an action of MR that differs from canonical cis-regulation.
Discussion
Nuclear receptors modulate inflammation through several experimentally established general mechanisms. One of these mechanisms, referred to here as trans-effects, has the following characteristics: 1) mediated by protein-protein interactions at heterologous response elements or without direct nuclear receptor binding to DNA at canonical HREs and 2) no disruption of or competition with protein complexes bound to DNA but 3) dependent on the composition of bound transcription factors and/or the recruitment of cofactors. Here, GR and MR effects on both NFκB and AP-1 were investigated and compared to better understand the contrasting anti- and proinflammatory potential of these closely related nuclear receptors (Table 2). Interestingly, both GR and MR were found to similarly repress inflammatory NFκB signaling, but as reported previously (30), MR had weaker effects than those of GR. For AP-1, glucocorticoids and GR were again shown to repress inflammatory signaling. However, GR combined with mineralocorticoids, including aldosterone, produced weak activation of AP-1 in the same model system. In addition, MR activated by either mineralocorticoids or glucocorticoids strongly potentiated context-dependent inflammatory AP-1 signaling. Therefore, this investigation identified AP-1 activation as a previously unrecognized proinflammatory effect of aldosterone. Furthermore, the strength and polarity of these effects were affected by the choice of ligand, sequence of AP-1 binding sites, conformation of GR and MR, and abundance of particular AP-1 family members.
TABLE 2.
Summary of GR and MR trans-effects on NFκB and AP-1 inflammatory signaling
| Reporter | Ligand | Effect with GR | Effect with MR |
|---|---|---|---|
| MMTV (HRE) | DOC | Weak cis-activation | Strong cis-activation |
| ALD | Moderate cis-activation | Strong cis-activation | |
| DEX | Strong cis-activation | Moderate cis-activation | |
| BUD | Strong cis-activation | Moderate cis-activation | |
| RU486 | Minimal cis-activation | Minimal cis-activation | |
| NFκB | DOC | None | Moderate trans-repression |
| ALD | None | Moderate trans-repression | |
| DEX | Strong trans-repression | Weak trans-repression | |
| BUD | Strong trans-repression | None | |
| RU486 | Not tested | Not tested | |
| AP-1_v1 (5′-TGAGTCAG) | DOC | Moderate trans-activation | Strong trans-activation |
| ALD | Moderate trans-activation | Strong trans-activation | |
| DEX | Strong trans-repression | Strong trans-activation | |
| BUD | Moderate trans-repression | Strong trans-activation | |
| RU486 | Strong trans-activation | None | |
| AP-1_v2 (5′-TGACTAA) | DOC | Weak trans-activation | Strong trans-repression |
| ALD | Moderate trans-activation | Strong trans-repression | |
| DEX | Strong trans-repression | None | |
| BUD | Strong trans-repression | None | |
| RU486 | Moderate trans-activation | None |
The trans-acting nature of our findings were supported by the following evidence: 1) the use of NFκB and AP-1 reporters devoid of HRE activity; 2) repression and/or activation of AP-1 by GR and MR independent of ligand cis-activity; 3) GR and MR cis-activation deficient (DNA-binding domain) mutants retaining the ability to repress AP-1-driven transcription; 4) no effect on NFκB and AP-1 binding to consensus sequences; 5) dependence on the expression of particular AP-1 family members, indicating the importance of protein-protein interactions; 6) MR activation of AP-1 persisting in the presence of CHX; and 7) recapitulation of the MR/DOC activating effect using a XIRP1 promoter reporter construct lacking identifiable HREs. Previous studies found that GR trans-repression of NFκB was independent of GR dimerization, IκBα degradation, or the direct binding of GR to DNA (30, 48–50). Although MR trans-repression of NFκB has also been described (30, 31), this finding had not been fully investigated and was never reconciled with the generally recognized ability of aldosterone and MR to promote cardiovascular inflammation. Like GR, MR did not affect the binding of NFκB complexes to DNA (Fig. 2, G and H), but its suppression of NFκB was weaker overall than that seen for glucocorticoids and GR. Nonetheless, repression of NFκB signaling by MR may potentially represent an as yet unrealized therapeutic opportunity. MR cis-activation antagonists, already a clinically useful drug class, might be identified that exploit this pathway to attain additional anti-inflammatory properties.
Although GR trans-repression of AP-1 is also a well studied phenomenon in many different cellular contexts, MR has not been previously recognized to have important trans-effects on AP-1 transcriptional activity. Like its effects on NFκB, GR-mediated trans-repression of AP-1 does not affect AP-1 complex binding (14, 51), and in fact, AP-1 binding appears to be a prerequisite for subsequent trans-actions by GR (52). Likewise here, MR was found to augment (Fig. 3) or suppress (Fig. 4) PMA-induced AP-1 activity in a DNA sequence-dependent manner without influencing the binding of AP-1 complexes to DNA (Fig. 6, B–D). Importantly, MR trans-effects were demonstrated in parallel with glucocorticoid/GR trans-repression using a reporter-based system lacking HRE sites and in selected target genes.
Previously, Starr et al. (44) found that rat GR repressed the ColA promoter when activated by JUN and FOS overexpression in murine F9 cells. Conversely, in the same system, the DNA-binding domain mutant GR-K461A trans-activated the colA-luc reporter. In this and other studies across several cellular contexts, MR was a very poor or entirely inactive repressor of AP-1-driven transcriptional activation (32, 33). In contrast, the MR mutant MR-K625A, like its homologous GR-K461A mutant, similarly trans-activated colA-luc activity (33, 44). The human DNA-binding domain homologs of rat GR-K461A and MR-K625A demonstrated that these mutations also critically affected the polarity and intensity of putative GR and MR trans-effects (Fig. 5). An important difference between this and previous work is that many such studies exploring the trans-effects of MR on AP-1 predominately used murine F9 cells (44), which conveniently do not express endogenous AP-1 transcription factors and do not require PMA as a stimulus. Instead, in this and other studies (53), FOS and JUN overexpression was sufficient to activate AP-1. Here, in human cells, FOS and JUND, rather than JUN, expression was found to be essential for MR trans-activation of PMA-induced AP-1 signaling, and the activating effects of MR were not seen in the absence of PMA. The specificity of trans-repression for particular AP-1 family members has also been shown for retinoic acid receptor (FOSL1 and JUNB) (54) and GR (FOS) (55).
An additional layer of complexity is that AP-1 is not limited to the various protein dimers that can be formed from the FOS (FOS, FOSB, FOSL1, and FOSL2) and JUN families (JUN, JUNB, and JUND). Other dimerization partners include the ATF/cAMP-response element-binding protein (ATF2, ATF3, B-ATF, JDP1, and JDP2) and MAF families (MAF, MAFB, MAFA, MAFF/G/K, and neural retina leucine zipper (NRL)), creating a very large repertoire of potential AP-1 complexes with differing signal transduction specificities. Overexpression of MAFA, but not MAF (c-MAF), MAFB, or MAFF/G/K, also completely eliminated MR/DOC-mediated trans-activation of AP-1_v1 (data not shown). Thus, cell type specificity in the expression of AP-1 family members, their post-translational modifications, and a large repertoire of potential homo- and heterodimers as well as sequence-dictated variations in conformation at different AP-1 binding sites orchestrate the complex contextual nature of AP-1 gene regulation. In our model system, MR strongly activated or moderately repressed PMA-induced AP-1 signaling depending on the sequence of the AP-1 consensus site. Although the composition of bound factors at AP-1_v1 and AP-1_v2 appeared similar, the orientation and conformation of the bound dimers were likely not the same. This arguably led to a fundamentally different interaction with MR and likely the subsequent recruitment of a different mixture of co-activators and co-repressors. This notion is supported by evidence that the formation of each AP-1 homo- or heterodimer results in complexes with varying conformations on the many different AP-1 target consensus sequences that are common throughout the mammalian genome (56). Because NFκB also has multiple family members and likewise displays substantial consensus sequence variability, nuclear receptor trans-regulation of NFκB may similarly be affected to some extent by the underlying sequence of DNA binding sites (57).
Like MR trans-activation or trans-repression of AP-1 as demonstrated here, GR trans-repression of inflammatory signaling has also been shown to be ligand-dependent (58). Ligand effects on the strength and direction of trans-effects have been attributed to the differential association of the ligand-activated receptor with cofactors such as NCOA1 (also known as SRC-1a), NCOA2 (also known as TIF2/GRIP1), NCOR, and NCOR2 (also known as silencing mediator of retinoic acid and thyroid hormone receptor (SMRT)) (58–61). In addition to sequence differences at DNA binding sites, stimulus differences can also be determinants of co-activator recruitment. Although NFκB consensus sequence differences among target genes led to the differential recruitment of co-regulators so did the use of either TNFα or LPS as a stimulus (57). Importantly, similar to our findings for AP-1, variability in cofactor recruitment can occur without evidence for differences in NFκB family member binding and has been attributed to conformational changes in the bound NFκB dimer (62). Together, this work supports the concept that co-activator/co-repressor recruitment to trans-regulated gene targets is dictated by the ligand-determined conformation of the receptor, consensus sequence of the heterologous binding site, and/or the type of inflammatory stimulus.
Negative HREs have also been implicated in the repression of inflammatory genes by GR (63). These sites differ substantially from canonical HREs but do contain one conserved half-site. Negative HREs are believed to bind GR dimers associated with NCOR and NCOR2 and directly repress target genes through steric occlusion of other transcription factor binding sites, the TATA box, or CCAAT box (64, 65). Importantly, of the negative HRE sequences identified in the literature, none were found in the XIRP1 promoter region tested in Fig. 9. However, two 5′-AGAACA half-sites were identified in the XIRP1 promoter (at −560 and −64). HRE half-sites bound by GR monomers have also been implicated in GR trans-repression but not trans-activation (66). Therefore, the presence of these sites in the XIRP1 promoter seems like an unlikely explanation for the MR-dependent induction of XIRP1 as observed here. Furthermore, putative trans-activation of the XIRP1 promoter reporter was seen only in the −1200/+35 and −900/+35 constructs (Fig. 9D). Nonetheless, we did not directly test these sites for MR binding, and our attempts to directly test for the tethering of MR to AP-1 to confirm a physical trans-interaction were unsuccessful.
In summary, we demonstrated that aldosterone and MR have potentially important trans-effects on inflammatory NFκB and AP-1 signaling in human cells. Nuclear receptor conformation as determined by choice of ligand, DNA sequence, and protein binding partners likely influenced the orientation and functionality of AP-1 transcriptional complexes. Importantly, the ability of MR to trans-activate AP-1 in a DNA sequence- and therefore target gene-specific manner suggests an overlooked mechanism by which MR might potentiate inflammatory responses in certain contexts. Some targets of MR trans-activation, such as SERPINE1, PLAT, and XIRP1, are important cardiovascular risk factors (67, 68), suggesting another potential benefit to MR antagonists in reducing cardiovascular inflammation. Notably, the MR antagonist eplerenone was able to block MR/DOC-mediated trans-activation of the AP-1_v1 reporter (data not shown). Other steroid nuclear receptors, including estrogen receptor α (69–72) and the androgen receptor (73–75), have also been found to amplify AP-1 inflammatory responses. Importantly, new MR antagonists could potentially be developed for clinical use that retain the NFκB and AP-1 trans-repression of MR agonists but eliminate the AP-1 site-selective trans-activation demonstrated here.
Experimental Procedures
Cell Culture and Treatments
HEK293 (ATCC, Manassas, VA) were grown in high glucose DMEM supplemented with 10% heat-inactivated FBS (Life Technologies). NHMCs isolated from the renal glomerulus and modified smooth muscle between capillaries (Lonza, Walkersville, MD) were grown as directed in mesangial cell growth medium containing 5% serum. For experiments using steroid ligands, cells were grown in medium as above supplemented with 5 (NHMCs) or 10% (HEK293 cells) charcoal-stripped heat-inactivated FBS. DEX, DOC, ALD, BUD, and RU486 (Sigma) were solubilized in 100% ethanol before dilution in medium. Recombinant human TNFα (Peprotech, Rocky Hill, NJ) was prepared in PBS with 0.1% BSA. PMA (Calbiochem) was solubilized in sterile DMSO (Sigma) before further dilution. Cells were exposed to equivalent volumes of vehicle in each experiment.
Western Blotting
Forty-eight hours prior to transfection, 5 × 10⁵ HEK293 cells were seeded onto 35-mm plates. Cells were transiently transfected with 1 μg of empty vector (DDK-myc/pCMV6, Origene, Rockville, MD) plus 0.5 μg of human GR-DDK-myc/pCMV6 (Origene), MR-DDK-myc/pCMV6 (Origene), or additional empty vector using Lipofectamine 2000 (Life Technologies). Post-transfection (24 h), cells were lysed on ice with radioimmune precipitation assay buffer (Life Technologies) supplemented with Complete Mini protease inhibitors (Roche Applied Science). Lysates were cleared by centrifugation (23,460 relative centrifugal force for 15 min at 4 °C) and quantified by BCA assay (Life Technologies). Samples were diluted to equal protein concentrations and boiled for 5 min in NuPAGE lithium dodecyl sulfate buffer and NuPAGE reducing agent (Life Technologies). Lysates (10–60 μg) were run on 3–12% Tris acetate gels or 4–12% Bis-Tris gels (Life Technologies) and then transferred on an iBlot (Life Technologies) at 20 V for 7 min. Blots were blocked with ECL Primer blocking agent (GE Healthcare) and stained with antibodies against FLAG (Sigma), MR (rMR(1–18); 1D5) (76), GR (this and the following antibodies were from Santa Cruz Biotechnology, Dallas, TX), NFκB p65, NFκB p50, FOS, FOSB, FOSL1, FOSL2, JUN, JUNB, JUND, or α-tubulin (supplemental Table S3) overnight at 4 °C and washed with 0.1% Tween 20 (Sigma) in PBS. Blots were then incubated with horseradish peroxidase-conjugated goat anti-rabbit or goat anti-mouse antibody (Santa Cruz Biotechnology) for 1 h at room temperature, rewashed as above, and developed with an enhanced chemiluminescence substrate (GE Healthcare) using the ChemiDoc XRS+ system (Bio-Rad). Image Lab software, (version 5.0; Bio-Rad) was used for densitometry analysis.
Luciferase Reporter Assays
Prior to transfection (48 h), 1 × 10⁵ HEK293 cells were seeded onto 24-well plates. Cells were then transiently transfected as above with 100 ng/well GR, MR, or empty vector expression plasmids as above along with 50 ng of an internal control vector (pGL4.74/hRluc, Promega, Madison, WI). In addition, cells were simultaneously transfected with a luciferase reporter regulated by one of the following promoters: MMTV (pGL4.36(MMTV/luc2P/Hygro), Promega), NFκB (pGL 4.32(luc2P/NFκB-RE/Hygro, Promega), or AP-1, either sequence version 1 (AP-1_v1; 5′-TGAGTCAG; pGL4.44(luc2P/AP-1-RE/Hygro), Promega) or version 2 (AP-1_v2; 5′-TGACTAA; pGL4 custom/luc2P(AP-1-REv/Hygro), Promega), each with identical backbones but driven by six copies of different AP-1 consensus sequences. The luc2P (Photinus pyralis) gene contains a protein destabilization sequence to better reflect induction and reduce treatment times and signal contamination by secondary effects. Postrecovery (24 h), cells were pretreated with vehicle or steroid ligand for 1 h followed by 5 h of TNFα (10 ng/ml for NFκB), PMA (100 nm for AP-1), vehicle, or steroid alone for MMTV and then harvested for luciferase activity using a Dual-Luciferase assay kit (Promega). Luciferase activity was measured using a VICTOR3 multilabel reader (PerkinElmer Life Sciences) and normalized to the activity of the Renilla control. For MMTV assays, normalized luciferase activity is presented as activity over background (vehicle only). For the NFκB and AP-1 reporters, normalized luciferase activity is presented as activity over background (for dose-response curves) or normalized to percent maximal activity with TNFα or PMA. For siRNA experiments, cells were transfected for 24 h with 10 nm control or AP-1 family member-specific FlexiTube siRNA (Qiagen) with Lipofectamine RNAiMAX (Life Technologies). After 24 h of recovery, cells were transfected with nuclear receptor expression plasmids and reporters as described above.
Alternatively, cells were transfected with an AP-1 Renilla luciferase reporter plasmid, AP1_v1_synthRE/pLightSwitch_LR (SwitchGear Genomics, Carlsbad, CA), driven by the consensus sequence TGAGTCAGTGAGTCACTGACTCACTGACTCATGAGTCAGCTGACTCTGAGTCAGTGAGTCAG containing four copies of the 5′-TGAGTCAG (bold) consensus sequence as well as two copies of the reversed sequence 3′-TGAGTCAG (underlined) also found within the pGL4.44(luc2P/AP-1-RE/Hygro) vector (Promega) or with AP-1_v2_synthRE/pLightSwitch_LR (SwitchGear Genomics) driven by nine copies of a 5′-TGACTAA consensus sequence also found within the Promega AP-1-REv/Hygro vector and treated as above but with 20 h of steroid treatment and without concurrent transfection of a Renilla luciferase control. Regions of the human XIRP1 gene promoter (NM_194293.2) from −1200/+35, −900/+35, −600/+35, or −292/+35 from the transcriptional start site were cloned into the pGL4(luc2P/Hygro) vector backbone (Promega) by GeneCopoeia (Rockville, MD) and confirmed by sequencing. The resulting reporter plasmids were tested as described above for the AP-1 reporters from Promega.
EMSA
HEK293 cells were seeded on 100-mm plates and transiently transfected with expression plasmids as above. Postrecovery (24 h), cells were pretreated with vehicle or steroid (100 nm) for 1 h followed by 4 h of PMA (100 nm), and then nuclear extracts were prepared with NE-PER nuclear and cytoplasmic extraction reagents supplemented with Halt protease and phosphatase inhibitor mixture (ThermoScientific). The EMSA reactions were prepared using the LightShift chemiluminescent EMSA kit (Pierce) with 5 μg of nuclear extracts. Supershifts were performed using antibodies or normal rabbit IgG from Santa Cruz Biotechnology incubated with the nuclear extract/EMSA reaction for 15 min at room temperature prior to incubation with probes. Probes were 3′-biotinylated oligos (Integrated DNA Technologies, Inc.) that were annealed in 10 mm Tris, 1 mm EDTA, 50 mm NaCl, pH 8.0, buffer as follows: 5 min at 95 °C followed by cooling to 25 °C in 5 °C increments every 5 min. The sequences used were as follows: 1) AP1_v1 Forward, 5′-CGCTTGATGAGTCAGGCCGGAA-3′-biotin; 2) AP1_v1 Reverse, 5′-TTCCGGCCTGACTCATCAAGCG-3′-biotin; 3) AP1_v2 Forward, 5′-CGCTTGATGACTAAGCCGGAA-3′-biotin; and 4) AP1_v2 Reverse, 5′-TTCCGGCTTAGTCATCAAGCG-3′-biotin. EMSA reactions were electrophoresed for 2–2.5 h on 6% Tris borate-EDTA gels in 0.5× Tris borate-EDTA buffer (Life Technologies) that were prerun at 100 V for 60 min. Gels were then transferred for 45 min at 380 mA followed by cross-linking and detection.
qRT-PCR
HEK293 cells were seeded onto 35-mm plates and transiently transfected with GR, MR, or empty vector (control) expression plasmids as above. After 24-h recovery, cells were pretreated with vehicle or steroid ligands (100 nm) for 1 h followed by 4 h of PMA (10 nm). For CHX (Sigma) studies, cells were treated with vehicle or PMA (10 nm) for 2 h and then treated with vehicle or CHX (200 μg/ml) followed immediately with vehicle or DOC (100 nm) for 4 h. Complete inhibition of protein synthesis by CHX at this dose and time point was confirmed through inhibition of luciferase reporter activity. RNA was extracted using RNeasy Miniprep kits (Qiagen, Valencia, CA). Total RNA was quantified with a NanoDrop spectrophotometer (BioLabNet, Great Falls, VA), and reverse transcription was performed with a cDNA reverse transcription kit (Bio-Rad) using a thermal cycler. Gene expression assays were performed by quantitative PCR using SYBR Green primers (Integrated DNA Technologies, Inc.; supplemental Table S4) on a ViiA7 cycler (Life Technologies). Target gene expression was normalized to GAPDH or β-actin. A threshold of greater than 3-fold change compared with vehicle alone was chosen to consider a gene as TNFα- or PMA-induced.
Site-directed Mutagenesis
Site-directed mutagenesis was performed using the QuikChange II XL site-directed mutagenesis kit (Agilent, Santa Clara, CA) with an 8-min extension time. Primers for mutation of wild-type human GR (hGR-DDK-myc/pCMV6, Origene) to GR-K442A were 5′-GTCTTAACTTGTGGAAGCTGTGCAGTTTTCTTCAAAAGAGCAG (sense) and 5′-CTGCTCTTTTGAAGAAAACTGCACAGCTTCCACAAGTTAAGAC (antisense). Primers for mutation of wild-type MR (hMR-DDK-myc/pCMV6, Origene) to MR-K624A were 5′-AGTCAACCTGTGGCAGCTGCGCAGTTTTCTTCAAAAGAGCA (sense) and 5′-TGCTCTTTTGAAGAAAACTGCGCAGCTGCCACAGGTGACT (antisense).
TransAM Assays
Nuclear extracts (5 μg) were prepared as above for TransAM assays (Active Motif, Carlsbad, CA) with immobilized NFκB or AP-1 consensus oligonucleotides. Colorimetric reactions were developed for 3–6 min and read on a microplate spectrophotometer at 450 nm with a reference wavelength of 655 nm.
Oligonucleotide Microarrays
Cells were transfected with MR as above and treated with vehicle alone, DOC (100 nm), PMA (10 nm), or DOC plus PMA. Total RNA was isolated using RNeasy Miniprep kits (Qiagen). Quality of total RNA was evaluated using RNA 6000 Nano LabChip (Agilent 2100 Bioanalyzer). All samples had intact 18S and 28S ribosomal RNA bands with RNA integrity number values from 9.8 to 10 and RNA 260/280 ratios between 1.9 and 2.0. Total RNA (150 ng) was reverse transcribed (GeneChip 3′ IVT Express kit, Affymetrix), and resulting cRNA was labeled (Affymetrix GeneChip WT terminal labeling kit). Labeled and fragmented cRNA was hybridized for 18 h to PrimeView human gene expression arrays (Affymetrix, Santa Clara, CA). Arrays were then stained and washed in the Affymetrix Fluidics Station 400 and scanned (Affymetrix 7G).
Statistical Analysis
Dose-response curves were fitted using the four-parameter logistic nonlinear regression model in SigmaPlot® 11 (Systat Software, Inc., Chicago, IL) with a dynamic curve. For quantitative PCR, TNFα- or PMA-stimulated NFκB and AP-1 reporter activity in the absence of ligand (vehicle only) was normalized to 100%, and the effect of each receptor/steroid combination was expressed relative to this value for ease of visual interpretation. However, to ensure that displaying these results in this fashion was appropriate, all control values across the various experimental conditions were first shown to be highly similar by t test. Data are presented as TNFα- or PMA-normalized mean -fold changes ±geometric S.E. with activity levels for each receptor/steroid compared with this value. Statistical analyses were carried out on log-transformed data when necessary for normality assumption using JMP® version 11 (SAS® Institute Inc., Cary, NC). Analysis of variance models with appropriate blocking were used to test the effects of nominal factors and their interactions. Non-significant factors were dropped from statistical models to report final p values. Post hoc contrasts of interest were tested directly when significant interactions precluded the reporting of main effects. Paired t tests were only used for two-condition comparisons as appropriate. All p values are two-sided, and p < 0.05 was considered significant.
Microarray signal intensity values were assessed using the procedure of “3′-Expression Array-RMA” in Expression ConsoleTM (Affymetrix). All 16 chips (four replicates for four conditions of vehicle control, DOC, PMA, and DOC + PMA) were within bounds. The probe set results were annotated and exported to perform a single analysis of variance using the MSCLtoolbox. Three post hoc contrasts with the following characteristics were generated using the resulting group mean estimates and mean square error estimates to select transcripts 1) unaffected by DOC alone (DOC (100 nm) versus vehicle), 2) induced by PMA (PMA (10 nm) versus vehicle), and 3) further repressed or activated by the addition of DOC to PMA (PMA + DOC versus PMA). Each post hoc t test produced a column of p values from which false discovery rates were calculated. Because DOC had much smaller effects than PMA, transcripts potentially regulated by DOC, either through HRE sites or tethering to AP-1 complexes, were non-stringently identified using a raw nominal p value ≤0.05, whereas the PMA versus vehicle list was generated using a false discovery rate ≤0.05 and -fold change ≥1.5. Genes were selected as possibly trans-regulated when found on the PMA + DOC versus PMA list and PMA versus vehicle list but not on the DOC versus vehicle list. As the trans-regulated gene list generated using this strategy was not rigorously controlled for false hits, all candidate genes with consistent -fold changes were confirmed using qRT-PCR.
Author Contributions
E. J. D., J. M. E., and R. L. D. designed the study. E. J. D., G. A. F., and A. H. performed experiments. R. C., J. S., and S. W. performed statistical analyses. E. J. D., G. A. F., and K. P. B. designed figures. All authors analyzed the results and approved the final version of the manuscript.
Supplementary Material
Acknowledgments
We thank Drs. Gomez-Sanchez at the University of Mississippi Medical Center for kindly sharing monoclonal antibody against the mineralocorticoid receptor. We also appreciate the help of Kelly Byrne for editing and formatting the manuscript and figures.
This work was supported by National Institutes of Health intramural funds. The authors declare that they have no conflicts of interest with the contents of this article. The content is solely the responsibility of the authors and does not necessarily represent the official views of the National Institutes of Health.

This article contains supplemental Tables S1–S4.
- GR
- glucocorticoid receptor
- MR
- mineralocorticoid receptor
- ALD
- aldosterone
- DOC
- deoxycorticosterone acetate
- DEX
- dexamethasone
- BUD
- budesonide
- PMA
- phorbol 12-myristate-13-acetate
- HRE
- hormone response element
- NHMC
- normal human mesangial cell
- Amax
- maximal effect
- MMTV
- mouse mammary tumor virus
- luc
- luciferase
- CHX
- cycloheximide
- SGK1
- serum- and glucocorticoid-inducible protein kinase-1
- qRT-PCR
- quantitative real time PCR
- XIRP1
- xin actin-binding repeat-containing 1
- SERPINE1
- serpin peptidase inhibitor, clade E, member 1
- PLAT
- tissue plasminogen activator
- Bis-Tris
- 2-[bis(2-hydroxyethyl)amino]-2-(hydroxymethyl)propane-1,3-diol
- NCOA
- nuclear receptor coactivator
- NCOR
- nuclear receptor corepressor
- MAF
- v-maf avian musculoaponeurotic fibrosarcoma oncogene homolog.
References
- 1. Hench P. S., Kendall E. C., Slocumb C. H., and Polley H. F. (1949) The effect of a hormone of the adrenal cortex (17-hydroxy-11-dehydrocorticosterone: compound E) and of pituitary adrenocortical hormone in arthritis: preliminary report. Ann. Rheum. Dis. 8, 97–104 [DOI] [PMC free article] [PubMed] [Google Scholar]
- 2. Brown N. J. (2008) Aldosterone and vascular inflammation. Hypertension 51, 161–167 [DOI] [PubMed] [Google Scholar]
- 3. Pitt B., Zannad F., Remme W. J., Cody R., Castaigne A., Perez A., Palensky J., and Wittes J. (1999) The effect of spironolactone on morbidity and mortality in patients with severe heart failure. Randomized Aldactone Evaluation Study Investigators. N. Engl. J. Med. 341, 709–717 [DOI] [PubMed] [Google Scholar]
- 4. Pitt B., Remme W., Zannad F., Neaton J., Martinez F., Roniker B., Bittman R., Hurley S., Kleiman J., Gatlin M., and Eplerenone Post-Acute Myocardial Infarction Heart Failure Efficacy and Survival Study Investigators (2003) Eplerenone, a selective aldosterone blocker, in patients with left ventricular dysfunction after myocardial infarction. N. Engl. J. Med. 348, 1309–1321 [DOI] [PubMed] [Google Scholar]
- 5. Rossignol P., Ménard J., Fay R., Gustafsson F., Pitt B., and Zannad F. (2011) Eplerenone survival benefits in heart failure patients post-myocardial infarction are independent from its diuretic and potassium-sparing effects. Insights from an EPHESUS (Eplerenone Post-Acute Myocardial Infarction Heart Failure Efficacy and Survival Study) substudy. J. Am. Coll Cardiol 58, 1958–1966 [DOI] [PubMed] [Google Scholar]
- 6. Beato M., Herrlich P., and Schütz G. (1995) Steroid hormone receptors: many actors in search of a plot. Cell 83, 851–857 [DOI] [PubMed] [Google Scholar]
- 7. Guiochon-Mantel A., Delabre K., Lescop P., and Milgrom E. (1996) Intracellular traffic of steroid hormone receptors. J. Steroid Biochem. Mol. Biol. 56, 3–9 [DOI] [PubMed] [Google Scholar]
- 8. Mangelsdorf D. J., Thummel C., Beato M., Herrlich P., Schütz G., Umesono K., Blumberg B., Kastner P., Mark M., Chambon P., and Evans R. M. (1995) The nuclear receptor superfamily: the second decade. Cell 83, 835–839 [DOI] [PMC free article] [PubMed] [Google Scholar]
- 9. Mittelstadt P. R., and Ashwell J. D. (2001) Inhibition of AP-1 by the glucocorticoid-inducible protein GILZ. J. Biol. Chem. 276, 29603–29610 [DOI] [PubMed] [Google Scholar]
- 10. King E. M., Holden N. S., Gong W., Rider C. F., and Newton R. (2009) Inhibition of NF-κB-dependent transcription by MKP-1: transcriptional repression by glucocorticoids occurring via p38 MAPK. J. Biol. Chem. 284, 26803–26815 [DOI] [PMC free article] [PubMed] [Google Scholar]
- 11. Ray A., LaForge K. S., and Sehgal P. B. (1990) On the mechanism for efficient repression of the interleukin-6 promoter by glucocorticoids: enhancer, TATA box, and RNA start site (Inr motif) occlusion. Mol. Cell. Biol. 10, 5736–5746 [DOI] [PMC free article] [PubMed] [Google Scholar]
- 12. Strömstedt P. E., Poellinger L., Gustafsson J. A., and Carlstedt-Duke J. (1991) The glucocorticoid receptor binds to a sequence overlapping the TATA box of the human osteocalcin promoter: a potential mechanism for negative regulation. Mol. Cell. Biol. 11, 3379–3383 [DOI] [PMC free article] [PubMed] [Google Scholar]
- 13. Diamond M. I., Miner J. N., Yoshinaga S. K., and Yamamoto K. R. (1990) Transcription factor interactions: selectors of positive or negative regulation from a single DNA element. Science 249, 1266–1272 [DOI] [PubMed] [Google Scholar]
- 14. Jonat C., Rahmsdorf H. J., Park K. K., Cato A. C., Gebel S., Ponta H., and Herrlich P. (1990) Antitumor promotion and antiinflammation: down-modulation of AP-1 (Fos/Jun) activity by glucocorticoid hormone. Cell 62, 1189–1204 [DOI] [PubMed] [Google Scholar]
- 15. Scheinman R. I., Gualberto A., Jewell C. M., Cidlowski J. A., and Baldwin A. S. Jr. (1995) Characterization of mechanisms involved in transrepression of NF-κB by activated glucocorticoid receptors. Mol. Cell. Biol. 15, 943–953 [DOI] [PMC free article] [PubMed] [Google Scholar]
- 16. Reichardt H. M., Tuckermann J. P., Göttlicher M., Vujic M., Weih F., Angel P., Herrlich P., and Schütz G. (2001) Repression of inflammatory responses in the absence of DNA binding by the glucocorticoid receptor. EMBO J. 20, 7168–7173 [DOI] [PMC free article] [PubMed] [Google Scholar]
- 17. Glass C. K., and Saijo K. (2010) Nuclear receptor transrepression pathways that regulate inflammation in macrophages and T cells. Nat. Rev. Immunol. 10, 365–376 [DOI] [PubMed] [Google Scholar]
- 18. Moss M. E., and Jaffe I. Z. (2015) Mineralocorticoid receptors in the pathophysiology of vascular inflammation and atherosclerosis. Front. Endocrinol. 6, 153. [DOI] [PMC free article] [PubMed] [Google Scholar]
- 19. Brown N. J. (2013) Contribution of aldosterone to cardiovascular and renal inflammation and fibrosis. Nat. Rev. Nephrol. 9, 459–469 [DOI] [PMC free article] [PubMed] [Google Scholar]
- 20. Funder J. W. (2004) Aldosterone, mineralocorticoid receptors and vascular inflammation. Mol. Cell. Endocrinol. 217, 263–269 [DOI] [PubMed] [Google Scholar]
- 21. Gilbert K. C., and Brown N. J. (2010) Aldosterone and inflammation. Curr. Opin. Endocrinol. Diabetes Obes. 17, 199–204 [DOI] [PMC free article] [PubMed] [Google Scholar]
- 22. Tostes R. C., Touyz R. M., He G., Chen X., and Schiffrin E. L. (2002) Contribution of endothelin-1 to renal activator protein-1 activation and macrophage infiltration in aldosterone-induced hypertension. Clin. Sci. 103, Suppl. 48, 25S–30S [DOI] [PubMed] [Google Scholar]
- 23. Fukuda S., Horimai C., Harada K., Wakamatsu T., Fukasawa H., Muto S., Itai A., and Hayashi M. (2011) Aldosterone-induced kidney injury is mediated by NFκB activation. Clin. Exp. Nephrol. 15, 41–49 [DOI] [PMC free article] [PubMed] [Google Scholar]
- 24. Sønder S. U., Mikkelsen M., Rieneck K., Hedegaard C. J., and Bendtzen K. (2006) Effects of spironolactone on human blood mononuclear cells: mineralocorticoid receptor independent effects on gene expression and late apoptosis induction. Br. J. Pharmacol. 148, 46–53 [DOI] [PMC free article] [PubMed] [Google Scholar]
- 25. Leroy V., De Seigneux S., Agassiz V., Hasler U., Rafestin-Oblin M. E., Vinciguerra M., Martin P. Y., and Féraille E. (2009) Aldosterone activates NF-κB in the collecting duct. J. Am. Soc. Nephrol 20, 131–144 [DOI] [PMC free article] [PubMed] [Google Scholar]
- 26. Terada Y., Ueda S., Hamada K., Shimamura Y., Ogata K., Inoue K., Taniguchi Y., Kagawa T., Horino T., and Takao T. (2012) Aldosterone stimulates nuclear factor-κB activity and transcription of intercellular adhesion molecule-1 and connective tissue growth factor in rat mesangial cells via serum- and glucocorticoid-inducible protein kinase-1. Clin. Exp. Nephrol. 16, 81–88 [DOI] [PubMed] [Google Scholar]
- 27. Lemarié C. A., Simeone S. M., Nikonova A., Ebrahimian T., Deschênes M. E., Coffman T. M., Paradis P., and Schiffrin E. L. (2009) Aldosterone-induced activation of signaling pathways requires activity of angiotensin type 1a receptors. Circ. Res. 105, 852–859 [DOI] [PubMed] [Google Scholar]
- 28. Zhu C. J., Wang Q. Q., Zhou J. L., Liu H. Z., Hua F., Yang H. Z., and Hu Z. W. (2012) The mineralocorticoid receptor-p38MAPK-NFκB or ERK-Sp1 signal pathways mediate aldosterone-stimulated inflammatory and profibrotic responses in rat vascular smooth muscle cells. Acta Pharmacol. Sin. 33, 873–878 [DOI] [PMC free article] [PubMed] [Google Scholar]
- 29. Gros R., Ding Q., Sklar L. A., Prossnitz E. E., Arterburn J. B., Chorazyczewski J., and Feldman R. D. (2011) GPR30 expression is required for the mineralocorticoid receptor-independent rapid vascular effects of aldosterone. Hypertension 57, 442–451 [DOI] [PMC free article] [PubMed] [Google Scholar]
- 30. Liden J., Delaunay F., Rafter I., Gustafsson J., and Okret S. (1997) A new function for the C-terminal zinc finger of the glucocorticoid receptor. Repression of RelA transactivation. J. Biol. Chem. 272, 21467–21472 [DOI] [PubMed] [Google Scholar]
- 31. Meijer O. C., Williamson A., Dallman M. F., and Pearce D. (2000) Transcriptional repression of the 5-HT1A receptor promoter by corticosterone via mineralocorticoid receptors depends on the cellular context. J. Neuroendocrinol. 12, 245–254 [DOI] [PubMed] [Google Scholar]
- 32. Pearce D., and Yamamoto K. R. (1993) Mineralocorticoid and glucocorticoid receptor activities distinguished by nonreceptor factors at a composite response element. Science 259, 1161–1165 [DOI] [PubMed] [Google Scholar]
- 33. Heck S., Kullmann M., Gast A., Ponta H., Rahmsdorf H. J., Herrlich P., and Cato A. C. (1994) A distinct modulating domain in glucocorticoid receptor monomers in the repression of activity of the transcription factor AP-1. EMBO J. 13, 4087–4095 [DOI] [PMC free article] [PubMed] [Google Scholar]
- 34. Paakinaho V., Kaikkonen S., Makkonen H., Benes V., and Palvimo J. J. (2014) SUMOylation regulates the chromatin occupancy and anti-proliferative gene programs of glucocorticoid receptor. Nucleic Acids Res. 42, 1575–1592 [DOI] [PMC free article] [PubMed] [Google Scholar]
- 35. Ziera T., Irlbacher H., Fromm A., Latouche C., Krug S. M., Fromm M., Jaisser F., and Borden S. A. (2009) Cnksr3 is a direct mineralocorticoid receptor target gene and plays a key role in the regulation of the epithelial sodium channel. FASEB J. 23, 3936–3946 [DOI] [PubMed] [Google Scholar]
- 36. Rupprecht R., Reul J. M., van Steensel B., Spengler D., Söder M., Berning B., Holsboer F., and Damm K. (1993) Pharmacological and functional characterization of human mineralocorticoid and glucocorticoid receptor ligands. Eur. J. Pharmacol. 247, 145–154 [DOI] [PubMed] [Google Scholar]
- 37. Vinson G. P. (2011) The mislabelling of deoxycorticosterone: making sense of corticosteroid structure and function. J. Endocrinol. 211, 3–16 [DOI] [PubMed] [Google Scholar]
- 38. Simons S. S., Jr. (2008) What goes on behind closed doors: physiological versus pharmacological steroid hormone actions. BioEssays 30, 744–756 [DOI] [PMC free article] [PubMed] [Google Scholar]
- 39. De Bosscher K., Vanden Berghe W., Beck I. M., Van Molle W., Hennuyer N., Hapgood J., Libert C., Staels B., Louw A., and Haegeman G. (2005) A fully dissociated compound of plant origin for inflammatory gene repression. Proc. Natl. Acad. Sci. U.S.A. 102, 15827–15832 [DOI] [PMC free article] [PubMed] [Google Scholar]
- 40. Ray A., and Prefontaine K. E. (1994) Physical association and functional antagonism between the p65 subunit of transcription factor NF-κB and the glucocorticoid receptor. Proc. Natl. Acad. Sci. U.S.A. 91, 752–756 [DOI] [PMC free article] [PubMed] [Google Scholar]
- 41. Bladh L. G., Lidén J., Dahlman-Wright K., Reimers M., Nilsson S., and Okret S. (2005) Identification of endogenous glucocorticoid repressed genes differentially regulated by a glucocorticoid receptor mutant able to separate between nuclear factor-κB and activator protein-1 repression. Mol. Pharmacol. 67, 815–826 [DOI] [PubMed] [Google Scholar]
- 42. Zhou H., Zarubin T., Ji Z., Min Z., Zhu W., Downey J. S., Lin S., and Han J. (2005) Frequency and distribution of AP-1 sites in the human genome. DNA Res. 12, 139–150 [DOI] [PubMed] [Google Scholar]
- 43. Meyer T., Starr D. B., and Carlstedt-Duke J. (1997) The rat glucocorticoid receptor mutant K461A differentiates between two different mechanisms of transrepression. J. Biol. Chem. 272, 21090–21095 [DOI] [PubMed] [Google Scholar]
- 44. Starr D. B., Matsui W., Thomas J. R., and Yamamoto K. R. (1996) Intracellular receptors use a common mechanism to interpret signaling information at response elements. Genes Dev. 10, 1271–1283 [DOI] [PubMed] [Google Scholar]
- 45. Matys V., Kel-Margoulis O. V., Fricke E., Liebich I., Land S., Barre-Dirrie A., Reuter I., Chekmenev D., Krull M., Hornischer K., Voss N., Stegmaier P., Lewicki-Potapov B., Saxel H., Kel A. E., et al. (2006) TRANSFAC and its module TRANSCompel: transcriptional gene regulation in eukaryotes. Nucleic Acids Res. 34, D108–D110 [DOI] [PMC free article] [PubMed] [Google Scholar]
- 46. Nishikawa T., Suematsu S., Saito J., Soyama A., Ito H., Kino T., and Chrousos G. (2005) Human renal mesangial cells produce aldosterone in response to low-density lipoprotein (LDL). J. Steroid Biochem. Mol. Biol. 96, 309–316 [DOI] [PubMed] [Google Scholar]
- 47. Nishiyama A., Yao L., Fan Y., Kyaw M., Kataoka N., Hashimoto K., Nagai Y., Nakamura E., Yoshizumi M., Shokoji T., Kimura S., Kiyomoto H., Tsujioka K., Kohno M., Tamaki T., et al. (2005) Involvement of aldosterone and mineralocorticoid receptors in rat mesangial cell proliferation and deformability. Hypertension 45, 710–716 [DOI] [PubMed] [Google Scholar]
- 48. Nissen R. M., and Yamamoto K. R. (2000) The glucocorticoid receptor inhibits NFκB by interfering with serine-2 phosphorylation of the RNA polymerase II carboxy-terminal domain. Genes Dev. 14, 2314–2329 [DOI] [PMC free article] [PubMed] [Google Scholar]
- 49. De Bosscher K., Schmitz M. L., Vanden Berghe W., Plaisance S., Fiers W., and Haegeman G. (1997) Glucocorticoid-mediated repression of nuclear factor-κB dependent transcription involves direct interference with transactivation. Proc. Natl. Acad. Sci. U.S.A. 94, 13504–13509 [DOI] [PMC free article] [PubMed] [Google Scholar]
- 50. Heck S., Bender K., Kullmann M., Göttlicher M., Herrlich P., and Cato A. C. (1997) IκBα-independent downregulation of NF-κB activity by glucocorticoid receptor. EMBO J. 16, 4698–4707 [DOI] [PMC free article] [PubMed] [Google Scholar]
- 51. König H., Ponta H., Rahmsdorf H. J., and Herrlich P. (1992) Interference between pathway-specific transcription factors: glucocorticoids antagonize phorbol ester-induced AP-1 activity without altering AP-1 site occupation in vivo. EMBO J. 11, 2241–2246 [DOI] [PMC free article] [PubMed] [Google Scholar]
- 52. Biddie S. C., John S., Sabo P. J., Thurman R. E., Johnson T. A., Schiltz R. L., Miranda T. B., Sung M. H., Trump S., Lightman S. L., Vinson C., Stamatoyannopoulos J. A., and Hager G. L. (2011) Transcription factor AP1 potentiates chromatin accessibility and glucocorticoid receptor binding. Mol. Cell 43, 145–155 [DOI] [PMC free article] [PubMed] [Google Scholar]
- 53. Miner J. N., and Yamamoto K. R. (1992) The basic region of AP-1 specifies glucocorticoid receptor activity at a composite response element. Genes Dev. 6, 2491–2501 [DOI] [PubMed] [Google Scholar]
- 54. Suzukawa K., and Colburn N. H. (2002) AP-1 transrepressing retinoic acid does not deplete coactivators or AP-1 monomers but may target specific Jun or Fos containing dimers. Oncogene 21, 2181–2190 [DOI] [PubMed] [Google Scholar]
- 55. Diefenbacher M., Sekula S., Heilbock C., Maier J. V., Litfin M., van Dam H., Castellazzi M., Herrlich P., and Kassel O. (2008) Restriction to Fos family members of Trip6-dependent coactivation and glucocorticoid receptor-dependent trans-repression of activator protein-1. Mol. Endocrinol. 22, 1767–1780 [DOI] [PMC free article] [PubMed] [Google Scholar]
- 56. Rajaram N., and Kerppola T. K. (1997) DNA bending by Fos-Jun and the orientation of heterodimer binding depend on the sequence of the AP-1 site. EMBO J. 16, 2917–2925 [DOI] [PMC free article] [PubMed] [Google Scholar]
- 57. Leung T. H., Hoffmann A., and Baltimore D. (2004) One nucleotide in a κB site can determine cofactor specificity for NF-κB dimers. Cell 118, 453–464 [DOI] [PubMed] [Google Scholar]
- 58. Ronacher K., Hadley K., Avenant C., Stubsrud E., Simons S. S. Jr., Louw A., and Hapgood J. P. (2009) Ligand-selective transactivation and transrepression via the glucocorticoid receptor: role of cofactor interaction. Mol. Cell. Endocrinol. 299, 219–231 [DOI] [PubMed] [Google Scholar]
- 59. Rollins D. A., Coppo M., and Rogatsky I. (2015) Minireview: nuclear receptor coregulators of the p160 family: insights into inflammation and metabolism. Mol. Endocrinol. 29, 502–517 [DOI] [PMC free article] [PubMed] [Google Scholar]
- 60. Rogatsky I., Zarember K. A., and Yamamoto K. R. (2001) Factor recruitment and TIF2/GRIP1 corepressor activity at a collagenase-3 response element that mediates regulation by phorbol esters and hormones. EMBO J. 20, 6071–6083 [DOI] [PMC free article] [PubMed] [Google Scholar]
- 61. Rogatsky I., Luecke H. F., Leitman D. C., and Yamamoto K. R. (2002) Alternate surfaces of transcriptional coregulator GRIP1 function in different glucocorticoid receptor activation and repression contexts. Proc. Natl. Acad. Sci. U.S.A. 99, 16701–16706 [DOI] [PMC free article] [PubMed] [Google Scholar]
- 62. Chen-Park F. E., Huang D.-B., Noro B., Thanos D., and Ghosh G. (2002) The κB DNA sequence from the HIV long terminal repeat functions as an allosteric regulator of HIV transcription. J. Biol. Chem. 277, 24701–24708 [DOI] [PubMed] [Google Scholar]
- 63. Newton R., and Holden N. S. (2007) Separating transrepression and transactivation: a distressing divorce for the glucocorticoid receptor? Mol. Pharmacol. 72, 799–809 [DOI] [PubMed] [Google Scholar]
- 64. Surjit M., Ganti K. P., Mukherji A., Ye T., Hua G., Metzger D., Li M., and Chambon P. (2011) Widespread negative response elements mediate direct repression by agonist-liganded glucocorticoid receptor. Cell 145, 224–241 [DOI] [PubMed] [Google Scholar]
- 65. Dostert A., and Heinzel T. (2004) Negative glucocorticoid receptor response elements and their role in glucocorticoid action. Curr. Pharm. Des. 10, 2807–2816 [DOI] [PubMed] [Google Scholar]
- 66. Schiller B. J., Chodankar R., Watson L. C., Stallcup M. R., and Yamamoto K. R. (2014) Glucocorticoid receptor binds half sites as a monomer and regulates specific target genes. Genome Biol. 15, 418. [DOI] [PMC free article] [PubMed] [Google Scholar]
- 67. Mertens I., and Van Gaal L. F. (2002) Obesity, haemostasis and the fibrinolytic system. Obes. Rev. 3, 85–101 [DOI] [PubMed] [Google Scholar]
- 68. Miller D. T., Ridker P. M., Libby P., and Kwiatkowski D. J. (2007) Atherosclerosis: the path from genomics to therapeutics. J. Am. Coll. Cardiol. 49, 1589–1599 [DOI] [PubMed] [Google Scholar]
- 69. Cerillo G., Rees A., Manchanda N., Reilly C., Brogan I., White A., and Needham M. (1998) The oestrogen receptor regulates NFκB and AP-1 activity in a cell-specific manner. J. Steroid Biochem. Mol. Biol. 67, 79–88 [DOI] [PubMed] [Google Scholar]
- 70. Kushner P. J., Agard D. A., Greene G. L., Scanlan T. S., Shiau A. K., Uht R. M., and Webb P. (2000) Estrogen receptor pathways to AP-1. J. Steroid Biochem. Mol. Biol. 74, 311–317 [DOI] [PubMed] [Google Scholar]
- 71. Paech K., Webb P., Kuiper G. G., Nilsson S., Gustafsson J., Kushner P. J., and Scanlan T. S. (1997) Differential ligand activation of estrogen receptors ERα and ERβ at AP1 sites. Science 277, 1508–1510 [DOI] [PubMed] [Google Scholar]
- 72. Teyssier C., Belguise K., Galtier F., Cavailles V., and Chalbos D. (2003) Receptor-interacting protein 140 binds c-Jun and inhibits estradiol-induced activator protein-1 activity by reversing glucocorticoid receptor-interacting protein 1 effect. Mol. Endocrinol. 17, 287–299 [DOI] [PubMed] [Google Scholar]
- 73. Church D. R., Lee E., Thompson T. A., Basu H. S., Ripple M. O., Ariazi E. A., and Wilding G. (2005) Induction of AP-1 activity by androgen activation of the androgen receptor in LNCaP human prostate carcinoma cells. Prostate 63, 155–168 [DOI] [PubMed] [Google Scholar]
- 74. Pierotti S., Lolli F., Lauretta R., Graziadio C., Di Dato C., Sbardella E., Tarsitano M. G., Isidori A., Bonifacio V., Lenzi A., and Isidori A. M. (2010) Androgen modulation of pro-inflammatory and anti-inflammatory cytokines during preadipocyte differentiation. Horm. Mol. Biol. Clin. Investig. 4, 483–488 [DOI] [PubMed] [Google Scholar]
- 75. Ripple M. O., Henry W. F., Schwarze S. R., Wilding G., and Weindruch R. (1999) Effect of antioxidants on androgen-induced AP-1 and NF-κB DNA-binding activity in prostate carcinoma cells. J. Natl. Cancer Inst. 91, 1227–1232 [DOI] [PubMed] [Google Scholar]
- 76. Gomez-Sanchez C. E., de Rodriguez A. F., Romero D. G., Estess J., Warden M. P., Gomez-Sanchez M. T., and Gomez-Sanchez E. P. (2006) Development of a panel of monoclonal antibodies against the mineralocorticoid receptor. Endocrinology 147, 1343–1348 [DOI] [PubMed] [Google Scholar]
Associated Data
This section collects any data citations, data availability statements, or supplementary materials included in this article.