Summary
The Ikaros family of transcription factors is essential for normal T‐cell development, but their expression pattern in human thymocytes remains poorly defined. Our goal is to determine how protein levels of Ikaros, Helios and Aiolos change as human thymocytes progress through the positive selection and lineage commitment stages. To accomplish this goal, we used multi‐parameter flow cytometry to define the populations in which positive selection and lineage commitment are most likely to occur. After human thymocytes express CD3 and receive positive selection signals, the cells down‐regulate expression of CD4 to become transitional single‐positive (TSP) CD8+ thymocytes. At this stage, there was a transient increase in the Ikaros, Helios and Aiolos protein levels. After the TSP CD8+ developmental stage, some thymocytes re‐express CD4 and become CD3hi double‐positive thymocytes before down‐regulating CD8 to become mature single‐positive CD4+ thymocytes. Except for regulatory T cells, Helios protein levels declined and Aiolos protein levels transiently increased during CD4+ T‐cell maturation. For thymocytes progressing toward the CD8+ T‐cell lineage, TSP CD8+ thymocytes increase their expression of CD3 and maintain high levels of Aiolos protein as the cells complete their maturation. In summary, we defined the TSP CD8+ developmental stage in human T‐cell development and propose that this stage is where CD4/CD8 lineage commitment occurs. Ikaros, Helios and Aiolos each undergo a transient increase in protein levels at the TSP stage before diverging in their expression patterns at later stages.
Keywords: human, Ikaros, T‐cell development, thymus
Abbreviations
- DN
double negative
- DP
double positive
- MSP
mature single positive
- SP
single positive
- TCR
T‐cell receptor
- TSP
transitional single positive
Introduction
Human T‐cell development is a multi‐step process of selection, proliferation and maturation that produces functional T cells able to participate in an immune response. Immature T cells enter the thymus as CD4– CD8– double‐negative (DN) thymocytes and, during the DN developmental stage, begin rearranging the genomic loci encoding the T‐cell receptor (TCR) chains.1, 2 After the DN stage, thymocytes express CD4 to become immature single‐positive (SP) CD4+ thymocytes and then express CD8 to become double‐positive (DP) thymocytes. Rearrangement of the genomic locus encoding TCR‐β is completed during the immature SP or DP developmental stages and expression of TCR‐α can be detected within the DP stage (Mitchell JL, Seng A, Yankee TM, in revision).2, 3, 4, 5, 6
After expression of TCR‐α and TCR‐β, thymocytes are subjected to positive and negative selection, ensuring the production of T cells that express a functional TCR with limited autoreactivity. Selection requires engagement of the TCR and leads to expression of activation markers, such as CD69 and CD5, and increased expression of CD3.7, 8, 9, 10, 11 Positive selection induces continued thymocyte maturation, including commitment to the SP CD4+ or SP CD8+ lineages.
The lack of clarity regarding the cell populations in which developmental milestones occur has led to competing models of thymic selection and lineage commitment. Positive selection is proposed to occur at the DP developmental stage, when CD4 and CD8 are both available to bind MHC. A possible model of lineage commitment is that positive selection stochastically induces down‐regulation of either CD4 or CD8. In this model, T‐cell maturation is dependent on the random chance that the remaining co‐receptor has the same MHC specificity as the TCR. Alternatively, CD4 and CD8 may induce distinct signals that drive lineage commitment and the down‐regulation of the opposing co‐receptor.
A third model of CD4/CD8 lineage commitment emerged from studies in murine models where a transitional single‐positive (TSP) CD4+ CD8lo thymocyte population has been described.12, 13, 14, 15 According to this model, positive selection induces decreased CD8 expression.16, 17, 18, 19 This model posits that down‐regulation of CD8 interrupts the MHC/TCR interaction in MHC I‐restricted thymocytes, whereas signalling is maintained in MHC II‐restricted thymocytes, thereby differentiating between the two lineages. This model is supported by data showing that prolonged signalling after positive selection results in the preferential development of SP CD4+ thymocytes, whereas short‐lived signals lead to the production of SP CD8+ thymocytes.20, 21
A family of proteins proposed to regulate positive selection and lineage commitment is the Ikaros family of transcription factors. This family regulates numerous steps of T‐cell development, including CD4 and CD8 expression, survival and proliferation.22, 23, 24, 25, 26, 27, 28, 29, 30, 31, 32 Disrupting the function of the Ikaros family in murine thymocytes results in the accumulation of TSP CD4+ thymocytes and increased proliferation and apoptosis.33 These data suggest that one or more Ikaros family members are critical for positive selection or lineage commitment.
In this manuscript, we provide the most detailed map of the developmental stages surrounding positive selection and lineage commitment yet reported in the human thymus. In addition, we will define how expression of Ikaros, Helios and Aiolos changes during this time.
Materials and methods
Human thymocytes
After obtaining consent from the parent or guardian, human thymus samples were obtained from children (0–18 years) who underwent corrective surgery at Children's Mercy Hospital (Kansas City, MO) for congenital cardiac defects. De‐identified tissue samples void of any clinical data were obtained in compliance with the Institutional Review Boards at our institutions. Each figure represents cells from one thymus and the indicated numbers of thymi from separate subjects were collected to ensure reproducibility.
Antibodies, cell labelling and flow cytometry
The anti‐human antibodies, anti‐CD1a‐peridinin chlorophyll protein (PerCP)‐Cy5.5, anti‐CD3− allophycocyanin‐Cy7, anti‐CD4‐Pacific Blue, anti‐CD7‐allophycocyanin, anti‐CD7‐FITC, anti‐CD7‐phycoerythrin (PE), anti‐CD8α‐Brilliant Violet (BV) 785, anti‐CD25‐PerCP‐Cy5.5, anti‐CD28‐Pacific Blue, anti‐CD38‐Alexa Fluor (AF) 700, anti‐CD44‐PE‐Cy7, anti‐CD45RO‐PE‐Cy5, anti‐CD69‐BV650, anti‐FoxP3‐PE, anti‐FoxP3‐AF647, anti‐Helios‐AF647, anti‐TCR‐γδ‐FITC, Armenian hamster IgG‐AF647 control and mouse IgG1κ‐PE control were purchased from Biolegend (San Diego, CA). Anti‐CD4‐PE‐eFlour 610, anti‐CD8β‐PE‐Cy7 and anti‐CD44‐PE were purchased from eBioscience (San Diego, CA), and anti‐CD27‐Horizon V500, anti‐Ikaros‐PE, anti‐Aiolos‐PE and mouse IgG1κ‐PE control were purchased from BD Biosciences (San Jose, CA). Armenian hamster IgG‐AF647 was purchased from Biolegend.
Single‐cell suspensions of human thymocytes were labelled on their surface as previously described.34 For intracellular staining, surface‐labelled cells were fixed and permeabilized using the Foxp3/Transcription Factor Staining Buffer Set (Affymetrix/eBioscience, San Diego, CA), according to the manufacturer's instructions. Cells were analysed using a BD LSR II (BD Biosciences) and data were analysed using BD FACSdiva software (BD Biosciences) or flowjo (TreeStar Inc., Ashland, OR). Relative expression of Ikaros, Helios and Aiolos in each cell population was defined as the ratio of the geometric mean fluorescence intensity of each Ikaros family member to the corresponding isotype control. Representative dot plots are shown from one thymus out of 11 analysed for all surface markers except CD28. Representative dot plots of CD28 expression are shown for one thymus out of four analysed.
Statistical analysis
For comparisons across groups, the paired t‐test analysis or the repeated measure analysis of varaince with Tukey post hoc test were performed using graphpad prism (GraphPad Software Inc., La Jolla, CA), and significance was defined as P < 0·05.
Results
Human thymocytes progress through a CD8+ CD4lo transitional SP stage
In mice, thymocytes progress from the CD3lo DP developmental stage to the CD4+ CD8lo TSP stage.12, 13, 14, 15 To determine whether a comparable developmental stage might exist in humans, we examined CD69 and CD27 expression on CD3lo thymocytes (Fig. 1). Cells were divided into CD69− CD27−, CD69+ CD27− and CD69+ CD27+ populations and analysed CD4 and CD8 expression on each subset. We found that 83 ± 5·3% of CD69− CD27− CD3lo thymocytes were DP thymocytes. The percentage of cells that were DP declined to 45 ± 6·5% of CD69+ CD27− cells and 23 ± 5·3% of CD69+ CD27+ cells. This progressive decline in the percentage of thymocytes that were DP was associated with a concomitant increase in the percentage of cells that were SP CD8+. These data suggest that CD3lo thymocytes mature from the DP stage to a TSP CD8+ stage before increasing surface expression of CD3.
Figure 1.

Surface expression of CD4 decreases as CD3lo thymocytes progress through positive selection. CD69 and CD27 expression were analysed on TCR‐γδ − CD3lo thymocytes and the CD69− CD27−, CD69+ CD27−, CD69+ CD27+ populations were analysed for CD4 and CD8 expression. Data shown represent one thymus out of 11 analysed.
Based on this observation, we proposed that a subpopulation of CD3lo thymocytes could be detected within the SP CD8+ population. We analysed CD3 and CD7 expression on DP, SP CD4+ and SP CD8+ thymocytes (Fig. 2a). DP thymocytes could be divided into CD3−, CD3lo and CD3hi populations. The SP CD4+ thymocytes consisted of CD3− CD7hi, CD3hi CD7lo and CD3hi CD7hi subsets. The CD3− CD7hi subset corresponds to the previously described immature single‐positive developmental stage.35 SP CD8+ thymocytes were either CD3lo CD7lo or CD3hi CD7hi. The presence of a CD3lo SP CD8+ population supports a model that includes the existence of a TSP CD8+ developmental stage.
Figure 2.
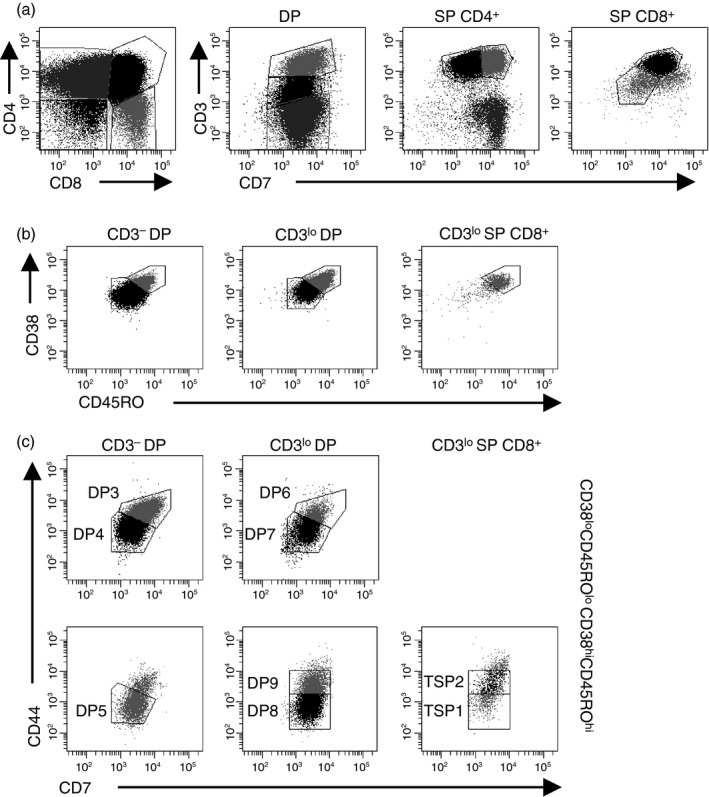
Defining subpopulations of CD3lo thymocytes. (a) TCR‐γδ − thymocytes were analysed for CD4 and CD8 expression and then double‐positive (DP) and single‐positive (SP) thymocytes were analysed for CD3 and CD7 expression. (b) CD3− DP, CD3lo DP, and CD3lo SP CD8+ thymocytes were analysed for CD38 and CD45RO expression. (c) Each cell population identified in (b) was analysed for CD44 and CD7 expression. Data shown represent one thymus out of 11 analysed.
To further characterize the TSP CD8+ population and define its location in the developmental pathway, we analysed CD38 and CD45RO expression among CD3lo DP and TSP CD8+ thymocytes (Fig. 2b). For comparison, we also analysed CD38 and CD45RO expression among CD3− DP thymocytes, which we previously used to define the CD3− DP developmental stages.36 Among CD3− DP thymocytes, 27 ± 4·6% of cells were CD38hi CD45ROhi and 67 ± 4·5 of CD3lo DP thymocytes were CD38hi CD45ROhi. Nearly all TSP CD8+ thymocytes were CD38hi CD45ROhi. These observations extend our previous findings that thymocytes progress from CD38lo CD45ROlo to CD38hi CD45ROhi as they mature through the CD3− developmental stages36 and continue to up‐regulate these markers as the cells advance through the CD3lo stages.
To further characterize subsets of CD3lo thymocytes, we analysed CD44 and CD7 expression (Fig. 2c). We previously used CD38, CD45RO, CD44 and CD7 expression to define the DP1 through DP5 subsets of CD3− DP thymocytes36; the DP3, DP4 and DP5 populations are shown in Fig. 2(c). Subsets of CD3lo DP thymocytes were identified with similar levels of CD38, CD45RO, CD44 and CD7 expression as DP3, DP4 and DP5, and so we called these cells DP6, DP7 and DP8. In addition, a population of CD3lo CD38hi CD45ROhi DP thymocytes with similar CD7 levels as DP8 was identified, but these cells had higher levels of CD44, so we called these cells DP9. Two populations of TSP CD8+ thymocytes could be detected with similar levels of CD44 and CD7 as DP8 and DP9 thymocytes; we called these populations TSP1 and TSP2.
Our data suggest that CD44 expression declines as thymocytes progress from the CD3− to CD3lo stages, but then increases as cells continue to mature. To test this hypothesis, we compared CD44 and CD3 expression and found the lowest CD44 expression among CD3lo cells (Supplementary material, Fig. S1).
Positive selection is initiated before the down‐regulation of CD4
To place the DP8, DP9, TSP1 and TSP2 populations in developmental sequence, we analysed CD69 and CD27 expression on each subset of CD3lo thymocytes (Fig. 3a). At least 80% of DP6, DP7 and DP8 thymocytes lacked CD69 or CD27 expression, indicating that few of these cells had received signals leading to positive selection. In contrast, 43 ± 4·9% of DP9 thymocytes were CD69+ CD27− and 6·8 ± 1·2% of DP9 thymocytes were CD69+ CD27+. The percentage of thymocytes that expressed CD69 and CD27 trended higher in TSP1 thymocytes than in DP9 thymocytes, but the difference did not reach statistical significance. More TSP2 thymocytes expressed CD69 and CD27 than DP9 thymocytes (P < 0·001) and TSP1 thymocytes (P < 0·05). These data indicate that more TSP thymocytes had received positive selection signals than DP9 thymocytes.
Figure 3.
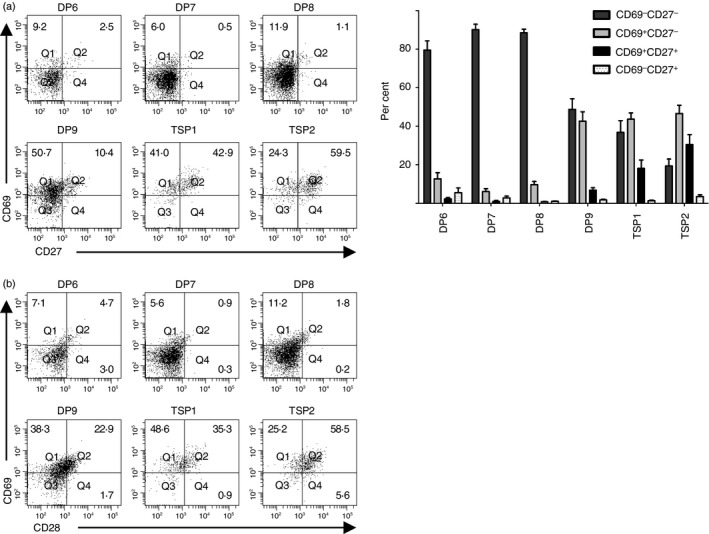
Positive selection is initiated before entry into the transitional single positive (TSP) CD8+ developmental stage. (a) CD69 and CD27 expression were analysed on the CD3lo double‐positive (DP) and TSP CD8+ populations defined in Fig. 2. The bar graph shows the percentages (mean ± SE) of cells in each population that were CD69− CD27−, CD69+ CD27−, CD69+ CD27+ and CD69− CD27+ (n = 11). (b) CD3lo thymocyte populations were analysed for CD69 and CD28 expression.
To further support this model, we analysed CD28 expression on each CD3lo thymocyte population (Fig. 3b). Only 47 ± 5·8% of CD69+ DP9 and 41 ± 5·4% of CD69+ TSP1 thymocytes expressed CD28, but 65 ± 3·7% of CD69+ TSP2 thymocytes expressed CD28 (P < 0·05 for TSP2 compared with DP9 or TSP1).
In conclusion, these data suggest that positive selection is initiated during the DP developmental stages and then CD4 levels decline. Further, we propose that DP8 thymocytes can differentiate into either DP9 or TSP1 cells, as shown in the model in Fig. 9. DP9 and TSP1 thymocytes then differentiate into TSP2 cells, the most mature population of CD3lo thymocytes.
Figure 9.
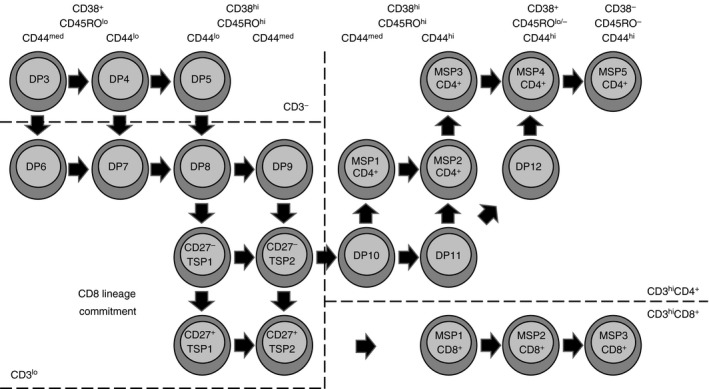
A model of human T‐cell development through the CD3+ stages.
Defining subsets of CD3hi thymocytes
As thymocytes progress through T‐cell development, they transition from being CD3lo to CD3hi; CD3hi thymocytes are included within the DP, SP CD4+ and SP CD8+ populations. As shown in Fig. 2(a), CD3hi DP thymocytes were primarily CD7lo, CD3hi SP CD8+ thymocytes were CD7hi, and CD3hi SP CD4+ thymocytes could be divided into CD7lo and CD7hi. For each population of CD7lo and CD7hi thymocytes, we analysed CD38 and CD45RO expression (Fig. 4a). In each case, a population of CD38hi CD45ROhi cells was detected, as well as CD38lo CD45ROlo cells and, for the SP populations, CD38− CD45RO– cells. Combined with our previous observations, these data suggest that CD38 and CD45RO expression increases as thymocytes progress from the CD3− to the CD3hi stages, but decreases as cells complete maturation, as previously reported for CD45RO.37 Indeed, contour plots of total thymocytes analysed for CD38 versus CD3 expression and CD45RO versus CD3 expression showed similar patterns (see Supplementary material, Fig. S1); CD38 and CD45RO expression was highest among thymocytes with intermediate levels of CD3 and lowest among CD3− and CD3hi thymocytes.
Figure 4.
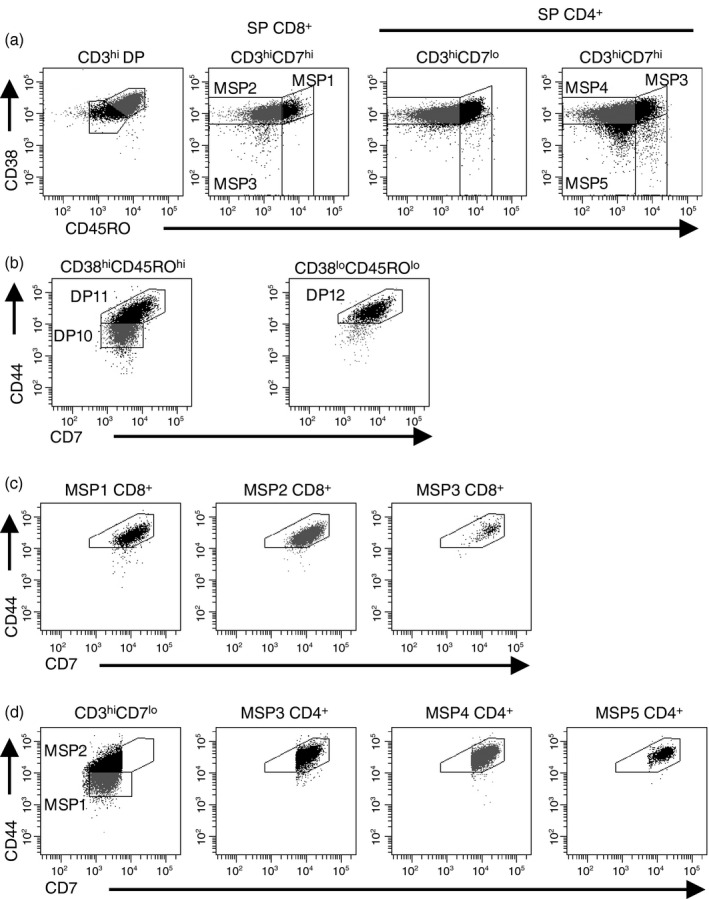
Defining subpopulations of CD3hi thymocytes. (a) TCR‐γδ + thymocytes were electronically eliminated from analysis. Then, CD3hi double‐positive (DP), CD3hi CD7hi single‐positive (SP) CD8+, CD3hi CD7lo SP CD4+, and CD3hi CD7hi SP CD4+ thymocytes were analysed for CD38 and CD45RO expression. (b) CD38hi CD45RO hi and CD38lo CD45RO lo DP thymocytes were analysed for CD44 and CD7 expression. (c) MSP1 CD8+, MSP2 CD8+, and MSP3 CD8+ thymocytes were analysed for CD44 and CD7 expression. (d) Subpopulations of MSP CD4+ thymocytes were analysed for CD44 and CD7 expression. Data shown represent one thymus out of 11 analysed.
We showed earlier that thymocytes increase expression of CD44 as they complete their maturation in the thymus (see Supplementary material, Fig. S1), so we analysed CD44 and CD7 expression on each subset of CD3hi thymocytes. Among CD3hi DP thymocyte subsets (Fig. 4b), the less mature population was CD38hi CD45ROhi. This population could be divided into two subpopulations. Cells with lower levels of CD7 and CD44 were called DP10 and cells with higher expression of these markers were called DP11. Among CD38lo CD45ROlo CD3hi DP thymocytes, one population of cells was detected and this population had similar CD7 and CD44 expression as DP11, so we called these cells DP12.
Among CD3hi SP CD8+ thymocytes, CD38hi CD45ROhi, CD38lo CD45ROlo and CD38− CD45RO– cells could be identified. Because CD38 and CD45RO expression decreases as CD3hi thymocytes mature (see Supplementary material, Fig. S1), we called these populations mature single positive 1 (MSP1) CD8+, MSP2 CD8+ and MSP3+ CD8+ thymocytes. CD44 and CD7 levels were comparable across these three populations (Fig. 4c).
For CD3hi SP CD4+ thymocytes, defining the populations is more complex because there are CD7lo and CD7hi subsets (Fig. 2a). CD3hi CD7lo thymocytes could be divided according to their expression of CD44, and we called these cells MSP1 CD4+ and MSP2 CD4+ thymocytes (Fig. 4d). Among MSP1 CD4+ thymocytes, 66 ± 6·7% of the cells were CD38hi CD45ROhi, but only 46 ± 6·2% of the MSP2 CD4+ population were CD38hi CD45ROhi (P < 0·001), supporting the hypothesis that the MSP1 CD4+ developmental stage precedes the MSP2 CD4+ stage. CD44 and CD7 expression among the CD7hi subsets was similar, so we named these populations according to their CD38 and CD45RO expression, as shown in Fig. 4(a).
Commitment to the CD8+ T‐cell lineage
As further evidence of the developmental sequence of the MSP1 CD8+, MSP2 CD8+ and MSP3 CD8+ populations, we analysed CD69, CD27 and CD1a expression on each population (Fig. 5). Nearly all cells in these subsets expressed CD69, CD27, or both markers, but the percentage of cells that were CD69− CD27+ increased as thymocytes progressed through the MSP1, MSP2 and MSP3 stages (Fig. 5a). In addition, CD1a expression declined as thymocytes matured through the MSP CD8+ subsets (Fig. 5b); decreased CD1a expression is a marker of thymocyte maturation.38 These data suggest that CD3hi CD8+ thymocytes emerge from a subset of TSP thymocytes and progress from the MSP1 CD8+ developmental stage through the MSP2 CD8+ and MSP3 CD8+ stages, as shown in in Fig. 9. Alternatively, TSP CD8+ thymocytes could re‐express CD4, become DP thymocytes, and then differentiate into SP CD8+ thymocytes.
Figure 5.
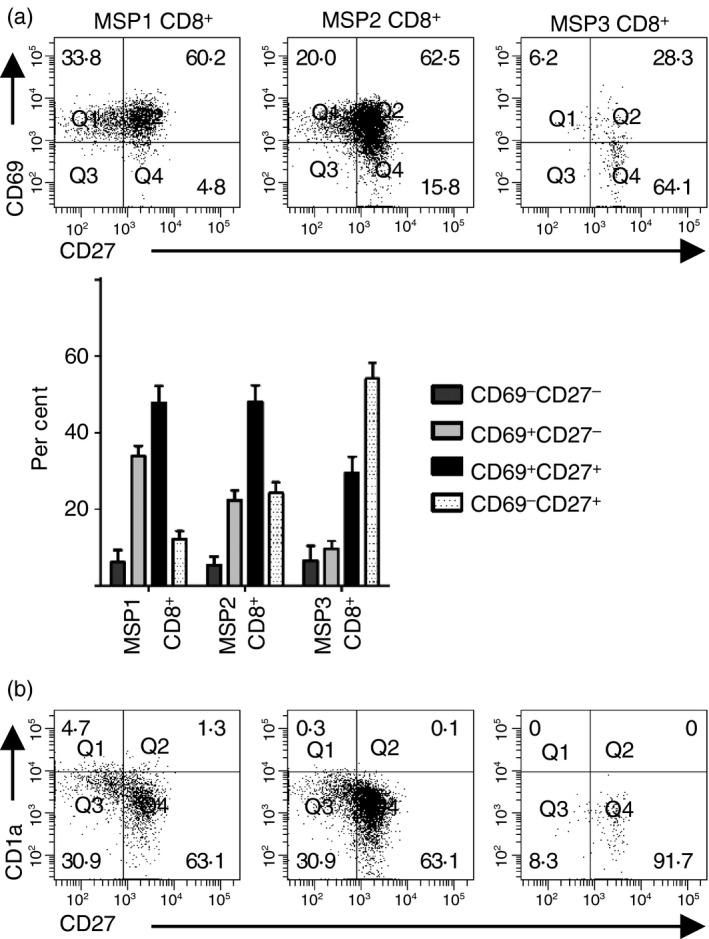
MSP1, MSP2 and MSP3 CD8+ populations represent a developmental sequence. (a) MSP1 CD8+, MSP2 CD8+ and MSP3 CD8+ thymocytes were gated on the CD3hi CD7hi population as shown in Fig. 2 and analysed for CD69 and CD27 expression. The percentages (mean ± SE) of each mature single‐positive (MSP) CD8+ subset that were CD69− CD27−, CD69+ CD27−, CD69+ CD27+ and CD69− CD27+ thymocytes are shown (n = 11). (b) Each subset of MSP CD8+ thymocytes was analysed for CD1a and CD27 expression.
Commitment to the CD4+ T‐cell lineage
Next, we sought to determine the developmental sequence of CD3hi DP and MSP CD4+ subsets. As previously discussed, most CD3hi DP thymocytes were CD7lo whereas some MSP CD4+ thymocytes were CD7lo and others were CD7hi. Fewer CD3hi CD7lo SP CD4+ thymocytes (51 ± 6·1%) were CD38hi CD45ROhi than CD3hi DP thymocytes (78 ± 3·4%) (P < 0·001) (Fig. 4a), suggesting that the DP10 developmental stage precedes the CD3hi CD7lo SP CD4+ stage.
To test this model, we analysed CD69, CD27 and CD1a expression on DP10, MSP1 CD4+ and MSP2 CD4+ thymocytes (Fig. 6a,c). Although nearly all cells in these subsets expressed either CD69 or CD27 (Fig. 6a), 10 ± 1·4% of DP10 thymocytes, 18 ± 2·7% of MSP1 CD4+ thymocytes, and 42 ± 3·8% of MSP2 CD4+ thymocytes expressed CD27. These data suggest that developing thymocytes could proceed from the DP10 developmental stage, through the MSP1 CD4+ stage, and into the MSP2 CD4+ developmental stage, as shown in Fig. 9. Consistent with this conclusion, CD1a expression was highest among DP10 thymocytes and lower in the MSP1 CD4+ and MSP2 CD4+ subsets.
Figure 6.
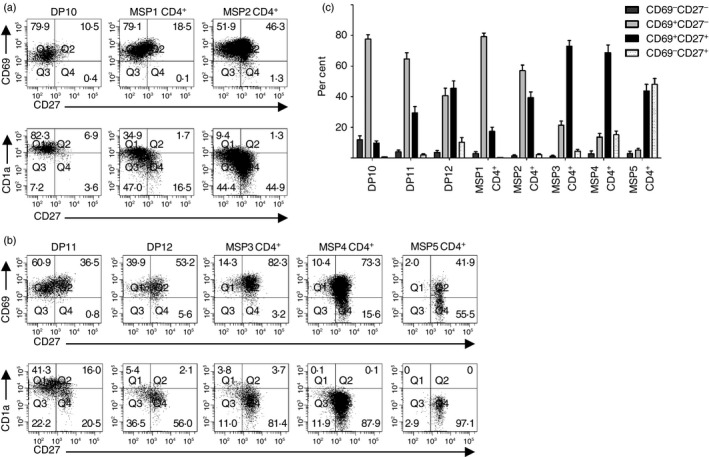
CD3hi double‐positive (DP) thymocytes represent a transition from transitional single‐positive (TSP) CD8+ cells to mature single‐positive (MSP) CD4+ cells. (a) CD69, CD27 and CD1a expression were analysed on the CD3hi CD7lo subsets of DP and SP CD4+ populations. (b) CD69, CD27 and CD1a expression were analysed on the CD3hi CD7hi subsets of DP and SP CD4+ populations. (c) The percentages (mean ± SE) of cells in each subpopulation that were CD69− CD27−, CD69+ CD27−, CD69+ CD27+ and CD69− CD27+ thymocytes are shown (n = 11).
Next, we performed similar analysis on CD3hi CD7hi DP and MSP CD4+ thymocytes. CD3hi CD7hi DP thymocytes include the DP11 and DP12 subsets and CD3hi CD7hi SP CD4+ thymocytes include the MSP3, MSP4 and MSP5 subsets (Fig. 4). Only 31 ± 4·1% of DP11 cells were CD27+, while 56 ± 5·1% of DP12 cells and > 75% of each of the CD3hi CD7hi SP CD4+ populations were CD27+ (P < 0·001 for DP11 or DP12 compared with each of the CD3hi CD7hi SP CD4+ populations) (Fig. 6b,c). Further, CD1a expression was high on DP11 cells and decreased as cells matured through the MSP CD4+ stages. In agreement with MSP5 CD4+ being the most mature population of CD4+ thymocytes, all MSP5 CD4+ cells had down‐regulated CD1a expression and 48 ± 3·8% of cells were CD69−.
In summary, we propose that some TSP2 thymocytes can re‐express CD4 to become DP10 thymocytes, as shown in Fig. 9. DP10 thymocytes can then differentiate into MSP1 CD4+ or DP11 thymocytes. Further, these data suggest that down‐regulation of CD8, CD38 and CD45RO and up‐regulation of CD44 are asynchronous processes that occur between the TSP CD8+ developmental stage and the MSP CD4+ stages. These data also suggest that MSP5 CD4+ thymocytes represent the final developmental stage before cells exit the thymus.
CD28 expression more closely associates with positive selection than lineage commitment
To determine whether CD28 expression more closely tracked with positive selection or lineage commitment, we compared CD28 and CD27 expression in each population of CD3lo and CD3hi thymocytes (see Supplementary material, Fig. S2); CD27 is proposed to be a marker of lineage commitment.39 Among DP9, TSP1 and TSP2 thymocytes, CD27 and CD28 expression correlated tightly (see Supplementary material, Fig. S2a), suggesting that thymocytes undergoing positive selection at the TSP stage become committed to their lineage. However, some TSP CD8+ thymocytes had not yet expressed CD27 or CD28, suggesting that these cells had not undergone lineage commitment and could re‐express CD4. Among DP10, MSP1 CD4+ and MSP2 CD4+ thymocytes, many cells were CD28+ CD27− (see Supplementary material, Fig. S2b). Because all of these expressed CD69 (Fig. 6a), we conclude that positive selection first triggers CD69 up‐regulation and this is followed closely by CD28 expression. CD27 expression is associated with lineage commitment, which is a distinct step from positive selection.
Differences in the protein levels of Ikaros, Helios and Aiolos across CD3+ thymocyte subsets
Ikaros, Helios and Aiolos protein levels increase when TCR‐β is first expressed.36 For Ikaros and Helios, the increase in expression was transient whereas the increase in Aiolos was sustained throughout the CD3– DP populations. Consistent with this pattern, Ikaros and Helios protein levels were 1·6‐fold (P < 0·001) and 2·0‐fold (P < 0·001) higher, respectively, in DP6 thymocytes than in DP8 thymocytes, whereas Aiolos levels were comparable among the DP6, DP7 and DP8 subsets (Fig. 7).
Figure 7.
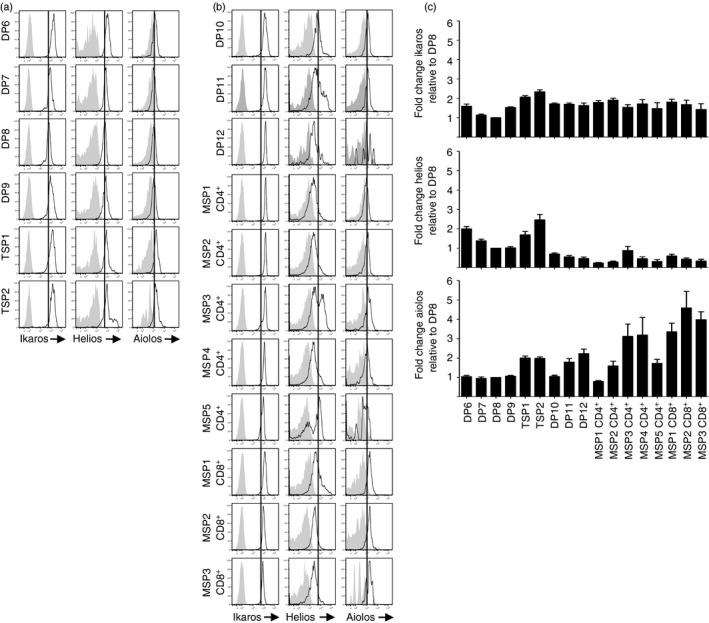
Ikaros, Helios and Aiolos expression patterns differ in developing CD3+ thymocytes. CD3lo (a) and CD3hi (b) thymocyte populations were intracellularly stained with anti‐Ikaros, anti‐Helios, anti‐Aiolos (dark lines), or an appropriate isotype control (shaded histogram). (c) For each population in (a) and (b), the geometric mean fluorescence intensity (GMFI) of anti‐Ikaros, anti‐Helios or anti‐Aiolos was normalized to the GMFI of the isotype control. Mean ± SE fold change relative to DP8 is shown for at least five independent experiments.
As thymocytes progressed from the DP8 developmental stage to the TSP2 stage, Ikaros, Helios and Aiolos protein levels increased by 2·3‐fold, 2·5‐fold and 2·0‐fold (P < 0·001 for each protein, comparing DP8 and TSP2 thymocytes). Then, levels of all three proteins were lower in DP10 and MSP1 CD4+ thymocytes than TSP2 cells. The most dramatic difference between the TSP2 and MSP1 CD4+ populations occurred with Helios, whose protein levels were 11‐fold lower in MSP1 CD4+ cells than TSP2 cells. Helios expression continued to decline as CD4+ and CD8+ thymocytes matured, except for subpopulations of MSP3 and MSP5 CD4+ thymocytes.
Among MSP CD4+ thymocytes, Aiolos protein levels were 2·5‐fold lower in MSP1 CD4+ thymocytes than TSP2 cells, increased transiently during the MSP3 and MSP4 CD4+ stages, and decreased again at the MSP5 CD4+ stage. By contrast, Aiolos protein levels were higher in the MSP1 CD8+ and MSP2 CD8+ subsets than TSP2 thymocytes (P < 0·05). In addition, Aiolos levels were 2·3‐fold higher in the mature MSP3 CD8+ cells than in the mature MSP5 CD4+ cells (P < 0·01). Unlike Helios and Aiolos, Ikaros protein levels remained steady after the transient increase seen in the TSP subsets.
These data indicate that Ikaros, Helios and Aiolos undergo a transient increase in protein levels during the TSP developmental stage. However, expression of Helios and Aiolos in subsequent populations varies while Ikaros expression remains steady, Helios expression declines, except for a subpopulation of MSP CD4+ thymocytes, and Aiolos expression increases, particularly among CD8+ T cells.
Helios expression in DP and MSP CD4+ thymocytes marks regulatory T cells
Because Helios is highly expressed in regulatory T cells,40, 41, 42 we examined FoxP3, Helios and CD25 expression in each subpopulation of thymocytes containing positively selected cells (Fig. 8). FoxP3+ Helios+ thymocytes could be detected as early as the DP10 developmental stage and DP10 thymocytes expressing FoxP3 or Helios also expressed CD25. In Fig. 7, we showed that the population of CD3+ thymocytes with the highest Helios expression was MSP CD4+ thymocytes. Nearly all Helioshi MSP CD4+ thymocytes expressed FoxP3 and CD25 (Fig. 8). These data suggest that differentiation into the regulatory T‐cell lineage coincides with commitment into the CD4+ T‐cell lineage.
Figure 8.
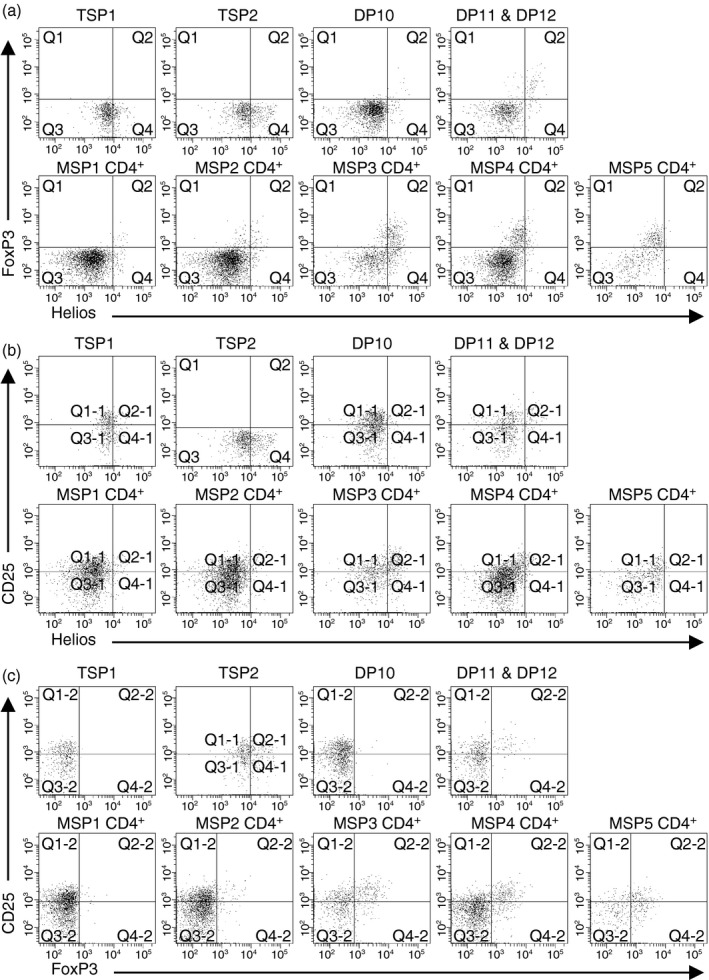
Helios expression among CD3hi double‐positive (DP) and single‐positive (SP) CD4+ thymocytes correlates with markers of regulatory T cells. The indicated populations of thymocytes were analysed for expression of Helios and FoxP3 (a), Helios and CD25 (b), and FoxP3 and CD25 (c). Data shown represent one thymus out of three analysed.
Discussion
The data presented here represent the highest resolution image to date of human T‐cell development beginning with detectable surface CD3 expression. The multi‐parameter flow cytometry data revealed 12 subpopulations of DP thymocytes, five subpopulations of SP CD8+ thymocytes, and five subpopulations of SP CD4+ thymocytes. Each of these subpopulations can be further divided using additional markers. Our analysis focused on the stages of T‐cell development surrounding positive selection and lineage commitment and resulted in the model shown in Fig. 9.
Based on CD7, CD45RO, CD38 and CD44 expression, we found three pairs of DP subsets in which one half of each pair was CD3– and the other subset was CD3lo. The CD3– fractions (DP3, DP4 and DP5) represent the final developmental stages that lack surface CD3 expression. We previously showed that these populations express TCRβ and DP3 thymocytes are the most highly proliferative population of CD3– thymocytes.38 Proliferation slows as thymocytes progress through the DP4 and DP5 thymocytes, suggesting that these populations are undergoing genomic rearrangement at the locus encoding TCR‐α. When TCR‐α is expressed, CD3 becomes detectable at the cell surface. Thymocytes expressing levels of CD7 and CD44 similar to those of the DP3, DP4 and DP5 developmental stages can express surface CD3, indicating that CD7 and CD44 down‐regulation is independent of TCR‐α expression. Hence, DP3 thymocytes can differentiate into DP4 or DP6 thymocytes. Likewise, DP4 thymocytes can differentiate into DP5 thymocytes unless they express surface CD3, in which case they become DP7 thymocytes.
A small percentage of DP6, DP7 and DP8 thymocytes express CD69 (Fig. 3a), suggesting that thymocytes have the potential to become positively selected as soon as surface CD3 is expressed. After positive selection, thymocytes down‐regulate CD4 expression to become TSP CD8+ thymocytes. We propose that the TSP CD8+ population is analogous to the TSP CD4+ thymocytes observed in mice.12, 13, 14, 15 During murine T‐cell development, CD8 expression decreases after positive selection, resulting in the TSP CD4+ population.18, 19 In humans, maturation into the TSP CD8+ population is associated with a transient increase in Ikaros, Helios and Aiolos expression (Fig. 7). Studying all three proteins is important because Ikaros family members can homodimerize or heterodimerize with each other and dimerization is required for transcriptional activity30, 31, 32, 43, 44 Because all three proteins increase their expression two‐ to three‐fold, it is likely that the composition of the dimers does not change at the TSP stage, but the number of dimers increases.
Despite the likelihood that dimer composition does not change, data from murine models of T‐cell development indicate that Ikaros family members are important at the TSP stage.45 Specifically, expression of a dominant negative Ikaros isoform results in accumulation of CD4+ CD8lo TSP cells.33 One function of Ikaros at the TSP stage may be to inhibit transcription of terminal deoxytransferase and pre‐Tα.46, 47 However, it was suggested that higher levels of Ikaros resulted in the recruitment of an elongation‐competent NuRD/P‐TEFb complex to gene targets, rather than the repressive NuRD complex.48 Hence, increased Ikaros family expression at the TSP stage may be required for activation of genes for further maturation. In addition, Ikaros family members may affect the signal strength necessary for lineage commitment, as Ikaros and Aiolos can regulate the TCR signalling threshold in murine thymocytes and splenocytes.26, 49, 50, 51, 52, 53 Ikaros family members can also regulate CD4 and CD8 expression,22, 23, 54 a necessary step for lineage commitment.
The role of Ikaros in regulating signal strength and CD4/CD8 expression in the TSP stage implies that the TSP developmental stage might be the site of lineage commitment. TSP CD8+ thymocytes express CD69 and many TSP CD8+ thymocytes express CD27. Vanhecke et al. previously showed that CD27+ SP CD4+ and SP CD8+ thymocytes are committed to their respective lineages while CD27– SP CD4+ cells could still differentiate into SP CD8+ cells.39 This observation suggests that CD27 is a marker of thymocytes committed to the CD4+ or CD8+ lineage. Even though most TSP CD8+ thymocytes expressed CD27, most DP10 thymocytes lacked CD27 expression. Although this observation might suggest that DP10 thymocytes are less mature than TSP thymocytes, the fact that TSP thymocytes have lower surface CD3 levels places the TSP developmental stage earlier than the DP10 stage. Hence, the TSP CD8+ developmental stage most likely represents the decision point between the CD4+ and CD8+ lineages. CD27+ TSP CD8+ thymocytes likely retain their CD8 expression, up‐regulate CD3 and mature into MSP1 CD8+ thymocytes, whereas CD27– TSP CD8+ thymocytes probably re‐express CD4, becoming DP10 thymocytes (Fig. 9).
Because DP10 and MSP1 CD4+ thymocytes express similar levels of CD38, CD45RO, CD7, CD44, CD3, CD69 and CD27 (Figs 4 and 6), it is likely that DP10 thymocytes can differentiate directly into MSP1 CD4+ thymocytes. Alternatively, DP10 thymocytes could up‐regulate CD44, becoming DP11 thymocytes. DP11 thymocytes could differentiate into MSP2 CD4+ thymocytes or DP12 thymocytes, depending on the sequence in which the cells down‐regulate CD8, CD38 and CD45RO, and up‐regulate CD27. DP12 thymocytes are most similar to MSP4 CD4+ thymocytes, suggesting that DP12 thymocytes can directly mature into MSP4 CD4+ cells.
As thymocytes continue to mature into naive CD4+ and CD8+ T cells, their expression of Ikaros, Helios and Aiolos changes in manners that would be predicted to influence the composition of the dimers (Fig. 7). Specifically, Ikaros expression remains constant throughout the MSP subpopulations. Aiolos is more highly expressed in MSP CD8+ thymocytes than most MSP CD4+ thymocyte subsets. Helios expression declines as thymocytes mature, except for the population of cells that also express FoxP3 and CD25 and are likely destined to become regulatory T cells (Fig. 8).55, 56 The function of Ikaros family members at these stages is unclear.
In summary, we used multi‐parameter flow cytometry to define the stages of human T‐cell development in which positive selection and lineage commitment are most likely to occur. We observed a transient increase in Ikaros, Helios and Aiolos expression when thymocytes undergo positive selection, and Aiolos is more highly expressed in subsets of mature SP CD4+ and CD8+ thymocytes than pre‐selection thymocytes.
Disclosures
The authors have no conflicts of interest to disclose.
Supporting information
Figure S1. CD44 expression is highest and CD38 and CD45RO are lowest at the CD3lo developmental stage.
Figure S2. CD28 expression correlates more closely with positive selection than lineage commitment.
Acknowledgements
The authors would like to thank Dr Robert H. Ardinger, Jr, Dr James E. O'Brien, Jr, Jennifer Marshall and Diana Connelly for their assistance in obtaining the human thymus samples. In addition, the authors would like to thank Drs Steve Benedict, Marci Chan, Mary Markiewicz, and members of their laboratories for helpful discussions.
This work was supported, in part, by the American Cancer Society Research Scholar Grant 08‐182‐LIB and a pilot grant provided by the National Cancer Institute Cancer Center Support Grant P30 CA168524. We also acknowledge the Flow Cytometry Core Laboratory, which is sponsored, in part, by the NIH/NIGMS COBRE grant P30 GM103326. J.L.M. was supported by a Madison and Lila Self Graduate Fellowship.
References
- 1. Dik WA, Pike‐Overzet K, Weerkamp F, de Ridder D, de Haas EF, Baert MR et al New insights on human T cell development by quantitative T cell receptor gene rearrangement studies and gene expression profiling. J Exp Med 2005; 201:1715–23. [DOI] [PMC free article] [PubMed] [Google Scholar]
- 2. Joachims ML, Chain JL, Hooker SW, Knott‐Craig CJ, Thompson LF. Human αβ and γδ thymocyte development: TCR gene rearrangements, intracellular TCR β expression, and γδ developmental potential–differences between men and mice. J Immunol 2006; 176:1543–52. [DOI] [PMC free article] [PubMed] [Google Scholar]
- 3. Carrasco YR, Trigueros C, Ramiro AR, de Yebenes VG, Toribio ML. Beta‐selection is associated with the onset of CD8β chain expression on CD4+ CD8αα + pre‐T cells during human intrathymic development. Blood 1999; 94:3491–8. [PubMed] [Google Scholar]
- 4. Taghon T, Van de Walle I, De Smet G, De Smedt M, Leclercq G, Vandekerckhove B et al Notch signaling is required for proliferation but not for differentiation at a well‐defined β‐selection checkpoint during human T‐cell development. Blood 2009; 113:3254–63. [DOI] [PubMed] [Google Scholar]
- 5. Ramiro AR, Trigueros C, Marquez C, San Millan JL, Toribio ML. Regulation of pre‐T cell receptor (pT α‐TCR‐β) gene expression during human thymic development. J Exp Med 1996; 184:519–30. [DOI] [PMC free article] [PubMed] [Google Scholar]
- 6. Blom B, Verschuren MC, Heemskerk MH, Bakker AQ, van Gastel‐Mol EJ, Wolvers‐Tettero IL et al TCR gene rearrangements and expression of the pre‐T cell receptor complex during human T‐cell differentiation. Blood 1999; 93:3033–43. [PubMed] [Google Scholar]
- 7. Yamashita I, Nagata T, Tada T, Nakayama T. CD69 cell surface expression identifies developing thymocytes which audition for T cell antigen receptor‐mediated positive selection. Int Immunol 1993; 5:1139–50. [DOI] [PubMed] [Google Scholar]
- 8. Anderson G, Owen JJ, Moore NC, Jenkinson EJ. Characteristics of an in vitro system of thymocyte positive selection. J Immunol 1994; 153:1915–20. [PubMed] [Google Scholar]
- 9. Swat W, Dessing M, von Boehmer H, Kisielow P. CD69 expression during selection and maturation of CD4+ 8+ thymocytes. Eur J Immunol 1993; 23:739–46. [DOI] [PubMed] [Google Scholar]
- 10. Kearse KP, Takahama Y, Punt JA, Sharrow SO, Singer A. Early molecular events induced by T cell receptor (TCR) signaling in immature CD4+ CD8+ thymocytes: increased synthesis of TCR‐α protein is an early response to TCR signaling that compensates for TCR‐α instability, improves TCR assembly, and parallels other indicators of positive selection. J Exp Med 1995; 181:193–202. [DOI] [PMC free article] [PubMed] [Google Scholar]
- 11. Wilkinson RW, Anderson G, Owen JJ, Jenkinson EJ. Positive selection of thymocytes involves sustained interactions with the thymic microenvironment. J Immunol 1995; 155:5234–40. [PubMed] [Google Scholar]
- 12. Dalheimer SL, Zeng L, Draves KE, Hassaballa A, Jiwa NN, Parrish TD et al Gads‐deficient thymocytes are blocked at the transitional single positive CD4+ stage. Eur J Immunol 2009; 39:1395–404. [DOI] [PMC free article] [PubMed] [Google Scholar]
- 13. Lundberg K, Heath W, Kontgen F, Carbone FR, Shortman K. Intermediate steps in positive selection: differentiation of CD4+ 8int TCRint thymocytes into CD4–8+ TCRhi thymocytes. J Exp Med 1995; 181:1643–51. [DOI] [PMC free article] [PubMed] [Google Scholar]
- 14. Suzuki H, Punt JA, Granger LG, Singer A. Asymmetric signaling requirements for thymocyte commitment to the CD4+ versus CD8+ T cell lineages: a new perspective on thymic commitment and selection. Immunity 1995; 2:413–25. [DOI] [PubMed] [Google Scholar]
- 15. Lucas B, Germain RN. Unexpectedly complex regulation of CD4/CD8 coreceptor expression supports a revised model for CD4+ CD8+ thymocyte differentiation. Immunity 1996; 5:461–77. [DOI] [PubMed] [Google Scholar]
- 16. Brugnera E, Bhandoola A, Cibotti R, Yu Q, Guinter TI, Yamashita Y et al Coreceptor reversal in the thymus: signaled CD4+ 8+ thymocytes initially terminate CD8 transcription even when differentiating into CD8+ T cells. Immunity 2000; 13:59–71. [DOI] [PubMed] [Google Scholar]
- 17. Sarafova SD, Erman B, Yu Q, Van Laethem F, Guinter T, Sharrow S et al Modulation of coreceptor transcription during positive selection dictates lineage fate independently of TCR/coreceptor specificity. Immunity 2005; 23:75–87. [DOI] [PubMed] [Google Scholar]
- 18. Bosselut R, Guinter TI, Sharrow SO, Singer A. Unraveling a revealing paradox: why major histocompatibility complex I‐signaled thymocytes “paradoxically” appear as CD4+ 8lo transitional cells during positive selection of CD8+ T cells. J Exp Med 2003; 197:1709–19. [DOI] [PMC free article] [PubMed] [Google Scholar]
- 19. Cibotti R, Bhandoola A, Guinter TI, Sharrow SO, Singer A. CD8 coreceptor extinction in signaled CD4+CD8+ thymocytes: coordinate roles for both transcriptional and posttranscriptional regulatory mechanisms in developing thymocytes. Mol Cell Biol 2000; 20:3852–9. [DOI] [PMC free article] [PubMed] [Google Scholar]
- 20. Yasutomo K, Doyle C, Miele L, Fuchs C, Germain RN. The duration of antigen receptor signalling determines CD4+ versus CD8+ T‐cell lineage fate. Nature 2000; 404:506–10. [DOI] [PubMed] [Google Scholar]
- 21. Adoro S, McCaughtry T, Erman B, Alag A, Van Laethem F, Park JH et al Coreceptor gene imprinting governs thymocyte lineage fate. EMBO J 2012; 31:366–77. [DOI] [PMC free article] [PubMed] [Google Scholar]
- 22. Harker N, Naito T, Cortes M, Hostert A, Hirschberg S, Tolaini M et al The CD8α gene locus is regulated by the Ikaros family of proteins. Mol Cell 2002; 10:1403–15. [DOI] [PubMed] [Google Scholar]
- 23. Naito T, Gomez‐Del Arco P, Williams CJ, Georgopoulos K. Antagonistic interactions between Ikaros and the chromatin remodeler Mi‐2β determine silencer activity and Cd4 gene expression. Immunity 2007; 27:723–34. [DOI] [PubMed] [Google Scholar]
- 24. Georgopoulos K, Bigby M, Wang JH, Molnar A, Wu P, Winandy S et al The Ikaros gene is required for the development of all lymphoid lineages. Cell 1994; 79:143–56. [DOI] [PubMed] [Google Scholar]
- 25. Gomez‐del Arco P, Maki K, Georgopoulos K. Phosphorylation controls Ikaros's ability to negatively regulate the G(1)‐S transition. Mol Cell Biol 2004; 24:2797–807. [DOI] [PMC free article] [PubMed] [Google Scholar]
- 26. Winandy S, Wu L, Wang JH, Georgopoulos K. Pre‐T cell receptor (TCR) and TCR‐controlled checkpoints in T cell differentiation are set by Ikaros. J Exp Med 1999; 190:1039–48. [DOI] [PMC free article] [PubMed] [Google Scholar]
- 27. Winandy S, Wu P, Georgopoulos K. A dominant mutation in the Ikaros gene leads to rapid development of leukemia and lymphoma. Cell 1995; 83:289–99. [DOI] [PubMed] [Google Scholar]
- 28. Schmitt C, Tonnelle C, Dalloul A, Chabannon C, Debre P, Rebollo A. Aiolos and Ikaros: regulators of lymphocyte development, homeostasis and lymphoproliferation. Apoptosis 2002; 7:277–84. [DOI] [PubMed] [Google Scholar]
- 29. Zhang Z, Swindle CS, Bates JT, Ko R, Cotta CV, Klug CA. Expression of a non‐DNA‐binding isoform of Helios induces T‐cell lymphoma in mice. Blood 2007; 109:2190–7. [DOI] [PMC free article] [PubMed] [Google Scholar]
- 30. Morgan B, Sun L, Avitahl N, Andrikopoulos K, Ikeda T, Gonzales E et al Aiolos, a lymphoid restricted transcription factor that interacts with Ikaros to regulate lymphocyte differentiation. EMBO J 1997; 16:2004–13. [DOI] [PMC free article] [PubMed] [Google Scholar]
- 31. Perdomo J, Holmes M, Chong B, Crossley M. Eos and pegasus, two members of the Ikaros family of proteins with distinct DNA binding activities. J Biol Chem 2000; 275:38347–54. [DOI] [PubMed] [Google Scholar]
- 32. Hahm K, Cobb BS, McCarty AS, Brown KE, Klug CA, Lee R et al Helios, a T cell‐restricted Ikaros family member that quantitatively associates with Ikaros at centromeric heterochromatin. Genes Dev 1998; 12:782–96. [DOI] [PMC free article] [PubMed] [Google Scholar]
- 33. Tinsley KW, Hong C, Luckey MA, Park JY, Kim GY, Yoon HW et al Ikaros is required to survive positive selection and to maintain clonal diversity during T‐cell development in the thymus. Blood 2013; 122:2358–68. [DOI] [PMC free article] [PubMed] [Google Scholar]
- 34. Xiong J, Parker BL, Dalheimer SL, Yankee TM. Interleukin‐7 supports survival of T‐cell receptor‐β‐expressing CD4– CD8– double‐negative thymocytes. Immunology 2013; 138:382–91. [DOI] [PMC free article] [PubMed] [Google Scholar]
- 35. Hori T, Cupp J, Wrighton N, Lee F, Spits H. Identification of a novel human thymocyte subset with a phenotype of CD3– CD4+ CD8α + β‐1. Possible progeny of the CD3– CD4– CD8– subset. J Immunol 1991; 146:4078–84. [PubMed] [Google Scholar]
- 36. Mitchell JL, Seng A, Yankee TM. Ikaros, Helios, and Aiolos protein levels increase in human thymocytes after β selection. Immunol Res 2016; 64:565–75. [DOI] [PMC free article] [PubMed] [Google Scholar]
- 37. Fujii Y, Okumura M, Inada K, Nakahara K, Matsuda H. CD45 isoform expression during T cell development in the thymus. Eur J Immunol 1992; 22:1843–50. [DOI] [PubMed] [Google Scholar]
- 38. Res P, Blom B, Hori T, Weijer K, Spits H. Downregulation of CD1 marks acquisition of functional maturation of human thymocytes and defines a control point in late stages of human T cell development. J Exp Med 1997; 185:141–51. [DOI] [PMC free article] [PubMed] [Google Scholar]
- 39. Vanhecke D, Verhasselt B, De Smedt M, Leclercq G, Plum J, Vandekerckhove B. Human thymocytes become lineage committed at an early postselection CD69+ stage, before the onset of functional maturation. J Immunol 1997; 159:5973–83. [PubMed] [Google Scholar]
- 40. Fontenot JD, Rasmussen JP, Williams LM, Dooley JL, Farr AG, Rudensky AY. Regulatory T cell lineage specification by the forkhead transcription factor foxp3. Immunity 2005; 22:329–41. [DOI] [PubMed] [Google Scholar]
- 41. Sugimoto N, Oida T, Hirota K, Nakamura K, Nomura T, Uchiyama T et al Foxp3‐dependent and ‐independent molecules specific for CD25+ CD4+ natural regulatory T cells revealed by DNA microarray analysis. Int Immunol 2006; 18:1197–209. [DOI] [PubMed] [Google Scholar]
- 42. Getnet D, Maris CH, Hipkiss EL, Grosso JF, Harris TJ, Yen HR et al Tumor recognition and self‐recognition induce distinct transcriptional profiles in antigen‐specific CD4 T cells. J Immunol 2009; 182:4675–85. [DOI] [PMC free article] [PubMed] [Google Scholar]
- 43. Sun L, Liu A, Georgopoulos K. Zinc finger‐mediated protein interactions modulate Ikaros activity, a molecular control of lymphocyte development. EMBO J 1996; 15:5358–69. [PMC free article] [PubMed] [Google Scholar]
- 44. Kelley CM, Ikeda T, Koipally J, Avitahl N, Wu L, Georgopoulos K et al Helios, a novel dimerization partner of Ikaros expressed in the earliest hematopoietic progenitors. Curr Biol 1998; 8:508–15. [DOI] [PubMed] [Google Scholar]
- 45. Urban JA, Winandy S. Ikaros null mice display defects in T cell selection and CD4 versus CD8 lineage decisions. J Immunol 2004; 173:4470–8. [DOI] [PubMed] [Google Scholar]
- 46. Trinh LA, Ferrini R, Cobb BS, Weinmann AS, Hahm K, Erns P et al Down‐regulation of TDT transcription in CD4+ CD8+ thymocytes by Ikaros proteins in direct competition with an Ets activator. Genes Dev 2001; 15:1817–32. [DOI] [PMC free article] [PubMed] [Google Scholar]
- 47. Bellavia D, Mecarozzi M, Campese AF, Grazioli P, Talora C, Frati L et al Notch3 and the Notch3‐upregulated RNA‐binding protein HuD regulate Ikaros alternative splicing. EMBO J 2007; 26:1670–80. [DOI] [PMC free article] [PubMed] [Google Scholar]
- 48. Bottardi S, Mavoungou L, Pak H, Daou S, Bourgoin V, Lakehal YA et al The IKAROS interaction with a complex including chromatin remodeling and transcription elongation activities is required for hematopoiesis. PLoS Genet 2014; 10:e1004827. [DOI] [PMC free article] [PubMed] [Google Scholar]
- 49. Avitahl N, Winandy S, Friedrich C, Jones B, Ge Y, Georgopoulos K. Ikaros sets thresholds for T cell activation and regulates chromosome propagation. Immunity 1999; 10:333–43. [DOI] [PubMed] [Google Scholar]
- 50. Rebollo A, Ayllon V, Fleischer A, Martinez CA, Zaballos A. The association of Aiolos transcription factor and Bcl‐xL is involved in the control of apoptosis. J Immunol 2001; 167:6366–73. [DOI] [PubMed] [Google Scholar]
- 51. Romero F, Martinez AC, Camonis J, Rebollo A. Aiolos transcription factor controls cell death in T cells by regulating Bcl‐2 expression and its cellular localization. EMBO J 1999; 18:3419–30. [DOI] [PMC free article] [PubMed] [Google Scholar]
- 52. Wang JH, Avitahl N, Cariappa A, Friedrich C, Ikeda T, Renold A et al Aiolos regulates B cell activation and maturation to effector state. Immunity 1998; 9:543–53. [DOI] [PubMed] [Google Scholar]
- 53. Zhuang Y, Li D, Fu J, Shi Q, Lu Y, Ju X. Overexpression of AIOLOS inhibits cell proliferation and suppresses apoptosis in Nalm‐6 cells. Oncol Rep 2014; 31:1183–90. [DOI] [PubMed] [Google Scholar]
- 54. Harker N, Garefalaki A, Menzel U, Ktistaki E, Naito T, Georgopoulos K et al Pre‐TCR signaling and CD8 gene bivalent chromatin resolution during thymocyte development. J Immunol 2011; 186:6368–77. [DOI] [PubMed] [Google Scholar]
- 55. Ross EM, Bourges D, Hogan TV, Gleeson PA, van Driel IR. Helios defines T cells being driven to tolerance in the periphery and thymus. Eur J Immunol 2014; 44:2048–58. [DOI] [PubMed] [Google Scholar]
- 56. Thornton AM, Korty PE, Tran DQ, Wohlfert EA, Murray PE, Belkaid Y et al Expression of Helios, an Ikaros transcription factor family member, differentiates thymic‐derived from peripherally induced Foxp3+ T regulatory cells. J Immunol 2010; 184:3433–41. [DOI] [PMC free article] [PubMed] [Google Scholar]
Associated Data
This section collects any data citations, data availability statements, or supplementary materials included in this article.
Supplementary Materials
Figure S1. CD44 expression is highest and CD38 and CD45RO are lowest at the CD3lo developmental stage.
Figure S2. CD28 expression correlates more closely with positive selection than lineage commitment.


